
In Vitro and In Vivo Anti-Arthritic Potential of Caralluma tuberculata N. E. Brown. and Its Chemical Characterization

 , , ,
, , ,  ,
,
Abstract
1. Introduction
2. Materials and Methods
2.1. Collection and Extraction of Plant
2.2. Phytochemical Analysis
2.3. HPLC Analysis of CTME
2.4. GC-MS Analysis of CTME
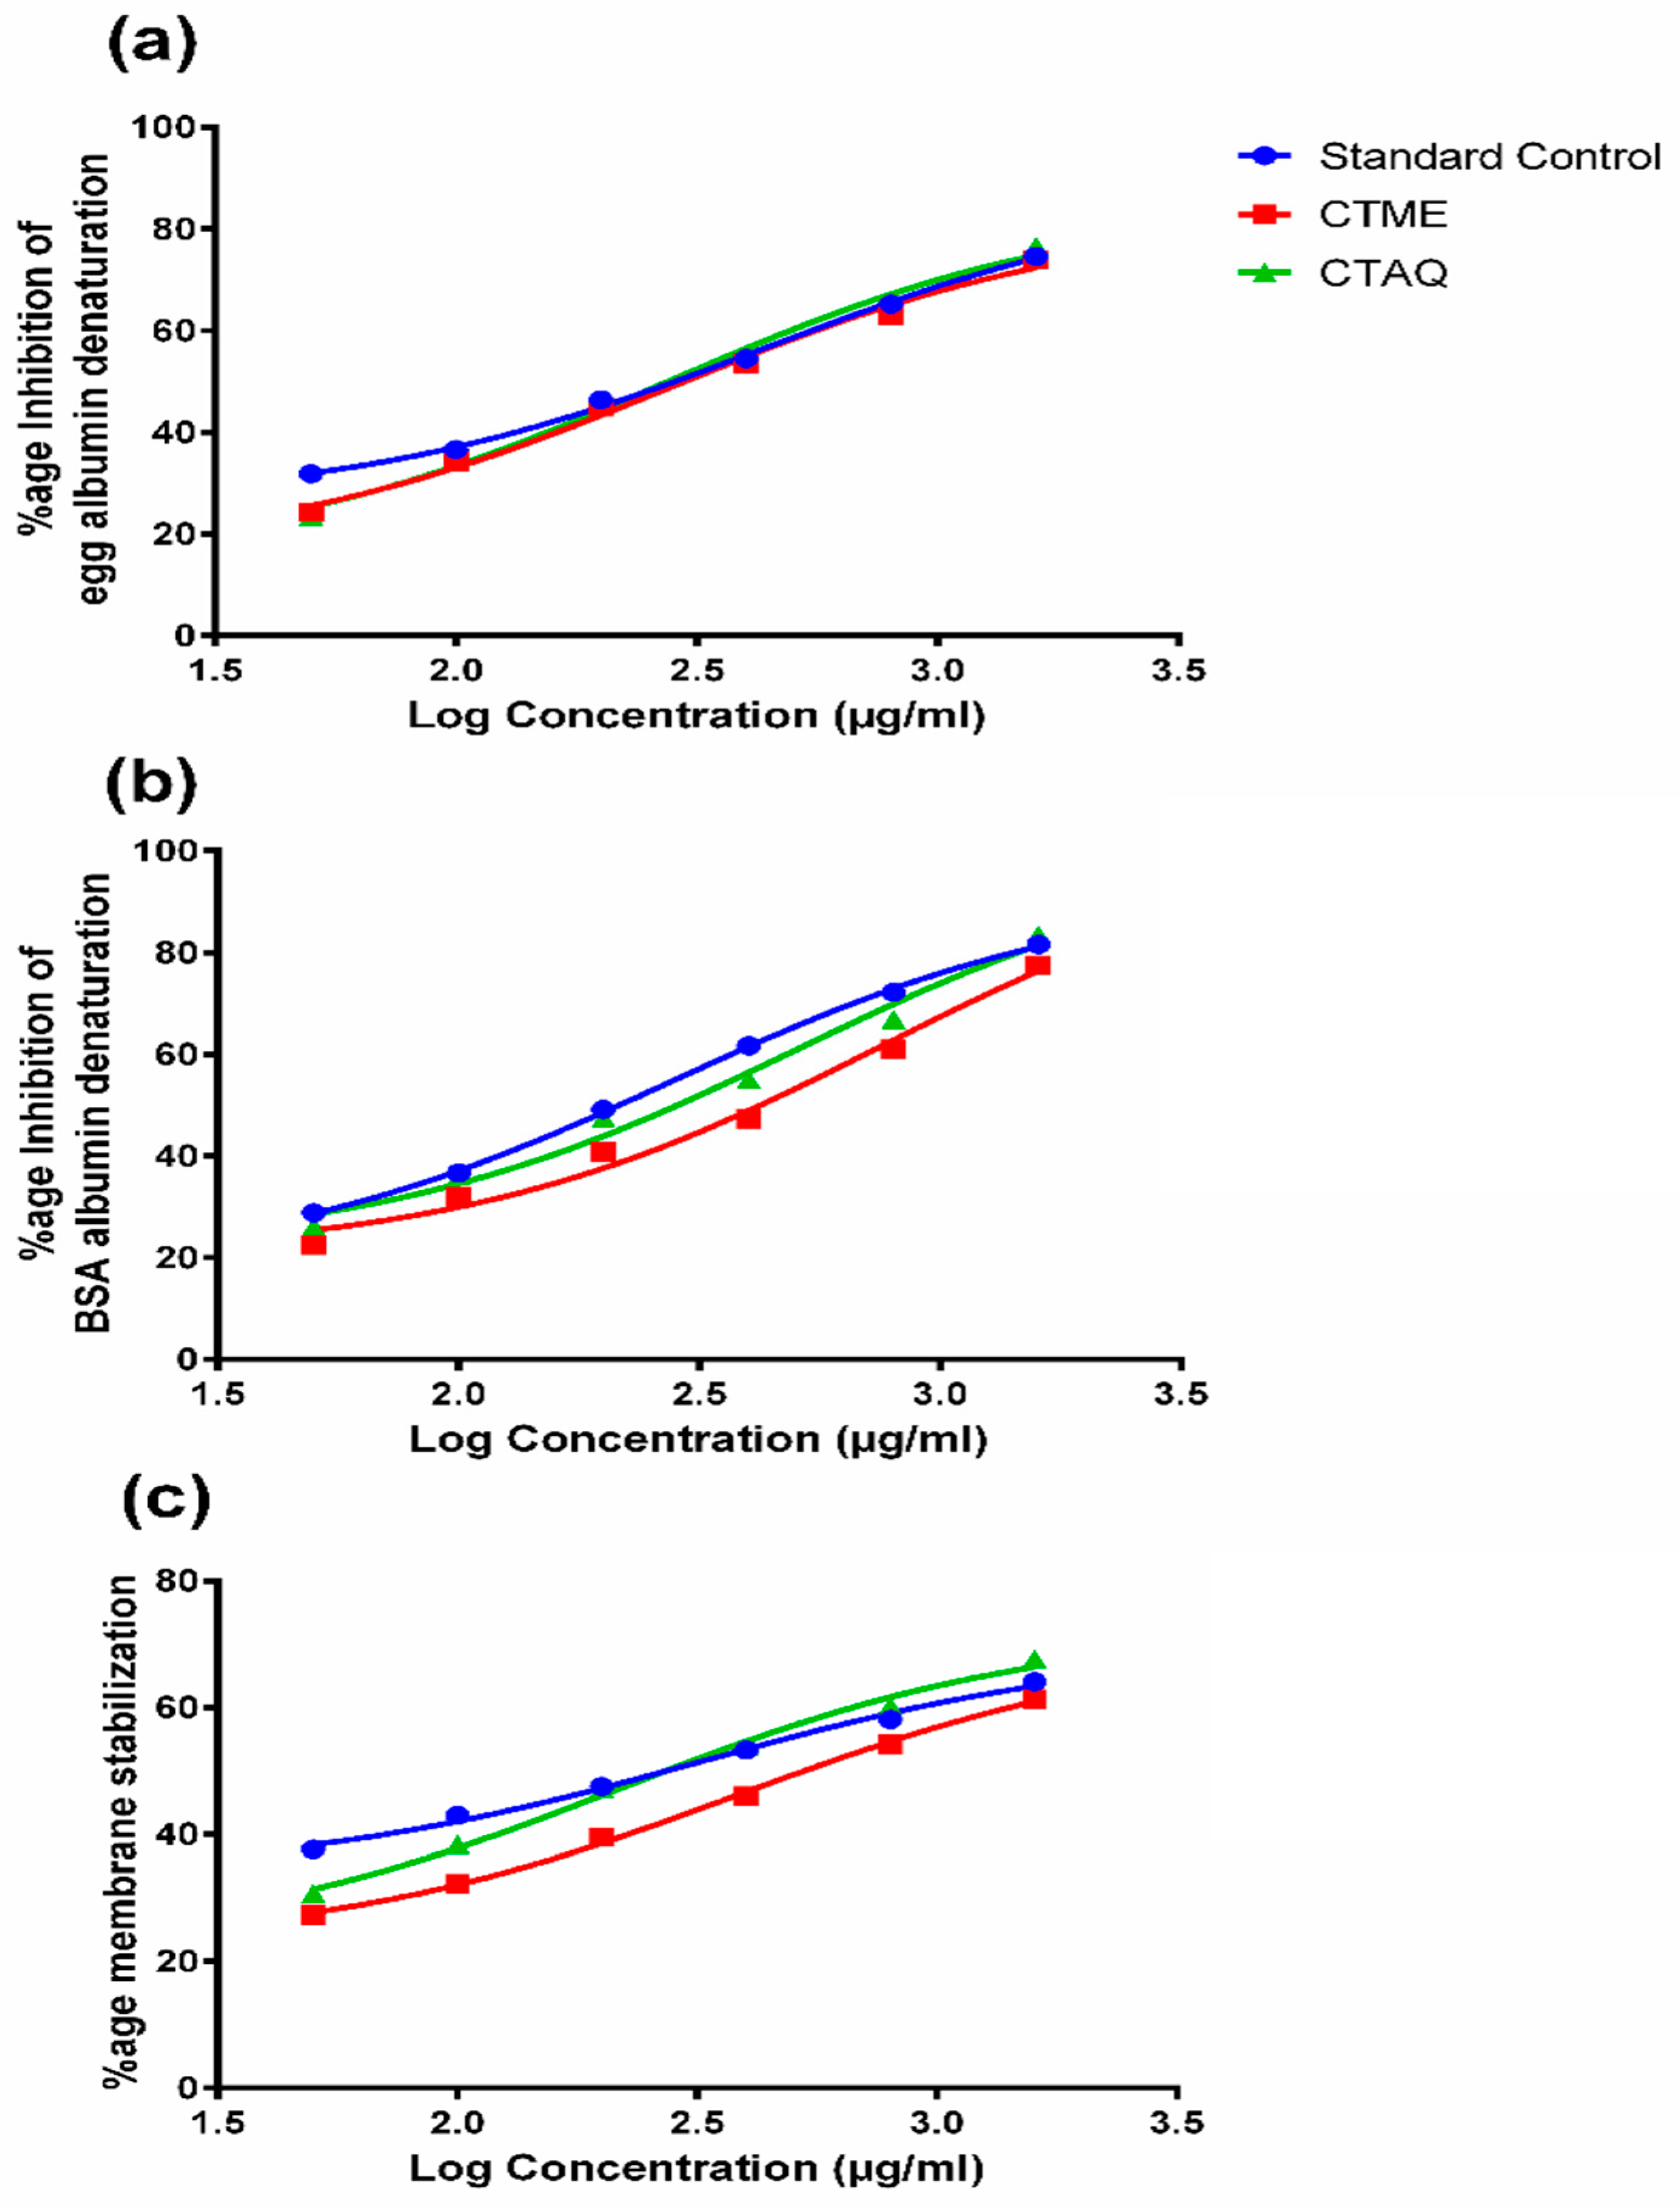
2.5. Inhibition of Protein Denaturation
2.6. Human Red Blood Cells (HRBC) Membrane Stabilization Assay
2.7. Complete Freund’s Adjuvant (CFA)-Induced Arthritis
2.8. Evaluation of Arthritis
2.9. Evaluation of Arthritis from Blood Parameters
2.10. Immune Organ Weight and Histopathological Evaluation
2.11. Assessment of Oxidative Stress Biomarkers
2.12. Quantification of Inflammatory Cytokines by Real-time PCR
2.13. Statistical Analysis
3. Results
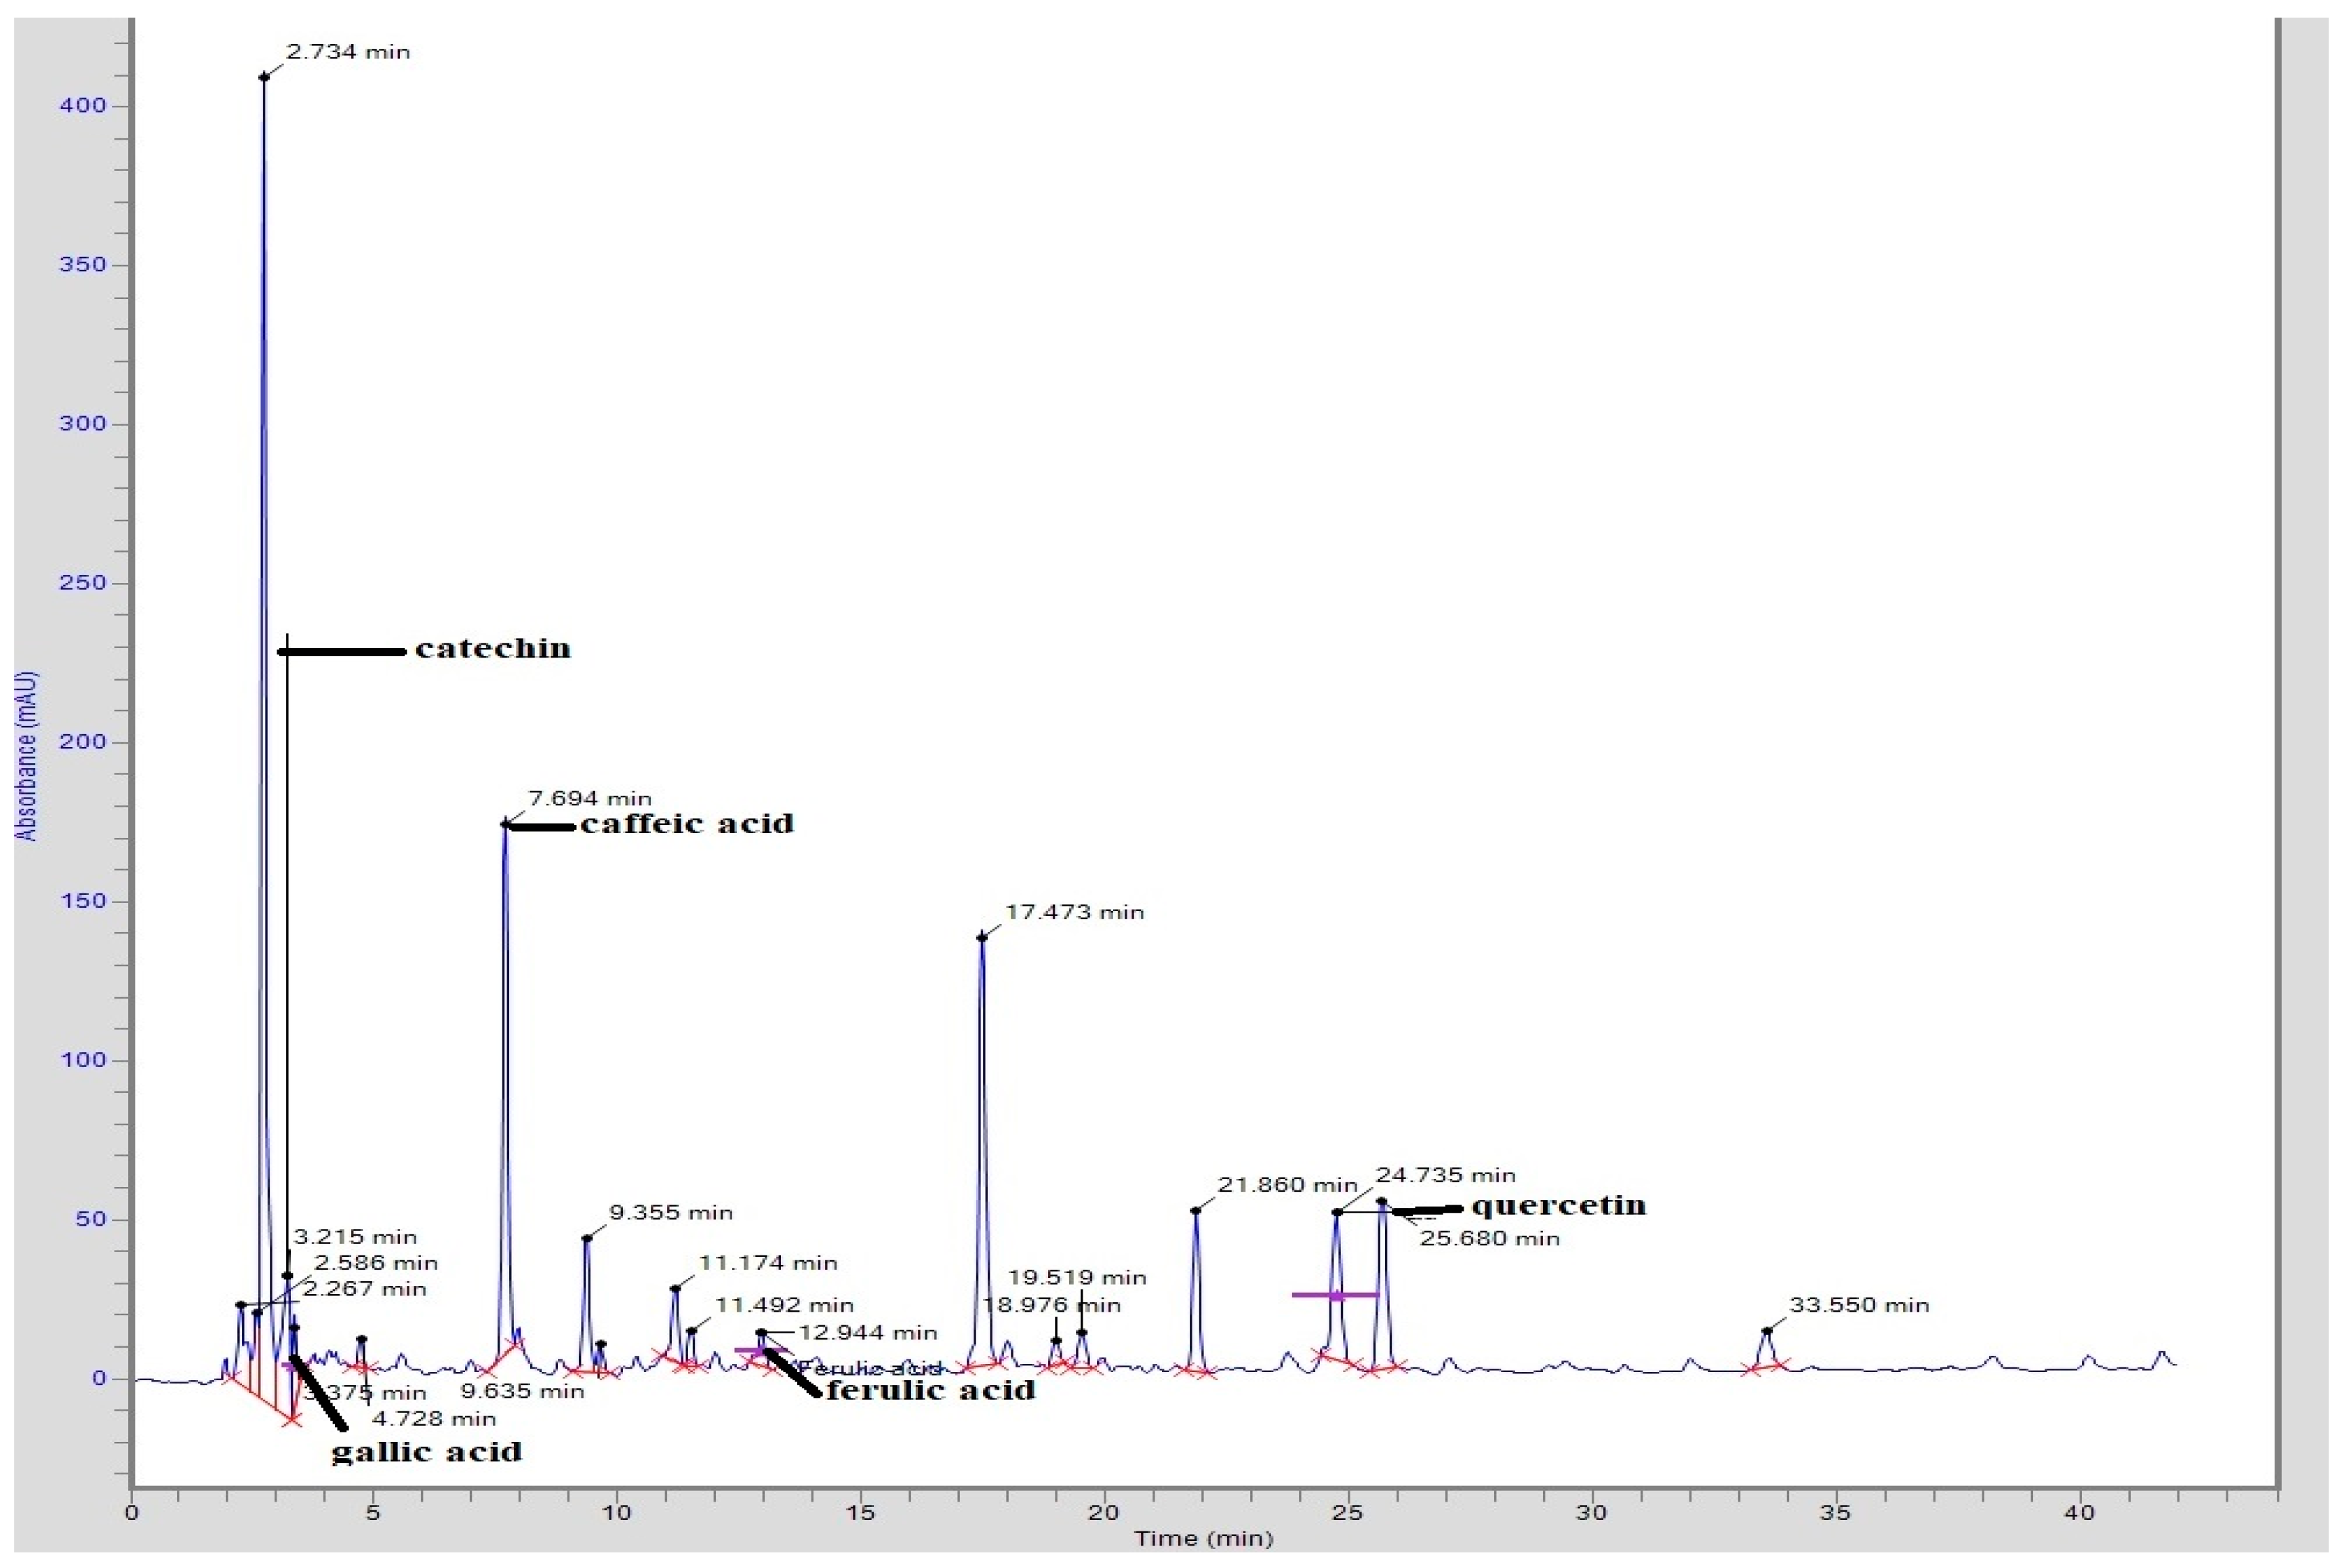
3.1. HPLC Analysis
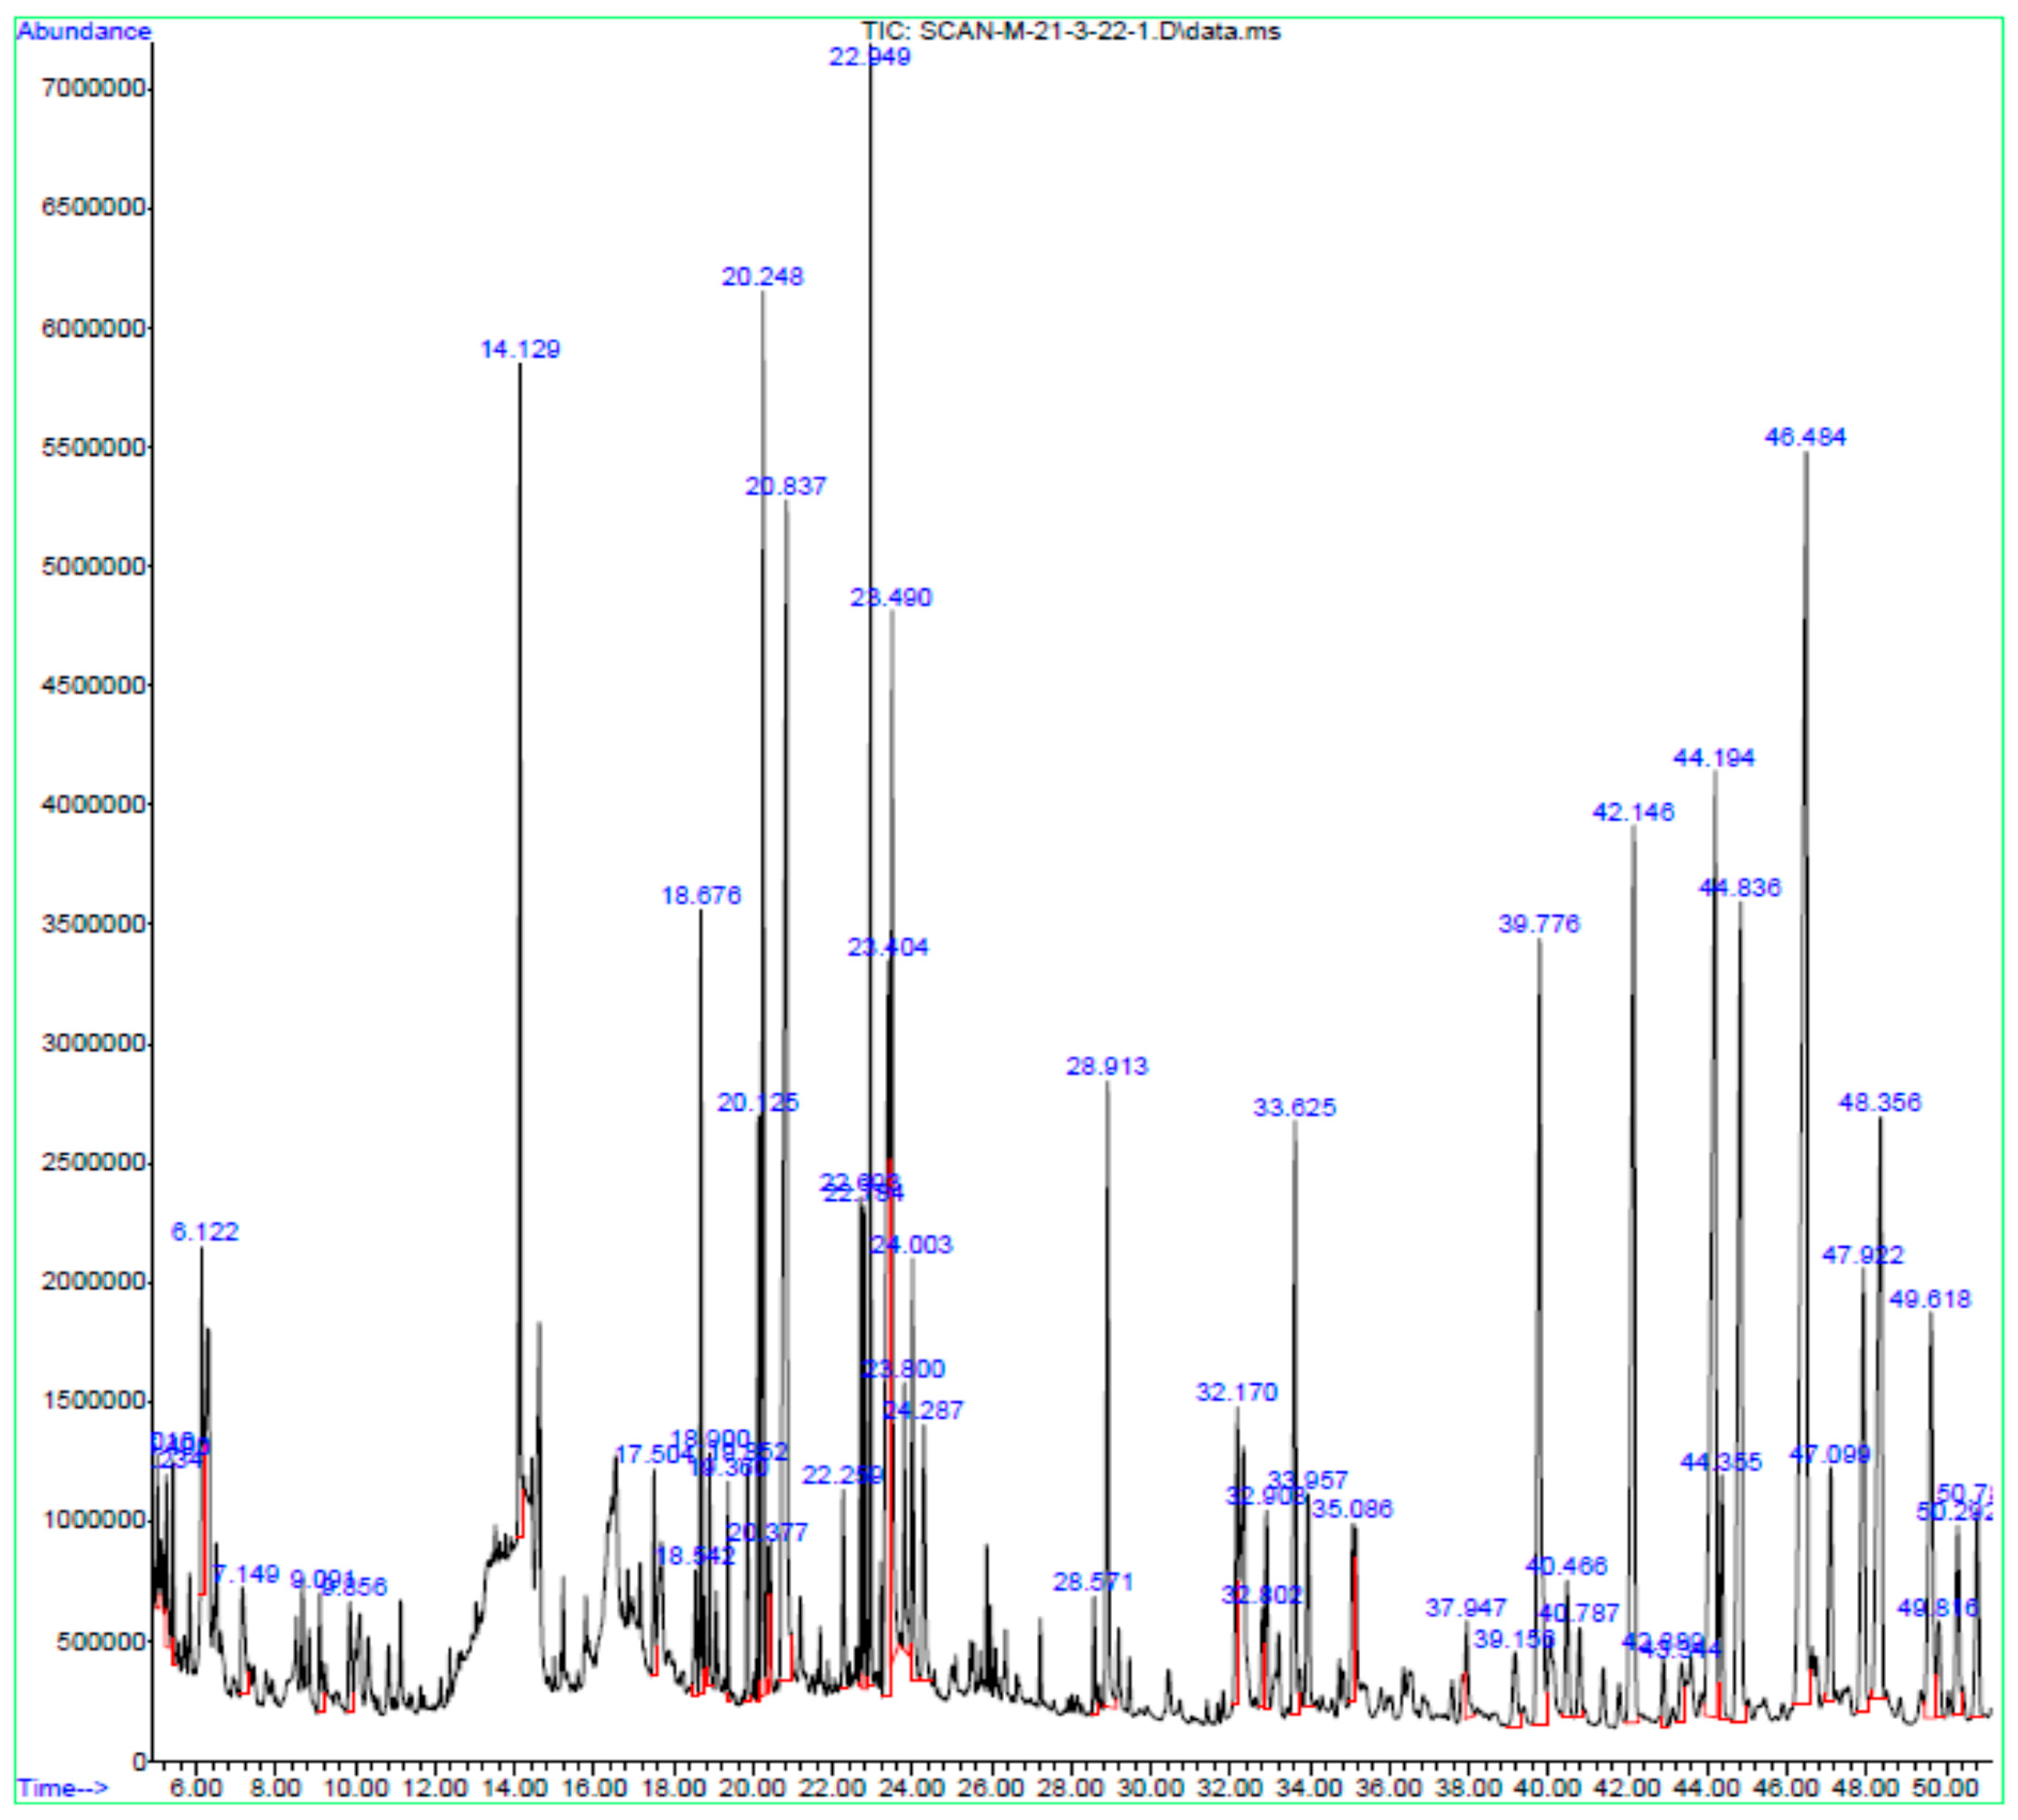
3.2. GC-MS
3.3. Membrane Stabilization Activity
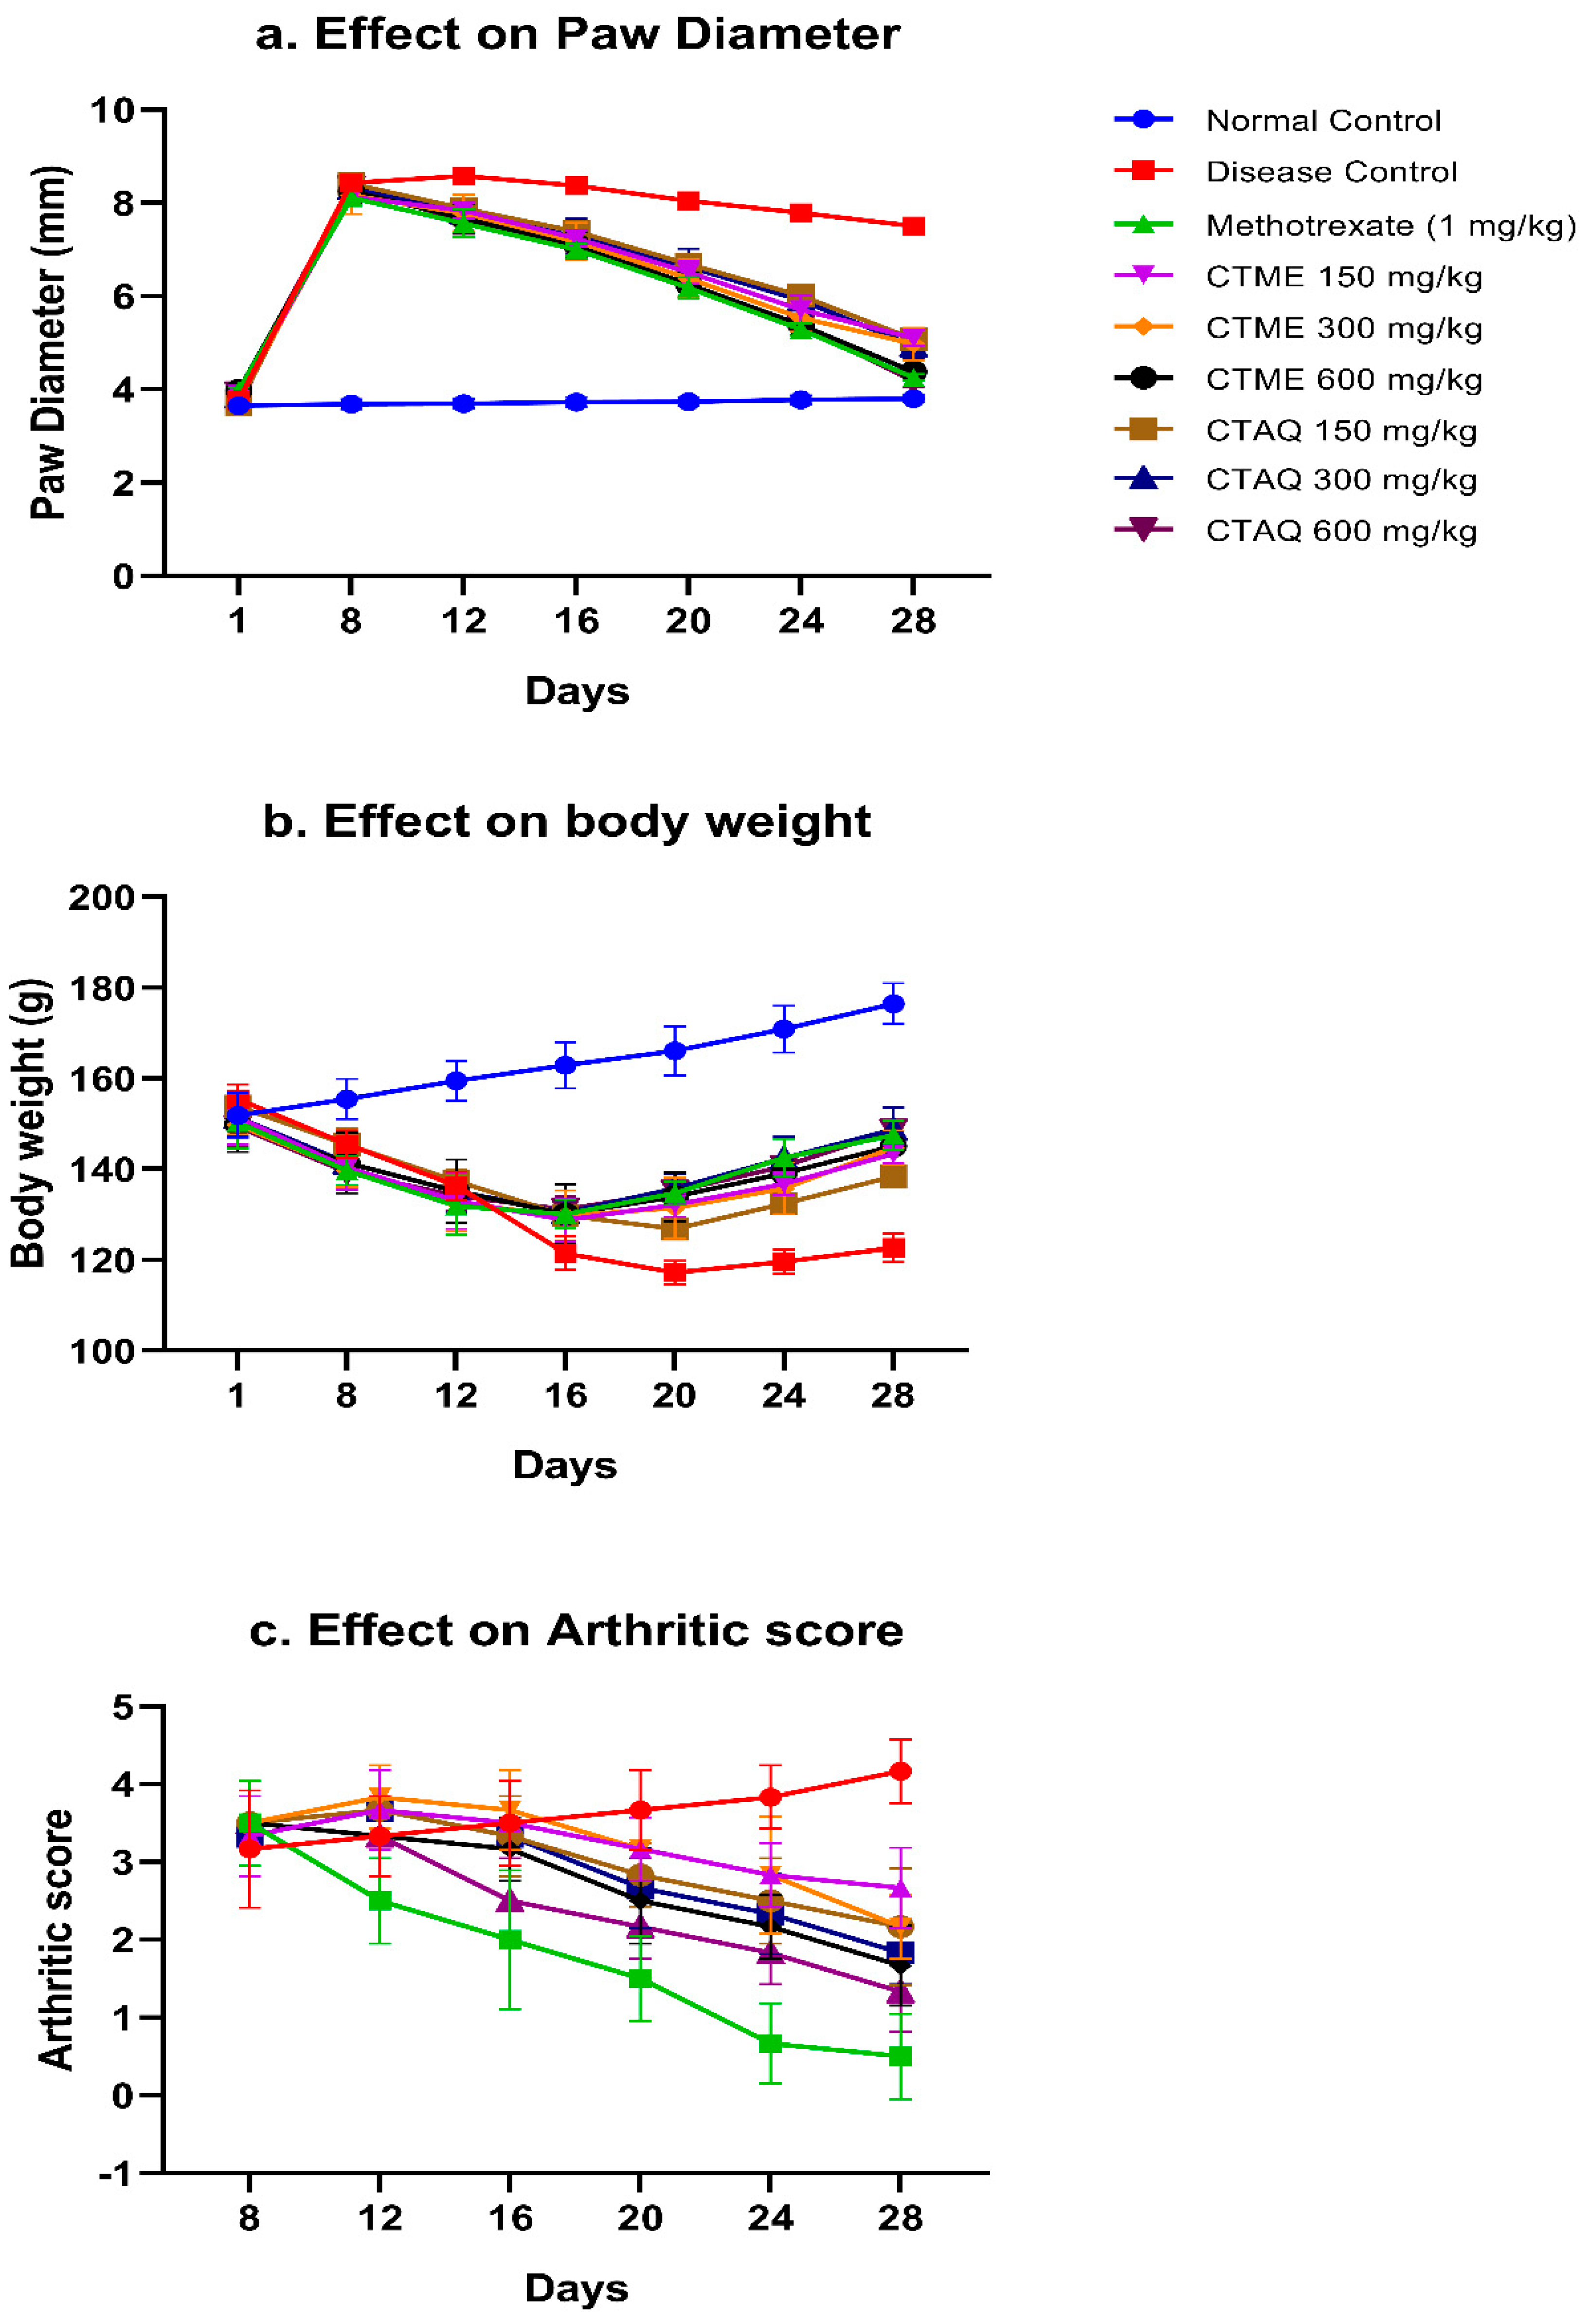
3.4. Effect on Paw Edema
3.5. Body Weight (BW)
3.6. Effect on Arthritic Score
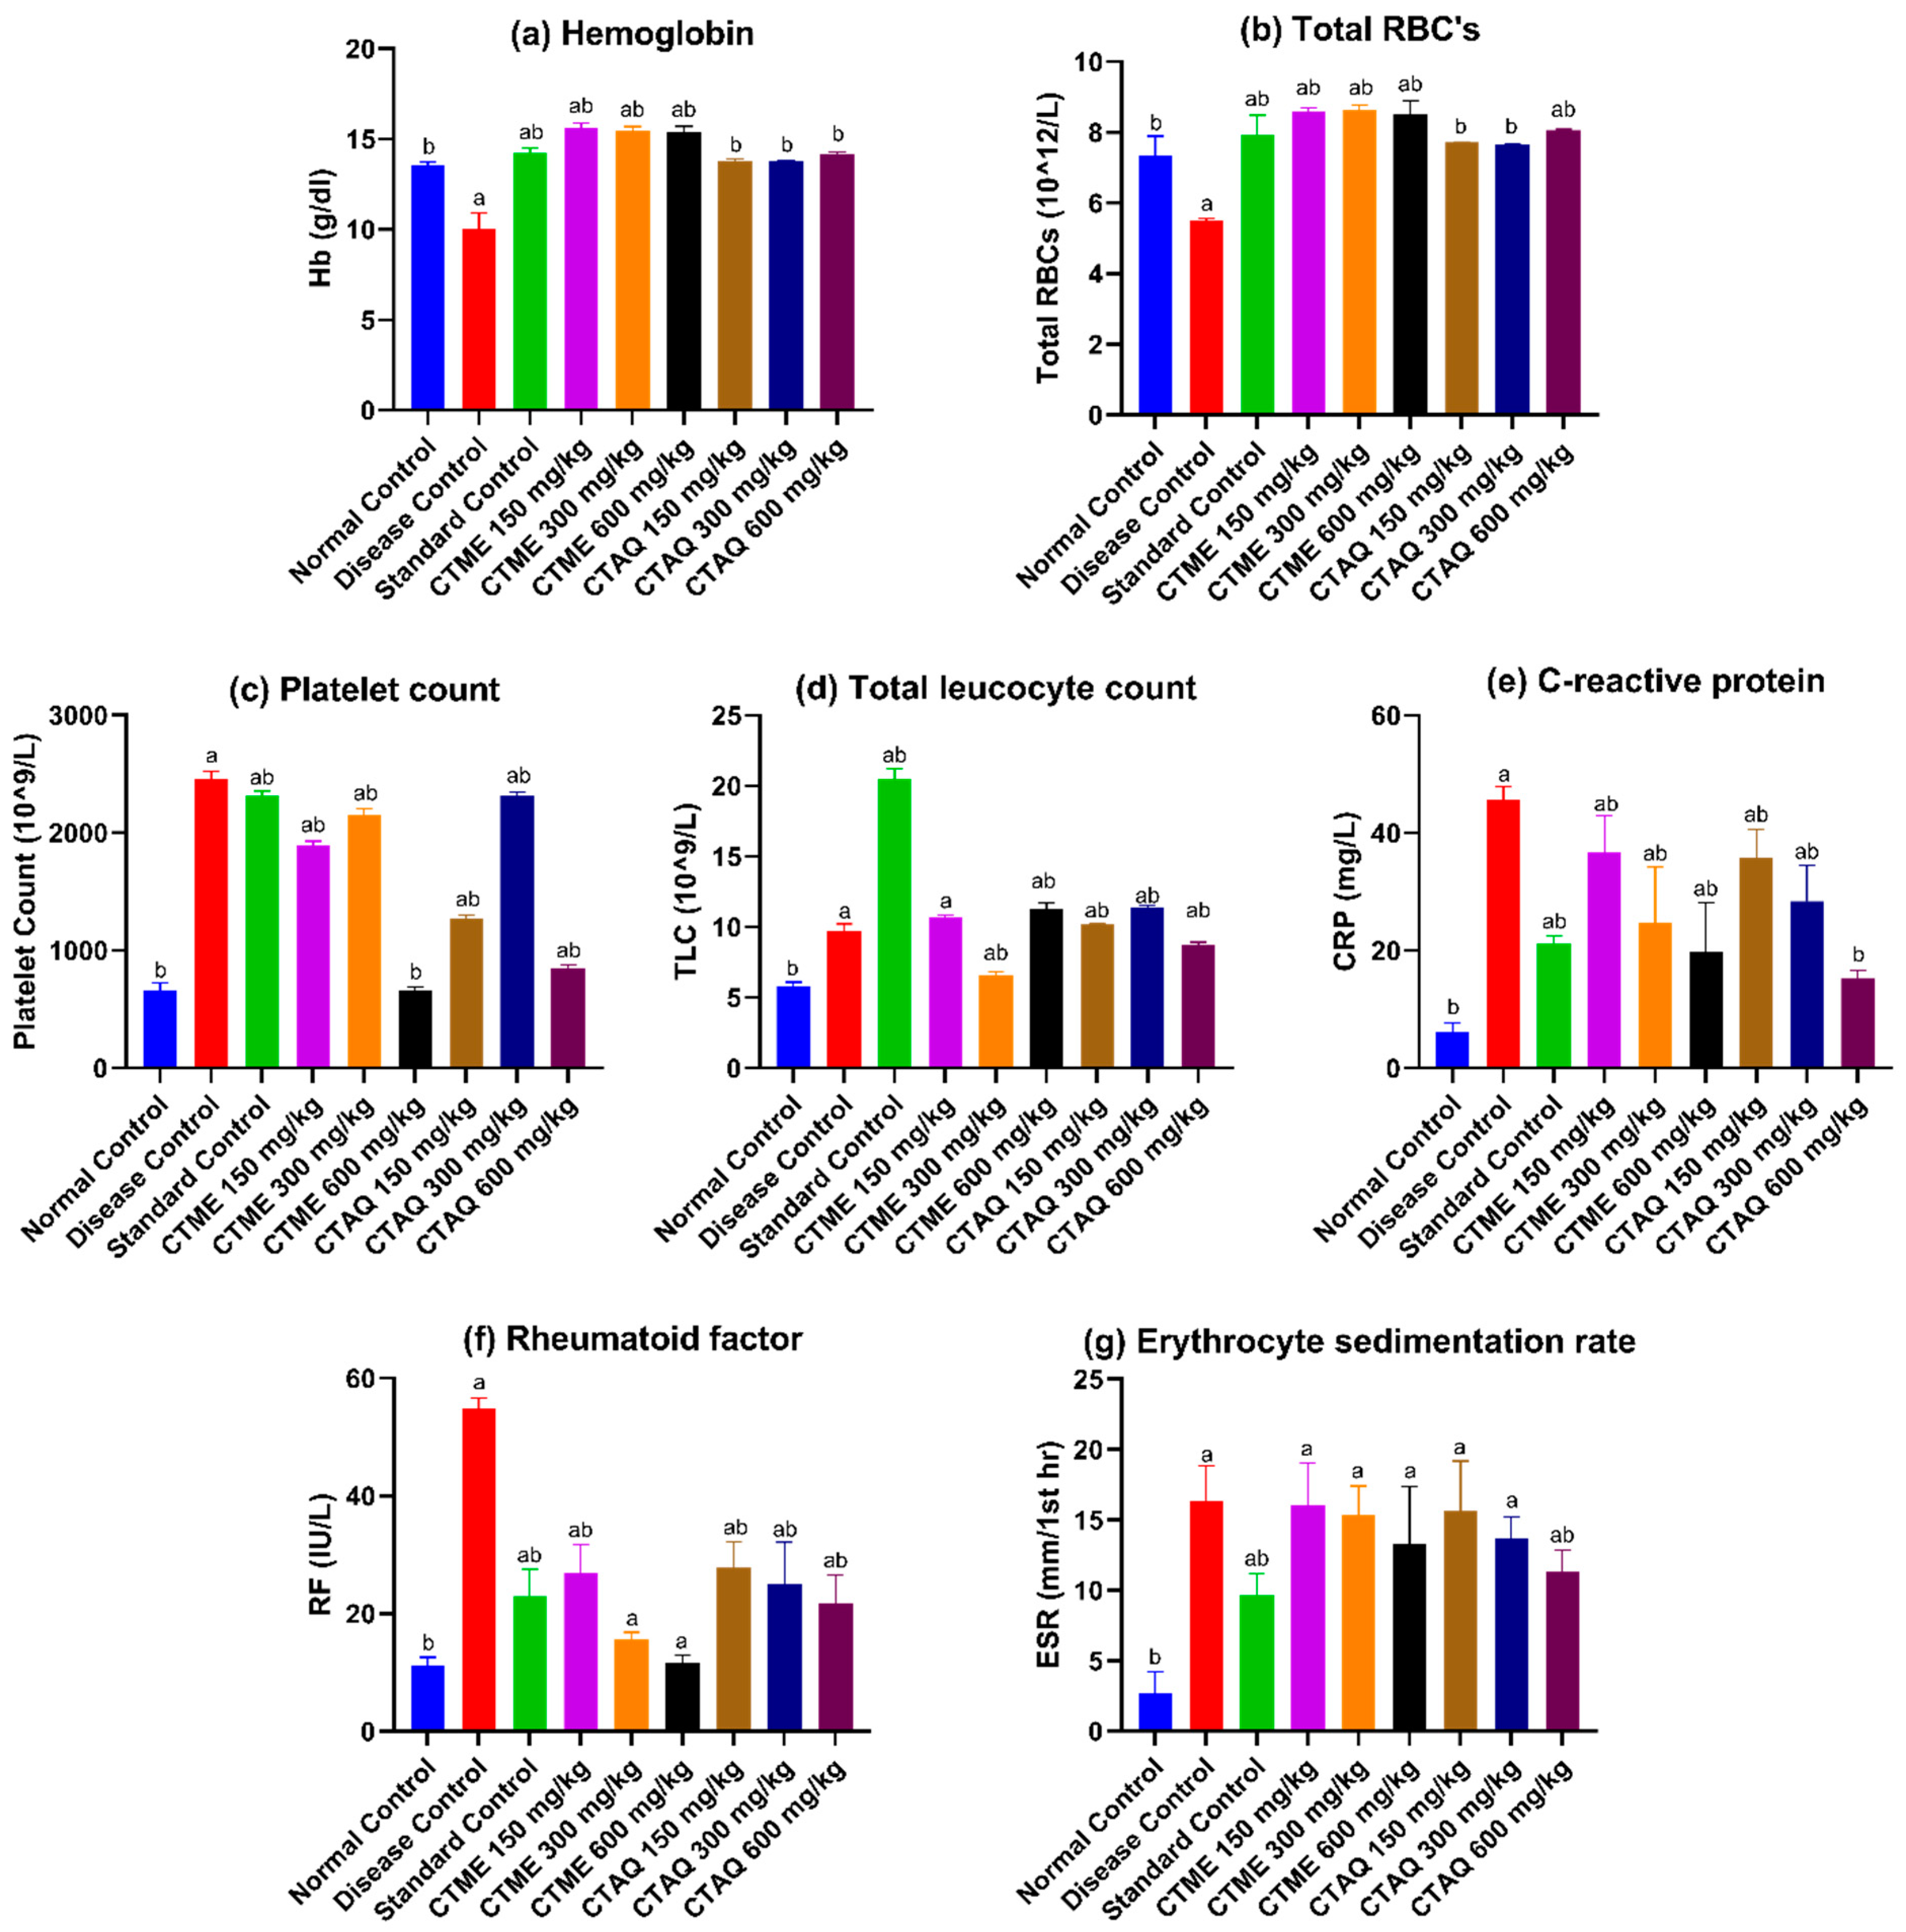
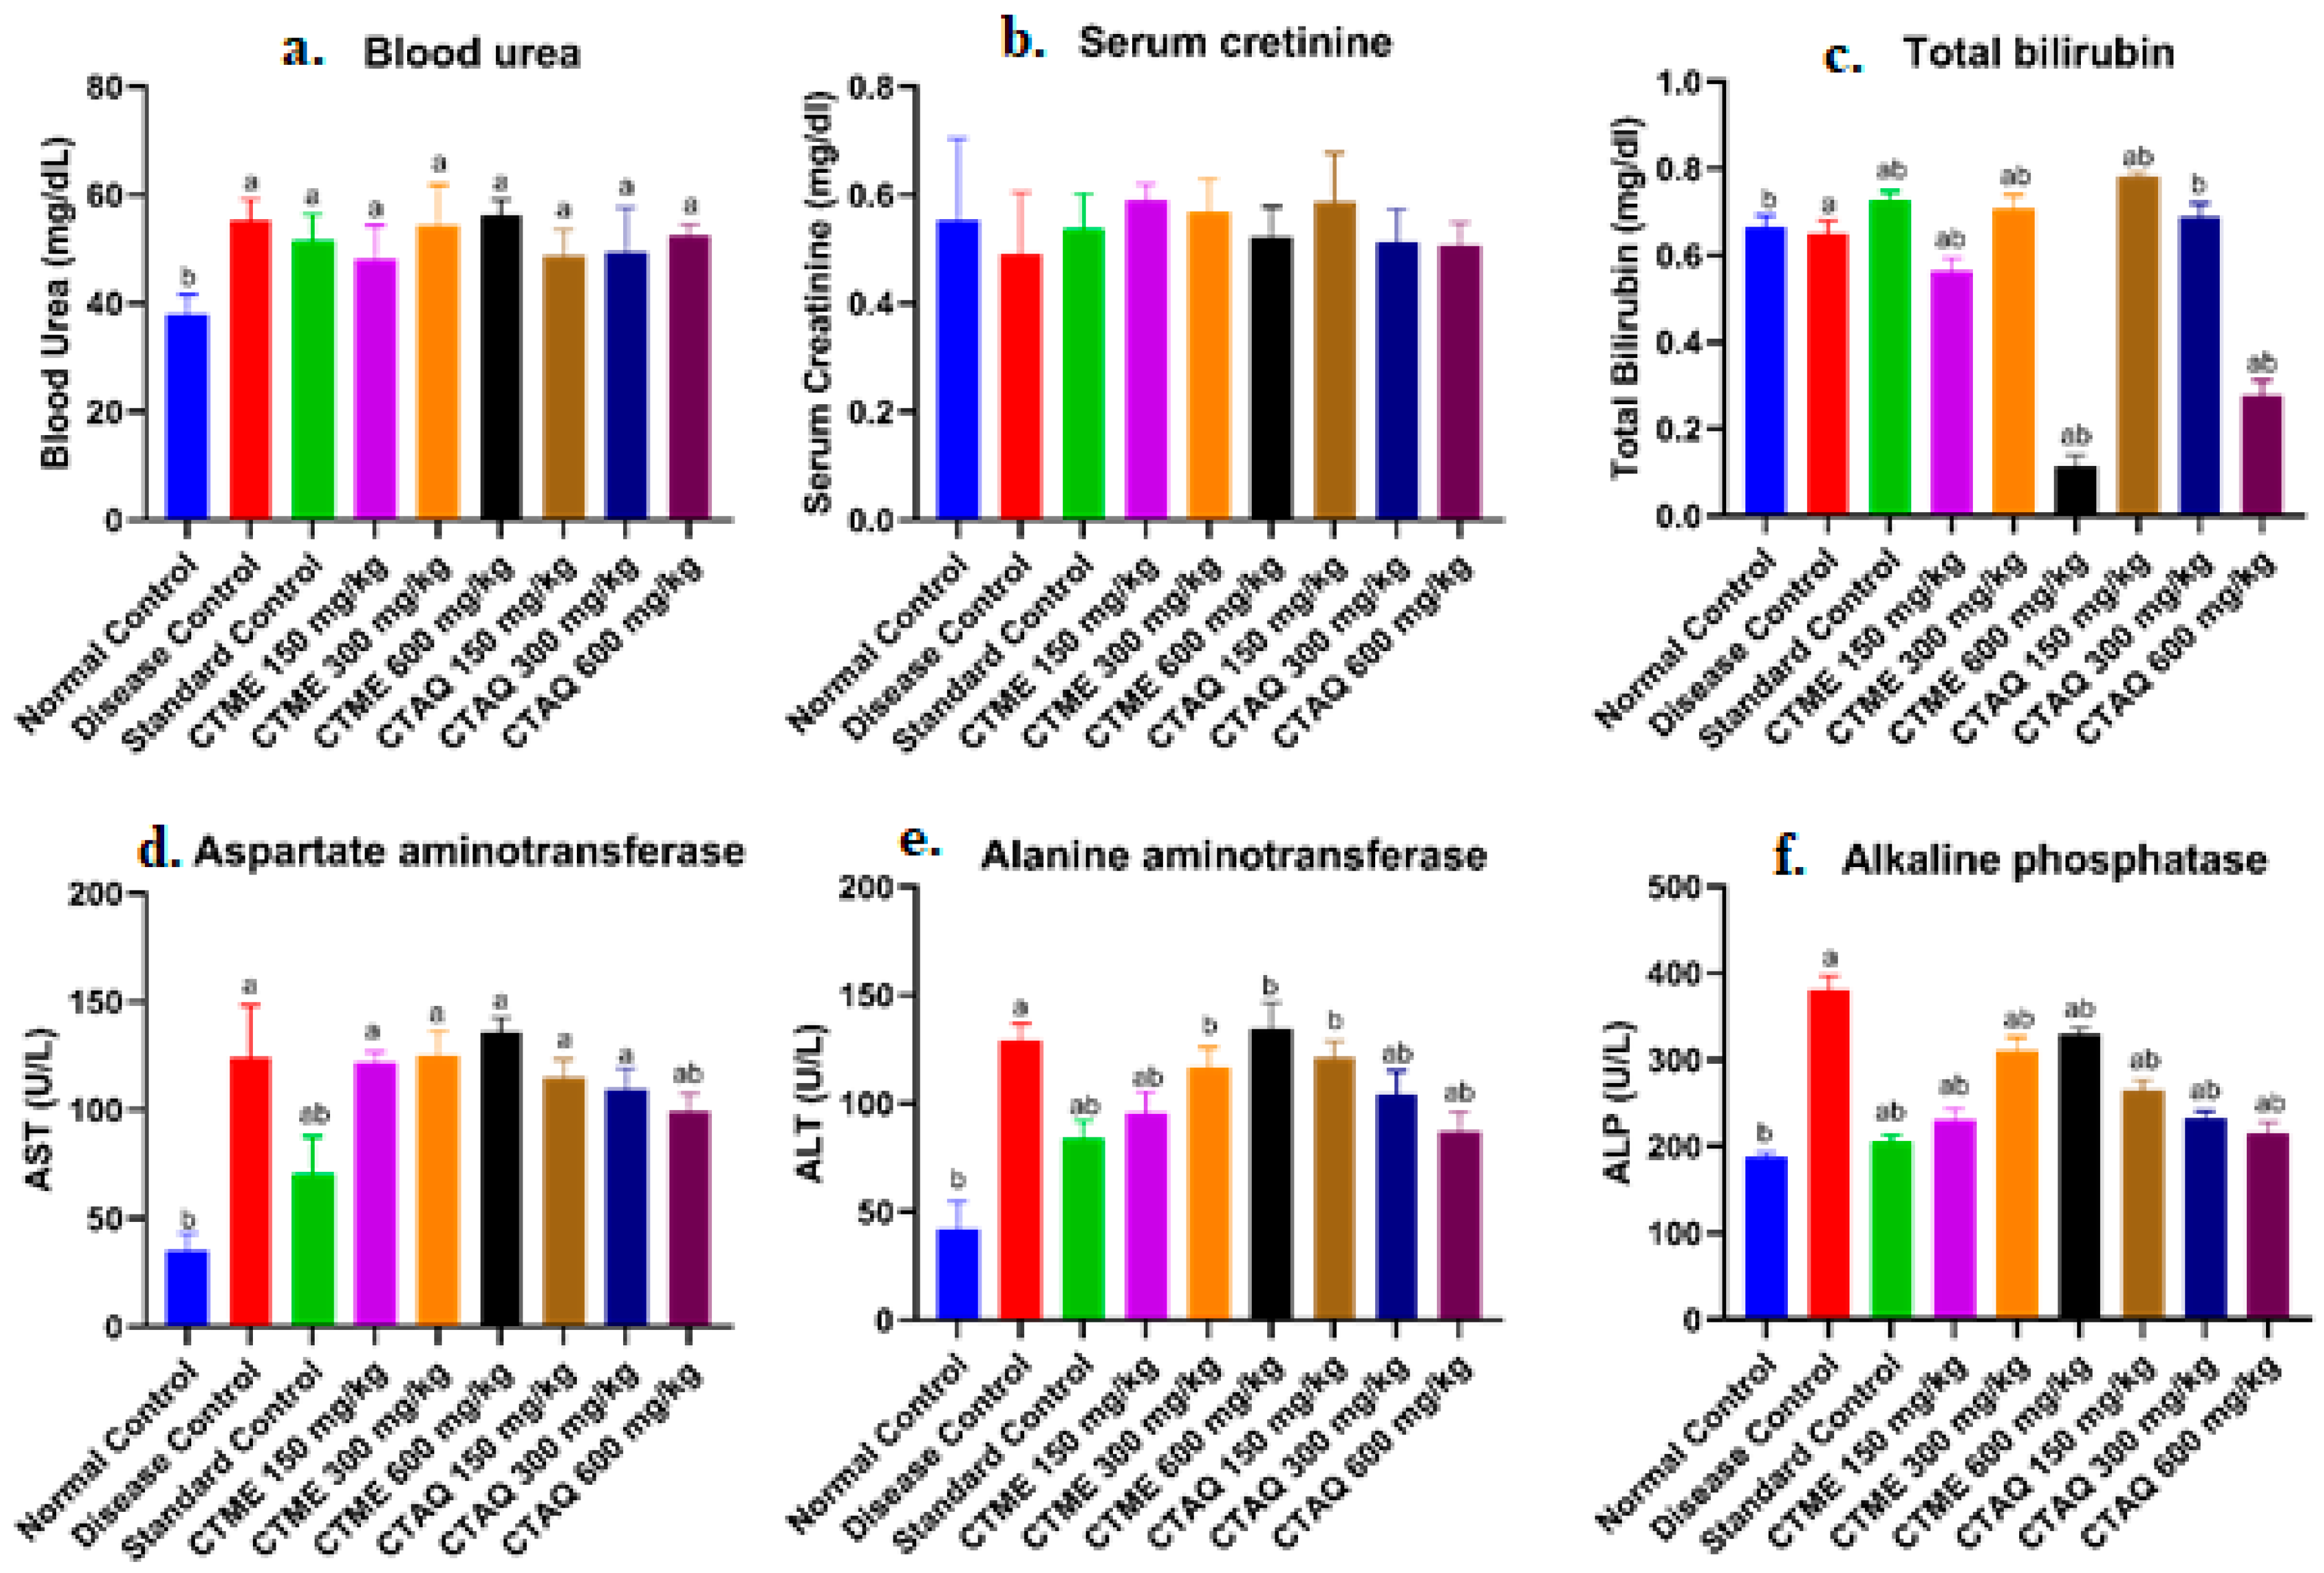
3.7. Effect on Blood Parameters
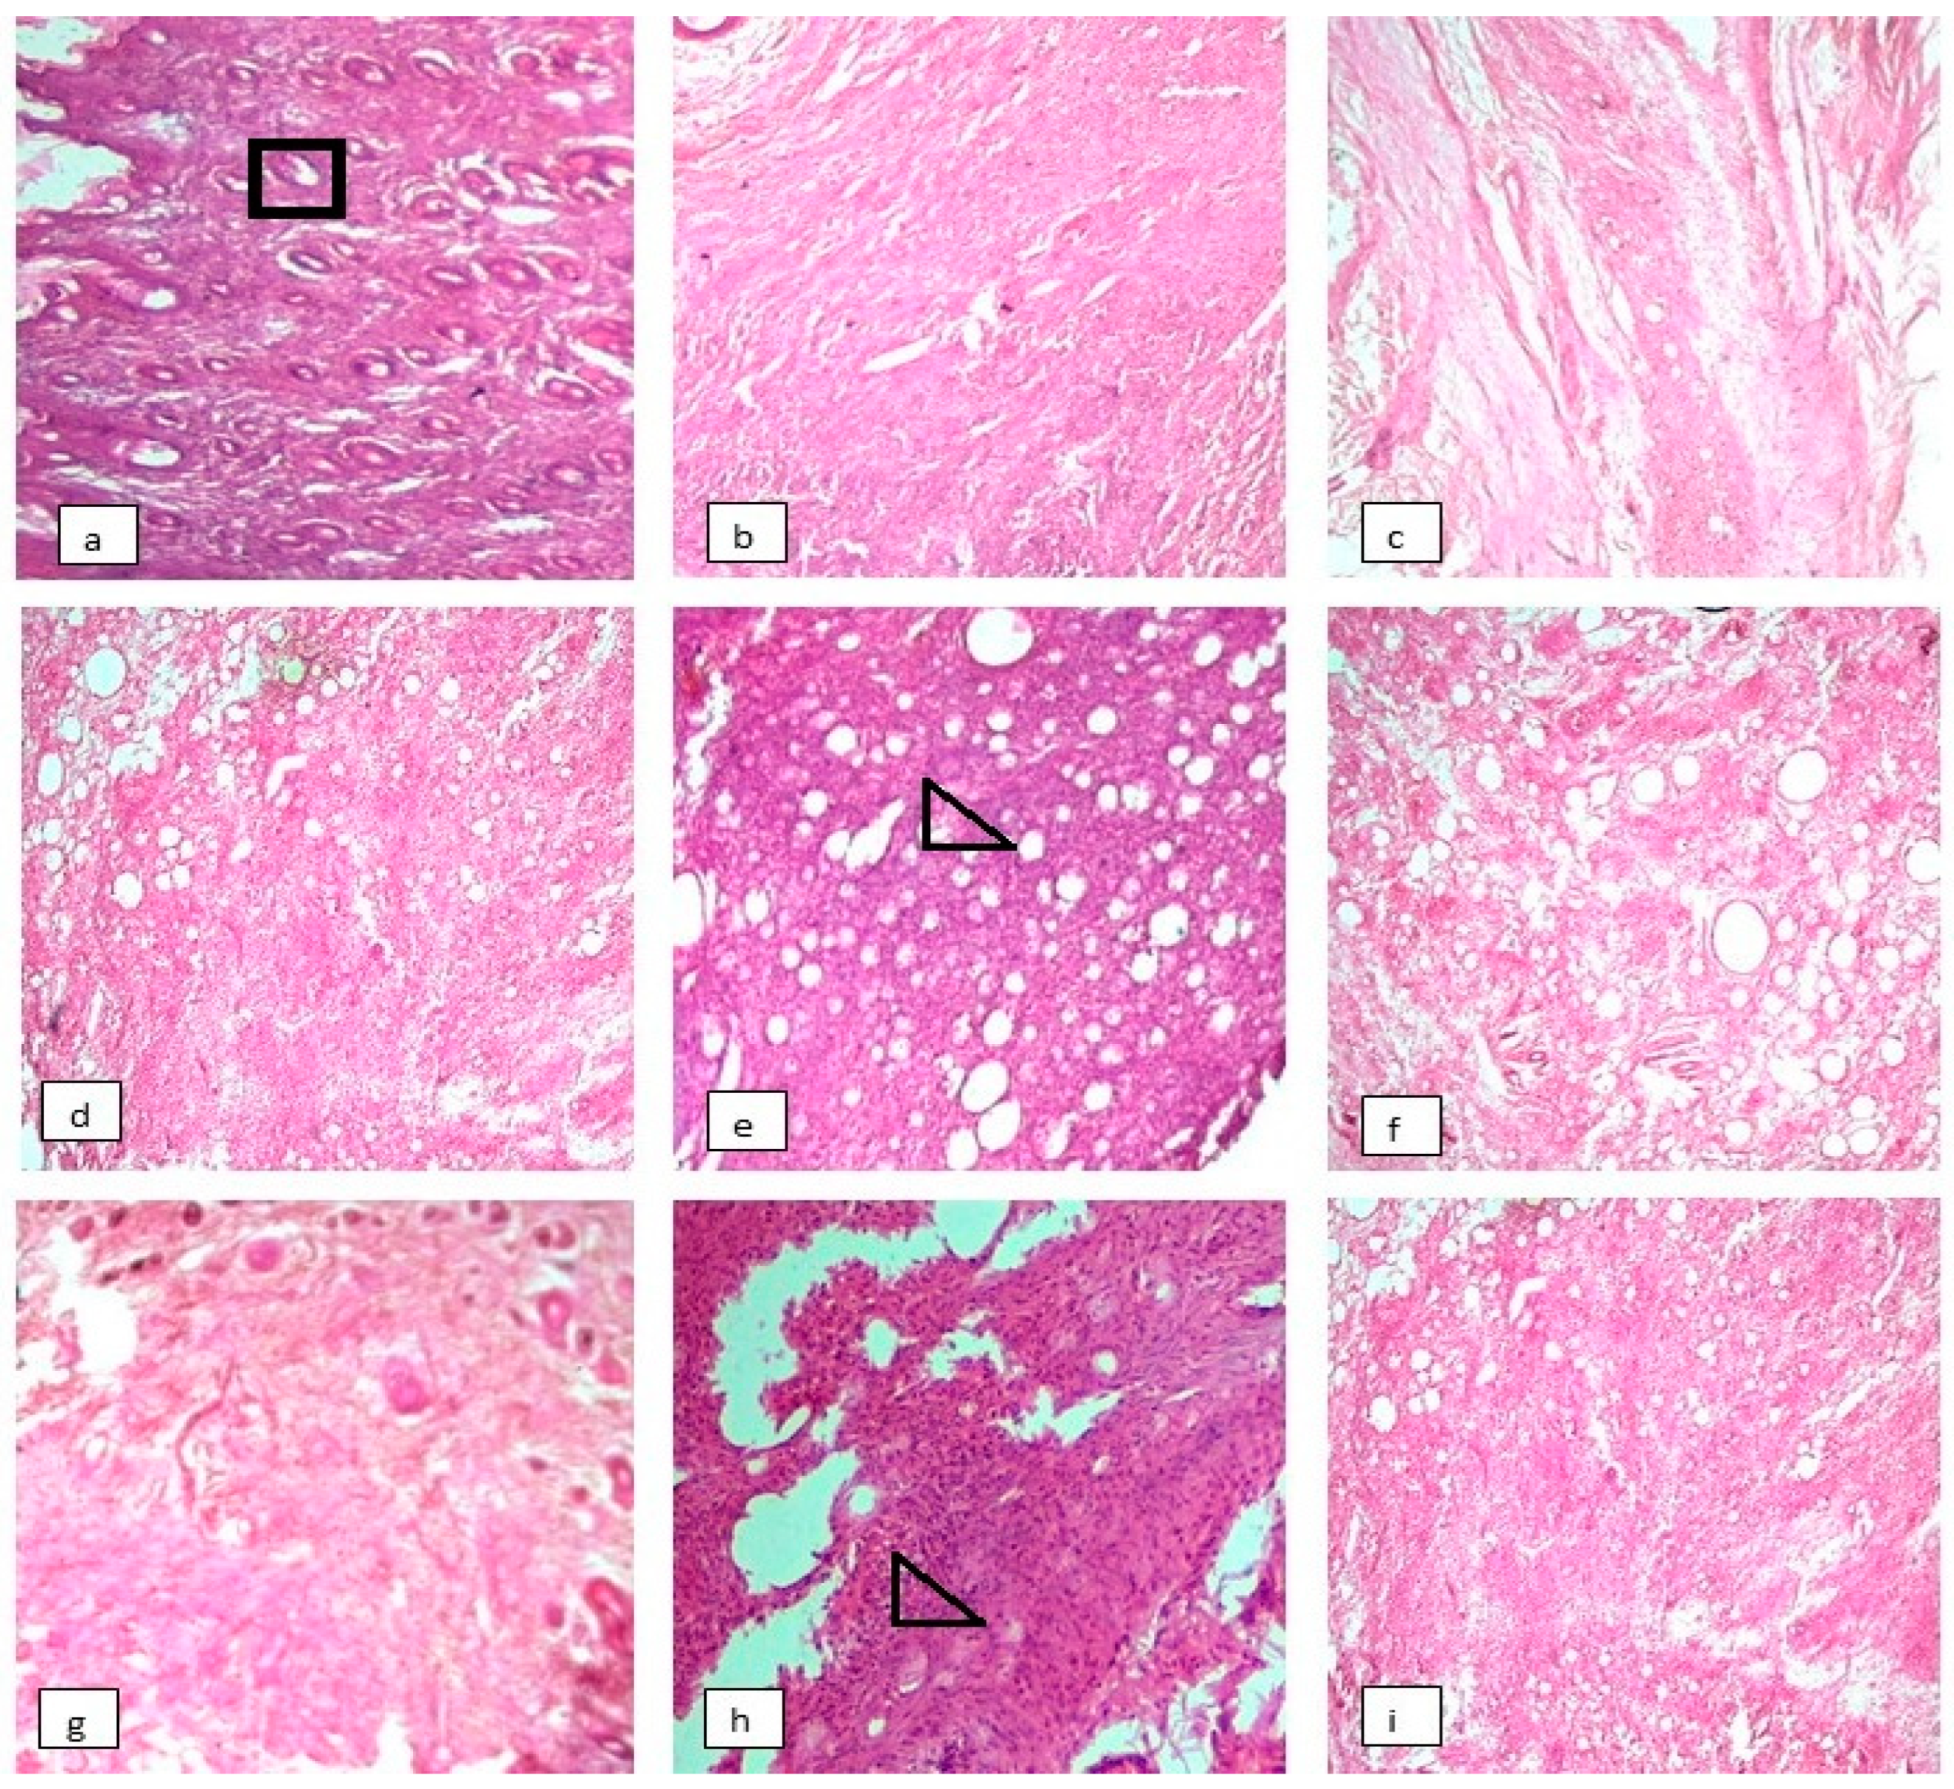
3.8. Effect on Histopathology of Arthritic Joints
3.9. Effect on Arthritic Indices
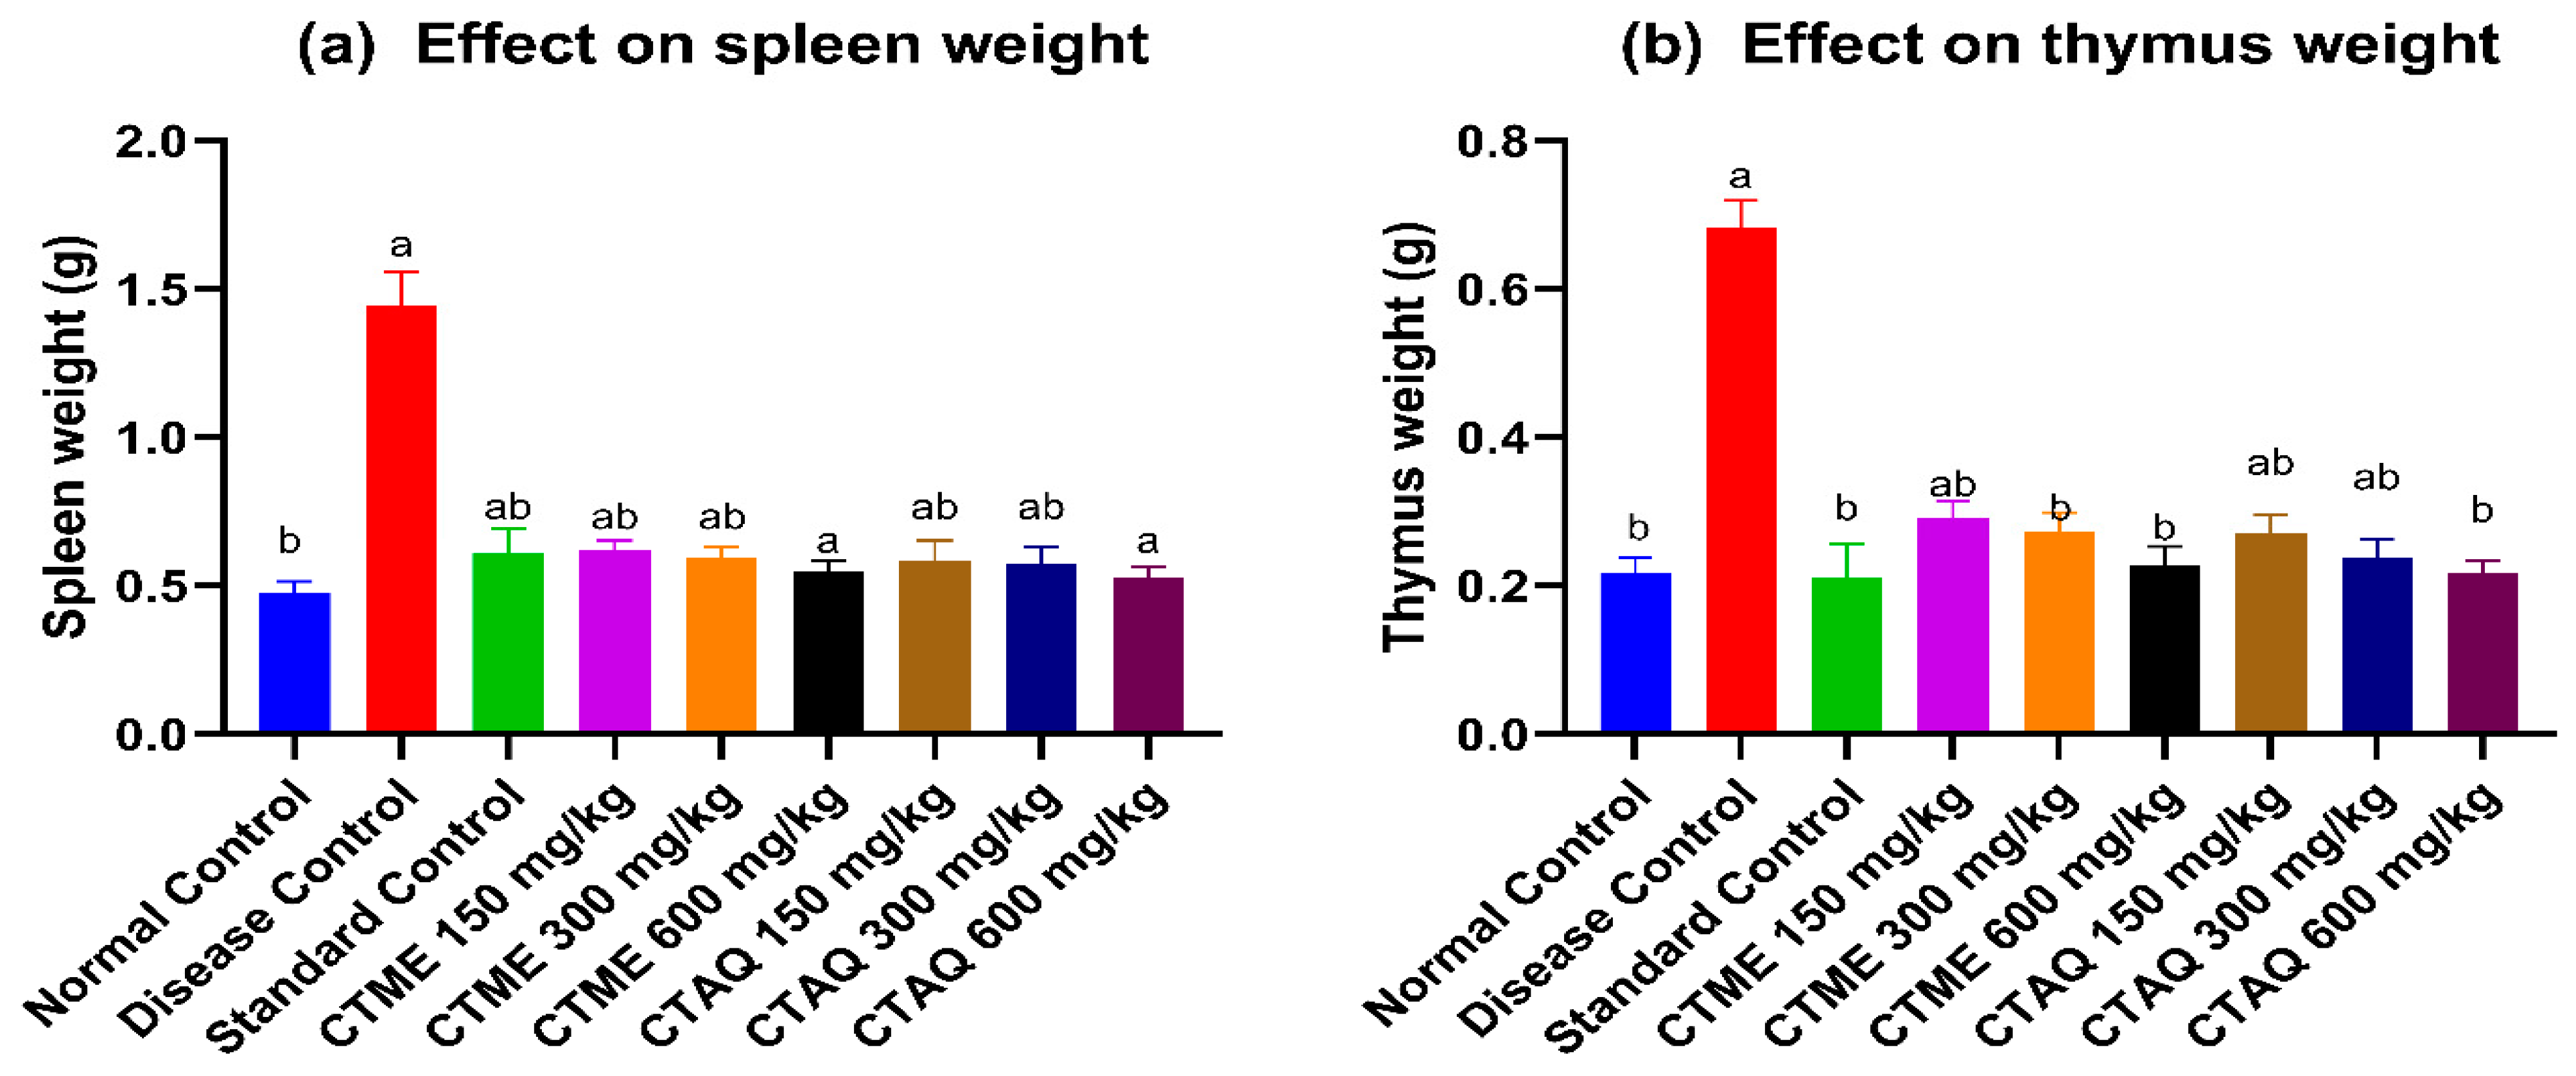
3.10. Immune Organ Weight
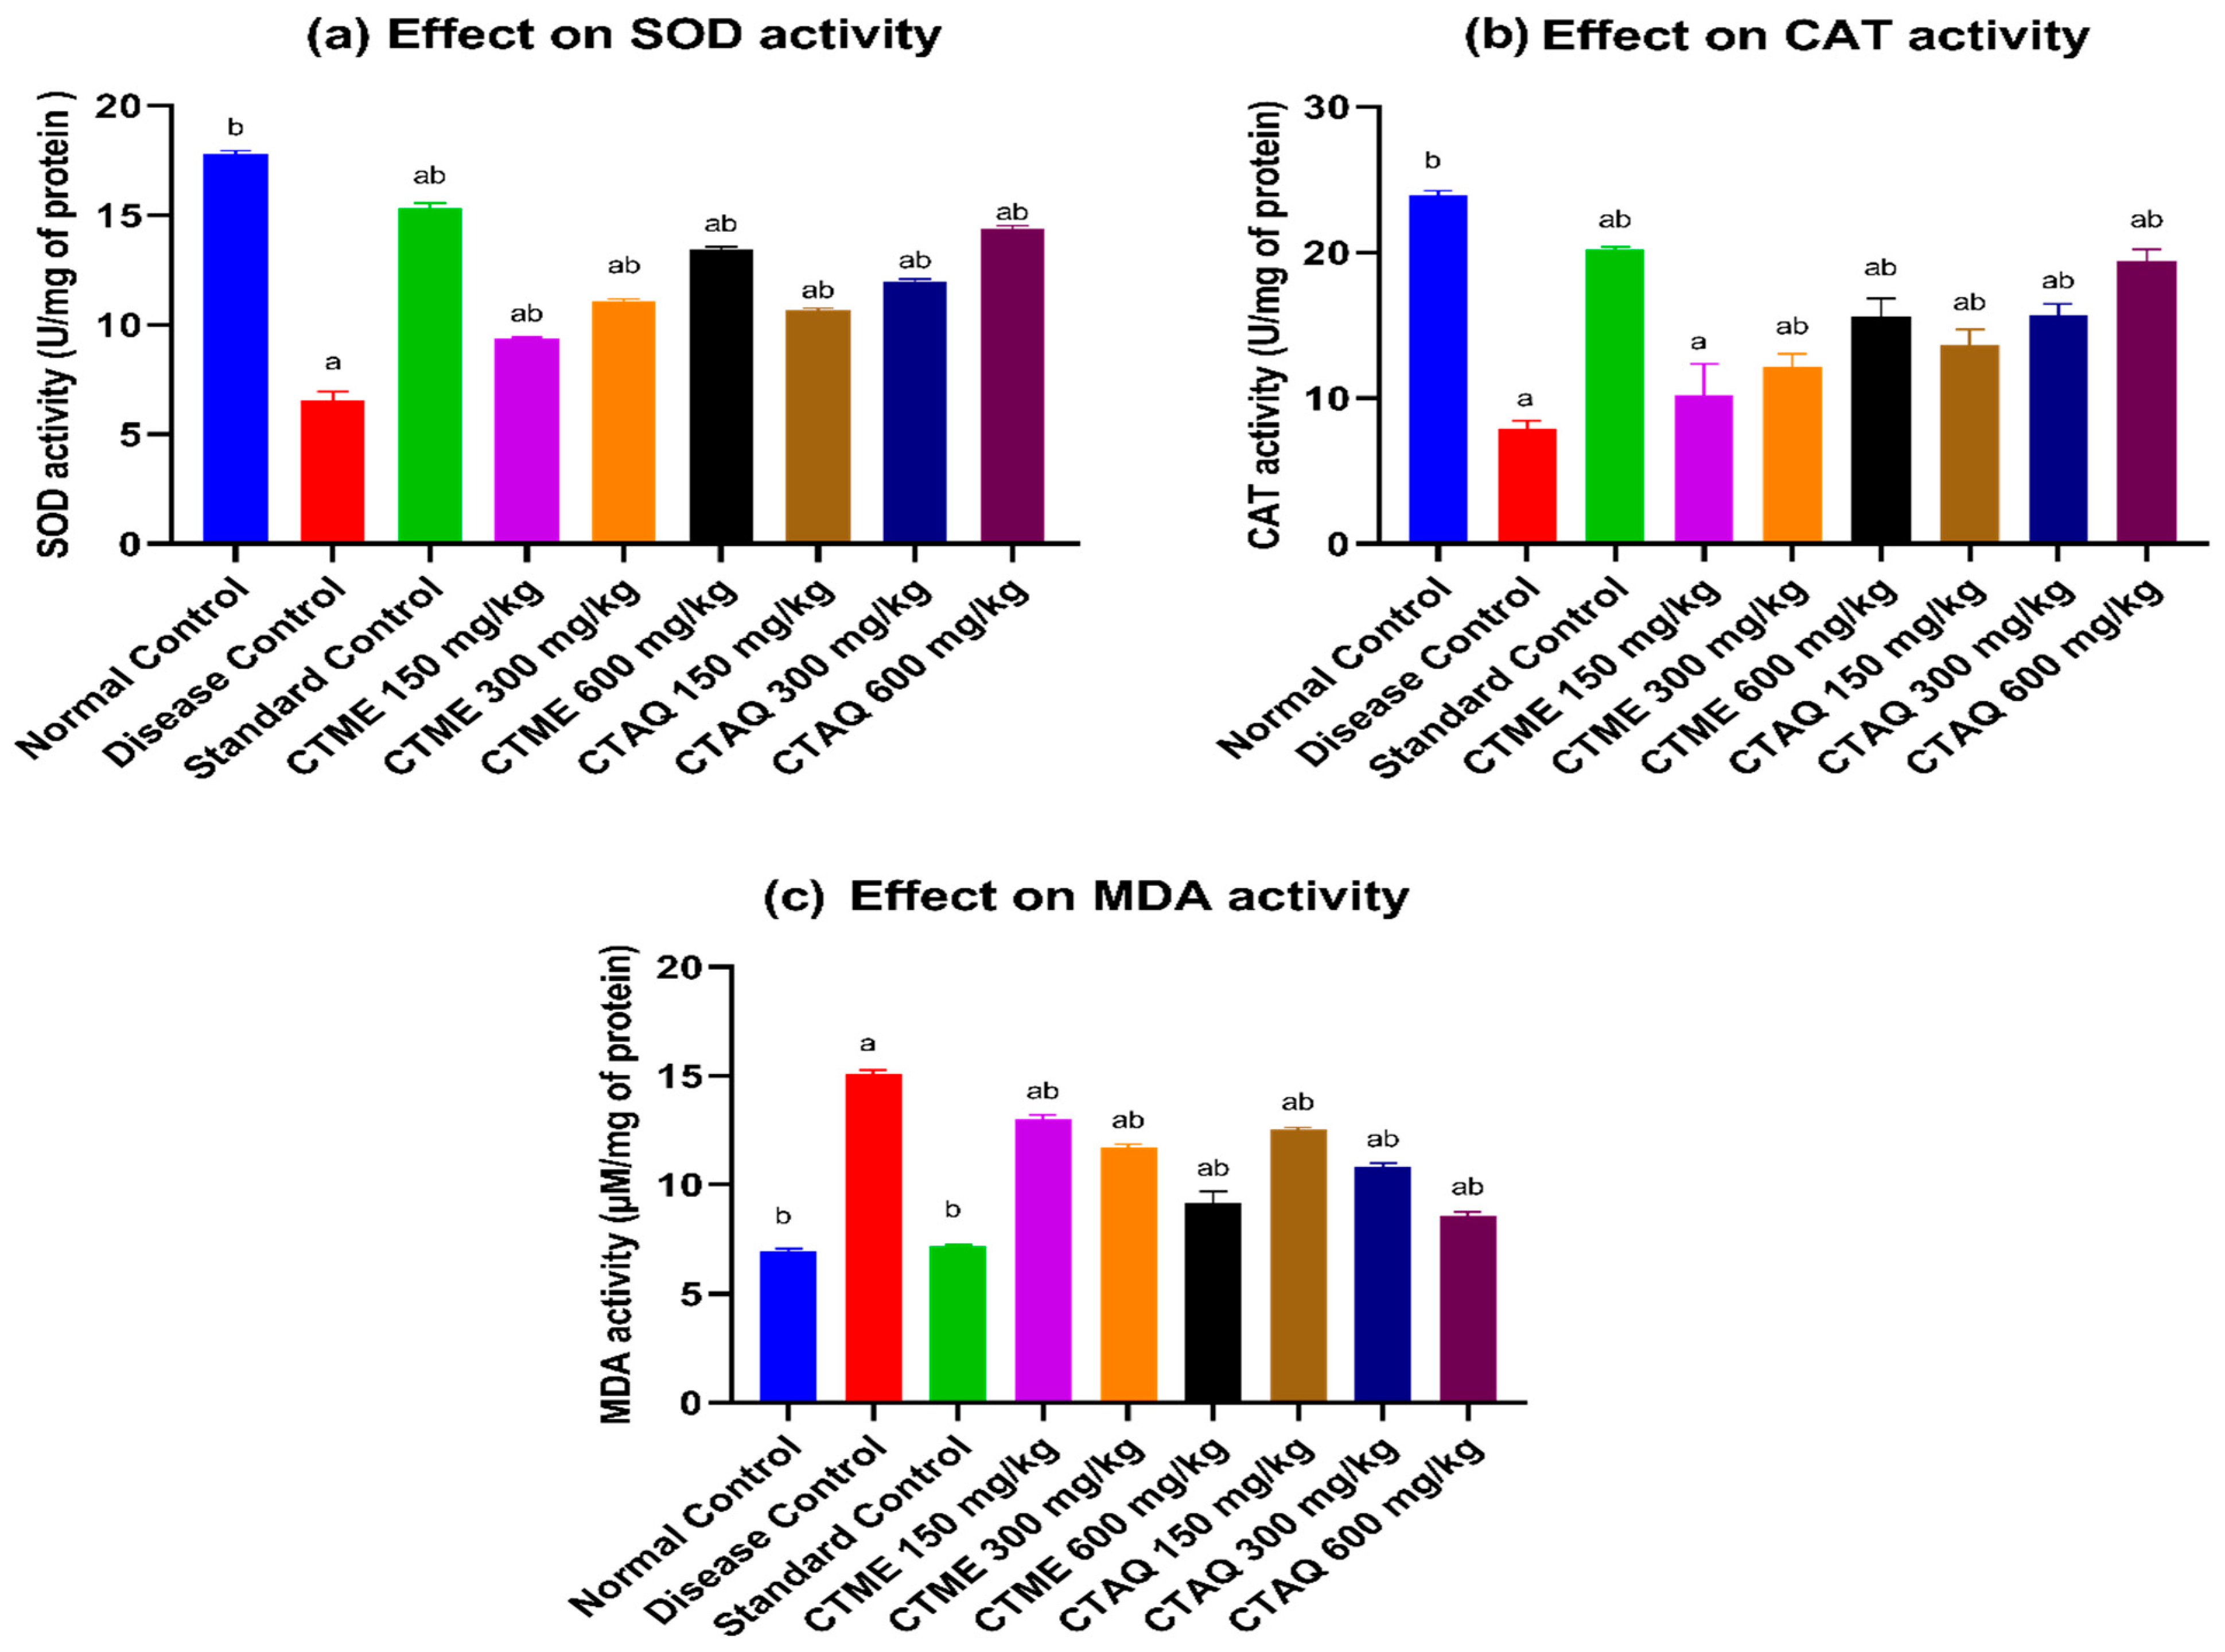
3.11. Effect on Oxidative Stress
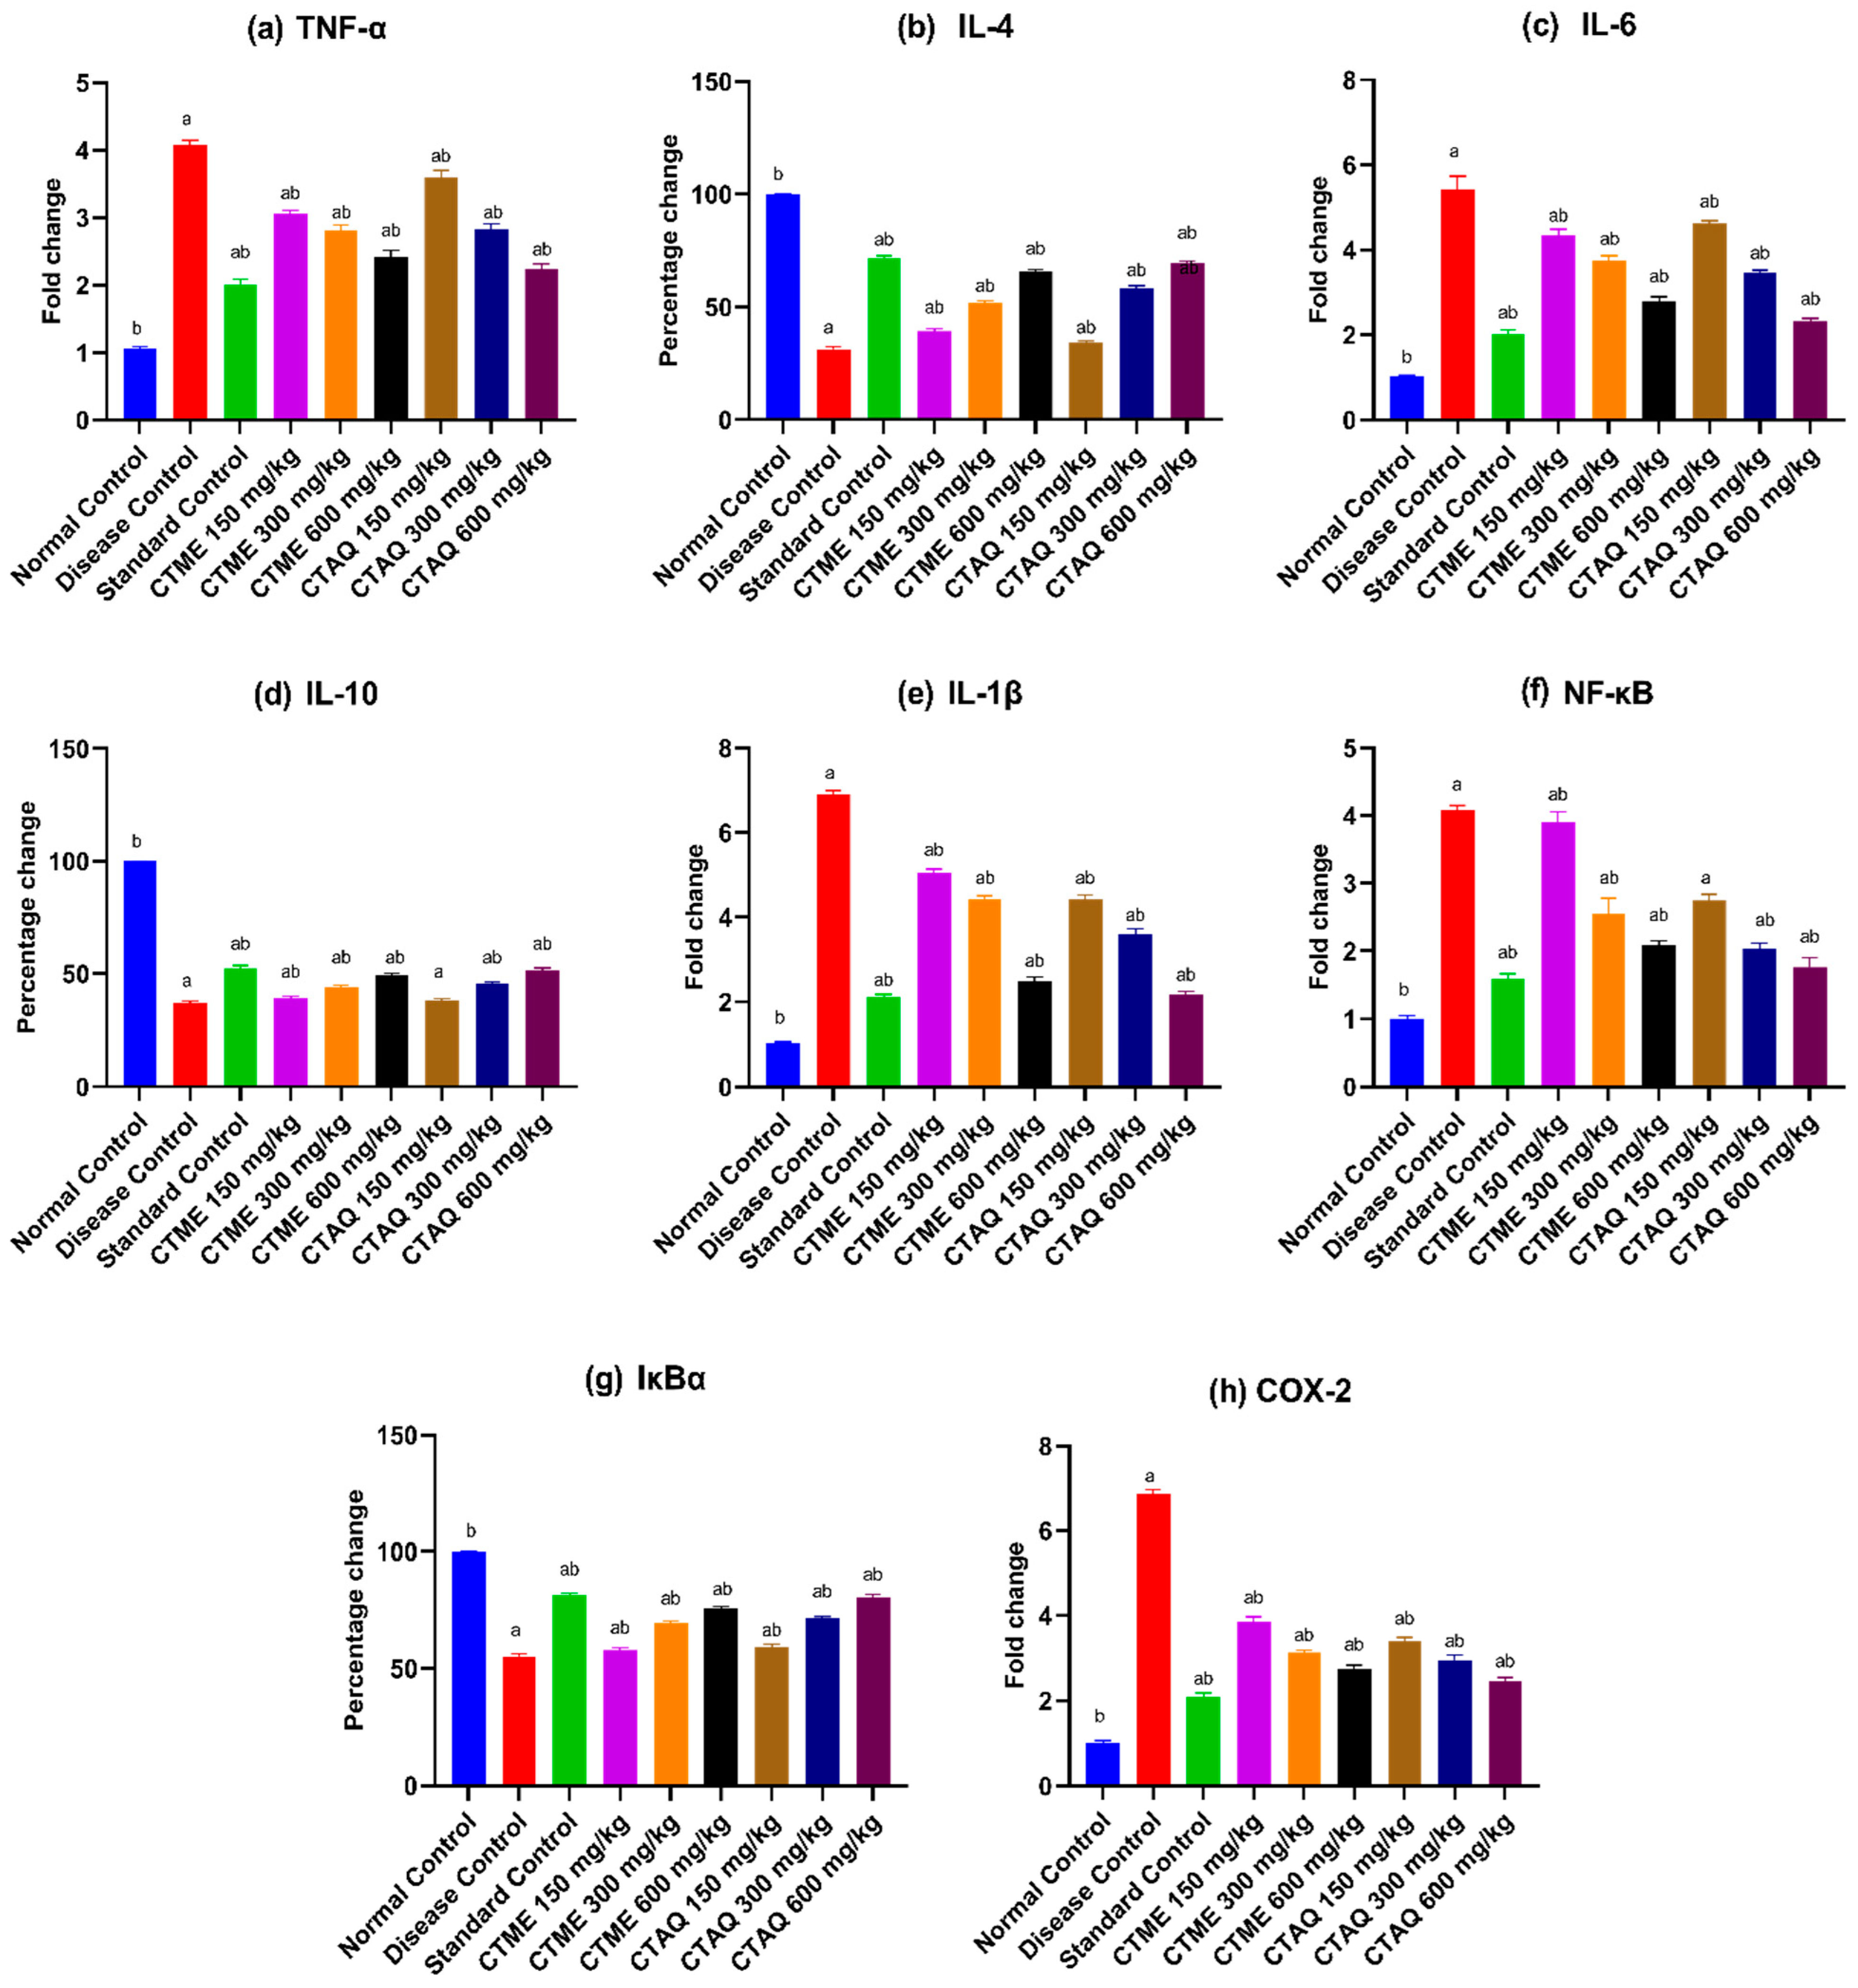
3.12. Effect on Gene Expression
4. Discussion
5. Conclusions
Author Contributions
Funding
Institutional Review Board Statement
Informed Consent Statement
Data Availability Statement
Conflicts of Interest
Sample Availability
References
- Bandyopadhyay, S.K. Arthritis-a review on two types. J. Am. Ceram. Soc. 2018, 92, 1153–1177. [Google Scholar]
- Rudan, I.; Sidhu, S.; Papana, A.; Meng, S.; Xin–Wei, Y.; Wang, W.; Campbell-Page, R.M.; Demaio, A.R.; Nair, H.; Sridhar, D.; et al. Prevalence of rheumatoid arthritis in low–and middle–income countries: A systematic review and analysis. J. Glob. Health 2015, 5, 010409. [Google Scholar] [CrossRef] [PubMed]
- Tobón, G.J.; Youinou, P.; Saraux, A. The environment, geo-epidemiology, and autoimmune disease: Rheumatoid arthritis. Autoimmun. Rev. 2010, 9, A288–A292. [Google Scholar] [CrossRef]
- Bugatti, S.; Manzo, A.; Montecucco, C.; Caporali, R.F. The clinical value of autoantibodies in rheumatoid arthritis. Front. Med. 2018, 5, 339. [Google Scholar] [CrossRef] [PubMed]
- Hoxha, M. A systematic review on the role of eicosanoid pathways in rheumatoid arthritis. Adv. Med. Sci. 2018, 63, 22–29. [Google Scholar] [CrossRef]
- Scherer, H.U.; Häupl, T.; Burmester, G.R. The etiology of rheumatoid arthritis. J. Autoimmun. 2020, 110, 102400. [Google Scholar] [CrossRef]
- Choy, E. Understanding the dynamics: Pathways involved in the pathogenesis of rheumatoid arthritis. Rheumatology 2012, 51 (Suppl. S5), v3–v11. [Google Scholar] [CrossRef]
- Gizinski, A.M.; Fox, D.A. T cell subsets and their role in the pathogenesis of rheumatic disease. Curr. Opin. Rheumatol. 2014, 26, 204–210. [Google Scholar] [CrossRef]
- Mir, N.T.; Saleem, U.; Anwar, F.; Ahmad, B.; Ullah, I.; Hira, S.; Ismail, T.; Ali, T.; Ayaz, M. Lawsonia Inermis markedly improves cognitive functions in animal models and modulate oxidative stress markers in the brain. Medicina 2019, 55, 192. [Google Scholar] [CrossRef]
- Lad, H.; Bhatnagar, D. Amelioration of oxidative and inflammatory changes by Swertia chirayita leaves in experimental arthritis. Inflammopharmacology 2016, 24, 363–375. [Google Scholar] [CrossRef]
- Oyeleke, S.A.; Ajayi, A.M.; Umukoro, S.; Aderibigbe, A.O.; Ademowo, O.G. Anti-inflammatory activity of Theobroma cacao L. stem bark ethanol extract and its fractions in experimental models. J. Ethnopharmacol. 2018, 222, 239–248. [Google Scholar] [CrossRef] [PubMed]
- Baig, M.W.; Ahmed, M.; Akhtar, N.; Okla, M.K.; Nasir, B.; Haq, I.U. Caralluma tuberculata NE Br Manifests Extraction Medium Reliant Disparity in Phytochemical and Pharmacological Analysis. Molecules 2021, 26, 7530. [Google Scholar] [CrossRef] [PubMed]
- Khan, M.A.; Maqsood, K.; Uslu, O.S. Caralluma tuberculate—An important medicinal plant to be conserved. Biol. Divers. Conserv. 2019, 12, 189–196. [Google Scholar] [CrossRef]
- Bibi, Y.; Tabassum, S.; Zahara, K.; Bashir, T.; Haider, S. Ethnomedicinal and pharmacological properties of Caralluma tuberculata NE Brown—A review. Pure Appl. Biol. 2015, 4, 503. [Google Scholar]
- Hussain, W.; Ullah, M.; Dastagir, G.; Badshah, L. Quantitative ethnobotanical appraisal of medicinal plants used by inhabitants of lower Kurram, Kurram agency, Pakistan. Avicenna J. Phytomedicine 2018, 8, 313. [Google Scholar]
- Haider, S.I.; Asif, A.; Rasheed, H.M.F.; Akram, A.; Jabeen, Q. Caralluma tuberculata exhibits analgesic and anti-arthritic potential by downregulating pro-inflammatory cytokines and attenuating oxidative stress. Inflammopharmacology 2022, 30, 621–638. [Google Scholar] [CrossRef]
- Saleem, A.; Saleem, M.; Akhtar, M.F. Antioxidant, anti-inflammatory and antiarthritic potential of Moringa oleifera Lam: An ethnomedicinal plant of Moringaceae family. S. Afr. J. Bot. 2020, 128, 246–256. [Google Scholar] [CrossRef]
- Rizwani, G.H.; Usmanghani, K.; Ahmad, M.; Ahmad, V.U. Flavone glycosides of Caralluma tuberculata NE Brown. Pak. J. Pharm. Sci. 1990, 3, 27–32. [Google Scholar]
- Abdel-Sattar, E.; Harraz, F.M.; Ghareib, S.A.; Elberry, A.A.; Gabr, S.; Suliaman, M.I. Antihyperglycaemic and hypolipidaemic effects of the methanolic extract of Caralluma tuberculata in streptozotocin-induced diabetic rats. Nat. Prod. Res. 2011, 25, 1171–1179. [Google Scholar] [CrossRef]
- Saleem, M.; Ali, H.A.; Akhtar, M.F.; Saleem, U.; Saleem, A.; Irshad, I. Chemical characterisation and hepatoprotective potential of Cosmos sulphureus Cav. and Cosmos bipinnatus Cav. Nat. Prod. Res. 2019, 33, 897–900. [Google Scholar] [CrossRef]
- Saleem, A.; Akhtar, M.F.; Latif, A.; Abdel-Daim, M.M.; Baig, M.M.F.A.; Saleem, M.; Mehmood, M.H. Chemical characterisation and appraisal of antidiabetic potential of Terminalia citrina extract in streptozotocin induced hyperglycaemia in Wistar rats. Arch. Physiol. Biochem. 2021, 1–14. [Google Scholar] [CrossRef] [PubMed]
- Saleem, A.; Saleem, M.; Akhtar, M.F.; Shahzad, M.; Jahan, S. Moringa rivae leaf extracts attenuate Complete Freund’s adjuvant-induced arthritis in Wistar rats via modulation of inflammatory and oxidative stress biomarkers. Inflammopharmacology 2020, 28, 139–151. [Google Scholar] [CrossRef] [PubMed]
- Ekambaram, S.; Perumal, S.S.; Subramanian, V. Evaluation of antiarthritic activity of Strychnos potatorum Linn seeds in Freund’s adjuvant induced arthritic rat model. BMC Complement. Altern. Med. 2010, 10, 56. [Google Scholar] [CrossRef]
- Snekhalatha, U.; Anburajan, M.; Venkatraman, B.; Menaka, M. Evaluation of complete Freund’s adjuvant-induced arthritis in a Wistar rat model. Z. Für Rheumatol. 2013, 72, 375–382. [Google Scholar] [CrossRef] [PubMed]
- Akhtar, M.F.; Ashraf, M.; Anjum, A.A.; Javeed, A.; Sharif, A.; Saleem, A.; Akhtar, B. Textile industrial effluent induces mutagenicity and oxidative DNA damage and exploits oxidative stress biomarkers in rats. Environ. Toxicol. Pharmacol. 2016, 41, 180–186. [Google Scholar] [CrossRef] [PubMed]
- Niamke, S.; Kouame, L.P.; Kouadio, J.P.; Koffi, D.; Faulet, B.M.; Dabonne, S. Effect of some chemicals on the accuracy of protein estimation by the Lowry method. Biokemistri 2005, 17, 73–81. [Google Scholar] [CrossRef]
- Bhangale, J.O.; Acharya, S.R. Anti-Parkinson activity of petroleum ether extract of Ficus religiosa (L.) leaves. Adv. Pharmacol. Sci. 2016, 2016, 9436106. [Google Scholar]
- Saleem, U.; Ahmad, B.; Ahmad, M.; Hussain, K.; Bukhari, N.I. Investigation of in vivo antioxidant activity of Euphorbia helioscopia latex and leaves methanol extract: A target against oxidative stress induced toxicity. Asian Pac. J. Trop. Med. 2014, 7, S369–S375. [Google Scholar] [CrossRef]
- Saleem, A.; Saleem, M.; Akhtar, M.F.; Shahzad, M.; Jahan, S. Polystichum braunii extracts inhibit Complete Freund’s adjuvant-induced arthritis via upregulation of I-κB, IL-4, and IL-10, downregulation of COX-2, PGE2, IL-1β, IL-6, NF-κB, and TNF-α, and subsiding oxidative stress. Inflammopharmacology 2020, 28, 1633–1648. [Google Scholar] [CrossRef]
- Zhang, Q.; Yu, Y.; Li, J.; Guan, Y.; Huang, J.; Wang, Z.; Zhang, Z.; Zhang, W.; Guo, J.; Li, J.; et al. Anti-arthritic activities of ethanol extracts of Circaea mollis Sieb. & Zucc. (whole plant) in rodents. J. Ethnopharmacol. 2018, 225, 359–366. [Google Scholar]
- Foyet, H.; Tsala, D.; Bodo, J.Z.E.; Carine, A.; Heroyne, L.; Oben, E. Anti-inflammatory and anti-arthritic activity of a methanol extract from Vitellaria paradoxa stem bark. Pharmacogn. Res. 2015, 7, 367. [Google Scholar] [CrossRef] [PubMed]
- Rauf, A.; Jan, M.; Rehman, W.; Muhammad, N. Phytochemical, phytotoxic and antioxidant profile of Caralluma tuberculata NE Brown. Wudpecker J. Pharm. Pharmacol. 2013, 2, 21–25. [Google Scholar]
- Hasan, U.H. Antiarthritic efficacy of Clematis orientalis. Bangladesh J. Pharmacol. 2018, 13, 142–148. [Google Scholar] [CrossRef]
- Thite, A.T.; Patil, R.R.; Naik, S.R. Anti-arthritic activity profile of methanolic extract of Ficus bengalensis: Comparison with some clinically effective drugs. Biomed. Aging Pathol. 2014, 4, 207–217. [Google Scholar] [CrossRef]
- Quintão, N.L.M.; Pastor, M.V.D.; Antonialli, C.D.-S.; da Silva, G.F.; Rocha, L.W.; Berté, T.E.; de Souza, M.M.; Meyre-Silva, C.; Lucinda-Silva, R.M.; Bresolin, T.M.B.; et al. Aleurites moluccanus and its main active constituent, the flavonoid 2″-O-rhamnosylswertisin, in experimental model of rheumatoid arthritis. J. Ethnopharmacol. 2019, 235, 248–254. [Google Scholar] [CrossRef]
- Rajkapoor, B.; Kavimani, S.; Ravichandiran, V.; Sekhar, K.; Kumar, R.S.; Kumar, M.R. Effect of Indigofera aspalathoides on complete Freund’s adjuvant-induced arthritis in rats. Pharm. Biol. 2009, 47, 553–557. [Google Scholar] [CrossRef]
- Arntz, O.J.; Pieters, B.C.H.; Thurlings, R.M.; Wenink, M.H.; van Lent, P.L.E.M.; Koenders, M.I.; Hoogen, F.H.J.V.D.; van der Kraan, P.M.; van de Loo, F.A.J. Rheumatoid arthritis patients with circulating extracellular vesicles positive for IgM rheumatoid factor have higher disease activity. Front. Immunol. 2018, 9, 2388. [Google Scholar] [CrossRef]
- Mbiantcha, M.; Almas, J.; Shabana, S.U.; Nida, D.; Aisha, F. Anti-arthritic property of crude extracts of Piptadeniastrum africanum (Mimosaceae) in complete Freund’s adjuvant-induced arthritis in rats. BMC Complement. Altern. Med. 2017, 17, 127–134. [Google Scholar] [CrossRef]
- Voon, F.L.; Sulaiman, M.R.; Akhtar, M.N.; Idris, M.F.; Akira, A.; Perimal, E.K. Cardamonin (2′, 4′-dihydroxy-6′-methoxychalcone) isolated from Boesenbergia rotunda (L.) Mansf. inhibits CFA-induced rheumatoid arthritis in rats. Eur. J. Pharmacol. 2017, 794, 127–134. [Google Scholar] [CrossRef]
- Lee, F.; Bae, K.H.; Ng, S.; Yamashita, A.; Kurisawa, M. Hyaluronic acid–green tea catechin conjugates as a potential therapeutic agent for rheumatoid arthritis. RSC Adv. 2021, 11, 14285–14294. [Google Scholar] [CrossRef]
- Abd Rani, N.Z.; Husain, K.; Kumolosasi, E. Moringa genus: A review of phytochemistry and pharmacology. Front. Pharmacol. 2018, 9, 108. [Google Scholar] [CrossRef] [PubMed]
- Noort, A.R.; Tak, P.P.; Tas, S.W. Non-canonical NF-κB signaling in rheumatoid arthritis: Dr Jekyll and Mr Hyde? Arthritis Res. Ther. 2015, 17, 15. [Google Scholar] [CrossRef] [PubMed]
- Verma, S.; De Jesus, P.; Chanda, S.K.; Verma, I.M. SNW1, a novel transcriptional regulator of the NF-κB pathway. Mol. Cell. Biol. 2019, 39, e00415–e00418. [Google Scholar] [CrossRef] [PubMed]
- Liu, T.; Zhang, L.; Joo, D.; Sun, S.C. NF-κB signaling in inflammation. Signal Transduct. Target. Ther. 2017, 2, 17023. [Google Scholar] [CrossRef] [PubMed]
- Korotkova, M.; Jakobsson, P.-J. Persisting eicosanoid pathways in rheumatic diseases. Nat. Rev. Rheumatol. 2014, 10, 229. [Google Scholar] [CrossRef]
- Rubab, M.; Chelliah, R.; Saravanakumar, K.; Barathikannan, K.; Wei, S.; Kim, J.-R.; Yoo, D.; Wang, M.-H.; Oh, D.-H. Bioactive Potential of 2-Methoxy-4-vinylphenol and Benzofuran from Brassica oleracea L. var. capitate f, rubra (Red Cabbage) on Oxidative and Microbiological Stability of Beef Meat. Foods 2020, 9, 568. [Google Scholar] [CrossRef]
- Nazrun, A.S.; Norazlina, M.; Norliza, M.; Nirwana, S.I. The anti-inflammatory role of vitamin E in prevention of osteoporosis. Adv. Pharmacol. Sci. 2011, 2012, 142702. [Google Scholar] [CrossRef]
- Garcia, M.D.; Saenz, M.T.; Gomez, M.A.; Fernández, M.A. Topical antiinflammatory activity of phytosterols isolated from Eryngium foetidum on chronic and acute inflammation models. Phytother. Res. Int. J. Devoted Pharmacol. Toxicol. Eval. Nat. Prod. Deriv. 1999, 13, 78–80. [Google Scholar]
- Vezza, T.; Canet, F.; De Marañón, A.M.; Bañuls, C.; Rocha, M.; Víctor, V.M. Phytosterols: Nutritional health players in the management of obesity and its related disorders. Antioxidants 2020, 9, 1266. [Google Scholar] [CrossRef]
- Yuan, L.; Zhang, F.; Shen, M.; Jia, S.; Xie, J. Phytosterols suppress phagocytosis and inhibit inflammatory mediators via ERK pathway on LPS-triggered inflammatory responses in RAW264. 7 macrophages and the correlation with their structure. Foods 2019, 8, 582. [Google Scholar] [CrossRef]
- Henry, G.E.; Momin, R.A.; Nair, M.G.; Dewitt, D.L. Antioxidant and cyclooxygenase activities of fatty acids found in food. J. Agric. Food Chem. 2002, 50, 2231–2234. [Google Scholar] [CrossRef] [PubMed]
- Kong, F.; Lee, B.H.; Wei, K. 5-hydroxymethylfurfural mitigates lipopolysaccharide-stimulated inflammation via suppression of MAPK, NF-κB and mTOR activation in RAW 264.7 cells. Molecules 2019, 24, 275. [Google Scholar] [CrossRef]
- Krishnamoorthy, K.; Subramaniam, P. Phytochemical profiling of leaf, stem, and tuber parts of Solena amplexicaulis (Lam.) Gandhi using GC-MS. Int. Sch. Res. Not. 2014, 2014, 567409. [Google Scholar]
- Madhuri, J.V.; Goteti, L.P. Molecular docking studies of Chenopodium album Linn with Lanosterol synthase enzyme. J. Appl. Nat. Sci. 2021, 13, 491–495. [Google Scholar] [CrossRef]
- Liu, K.; Zhang, X.; Xie, L.; Deng, M.; Chen, H.; Song, J.; Long, J.; Li, X.; Luo, J. Lupeol and its derivatives as anticancer and anti-inflammatory agents: Molecular mechanisms and therapeutic efficacy. Pharmacol. Res. 2021, 164, 105373. [Google Scholar] [CrossRef]


| CTME | Compound | Peak No. | Retention Time (min) | Area (mV.s) | Height | Concentration (ppm) |
| Catechin | 4 | 3.215 | 542,990.4 | 49,453.1 | 203.62 | |
| Gallic acid | 5 | 3.375 | 151,085.00 | 23,349.5 | 11.94 | |
| Caffeic acid | 7 | 7.694 | 1,330,149.4 | 165,364.3 | 43.23 | |
| Ferulic acid | 12 | 12.944 | 111,935.6 | 10,471.5 | 5.54 | |
| Quercetin | 17 | 24.735 | 583,585.5 | 46,390.1 | 55.44 |
| Peak No. | Peak Time (min) | Chemical Compound | Peak Area | Peak Area (%) |
|---|---|---|---|---|
| 1. | 5.010 | Butanenitrile, 2,3-dioxo-, dioxime, O,O’-diacetyl- | 1,481,878 | 0.33 |
| 2. | 5.234 | l-Guanidinosuccinimide | 2,666,278 | 0.59 |
| 3. | 5.400 | 3,4-Dihydroxybenzyl alcohol,tris(trimethylsilyl)- | 1,711,708 | 0.38 |
| 4. | 6.122 | N-Isobutyl-sec-butylamine | 4,454,248 | 0.98 |
| 5. | 7.149 | 5-Hydroxymethylfurfural | 3,075,712 | 0.68 |
| 5. | 9.091 | 2-Methoxy-4-vinylphenol | 2,013,622 | 0.44 |
| 7. | 9.856 | Ethane, 1,2-diethoxy- | 2,617,942 | 0.57 |
| 8. | 14.129 | 4-Methyl-2,5-dimethoxybenzaldehyde | 12,671,034 | 2.78 |
| 9. | 17.504 | Tetradecanoic acid | 2,845,228 | 0.62 |
| 10. | 18.542 | 2-Propenoic acid, 2-methyl-, 1-methylethyl ester | 1,936,230 | 0.43 |
| 11. | 18.900 | Dimethylphosphinacrylonitryl | 2,395,846 | 0.53 |
| 12. | 19.360 | Neophytadiene | 2,145,525 | 0.47 |
| 13. | 19.852 | D-Carvone | 2,247,263 | 0.49 |
| 14. | 20.125 | Hexadecanoic acid, methyl ester | 5,070,649 | 1.11 |
| 15. | 20.248 | 1-Propoxypropan-2-yl nonanoate | 20,180,612 | 4.43 |
| 16. | 20.377 | 3-Ethyl-4-methyl-3-heptanol | 1,495,429 | 0.33 |
| 17. | 20.837 | n-Hexadecanoic acid | 30,618,380 | 6.72 |
| 18. | 22.259 | Heptadecanoic acid | 2,723,170 | 0.60 |
| 19. | 22.693 | 10,13-Octadecadienoic acid, methyl ester | 4,406,647 | 0.97 |
| 20. | 22.784 | 9,12,15-Octadecatrienoic acid, methyl ester | 5,144,038 | 1.13 |
| 21. | 22.949 | Phytol | 15,955,953 | 3.50 |
| 22. | 23.404 | 9,12-Octadecadienoic acid (Z,Z)- | 17,972,849 | 3.95 |
| 23. | 23.490 | 9,17-Octadecadienal, (Z)- | 16,459,178 | 3.61 |
| 24. | 23.800 | Octadecanoic acid | 3,675,449 | 0.81 |
| 25. | 24.003 | 3-Buten-2-ol, 2,3-dimethyl- | 6,599,384 | 1.45 |
| 26. | 24.287 | Ethyl ether | 5,283,067 | 1.16 |
| 27. | 28.571 | Cyclohexadecane, 1,2-diethyl- | 1,575,111 | 0.35 |
| 28. | 28.913 | Glycerol 1-palmitate | 10,427,195 | 2.29 |
| 29. | 32.170 | 1,3,11-Dodecatriene | 6,174,131 | 1.36 |
| 30. | 32.802 | Myristoyl chloride | 1,730,016 | 0.38 |
| 31. | 32.903 | 3-Buten-2-ol, 2,3-dimethyl- | 3,430,046 | 0.75 |
| 32. | 33.625 | Silane, diethyldimethyl- | 11,604,735 | 2.55 |
| 33. | 33.957 | Pentanoic acid, 4-methyl-, methyl ester | 4,240,177 | 0.93 |
| 34. | 35.086 | Isopropyl myristate | 3,430,717 | 0.75 |
| 35. | 37.947 | (Z)-epi-.beta.-Santalol | 2,100,345 | 0.46 |
| 36. | 39.776 | γ -Tocopherol | 20,513,277 | 4.50 |
| 37. | 40.466 | 2-Amino-7-chloro-[1,3]thiazino [5,6-c]quinolin-4-one | 3,022,677 | 0.66 |
| 38. | 40.787 | Phenol, 2,6-di-t-butyl-4-methyl-3-nitro-, acetate(ester) | 1,899,459 | 0.42 |
| 39. | 42.146 | Vitamin E | 24,222,842 | 5.32 |
| 40. | 42.889 | Olean-12-en-3-ol, acetate, (3.beta.)- | 1,534,963 | 0.34 |
| 41. | 44.194 | Campesterol | 32,976,594 | 7.24 |
| 42. | 44.355 | Silane, dimethylnonyloxypropyloxy- | 5,280,442 | 1.16 |
| 43. | 44.836 | Stigmasterol | 23,213,212 | 5.10 |
| 44. | 46.484 | β-Sitosterol | 47,356,836 | 10.40 |
| 45. | 47.099 | β-Amyrin | 5,507,688 | 1.21 |
| 46. | 47.922 | Androst-5-en-17-ol, 4,4-dimethyl- | 11,314,420 | 2.48 |
| 47. | 48.356 | Lupeol | 18,854,916 | 4.14 |
| 48. | 49.618 | Lanosterol | 12,838,547 | 2.82 |
| Arthritic Index | Disease Control | Standard Control | CTME (mg/kg) | CTAQ (mg/kg) | ||||
|---|---|---|---|---|---|---|---|---|
| 150 | 300 | 600 | 150 | 300 | 600 | |||
| Pannus formation | 2.6 ± 0.54 | 0.8 ± 0.84 *** | 2.4 ± 0.55 ns | 2.2 ± 0.45 ns | 1.2 ± 0.84 ** | 1.8 ± 0.83 ns | 1.0 ± 0.71 ** | 0.6 ± 0.89 *** |
| Inflammation | 2.8 ± 0.44 | 1.2 ± 0.83 *** | 2.6 ± 0.54 ns | 1.8 ± 0.44 * | 1.6 ± 0.55 ** | 1.6 ± 0.55 ** | 1.4 ± 0.55 ** | 1.0 ± 0.71 **** |
| Bone erosion | 2.6 ± 0.55 | 0.4 ± 0.55 **** | 1.6 ± 1.14 ns | 1.2 ± 0.84 ** | 0.8 ± 0.45 *** | 1.2 ± 0.84 ** | 0.6 ± 0.54 *** | 0.4 ± 0.55 **** |
Publisher’s Note: MDPI stays neutral with regard to jurisdictional claims in published maps and institutional affiliations. |
© 2022 by the authors. Licensee MDPI, Basel, Switzerland. This article is an open access article distributed under the terms and conditions of the Creative Commons Attribution (CC BY) license (https://creativecommons.org/licenses/by/4.0/).
Share and Cite
Iftikhar, N.; Saleem, A.; Akhtar, M.F.; Abbas, G.; Shah, S.; Bibi, S.; Ashraf, G.M.; Alghamdi, B.S.; Abujamel, T.S. In Vitro and In Vivo Anti-Arthritic Potential of Caralluma tuberculata N. E. Brown. and Its Chemical Characterization. Molecules 2022, 27, 6323. https://doi.org/10.3390/molecules27196323
Iftikhar N, Saleem A, Akhtar MF, Abbas G, Shah S, Bibi S, Ashraf GM, Alghamdi BS, Abujamel TS. In Vitro and In Vivo Anti-Arthritic Potential of Caralluma tuberculata N. E. Brown. and Its Chemical Characterization. Molecules. 2022; 27(19):6323. https://doi.org/10.3390/molecules27196323
Chicago/Turabian StyleIftikhar, Nida, Ammara Saleem, Muhammad Furqan Akhtar, Ghulam Abbas, Shahid Shah, Shabana Bibi, Ghulam Md Ashraf, Badrah S. Alghamdi, and Turki S. Abujamel. 2022. "In Vitro and In Vivo Anti-Arthritic Potential of Caralluma tuberculata N. E. Brown. and Its Chemical Characterization" Molecules 27, no. 19: 6323. https://doi.org/10.3390/molecules27196323
APA StyleIftikhar, N., Saleem, A., Akhtar, M. F., Abbas, G., Shah, S., Bibi, S., Ashraf, G. M., Alghamdi, B. S., & Abujamel, T. S. (2022). In Vitro and In Vivo Anti-Arthritic Potential of Caralluma tuberculata N. E. Brown. and Its Chemical Characterization. Molecules, 27(19), 6323. https://doi.org/10.3390/molecules27196323