
Computational Prediction of Inhibitors and Inducers of the Major Isoforms of Cytochrome P450

 , ,
, , 
Abstract
:1. Introduction
2. Results
3. Discussion
4. Materials and Methods
4.1. ChEMBL and PubChem
4.2. GUSAR
4.3. PASS
Supplementary Materials
Author Contributions
Funding
Institutional Review Board Statement
Informed Consent Statement
Data Availability Statement
Acknowledgments
Conflicts of Interest
Sample Availability
References
- Lyubimov, A.V. Encyclopedia of Drug Metabolism and Interactions; Wiley: Hoboken, NJ, USA, 2012. [Google Scholar]
- Rendic, S.; Guengerich, F.P. Survey of human oxidoreductases and cytochrome P450 enzymes involved in the metabolism of xenobiotic and natural chemicals. Chem. Res. Toxicol. 2015, 28, 38–42. [Google Scholar] [CrossRef] [PubMed]
- Fulton, M.M.; Allen, E.R. Practice Polypharmacy in the Elderly: A Literature Review. J. Am. Acad. Nurse Pract. 2005, 17, 123–132. [Google Scholar] [CrossRef] [PubMed]
- Hakkola, J.; Hukkanen, J.; Turpeinen, M.; Pelkonen, O. Inhibition and Induction of CYP Enzymes in Humans: An Update. Arch. Toxicol. 2020, 94, 3671–3722. [Google Scholar] [CrossRef] [PubMed]
- Tornio, A.; Filppula, A.M.; Niemi, M.; Backman, J.T. Clinical Studies on Drug–Drug Interactions Involving Metabolism and Transport : Methodology, Pitfalls, and Interpretation. Clin. Pharmacol. Ther. 2019, 105, 1345–1361. [Google Scholar] [CrossRef] [PubMed]
- In Vitro Drug Interaction Studies—Cytochrome P450 Enzyme- and Transporter-Mediated Drug Interactions, Guidance for Industry. 2020. Available online: https://www.fda.gov/media/134582/download (accessed on 16 August 2022).
- Dmitriev, A.V.; Lagunin, A.A.; Karasev, D.A.; Rudik, A.V.; Pogodin, P.V.; Filimonov, D.A.; Poroikov, V.V. Prediction of Drug-Drug Interactions Related to Inhibition or Induction of Drug-Metabolizing Enzymes. Curr. Top. Med. Chem. 2019, 19, 319–336. [Google Scholar] [CrossRef]
- Web-Based Application for Predicting ADME Data. Available online: https://preadmet.bmdrc.kr/adme/ (accessed on 16 August 2022).
- Pires, D.E.V.; Blundell, T.L.; Ascher, D.B. pkCSM: Predicting Small-Molecule Pharmacokinetic and Toxicity Properties Using Graph-Based Signatures. J. Med. Chem. 2015, 58, 4066–4072. [Google Scholar] [CrossRef]
- Daina, A.; Michielin, O.; Zoete, V. SwissADME : A free web tool to evaluate pharmacokinetics, drug-likeness and medicinal chemistry friendliness of small molecules. Sci. Rep. 2017, 7, 42717. [Google Scholar] [CrossRef] [PubMed]
- Rostkowski, M.; Spjuth, O.; Rydberg, P. WhichCYP : Prediction of cytochromes P450 inhibition. Bioinformatics 2013, 29, 2051–2052. [Google Scholar] [CrossRef] [PubMed]
- Plonka, W.; Stork, C.; Sícho, M.; Kirchmair, J. CYPlebrity: Machine learning models for the prediction of inhibitors of cytochrome P450 enzymes. Bioorg. Med. Chem. 2021, 46, 116388. [Google Scholar] [CrossRef] [PubMed]
- Schyman, P.; Liu, R.; Desai, V.; Wallqvist, A. vNN Web Server for ADMET Predictions. Front. Pharmacol. 2017, 8, 889. [Google Scholar] [CrossRef] [PubMed] [Green Version]
- Yang, H.; Lou, C.; Sun, L.; Li, J.; Cai, Y.; Li, W.; Liu, G.; Tang, Y. admetSAR 2.0: Web-service for prediction and optimization of chemical ADMET properties. Bioinformatics 2018, 35, 2016–2017. [Google Scholar] [CrossRef] [PubMed]
- Banerjee, P.; Dunkel, M.; Kemmler, E.; Preissner, R. SuperCYPsPred—A web server for the prediction of cytochrome activity. Nucleic Acids Res. 2020, 48, W580–W585. [Google Scholar] [CrossRef] [PubMed]
- Filimonov, D.A.; Zakharov, A.V.; Lagunin, A.A.; Poroikov, V.V. QNA-based “Star Track” QSAR approach. SAR QSAR Environ. Res. 2009, 20, 679–709. [Google Scholar] [CrossRef] [PubMed]
- Filimonov, D.A.; Druzhilovskiy, D.S.; Lagunin, A.A.; Gloriozova, T.A.; Rudik, A.V.; Dmitriev, A.V.; Pogodin, P.V.; Poroikov, V.V. Computer-aided prediction of biological activity spectra for chemical compounds: Opportunities and limitation. Biomed. Chem. Res. Methods 2018, 1, e00004. [Google Scholar] [CrossRef]
- Smajić, A.; Grandits, M.; Ecker, G.F. Using Jupyter Notebooks for re-training machine learning models. J. Cheminform. 2022, 14, 54. [Google Scholar] [CrossRef] [PubMed]
- Table of Substrates, Inhibitors and Inducers. Available online: https://www.fda.gov/drugs/drug-interactions-labeling/drug-development-and-drug-interactions-table-substrates-inhibitors-and-inducers (accessed on 16 August 2022).
- National Center for Biotechnology Information. PubChem Bioassay Record for AID 1851, Cytochrome Panel Assay with Activity Outcomes, Source: National Center for Advancing Translational Sciences (NCATS). Available online: https://pubchem.ncbi.nlm.nih.gov/bioassay/1851 (accessed on 16 August 2022).
- Lagunin, A.; Zakharov, A.; Filimonov, D.; Poroikov, V. QSAR Modelling of Rat Acute Toxicity on the Basis of PASS Prediction. Mol. Inform. 2011, 30, 241–250. [Google Scholar] [CrossRef]
- Zakharov, A.V.; Peach, M.L.; Sitzmann, M.; Nicklaus, M.C. A New Approach to Radial Basis Function Approximation and Its Application to QSAR. J. Chem. Inf. Model. 2014, 54, 713–719. [Google Scholar] [CrossRef]
- Zakharov, A.V.; Peach, M.L.; Sitzmann, M.; Nicklaus, M.C. QSAR Modeling of Imbalanced High-Throughput Screening Data in PubChem. J. Chem. Inf. Model. 2014, 54, 705–712. [Google Scholar] [CrossRef] [PubMed]
- Lagunin, A.; Rudik, A.; Druzhilovsky, D.; Filimonov, D.; Poroikov, V. ROSC-Pred: Web-service for rodent organ-specific carcinogenicity prediction. Bioinformatics 2018, 34, 710–712. [Google Scholar] [CrossRef] [PubMed] [Green Version]


| CYP | Ncmp | Interval of Values, pIC50 | Mean Value, pIC50 | Nmdls | Training Sets | 5-Fold-CV | ||||
|---|---|---|---|---|---|---|---|---|---|---|
| R2 | Q2 | SD | R2 | RMSE | AD, % | |||||
| 1A2 | 1216 | [1.6:8.8] | 5.47 | 65 | 0.999 | 0.680 | 0.625 | 0.614 | 0.682 | 99.4 |
| 2C9 | 1657 | [1.5:9.0] | 5.28 | 72 | 0.994 | 0.609 | 0.512 | 0.508 | 0.565 | 95.6 |
| 2C19 | 930 | [2.8:8.3] | 5.16 | 68 | 0.992 | 0.501 | 0.519 | 0.348 | 0.588 | 99.0 |
| 2D6 | 1588 | [1.2:9.2] | 5.32 | 59 | 0.972 | 0.566 | 0.567 | 0.480 | 0.619 | 97.1 |
| 3A4 | 3299 | [1.4:10.3] | 5.39 | 89 | 0.992 | 0.640 | 0.528 | 0.589 | 0.562 | 98.2 |
| CYP | ChEMBL | PubChem | Total | |||
|---|---|---|---|---|---|---|
| LOO CV | 20-Fold CV | LOO CV | 20-Fold CV | LOO CV | 20-Fold CV | |
| 1A2 | 0.884 | 0.884 | 0.937 | 0.937 | 0.923 | 0.922 |
| 2D6 | 0.873 | 0.873 | 0.861 | 0.861 | 0.891 | 0.891 |
| 2C9 | 0.827 | 0.826 | 0.875 | 0.875 | 0.855 | 0.854 |
| 2C19 | 0.816 | 0.813 | 0.879 | 0.878 | 0.856 | 0.856 |
| 3A4 | 0.845 | 0.845 | 0.896 | 0.895 | 0.871 | 0.870 |
| Activities | Npos | IAP, LOO CV | IAP, 20-Fold CV |
|---|---|---|---|
| 1A2 inducer | 26 | 0.907 | 0.905 |
| 2C9 inducer | 28 | 0.846 | 0.846 |
| 2C19 inducer | 8 | 0.840 | 0.839 |
| 2D6 * inducer | 4 | 0.604 | - |
| 3A4 inducer | 78 | 0.893 | 0.879 |
| CYP | ChEMBL | PubChem | Total | |||
|---|---|---|---|---|---|---|
| Npos | Nneg | Npos | Nneg | Npos | Nneg | |
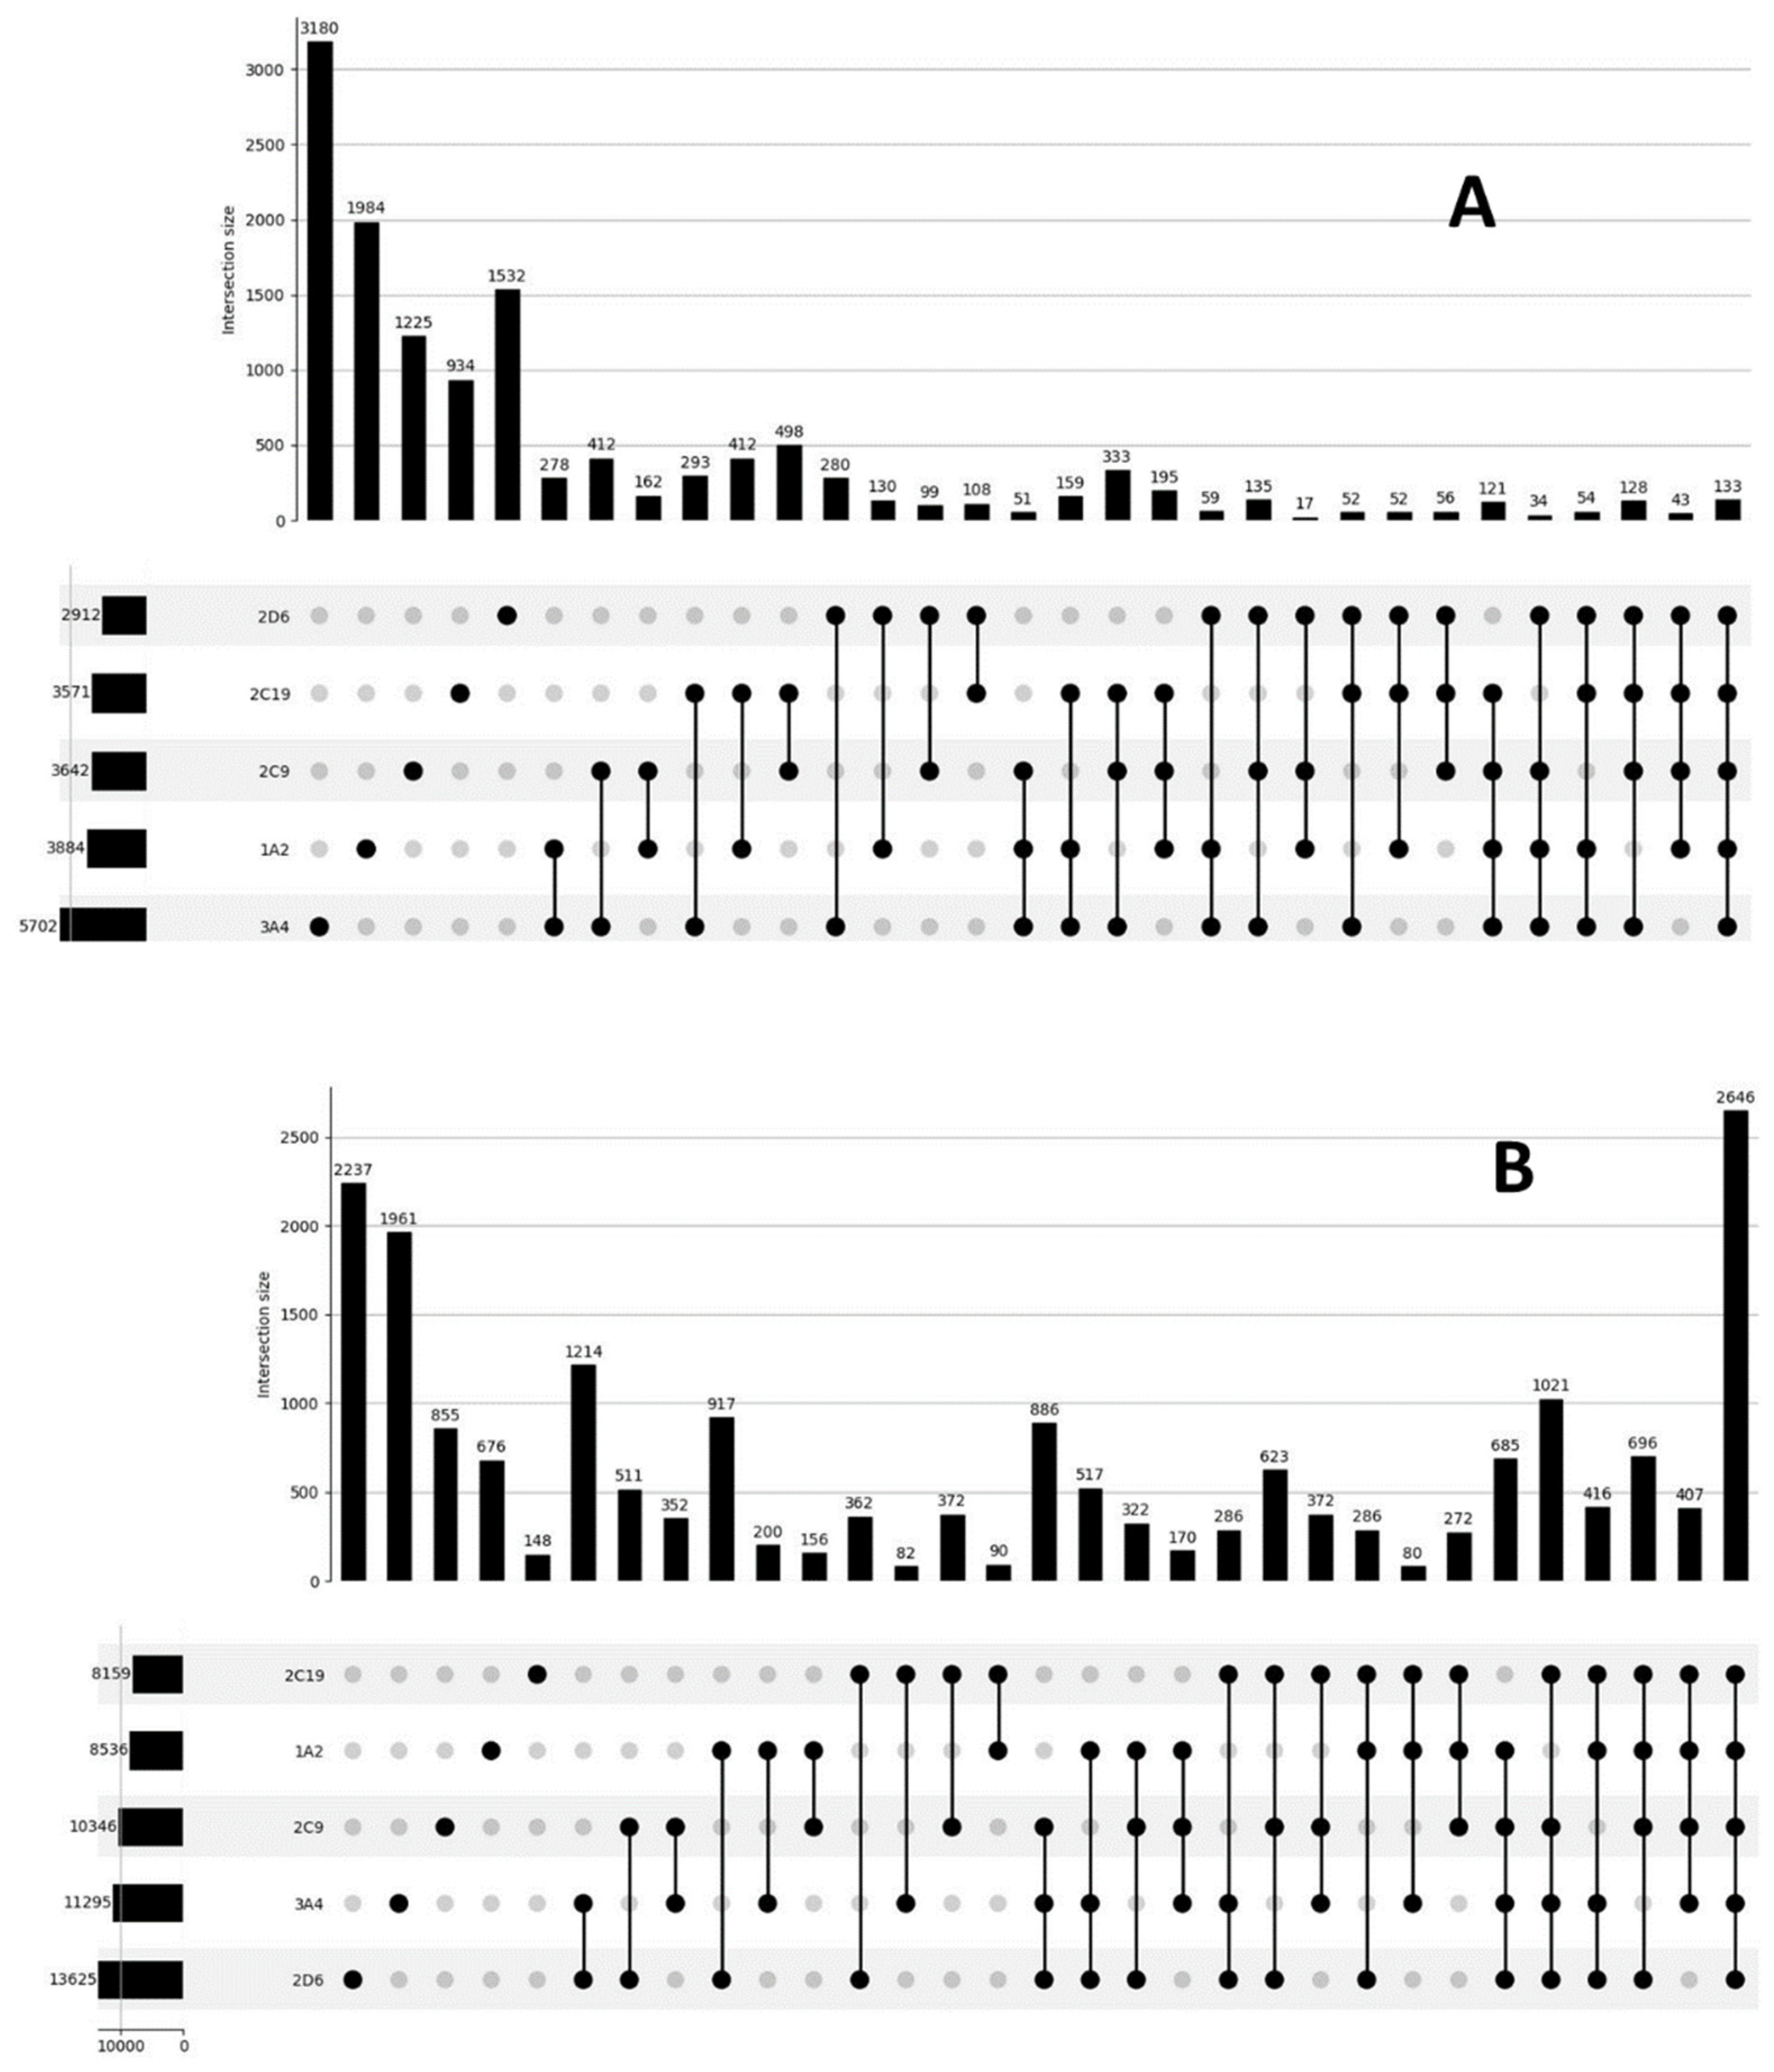
| 1A2 | 1098 | 2183 | 2035 | 3680 | 3141 | 8536 |
| 2D6 | 1955 | 3414 | 999 | 10,249 | 2912 | 13,625 |
| 2C9 | 2074 | 2750 | 1586 | 7635 | 3642 | 10,346 |
| 2C19 | 1050 | 1706 | 2538 | 6484 | 3571 | 8159 |
| 3A4 | 3836 | 4501 | 1890 | 6829 | 5702 | 11,295 |
Publisher’s Note: MDPI stays neutral with regard to jurisdictional claims in published maps and institutional affiliations. |
© 2022 by the authors. Licensee MDPI, Basel, Switzerland. This article is an open access article distributed under the terms and conditions of the Creative Commons Attribution (CC BY) license (https://creativecommons.org/licenses/by/4.0/).
Share and Cite
Rudik, A.; Dmitriev, A.; Lagunin, A.; Filimonov, D.; Poroikov, V. Computational Prediction of Inhibitors and Inducers of the Major Isoforms of Cytochrome P450. Molecules 2022, 27, 5875. https://doi.org/10.3390/molecules27185875
Rudik A, Dmitriev A, Lagunin A, Filimonov D, Poroikov V. Computational Prediction of Inhibitors and Inducers of the Major Isoforms of Cytochrome P450. Molecules. 2022; 27(18):5875. https://doi.org/10.3390/molecules27185875
Chicago/Turabian StyleRudik, Anastassia, Alexander Dmitriev, Alexey Lagunin, Dmitry Filimonov, and Vladimir Poroikov. 2022. "Computational Prediction of Inhibitors and Inducers of the Major Isoforms of Cytochrome P450" Molecules 27, no. 18: 5875. https://doi.org/10.3390/molecules27185875
APA StyleRudik, A., Dmitriev, A., Lagunin, A., Filimonov, D., & Poroikov, V. (2022). Computational Prediction of Inhibitors and Inducers of the Major Isoforms of Cytochrome P450. Molecules, 27(18), 5875. https://doi.org/10.3390/molecules27185875