
Effects of the Calix[4]arene Derivative Compound OTX008 on High Glucose-Stimulated ARPE-19 Cells: Focus on Galectin-1/TGF-β/EMT Pathway

 ,
,  ,
, 
 ,
,  , and
, and 
Abstract
:1. Introduction
2. Results
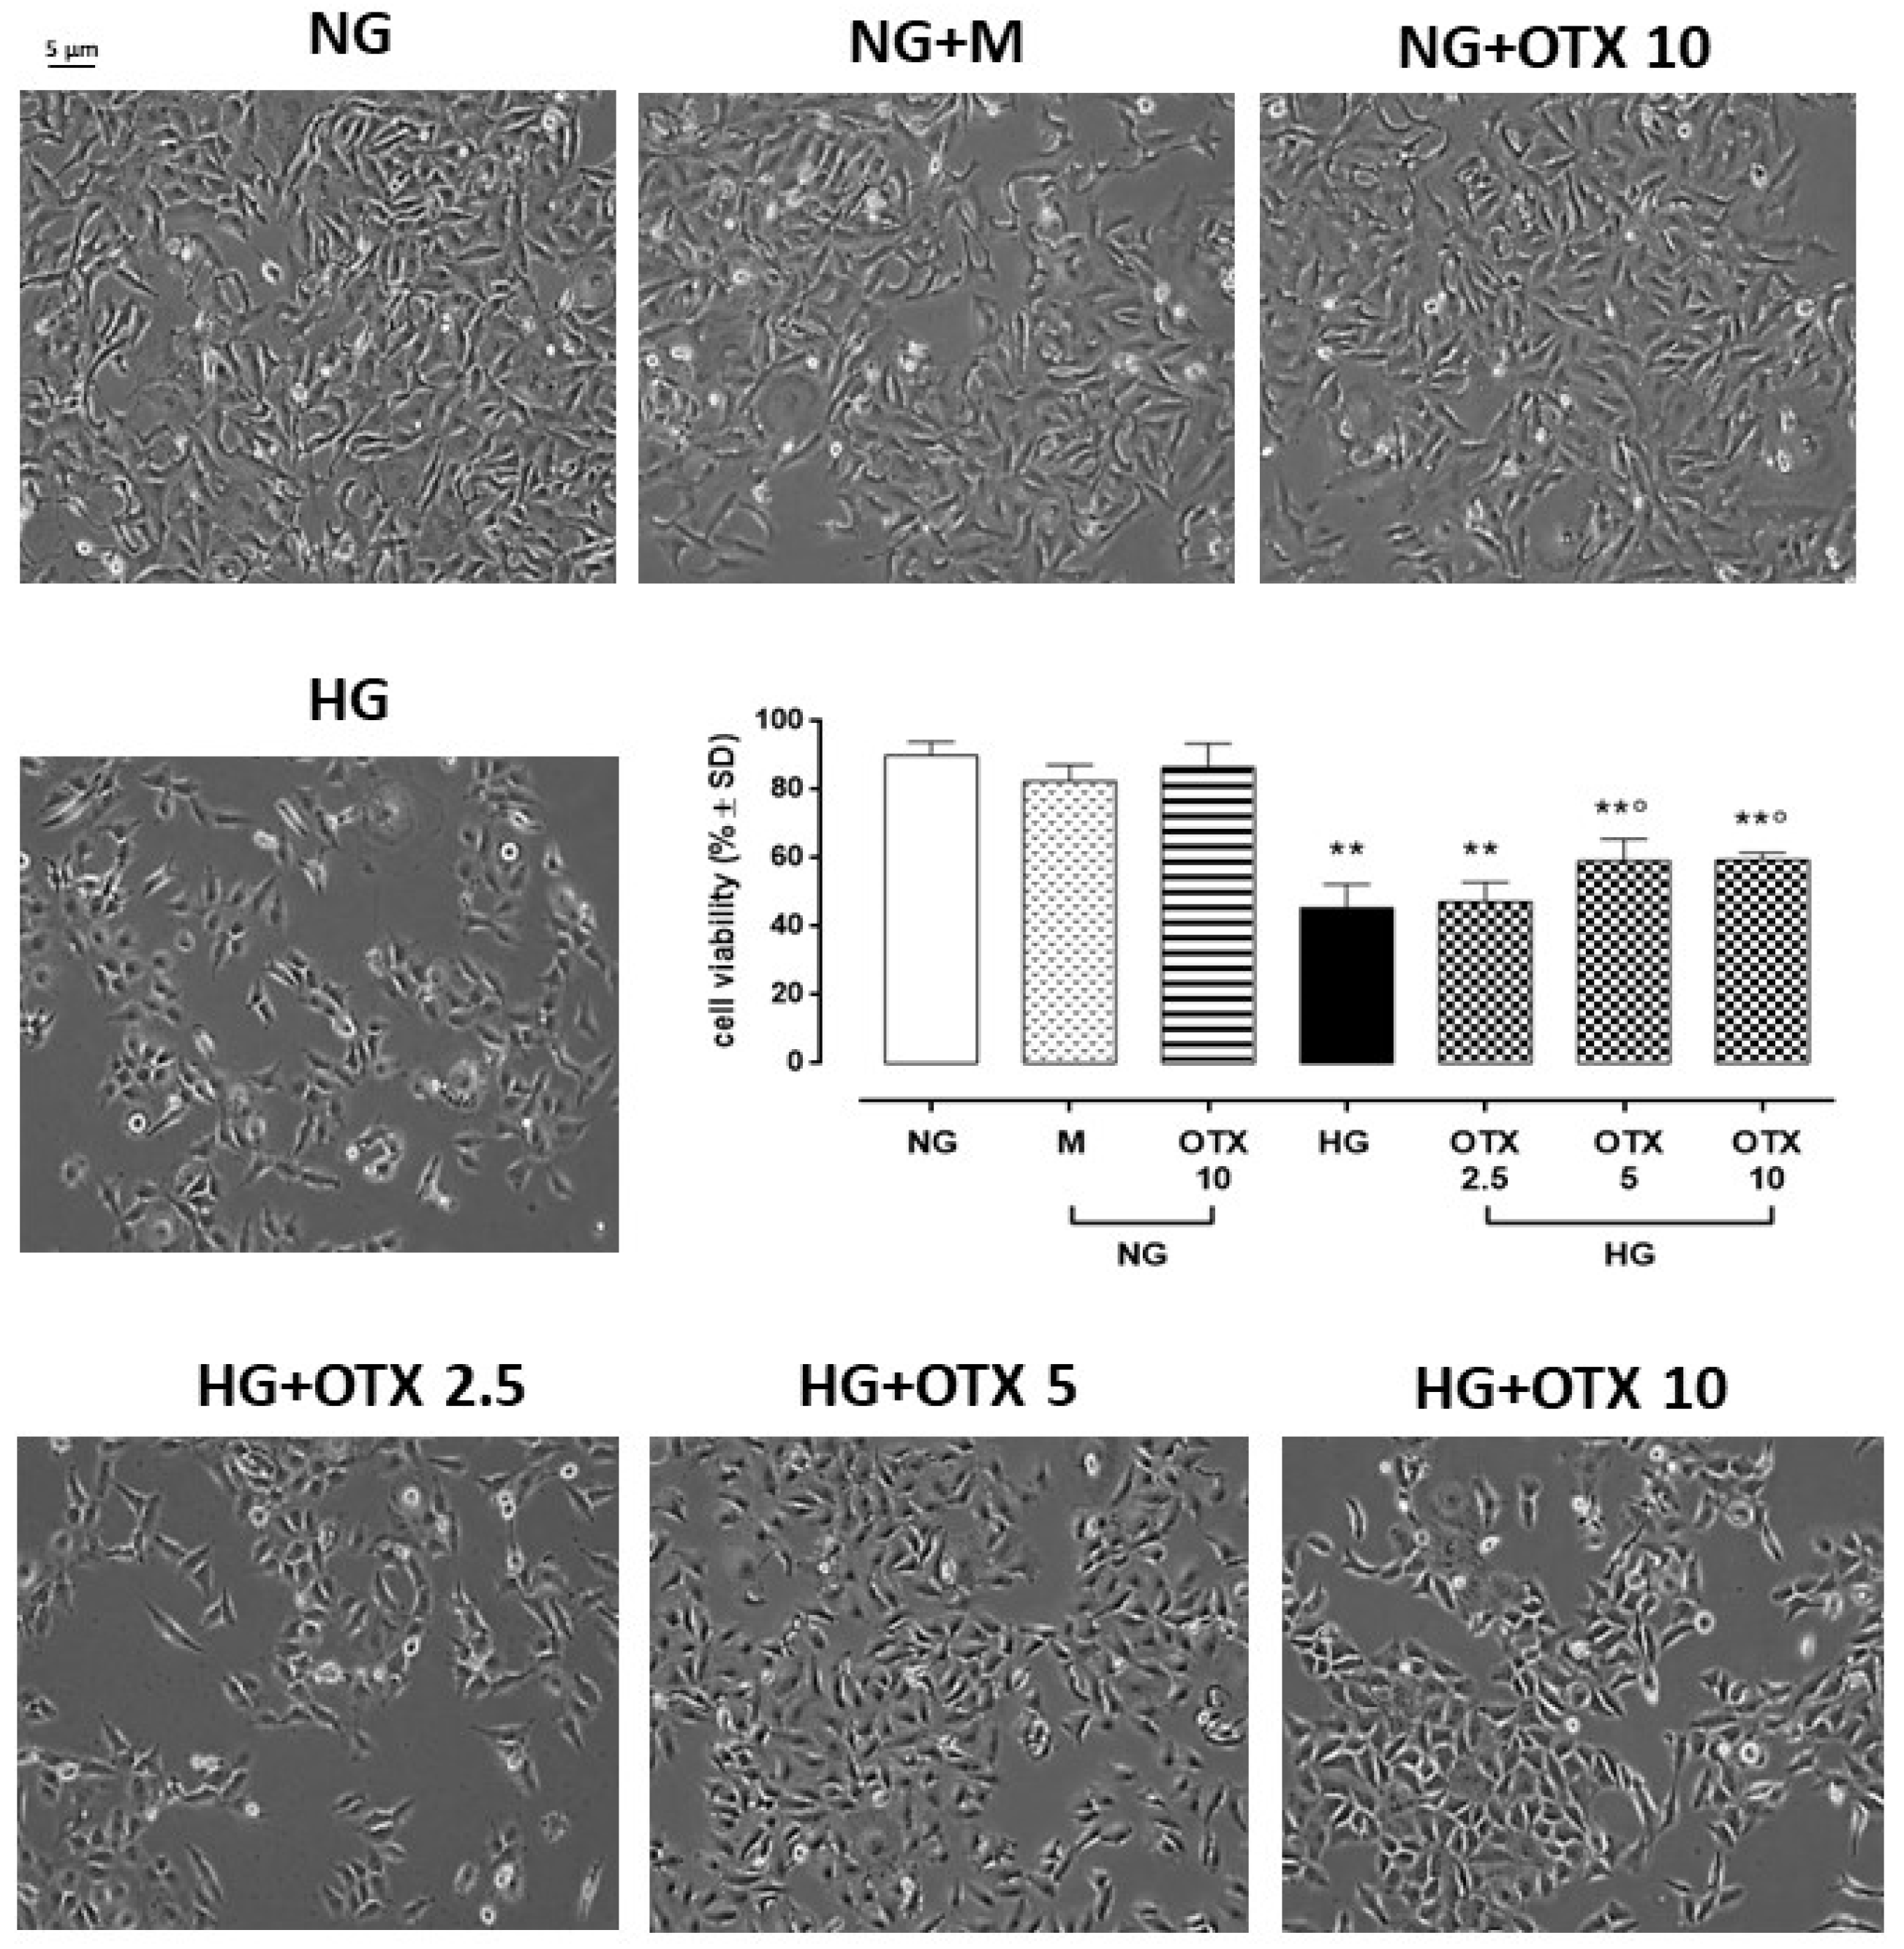
2.1. Cell Viability
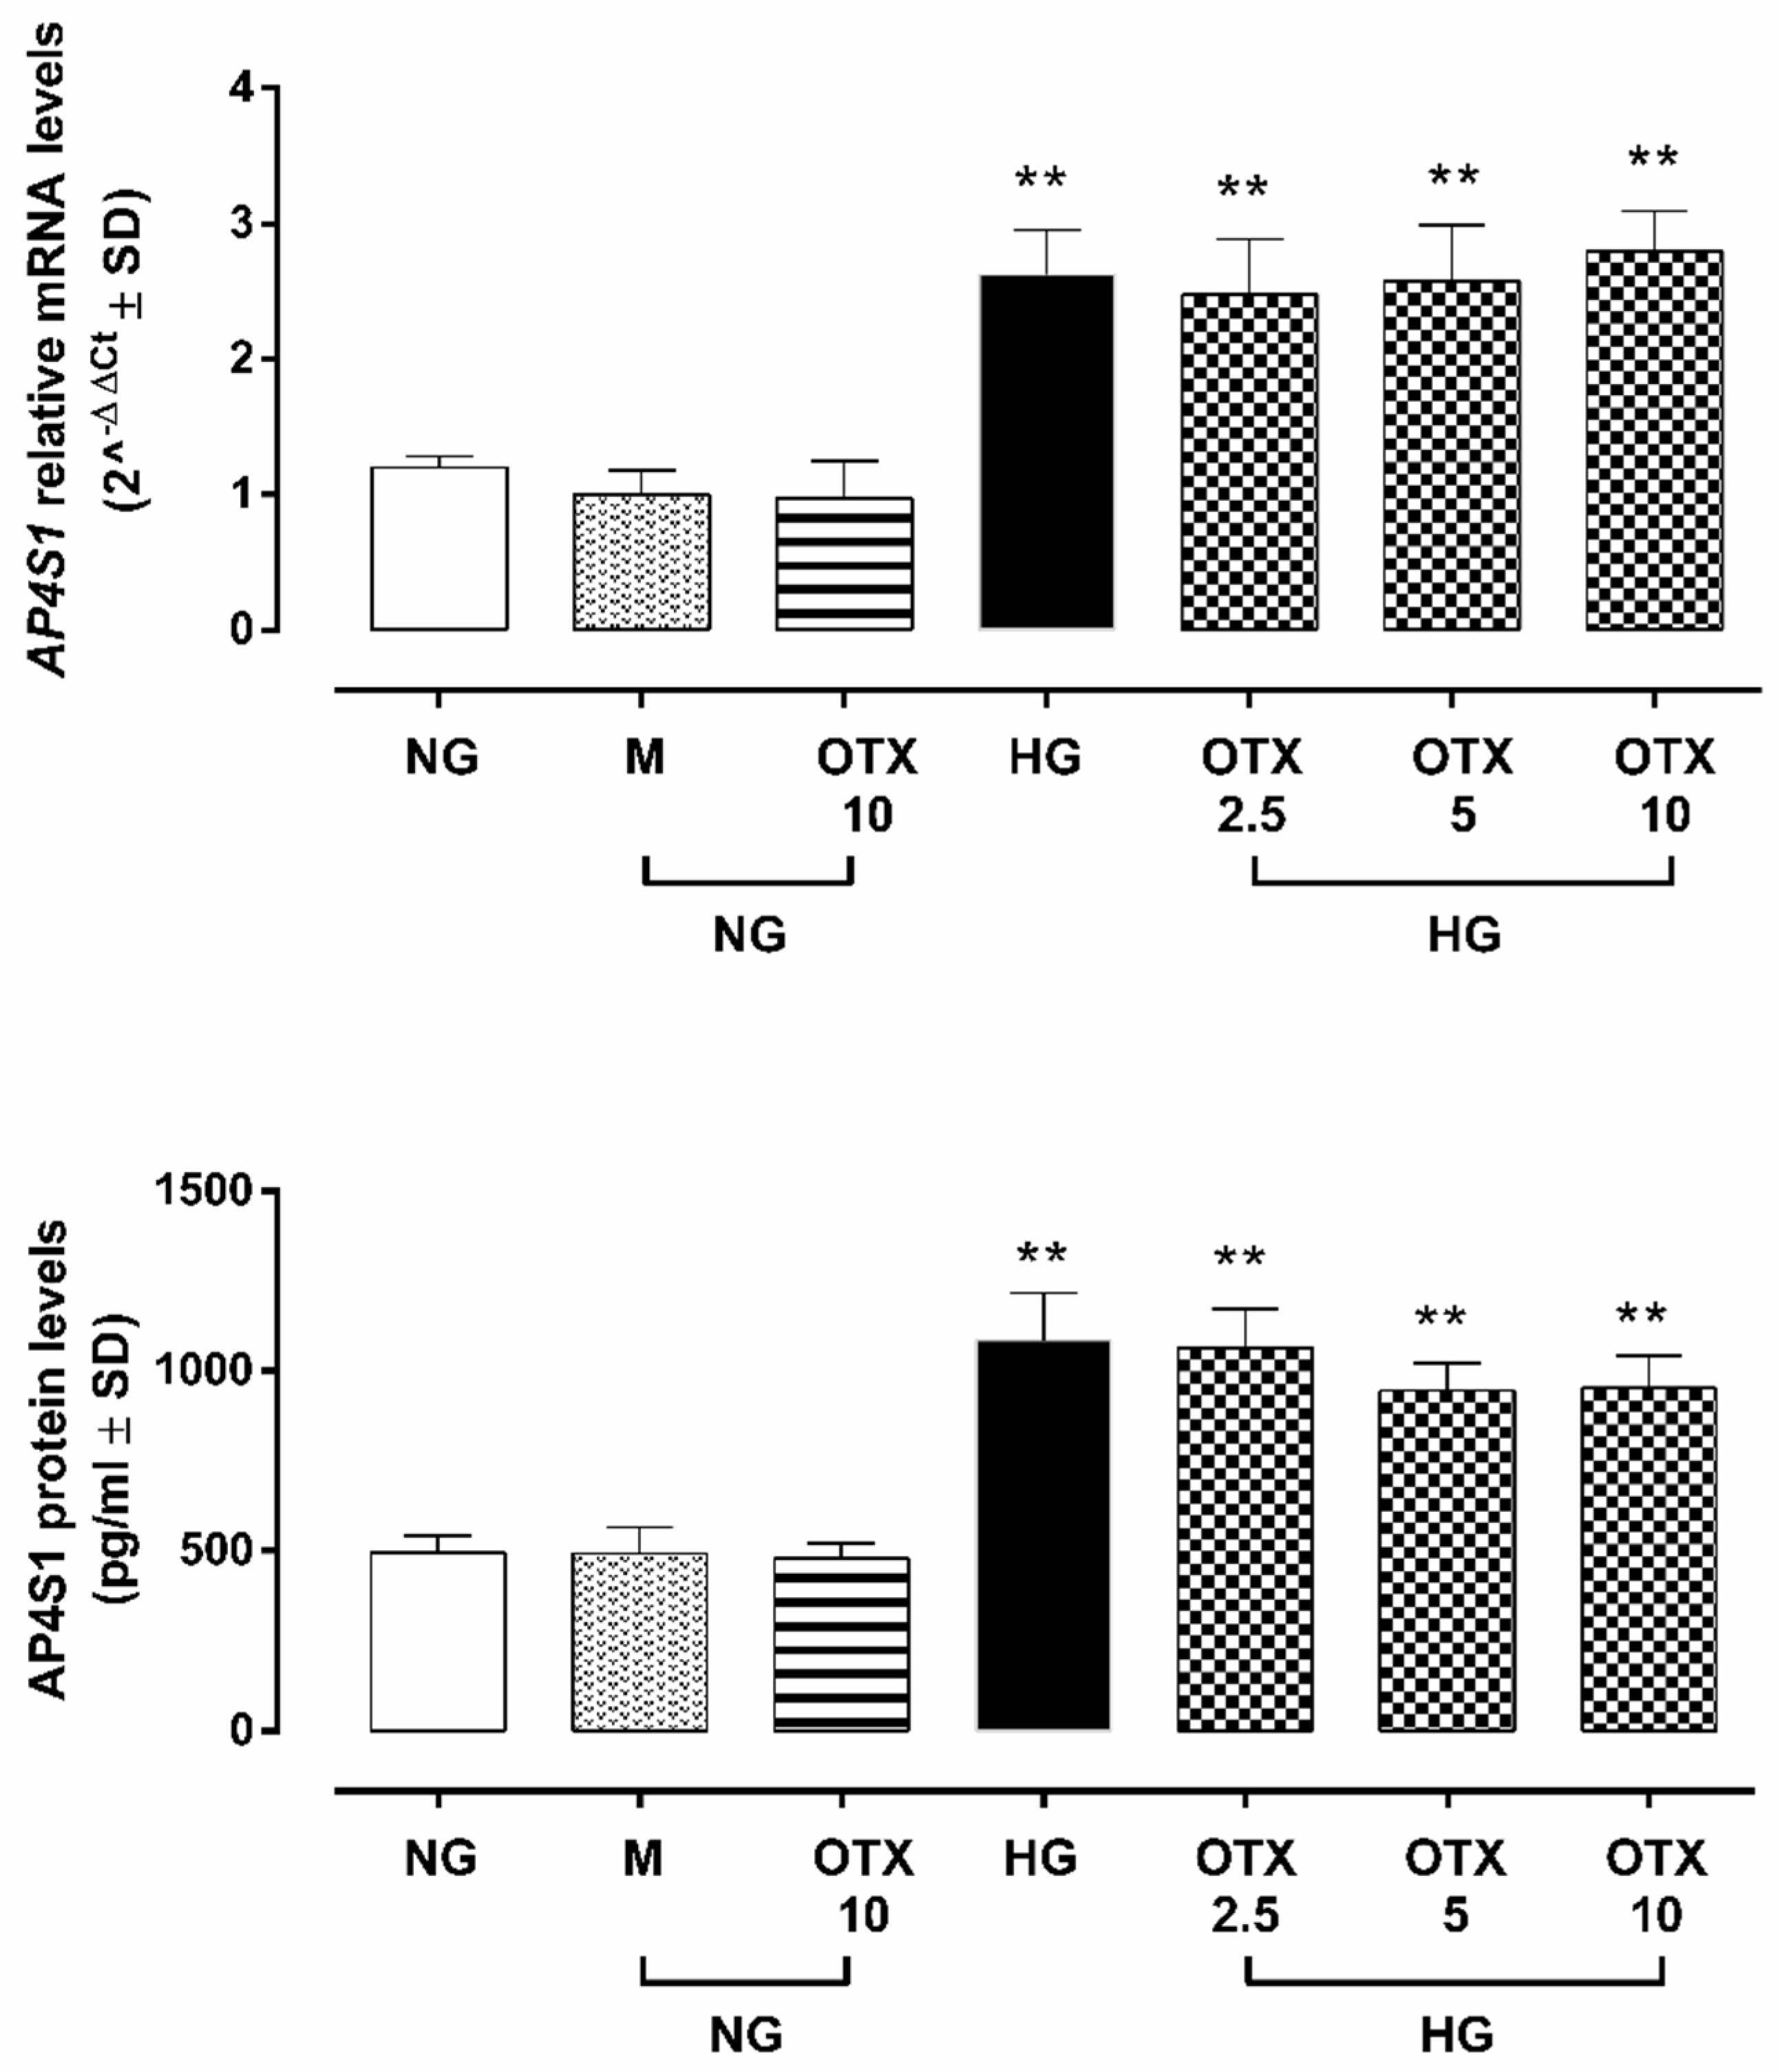
2.2. Gal-1 Expression
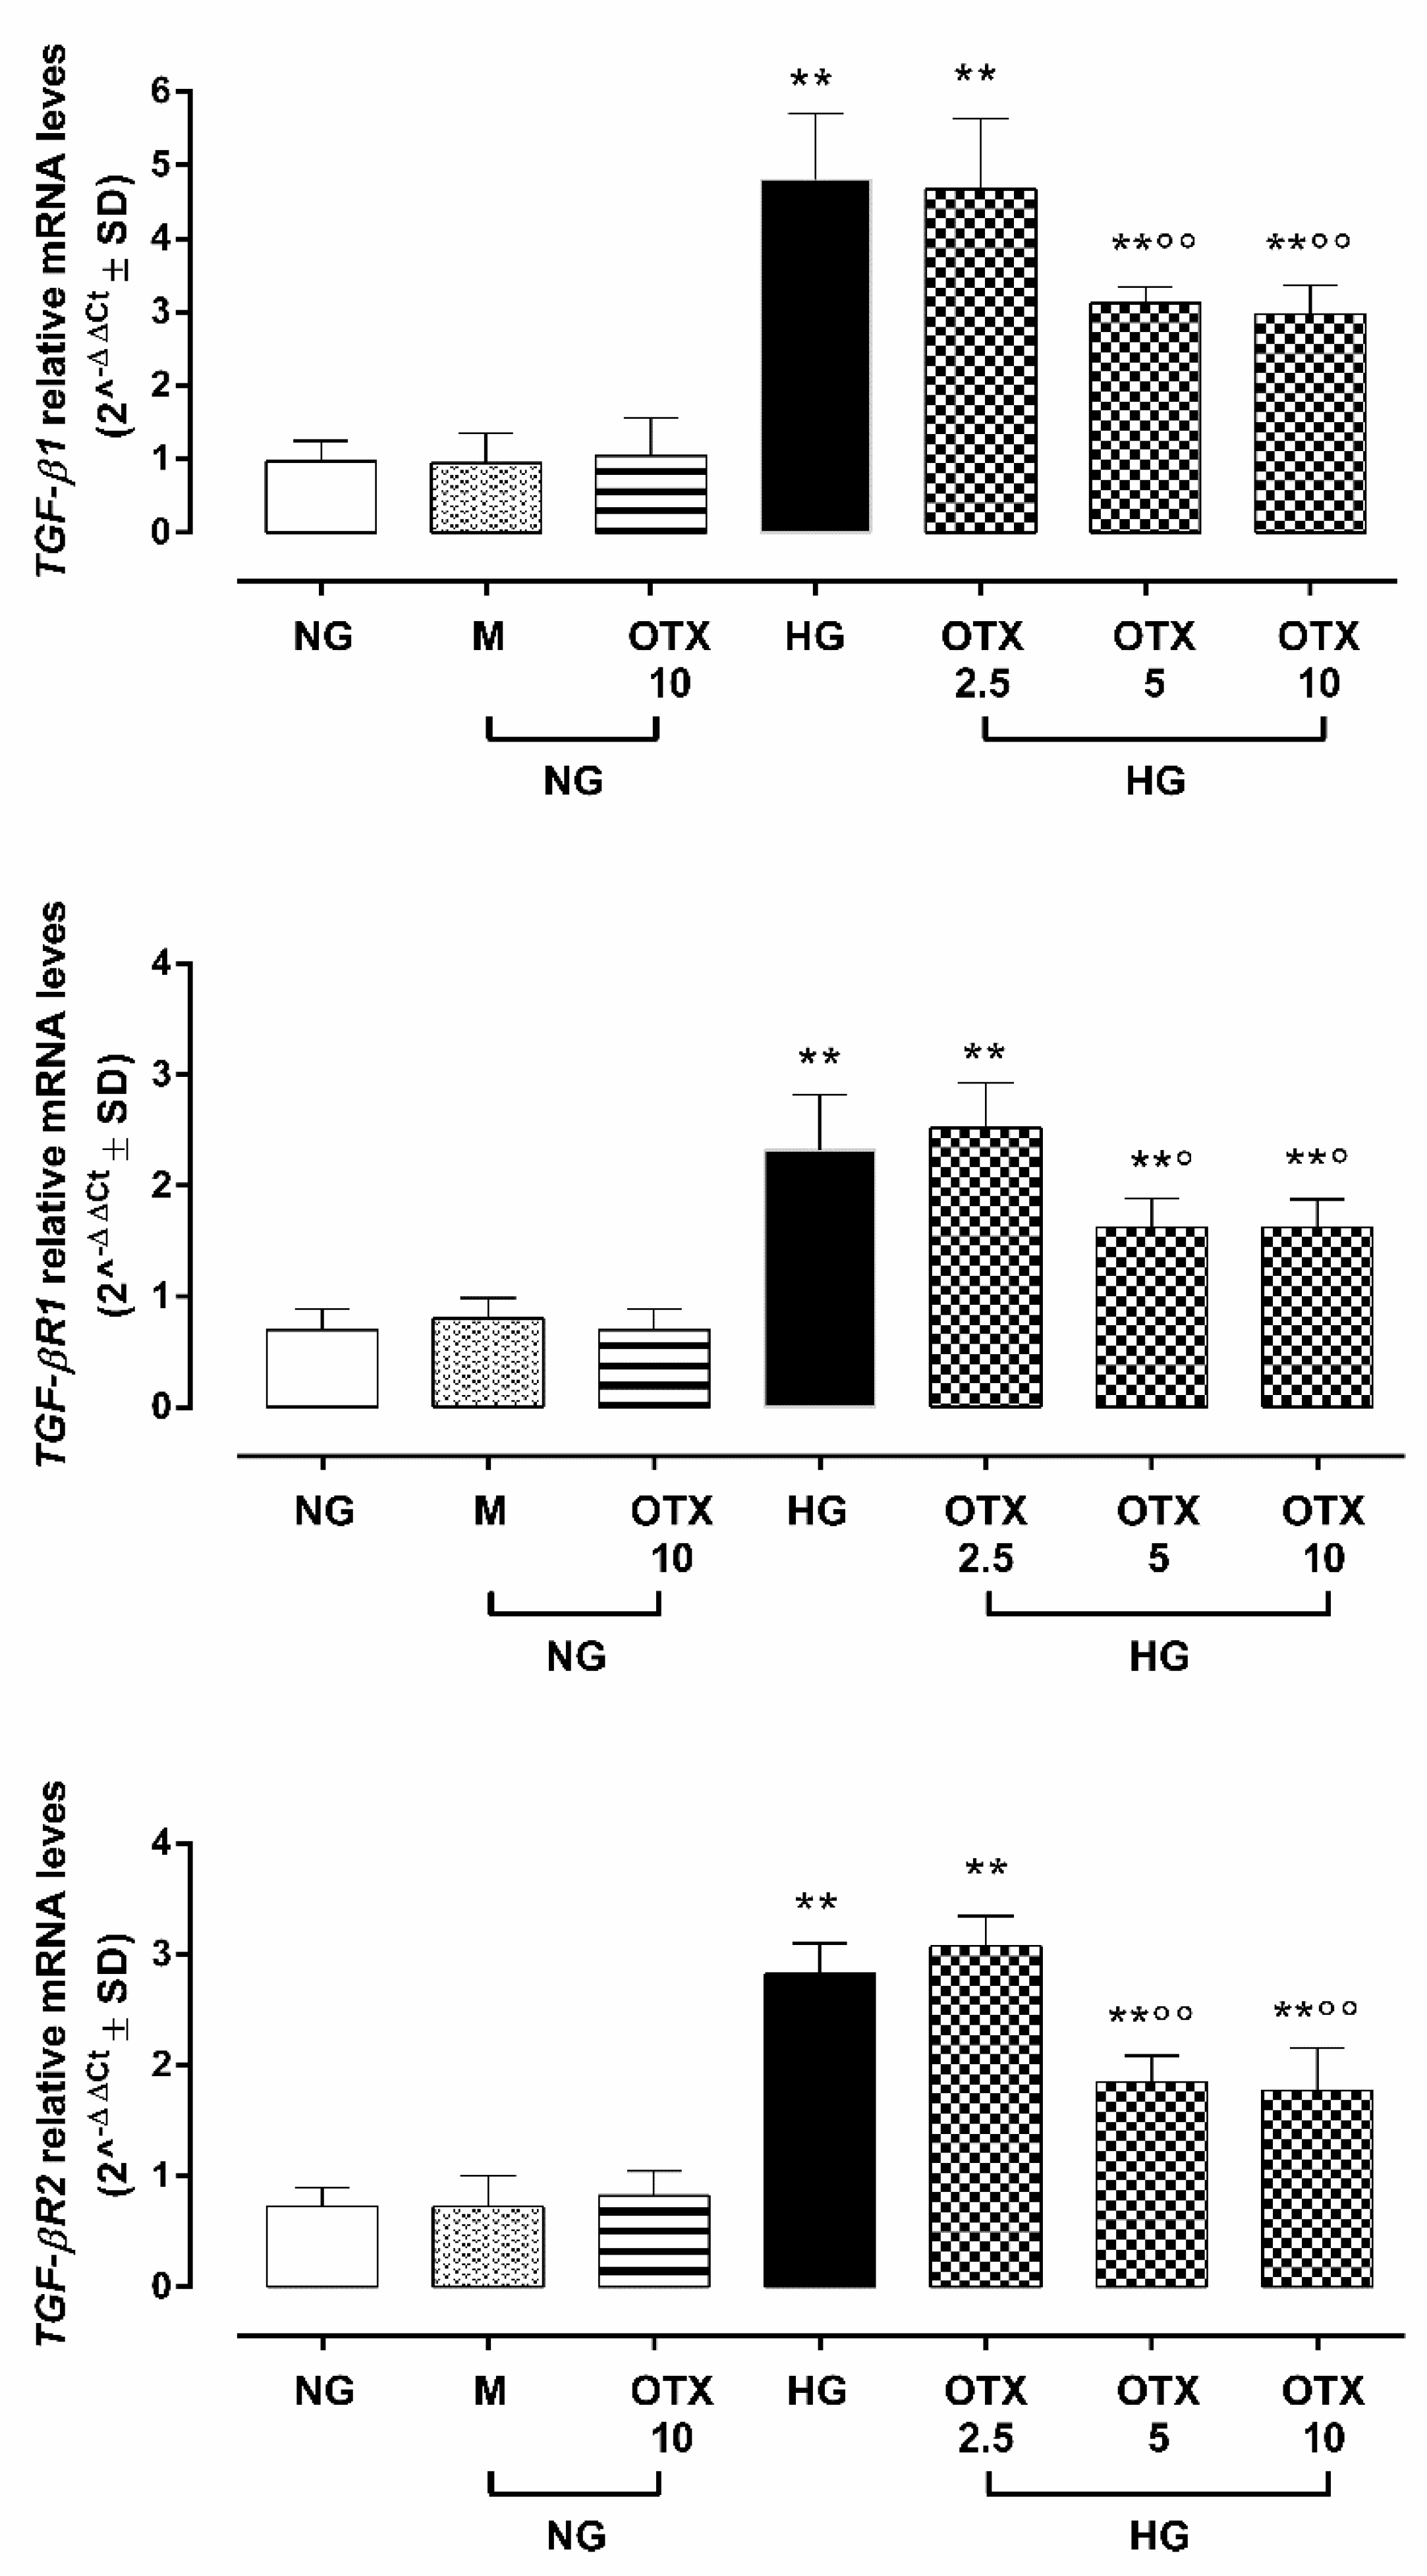
2.3. TGF-β Signaling
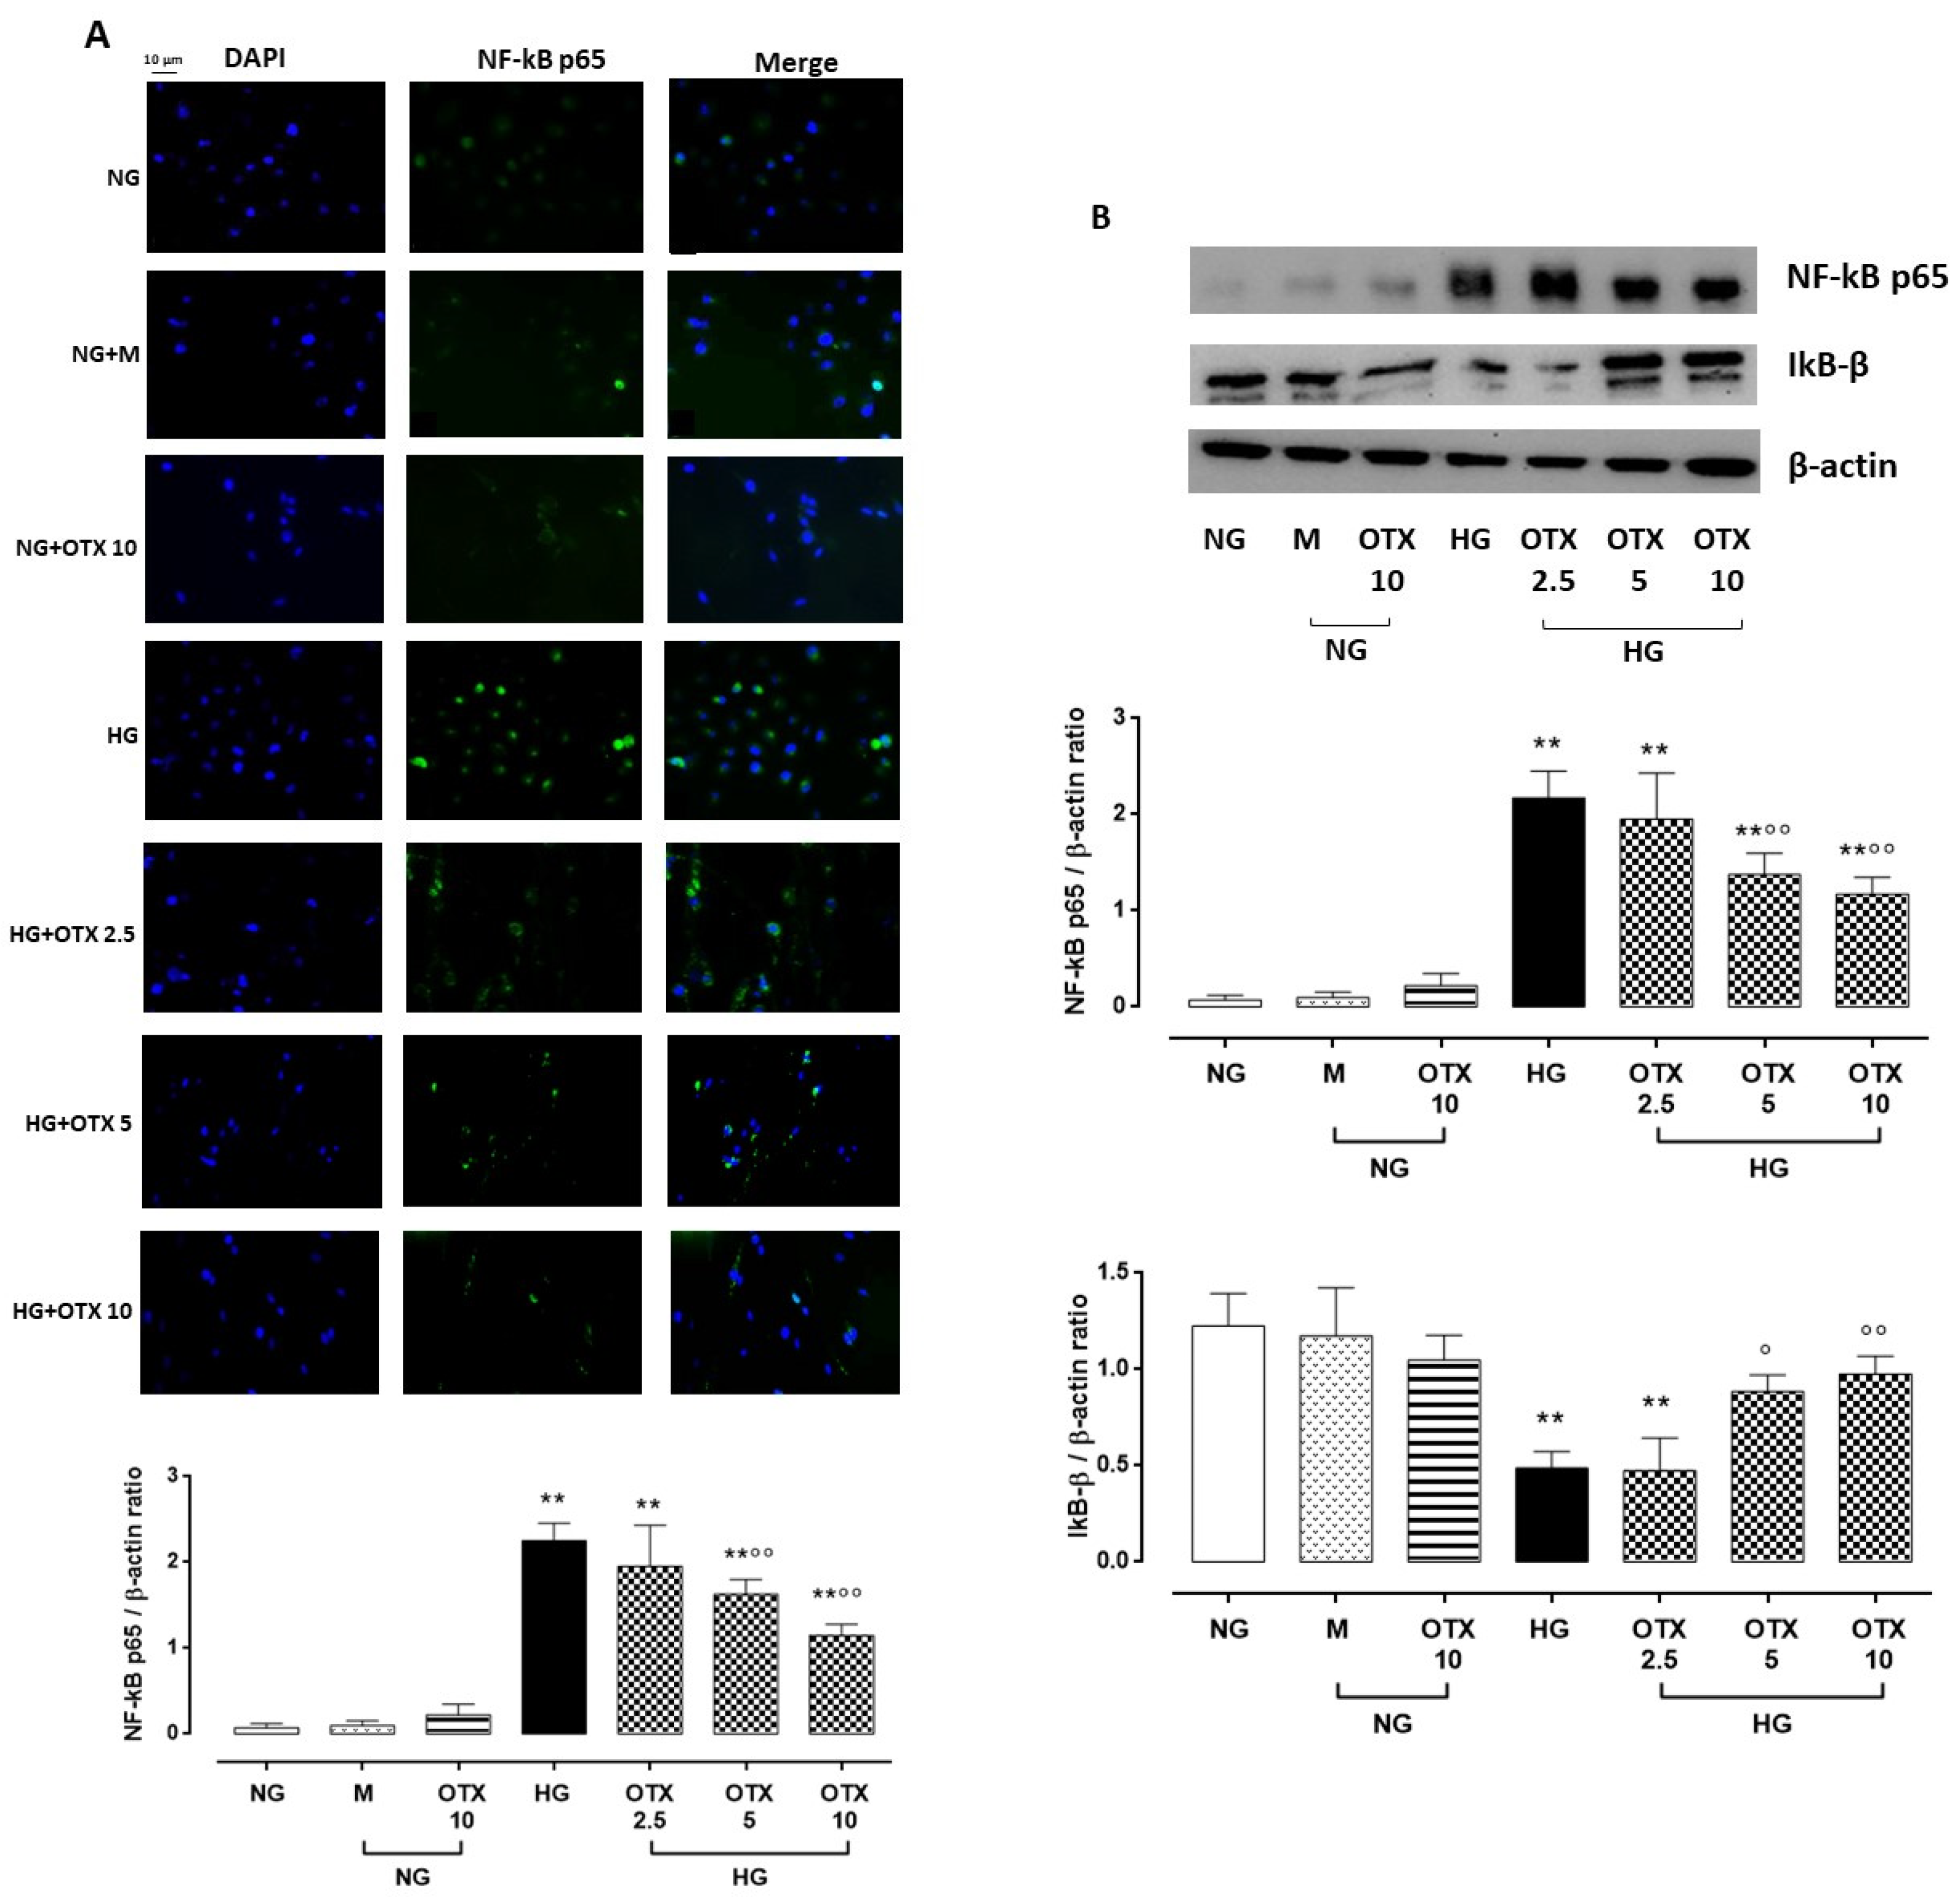
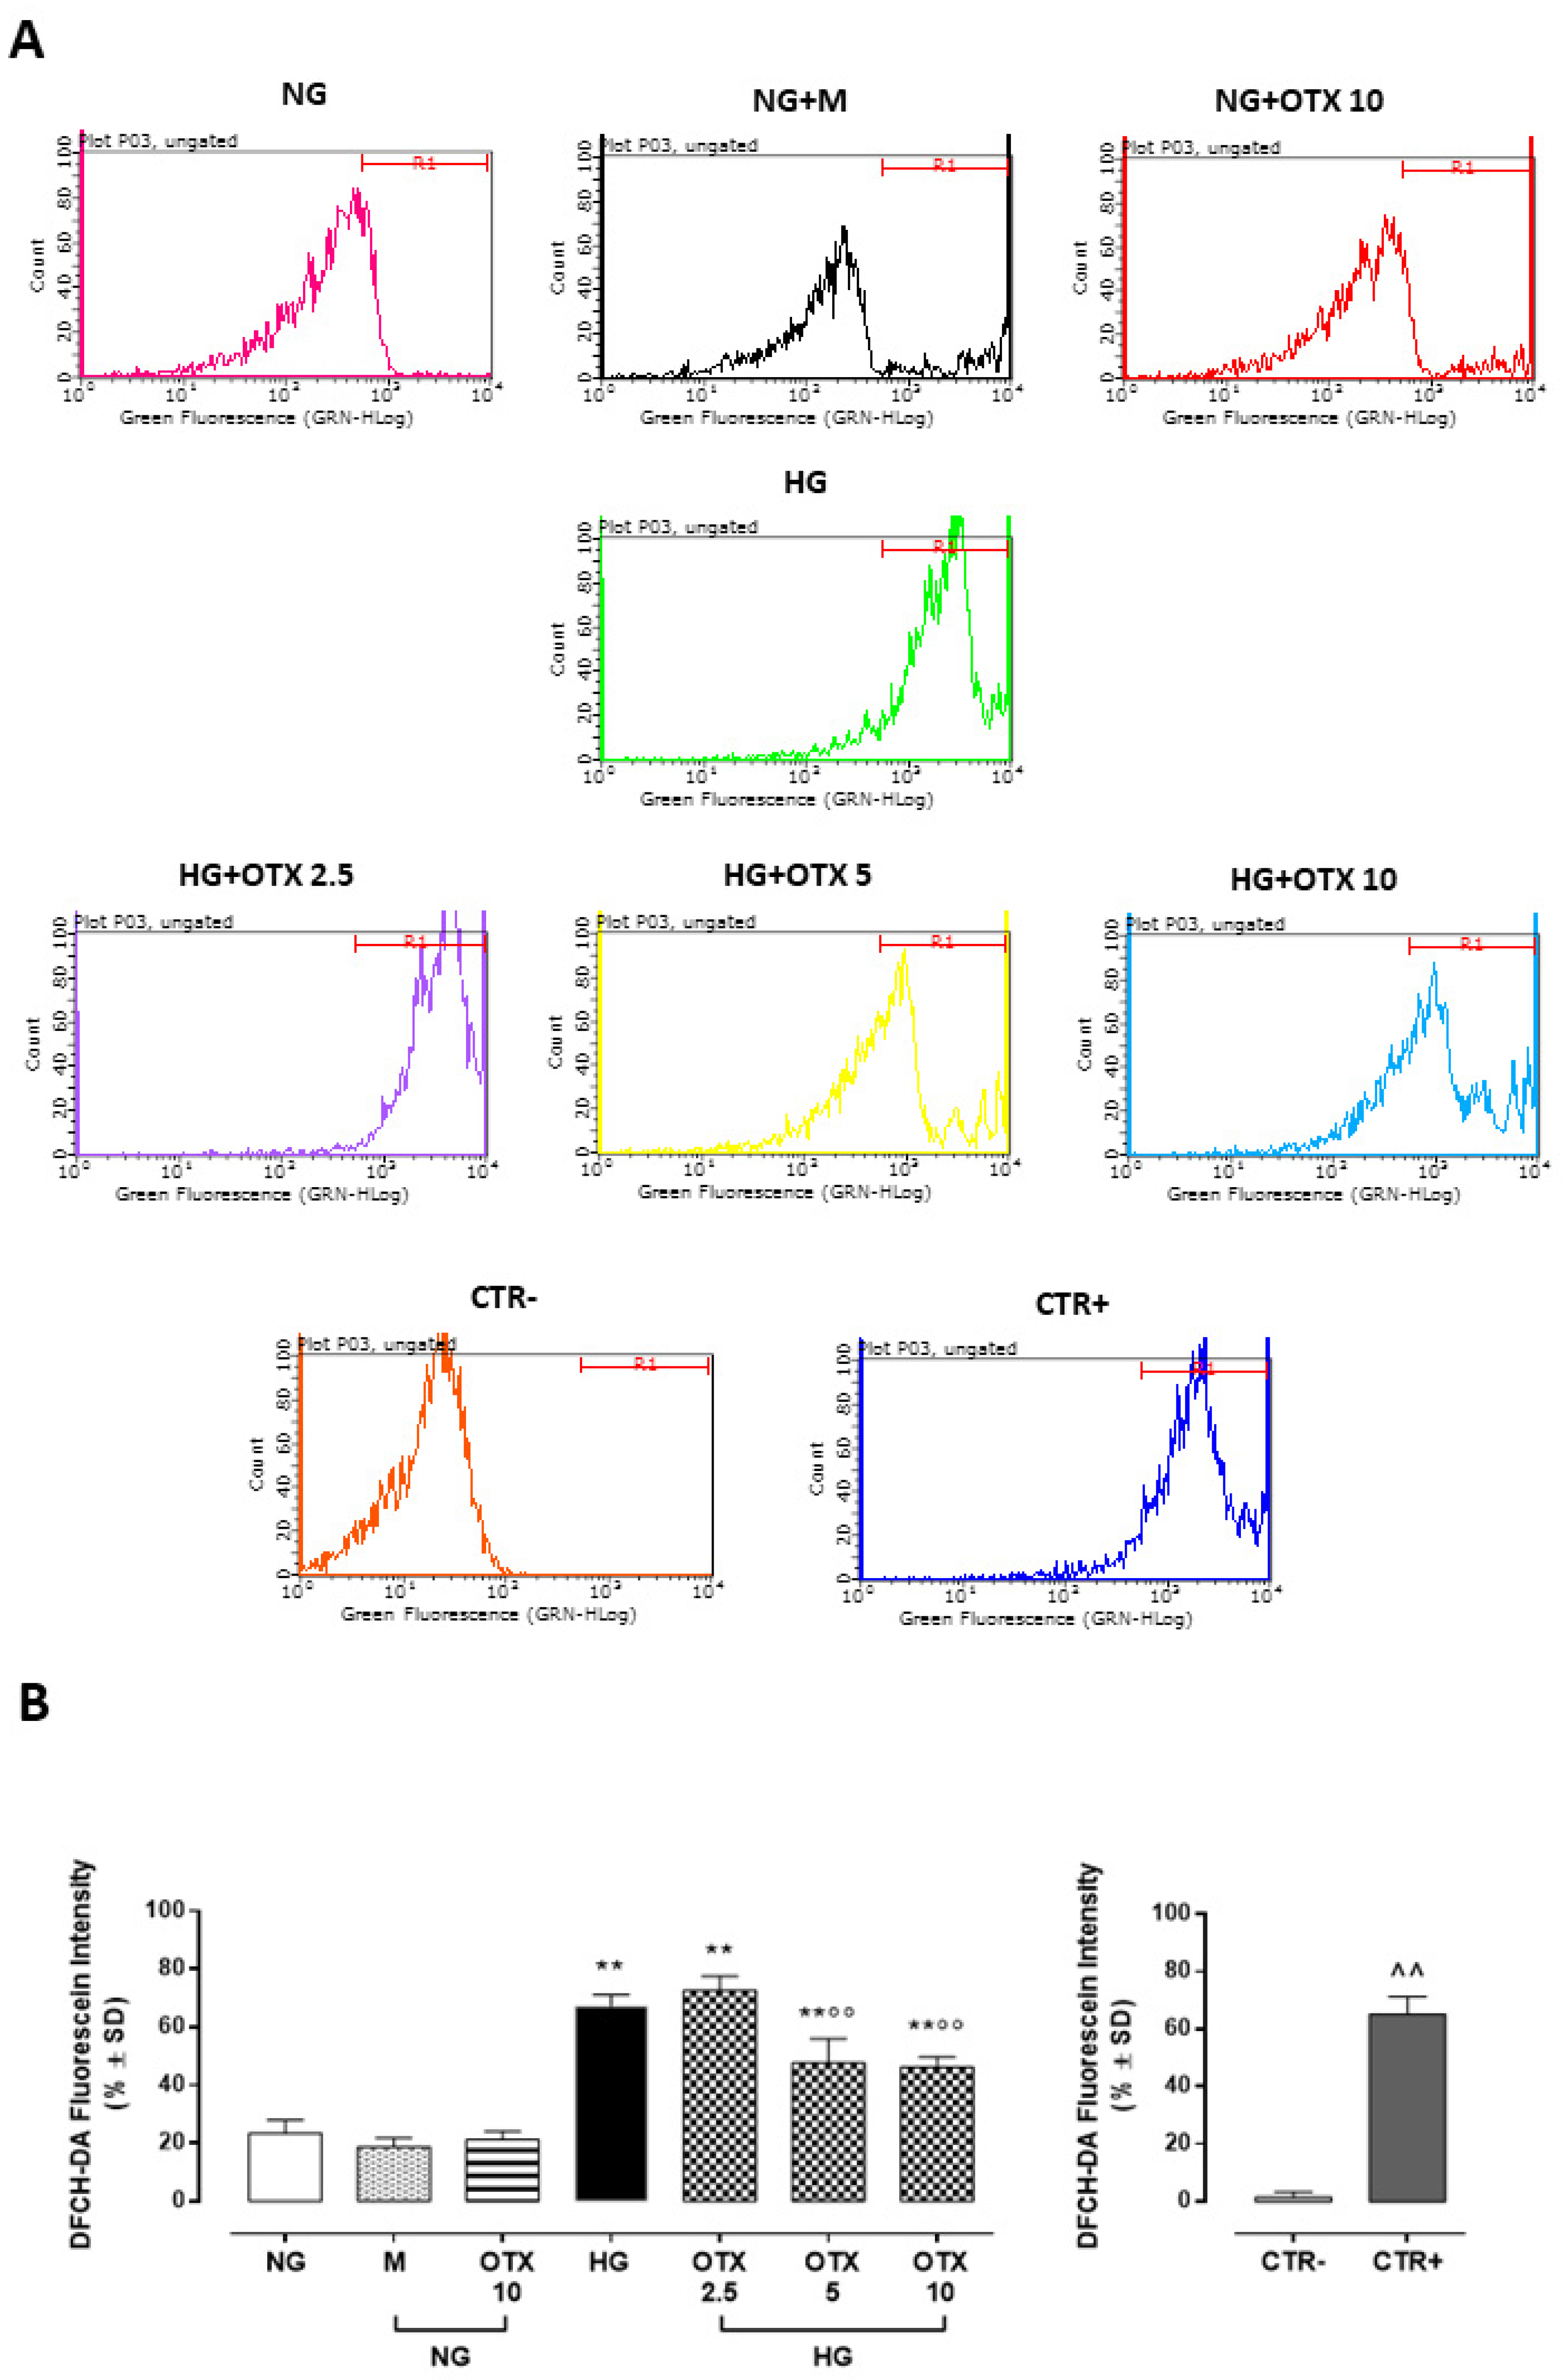
2.4. NF-kB p65, IkB-β, and ROS Pathway
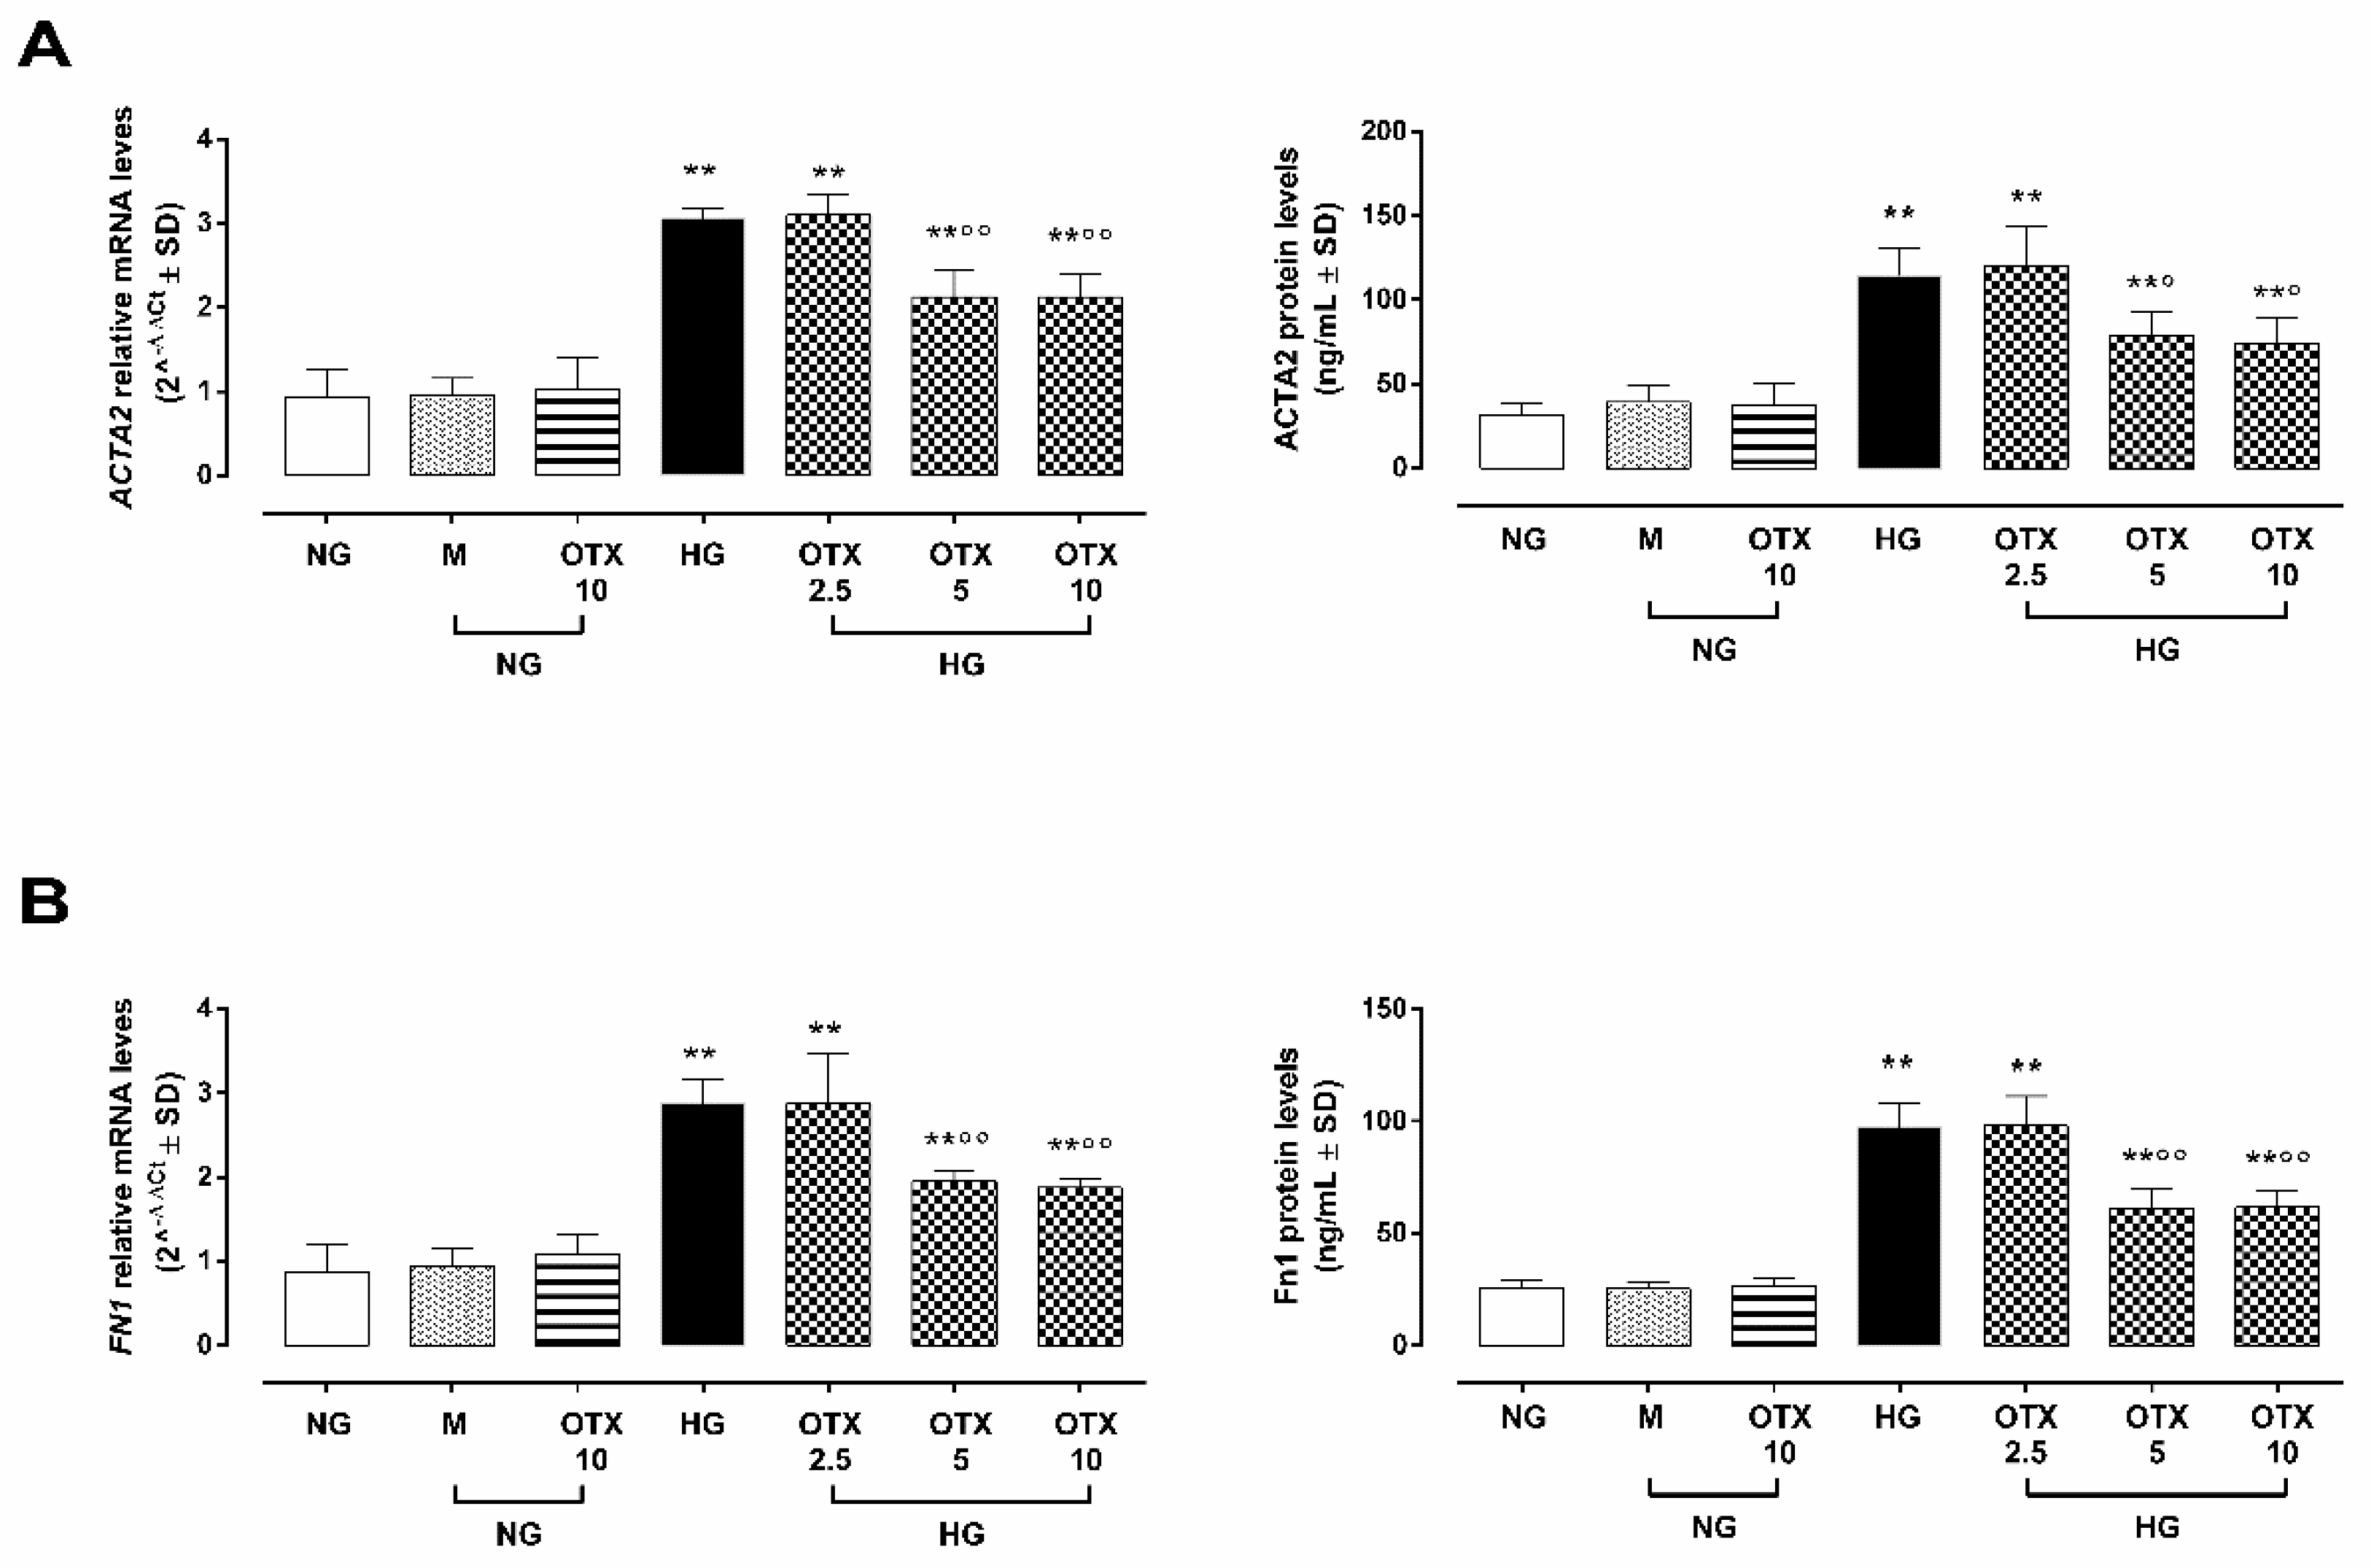
2.5. EMT
3. Discussion
4. Materials and Methods
4.1. Cell Culture
- I.
- 5 mM d-glucose + vehicle (NG);
- II.
- 5 mM d-glucose + OTX008 10 µM (NG + OTX10);
- III.
- 35 mM d-glucose + vehicle (HG);
- IV.
- 35 mM d-glucose + OTX008 2.5 µM (OTX 2.5);
- V.
- 35 mM d-glucose + OTX008 5 µM (OTX 5);
- VI.
- 35 mM d-glucose + OTX008 10 µM (OTX 10).
4.2. Cell Viability Assay
4.3. ROS Assessment
4.4. Immunocytochemistry
4.5. Enzyme-Linked Immunosorbent Assay (ELISA)
4.6. Western Blotting
4.7. Real-Time Quantitative Reverse Transcription PCR (qRT-PCR)
4.8. Statistical Analysis
Supplementary Materials
Author Contributions
Funding
Institutional Review Board Statement
Informed Consent Statement
Data Availability Statement
Conflicts of Interest
Abbreviations
References
- Al-Obaidi, N.; Mohan, S.; Liang, S.; Zhao, Z.; Nayak, B.K.; Li, B.; Sriramarao, P.; Habib, S.L. Galectin-1 is a new fibrosis protein in type 1 and type 2 diabetes. FASEB J. 2019, 33, 373–387. [Google Scholar] [CrossRef] [Green Version]
- Kanda, A.; Dong, Y.; Noda, K.; Saito, W.; Ishida, S. Advanced glycation end products link inflammatory cues to upregulation of galectin-1 in diabetic retinopathy. Sci. Rep. 2017, 7, 16168. [Google Scholar] [CrossRef]
- Kanda, A.; Noda, K.; Saito, W.; Ishida, S. Aflibercept Traps Galectin-1, an Angiogenic Factor Associated with Diabetic Retinopathy. Sci. Rep. 2015, 5, 17946. [Google Scholar] [CrossRef] [PubMed]
- Jiang, Q.; Zhu, X.H.; Liu, X.M.; Liu, J.M. Effect of MiR-200b on retinal endothelial cell function in high-glucose condition and the mechanism. Nan Fang Yi Ke Da Xue Xue Bao 2016, 36, 577–581. [Google Scholar]
- Zhang, W.; Kong, Y. YAP is essential for TGF-β-induced retinal fibrosis in diabetic rats via promoting the fibrogenic activity of Müller cells. J. Cell. Mol. Med. 2020, 24, 12390–12400. [Google Scholar] [CrossRef]
- Chen, C.; Ding, P. miR-200-3p suppresses cell proliferation and reduces apoptosis in diabetic retinopathy via blocking the TGF-β2/Smad pathway. Biosci. Rep. 2020, 40, BSR20201545. [Google Scholar] [CrossRef]
- Saucedo, L.; Pfister, I.B.; Zandi, S.; Gerhardt, C.; Garweg, J.G. Ocular TGF-β, Matrix Metalloproteinases, and TIMP-1 Increase with the Development and Progression of Diabetic Retinopathy in Type 2 Diabetes Mellitus. Mediat. Inflamm. 2021, 2021, 9811361. [Google Scholar] [CrossRef]
- Roy, S.; Amin, S.; Roy, S. Retinal fibrosis in diabetic retinopathy. Exp. Eye Res. 2016, 142, 71–75. [Google Scholar] [CrossRef] [Green Version]
- Xia, T.; Rizzolo, L.J. Effects of diabetic retinopathy on the barrier functions of the retinal pigment epithelium. Vis. Res. 2017, 139, 72–81. [Google Scholar] [CrossRef]
- Saika, S.; Yamanaka, O.; Ikeda, K.; Kim-Mitsuyama, S.; Flanders, K.C.; Yoo, J.; Roberts, A.B.; Nishikawa-Ishida, I.; Ohnishi, Y.; Muragaki, Y.; et al. Inhibition of p38MAP kinase suppresses fibrotic reaction of retinal pigment epithelial cells. Lab. Investig. 2005, 85, 838–850. [Google Scholar] [CrossRef]
- Che, D.; Zhou, T.; Lan, Y.; Xie, J.; Gong, H.; Li, C.; Feng, J.; Hong, H.; Qi, W.; Ma, C.; et al. High glucose-induced epithelial-mesenchymal transition contributes to the upregulation of fibrogenic factors in retinal pigment epithelial cells. Int. J. Mol. Med. 2016, 38, 1815–1822. [Google Scholar] [CrossRef] [Green Version]
- Zucchetti, M.; Bonezzi, K.; Frapolli, R.; Sala, F.; Borsotti, P.; Zangarini, M.; Cvitkovic, E.; Noel, K.; Ubezio, P.; Giavazzi, R.; et al. Pharmacokinetics and antineoplastic activity of galectin-1-targeting OTX008 in combination with sunitinib. Cancer Chemother. Pharm. 2013, 72, 879–887. [Google Scholar] [CrossRef]
- Astorgues-Xerri, L.; Riveiro, M.E.; Tijeras-Raballand, A.; Serova, M.; Rabinovich, G.A.; Bieche, I.; Vidaud, M.; de Gramont, A.; Martinet, M.; Cvitkovic, E.; et al. OTX008, a selective small-molecule inhibitor of galectin-1, downregulates cancer cell proliferation, invasion and tumour angiogenesis. Eur. J. Cancer 2014, 50, 2463–2477. [Google Scholar] [CrossRef]
- Koonce, N.A.; Griffin, R.J.; Dings, R.P.M. Galectin-1 Inhibitor OTX008 Induces Tumor Vessel Normalization and Tumor Growth Inhibition in Human Head and Neck Squamous Cell Carcinoma Models. Int. J. Mol. Sci. 2017, 18, 2671. [Google Scholar] [CrossRef] [Green Version]
- Shurpik, D.N.; Padnya, P.L.; Stoikov, I.I.; Cragg, P.J. Antimicrobial Activity of Calixarenes and Related Macrocycles. Molecules 2020, 25, 5145. [Google Scholar] [CrossRef]
- Pan, Y.C.; Hu, X.Y.; Guo, D.S. Biomedical Applications of Calixarenes: State of the Art and Perspectives. Angew. Chem. Int. Ed. Engl. 2021, 60, 2768–2794. [Google Scholar] [CrossRef]
- Abu El-Asrar, A.M.; Ahmad, A.; Allegaert, E.; Siddiquei, M.M.; Alam, K.; Gikandi, P.W.; De Hertogh, G.; Opdenakker, G. Galectin-1 studies in proliferative diabetic retinopathy. Acta Ophthalmol. 2020, 98, e1–e12. [Google Scholar] [CrossRef]
- Granata, G.; Paterniti, I.; Geraci, C.; Cunsolo, F.; Esposito, E.; Cordaro, M.; Blanco, A.R.; Cuzzocrea, S.; Consoli, G.M.L. Potential Eye Drop Based on a Calix[4]arene Nanoassembly for Curcumin Delivery: Enhanced Drug Solubility, Stability, and Anti-Inflammatory Effect. Mol. Pharm. 2017, 14, 1610–1622. [Google Scholar] [CrossRef]
- Consoli, G.M.L.; Granata, G.; Geraci, C. Design, synthesis, and drug solubilising property of the first folate−calix[4]arene conjugate. Org. Biomol. Chem. 2011, 9, 6491–6495. [Google Scholar] [CrossRef]
- Consoli, G.M.L.; Granata, G.; Fragassi, G.; Grossi, M.; Sallese, M.; Geraci, C. Design and synthesis of a multivalent fluorescent folate−calix[4]arene conjugate: Cancer cell penetration and intracellular localization. Org. Biomol. Chem. 2015, 13, 3298–3307. [Google Scholar] [CrossRef]
- Zhou, Y.; Li, H.; Yang, Y.-W. Controlled drug delivery systems based on calixarenes. Chin. Chem. Lett. 2015, 26, 825–828. [Google Scholar] [CrossRef]
- Raymond, E.; Astrorgue-Xerri, L.; Serova, M.; Riveiro, M.E.; Faivre, S. Translational Rational for the Clinical Development of OTX-008: A Novel Drug That Inhibits Galectin-1 Expression in Human Cancer Models. In Galectins and Disease Implications for Targeted Therapeutics; Klyosov, A.A., Traber, P.G., Eds.; ACS Symposium Series; American Chemical Society: Washington, DC, USA, 2012; Volume 1115, pp. 259–266. [Google Scholar]
- Zhao, X.; Kwan, J.Y.Y.; Yip, K.; Liu, P.P.; Liu, F.F. Targeting metabolic dysregulation for fibrosis therapy. Nat. Rev. Drug. Discov. 2020, 19, 57–75. [Google Scholar] [CrossRef]
- Kendall, R.T.; Feghali-Bostwick, C.A. Fibroblasts in fibrosis: Novel roles and mediators. Front. Pharm. 2014, 5, 123. [Google Scholar] [CrossRef] [Green Version]
- Frangogiannis, N. Transforming growth factor-β in tissue fibrosis. J. Exp. Med. 2020, 217, e20190103. [Google Scholar] [CrossRef]
- Connor, T.B., Jr.; Roberts, A.B.; Sporn, M.B.; Danielpour, D.; Dart, L.L.; Michels, R.G.; de Bustros, S.; Enger, C.; Kato, H.; Lansing, M. Correlation of fibrosis and transforming growth factor-beta type 2 levels in the eye. J. Clin. Investig. 1989, 83, 1661–1666. [Google Scholar] [CrossRef]
- Kita, T.; Hata, Y.; Arita, R.; Kawahara, S.; Miura, M.; Nakao, S.; Mochizuki, Y.; Enaida, H.; Goto, Y.; Shimokawa, H.; et al. Role of TGF-beta in proliferative vitreoretinal diseases and ROCK as a therapeutic target. Proc. Natl. Acad. Sci. USA 2008, 105, 17504–17509. [Google Scholar] [CrossRef] [Green Version]
- Zhou, M.; Geathers, J.S.; Grillo, S.L.; Weber, S.R.; Wang, W.; Zhao, Y.; Sundstrom, J.M. Role of Epithelial-Mesenchymal Transition in Retinal Pigment Epithelium Dysfunction. Front. Cell. Dev. Biol. 2020, 8, 501. [Google Scholar] [CrossRef]
- Chu, S.J.; Zhang, Z.H.; Wang, M.; Xu, H.F. Effect of bevacizumab on the expression of fibrosis-related inflammatory mediators in ARPE-19 cells. Int. J. Ophthalmol. 2017, 10, 366–371. [Google Scholar] [CrossRef]
- Bastiaans, J.; van Meurs, J.C.; van Holten-Neelen, C.; Nagtzaam, N.M.; van Hagen, P.M.; Chambers, R.C.; Hooijkaas, H.; Dik, W.A. Thrombin induces epithelial-mesenchymal transition and collagen production by retinal pigment epithelial cells via autocrine PDGF-receptor signaling. Investig. Ophthalmol. Vis. Sci. 2013, 54, 8306–8314. [Google Scholar] [CrossRef]
- Lyon, H.; Yin, N.; Rupenthal, I.D.; Green, C.R.; Mugisho, O.O. Blocking connexin43 hemichannels prevents TGF-β2 upregulation and epithelial-mesenchymal transition in retinal pigment epithelial cells. Cell. Biol. Int. 2021, 2021, 1–8. [Google Scholar] [CrossRef]
- Maisto, R.; Trotta, M.C.; Petrillo, F.; Izzo, S.; Cuomo, G.; Alfano, R.; Hermenean, A.; Barcia, J.M.; Galdiero, M.; Platania, C.; et al. Resolvin D1 Modulates the Intracellular VEGF-Related miRNAs of Retinal Photoreceptors Challenged With High Glucose. Front. Pharm. 2020, 11, 235. [Google Scholar] [CrossRef] [Green Version]
- Maisto, R.; Oltra, M.; Vidal-Gil, L.; Martínez-Gil, N.; Sancho-Pellúz, J.; Di Filippo, C.; Rossi, S.; D´Amico, M.; Barcia, J.M.; Romero, F.J. ARPE-19-derived VEGF-containing exosomes promote neovascularization in HUVEC: The role of the melanocortin receptor 5. Cell Cycle 2019, 18, 413–424. [Google Scholar] [CrossRef] [Green Version]
- Ando, Y.; Sato, Y.; Kudo, A.; Watanabe, T.; Hirakata, A.; Okada, A.A.; Umezawa, K.; Keino, H. Anti-inflammatory effects of the NF-κB inhibitor dehydroxymethylepoxyquinomicin on ARPE-19 cells. Mol. Med. Rep. 2020, 22, 582–590. [Google Scholar] [CrossRef]
- Trotta, M.C.; Maisto, R.; Alessio, N.; Hermenean, A.; D’Amico, M.; Di Filippo, C. The Melanocortin MC5R as a New Target for Treatment of High Glucose-Induced Hypertrophy of the Cardiac H9c2 Cells. Front. Physiol. 2018, 9, 1475. [Google Scholar] [CrossRef]
- Du, Z.; Zhang, W.; Wang, S.; Zhang, J.; He, J.; Wang, Y.; Dong, Y.; Huo, M. Celastrol protects human retinal pigment epithelial cells against hydrogen peroxide mediated oxidative stress, autophagy, and apoptosis through sirtuin 3 signal pathway. J. Cell. Biochem. 2019, 120, 10413–10420. [Google Scholar] [CrossRef]
- Dib, B.; Lin, H.; Maidana, D.E.; Tian, B.; Miller, J.B.; Bouzika, P.; Miller, J.W.; Vavvas, D.G. Mitochondrial DNA has a pro-inflammatory role in AMD. Biochim. Biophys. Acta 2015, 1853, 2897–2906. [Google Scholar] [CrossRef] [Green Version]
- Maisto, R.; Gesualdo, C.; Trotta, M.C.; Grieco, P.; Testa, F.; Simonelli, F.; Barcia, J.M.; D’Amico, M.; Di Filippo, C.; Rossi, S. Melanocortin receptor agonists MCR1-5 protect photoreceptors from high-glucose damage and restore antioxidant enzymes in primary retinal cell culture. J. Cell. Mol. Med. 2017, 21, 968–974. [Google Scholar] [CrossRef]
- Trotta, M.C.; Gesualdo, C.; Platania, C.B.M.; De Robertis, D.; Giordano, M.; Simonelli, F.; D’Amico, M.; Drago, F.; Bucolo, C.; Rossi, S. Circulating miRNAs in diabetic retinopathy patients: Prognostic markers or pharmacological targets? Biochem. Pharm. 2021, 186, 114473. [Google Scholar] [CrossRef]


Publisher’s Note: MDPI stays neutral with regard to jurisdictional claims in published maps and institutional affiliations. |
© 2022 by the authors. Licensee MDPI, Basel, Switzerland. This article is an open access article distributed under the terms and conditions of the Creative Commons Attribution (CC BY) license (https://creativecommons.org/licenses/by/4.0/).
Share and Cite
Trotta, M.C.; Petrillo, F.; Gesualdo, C.; Rossi, S.; Corte, A.D.; Váradi, J.; Fenyvesi, F.; D’Amico, M.; Hermenean, A. Effects of the Calix[4]arene Derivative Compound OTX008 on High Glucose-Stimulated ARPE-19 Cells: Focus on Galectin-1/TGF-β/EMT Pathway. Molecules 2022, 27, 4785. https://doi.org/10.3390/molecules27154785
Trotta MC, Petrillo F, Gesualdo C, Rossi S, Corte AD, Váradi J, Fenyvesi F, D’Amico M, Hermenean A. Effects of the Calix[4]arene Derivative Compound OTX008 on High Glucose-Stimulated ARPE-19 Cells: Focus on Galectin-1/TGF-β/EMT Pathway. Molecules. 2022; 27(15):4785. https://doi.org/10.3390/molecules27154785
Chicago/Turabian StyleTrotta, Maria Consiglia, Francesco Petrillo, Carlo Gesualdo, Settimio Rossi, Alberto Della Corte, Judit Váradi, Ferenc Fenyvesi, Michele D’Amico, and Anca Hermenean. 2022. "Effects of the Calix[4]arene Derivative Compound OTX008 on High Glucose-Stimulated ARPE-19 Cells: Focus on Galectin-1/TGF-β/EMT Pathway" Molecules 27, no. 15: 4785. https://doi.org/10.3390/molecules27154785
APA StyleTrotta, M. C., Petrillo, F., Gesualdo, C., Rossi, S., Corte, A. D., Váradi, J., Fenyvesi, F., D’Amico, M., & Hermenean, A. (2022). Effects of the Calix[4]arene Derivative Compound OTX008 on High Glucose-Stimulated ARPE-19 Cells: Focus on Galectin-1/TGF-β/EMT Pathway. Molecules, 27(15), 4785. https://doi.org/10.3390/molecules27154785