
Optimization of Ultrasound-Assisted Extraction of Yields and Total Methoxyflavone Contents from Kaempferia parviflora Rhizomes

 ,
, 
Abstract
1. Introduction
2. Materials and Methods
2.1. Materials and Reagents
2.2. Extraction Process
2.3. Instrumentation and Chromatographic Conditions
2.4. Preparation of Standard and Sample Solutions
2.5. Method Validation
2.5.1. System Suitability
2.5.2. Linearity
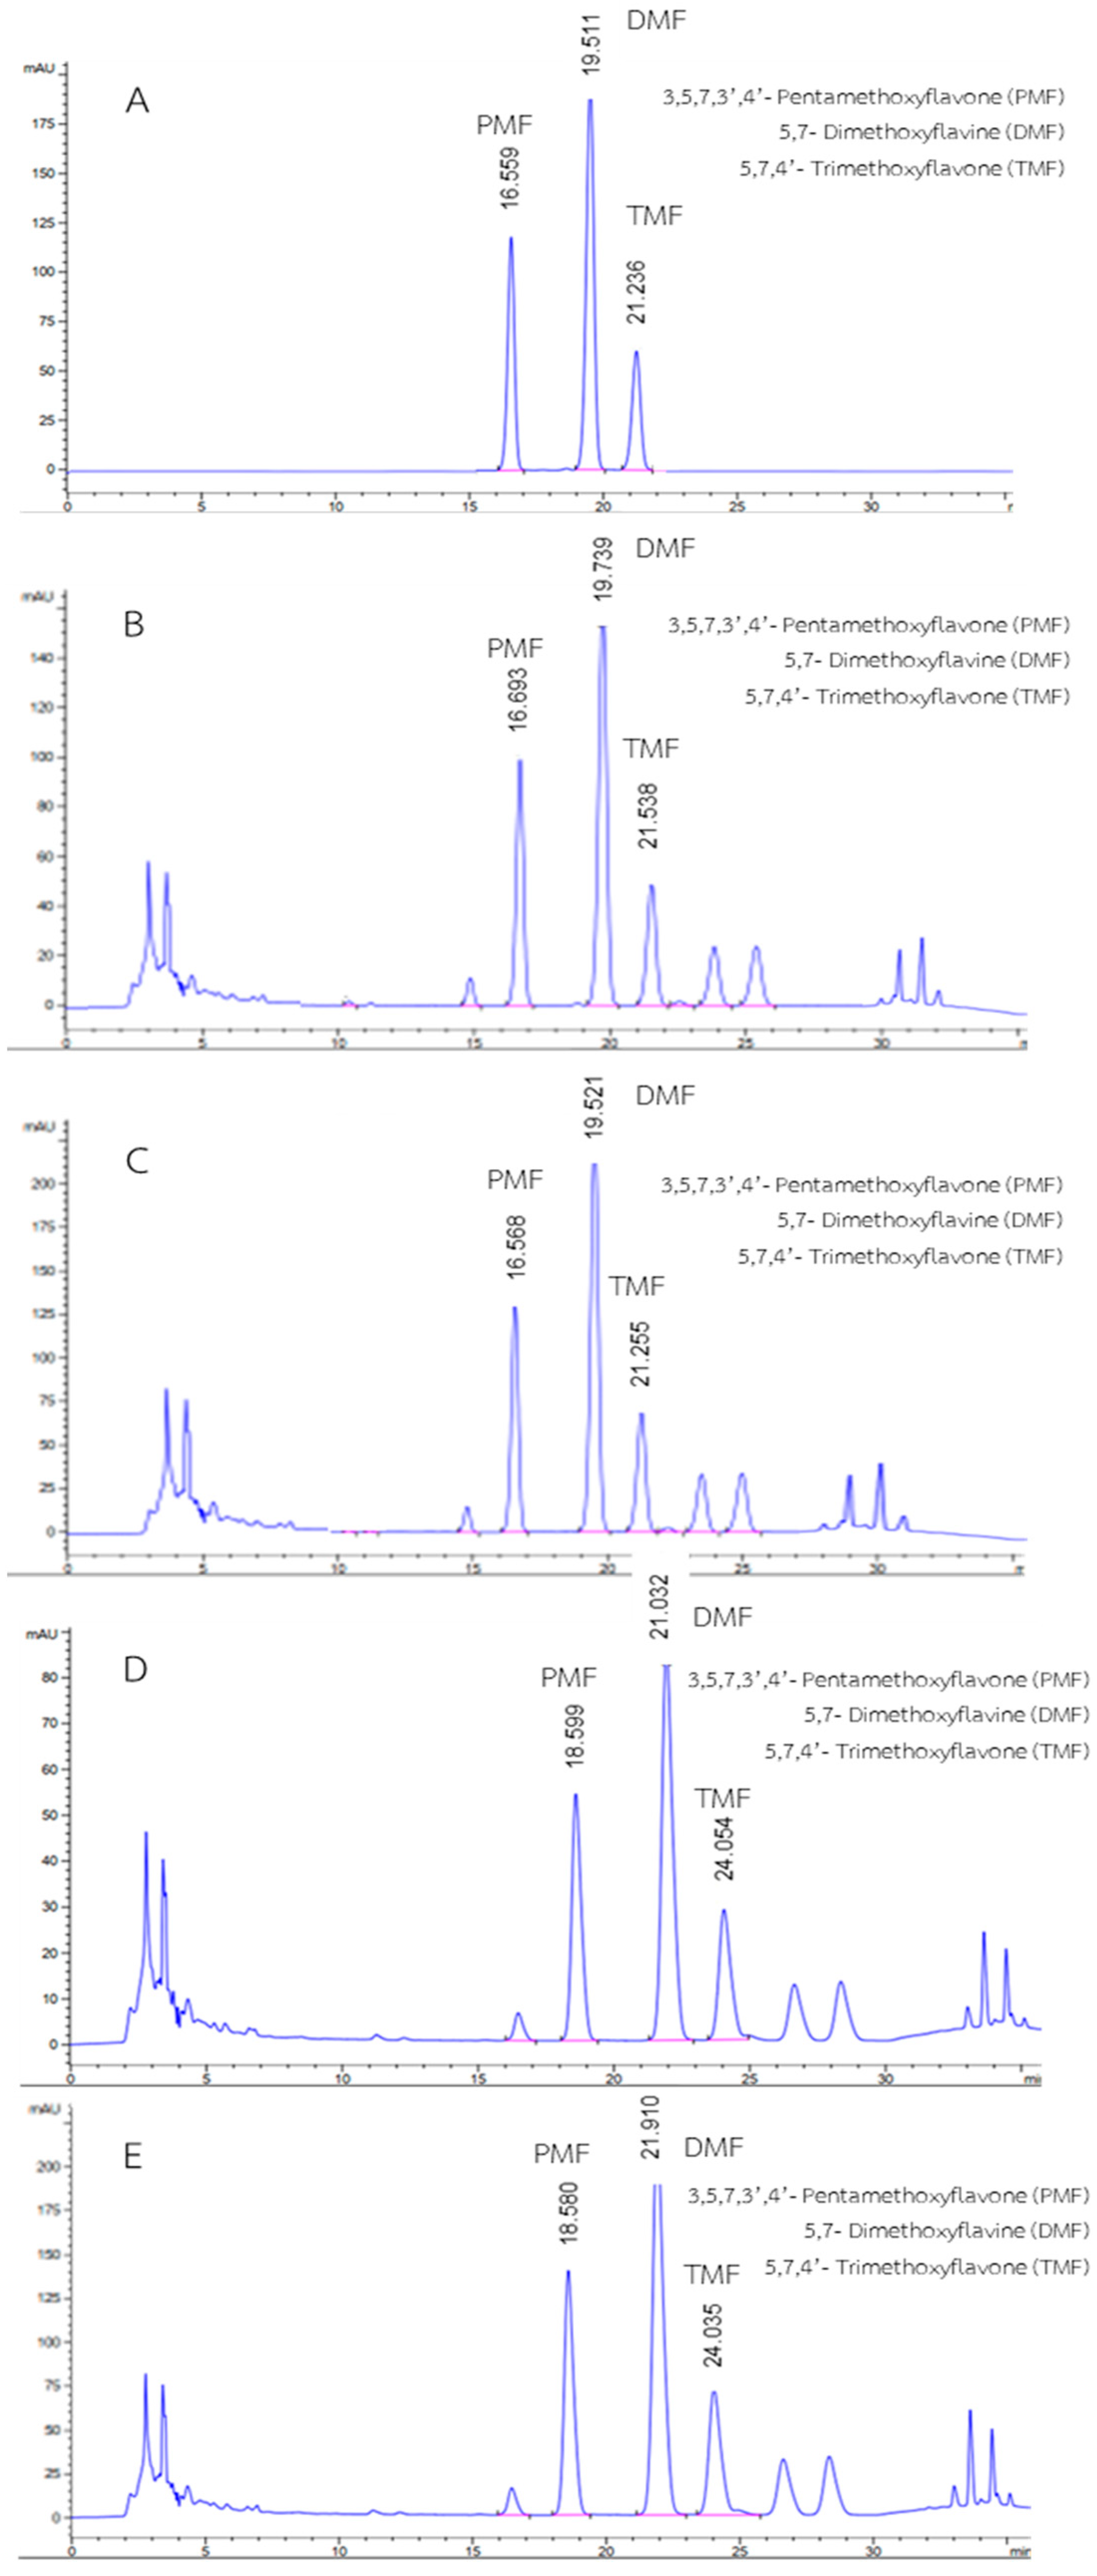
2.5.3. Specificity
2.5.4. Precision
2.5.5. Accuracy
2.5.6. Robustness
2.5.7. LOD and LOQ
2.6. Determination of Methoxyflavones Using a HPLC-DAD Method
2.7. Experimental Design
2.7.1. Plackett–Burman Design (PBD)
2.7.2. Box–Behnken Design (BBD)
2.8. Data Analysis
3. Results and Discussions
3.1. Method Development
3.2. Validation of HPLC-DAD
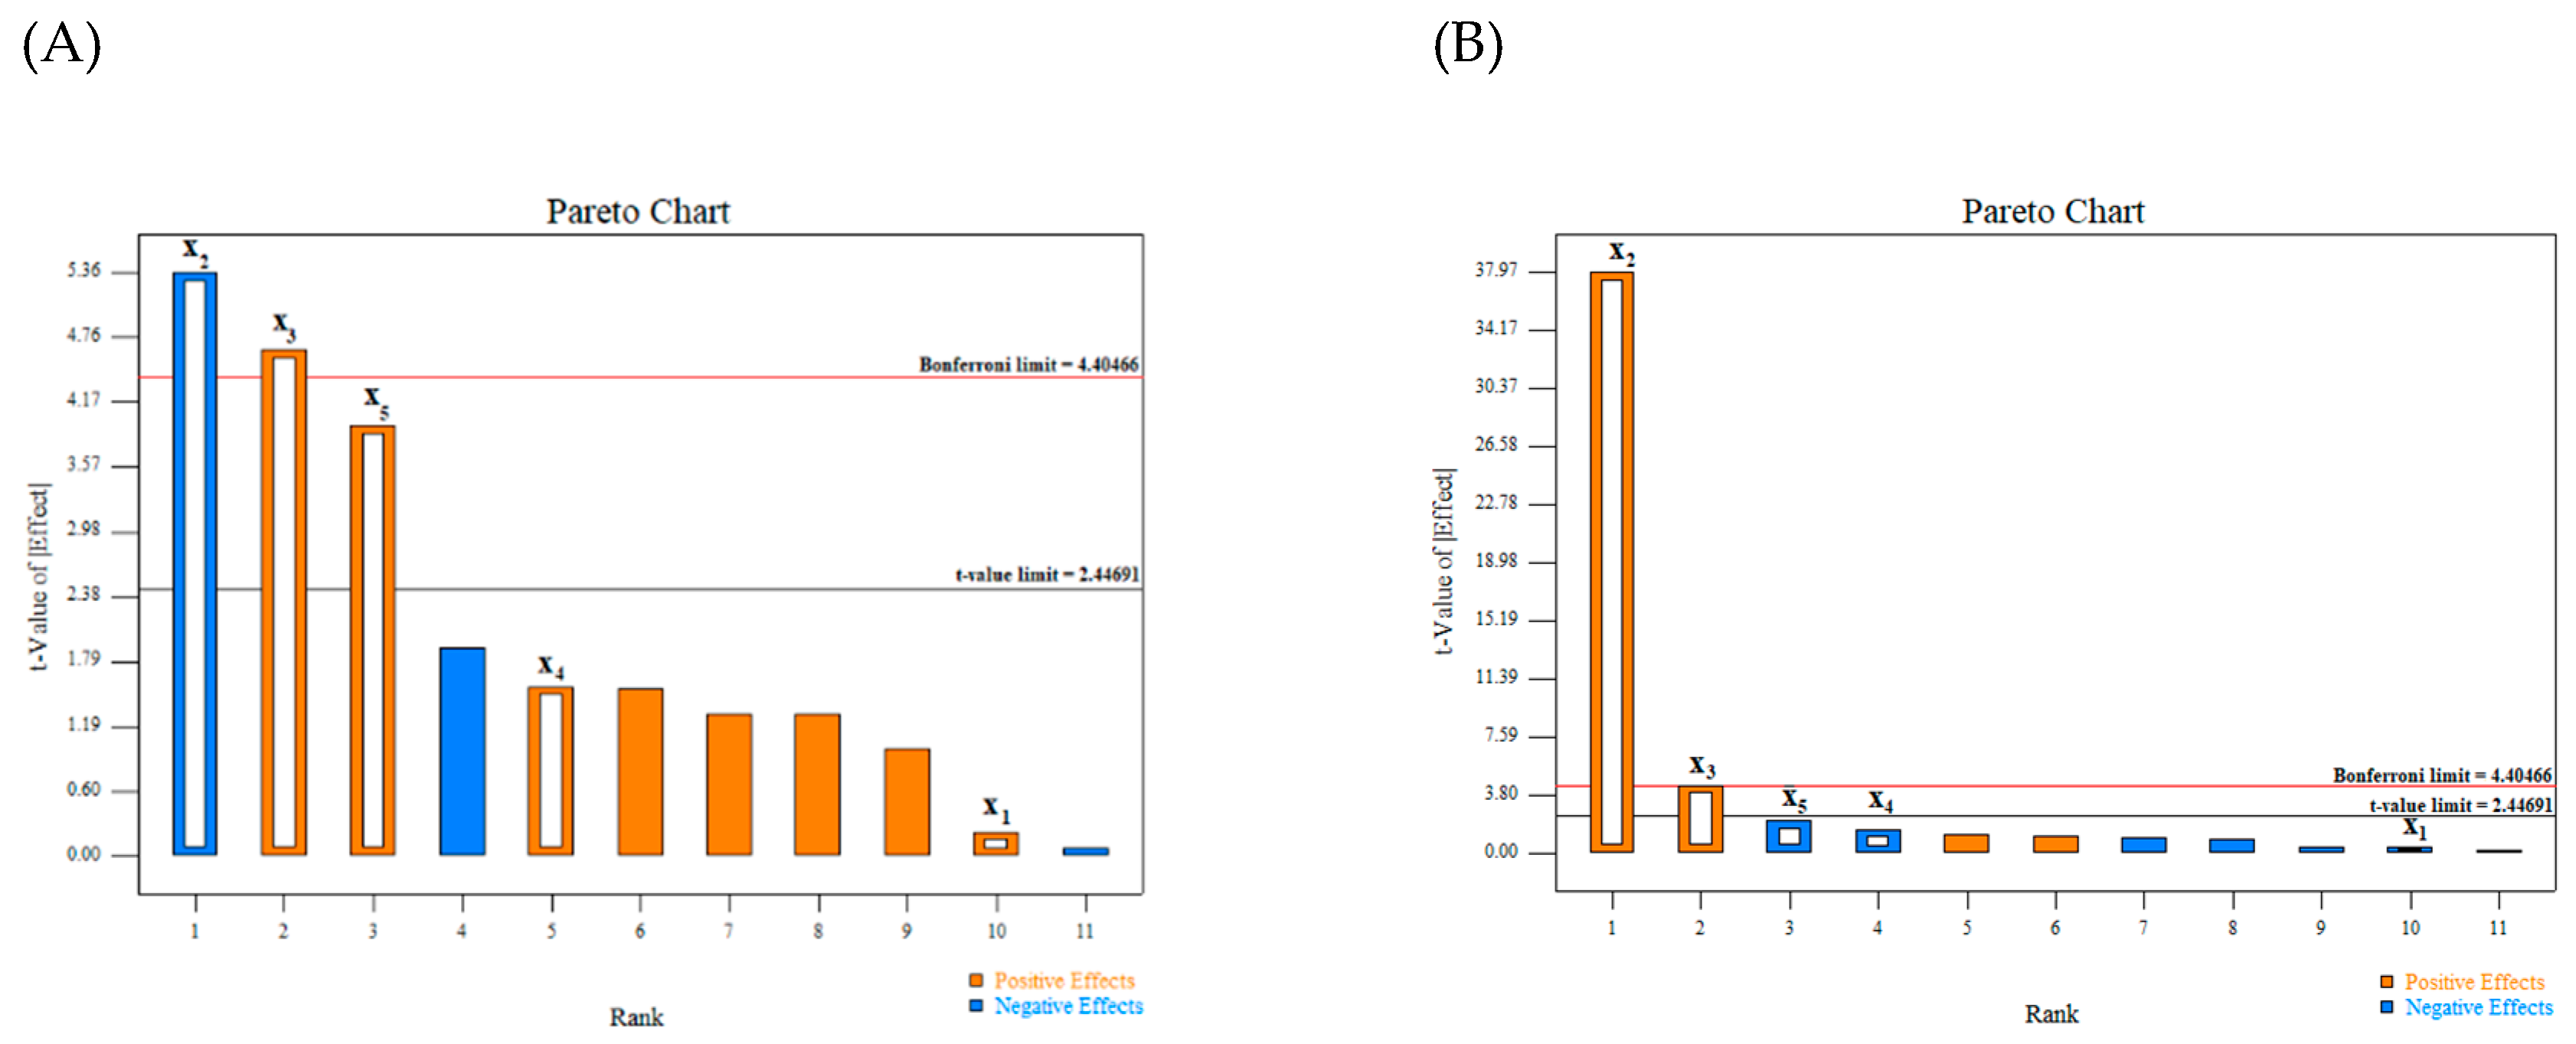
3.3. Screening of Significant Variables Using Plackett–Burman Design
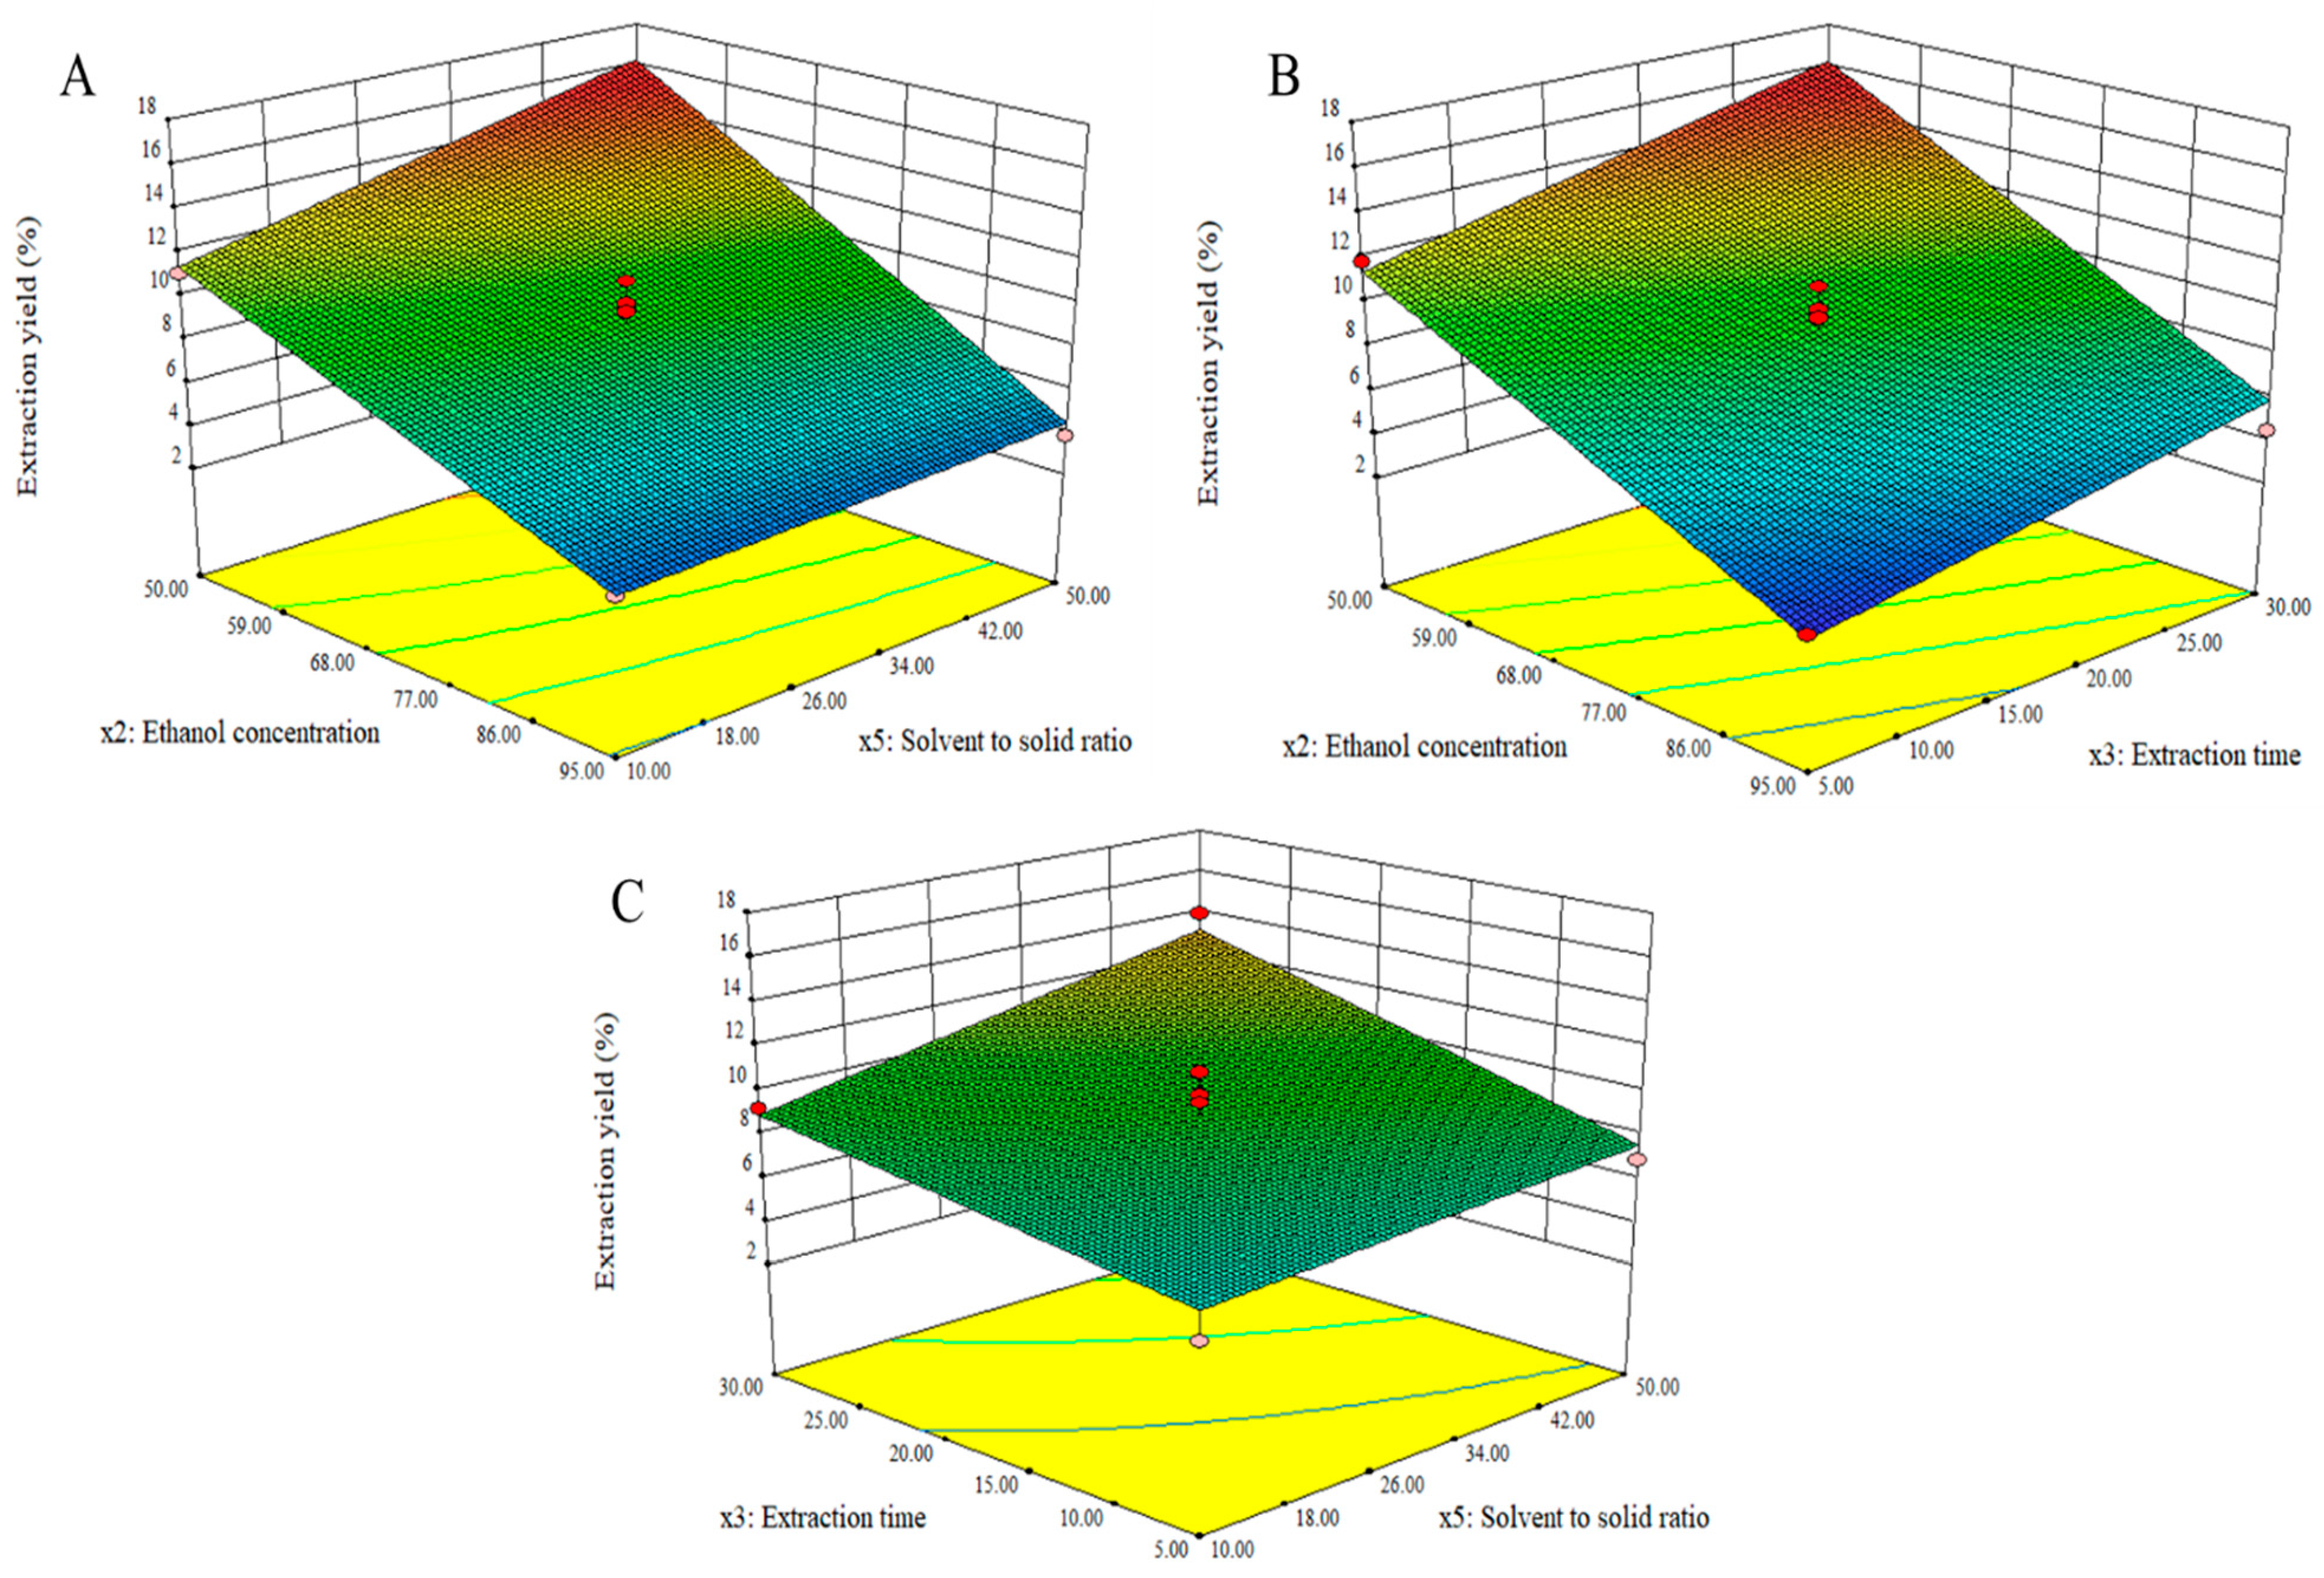
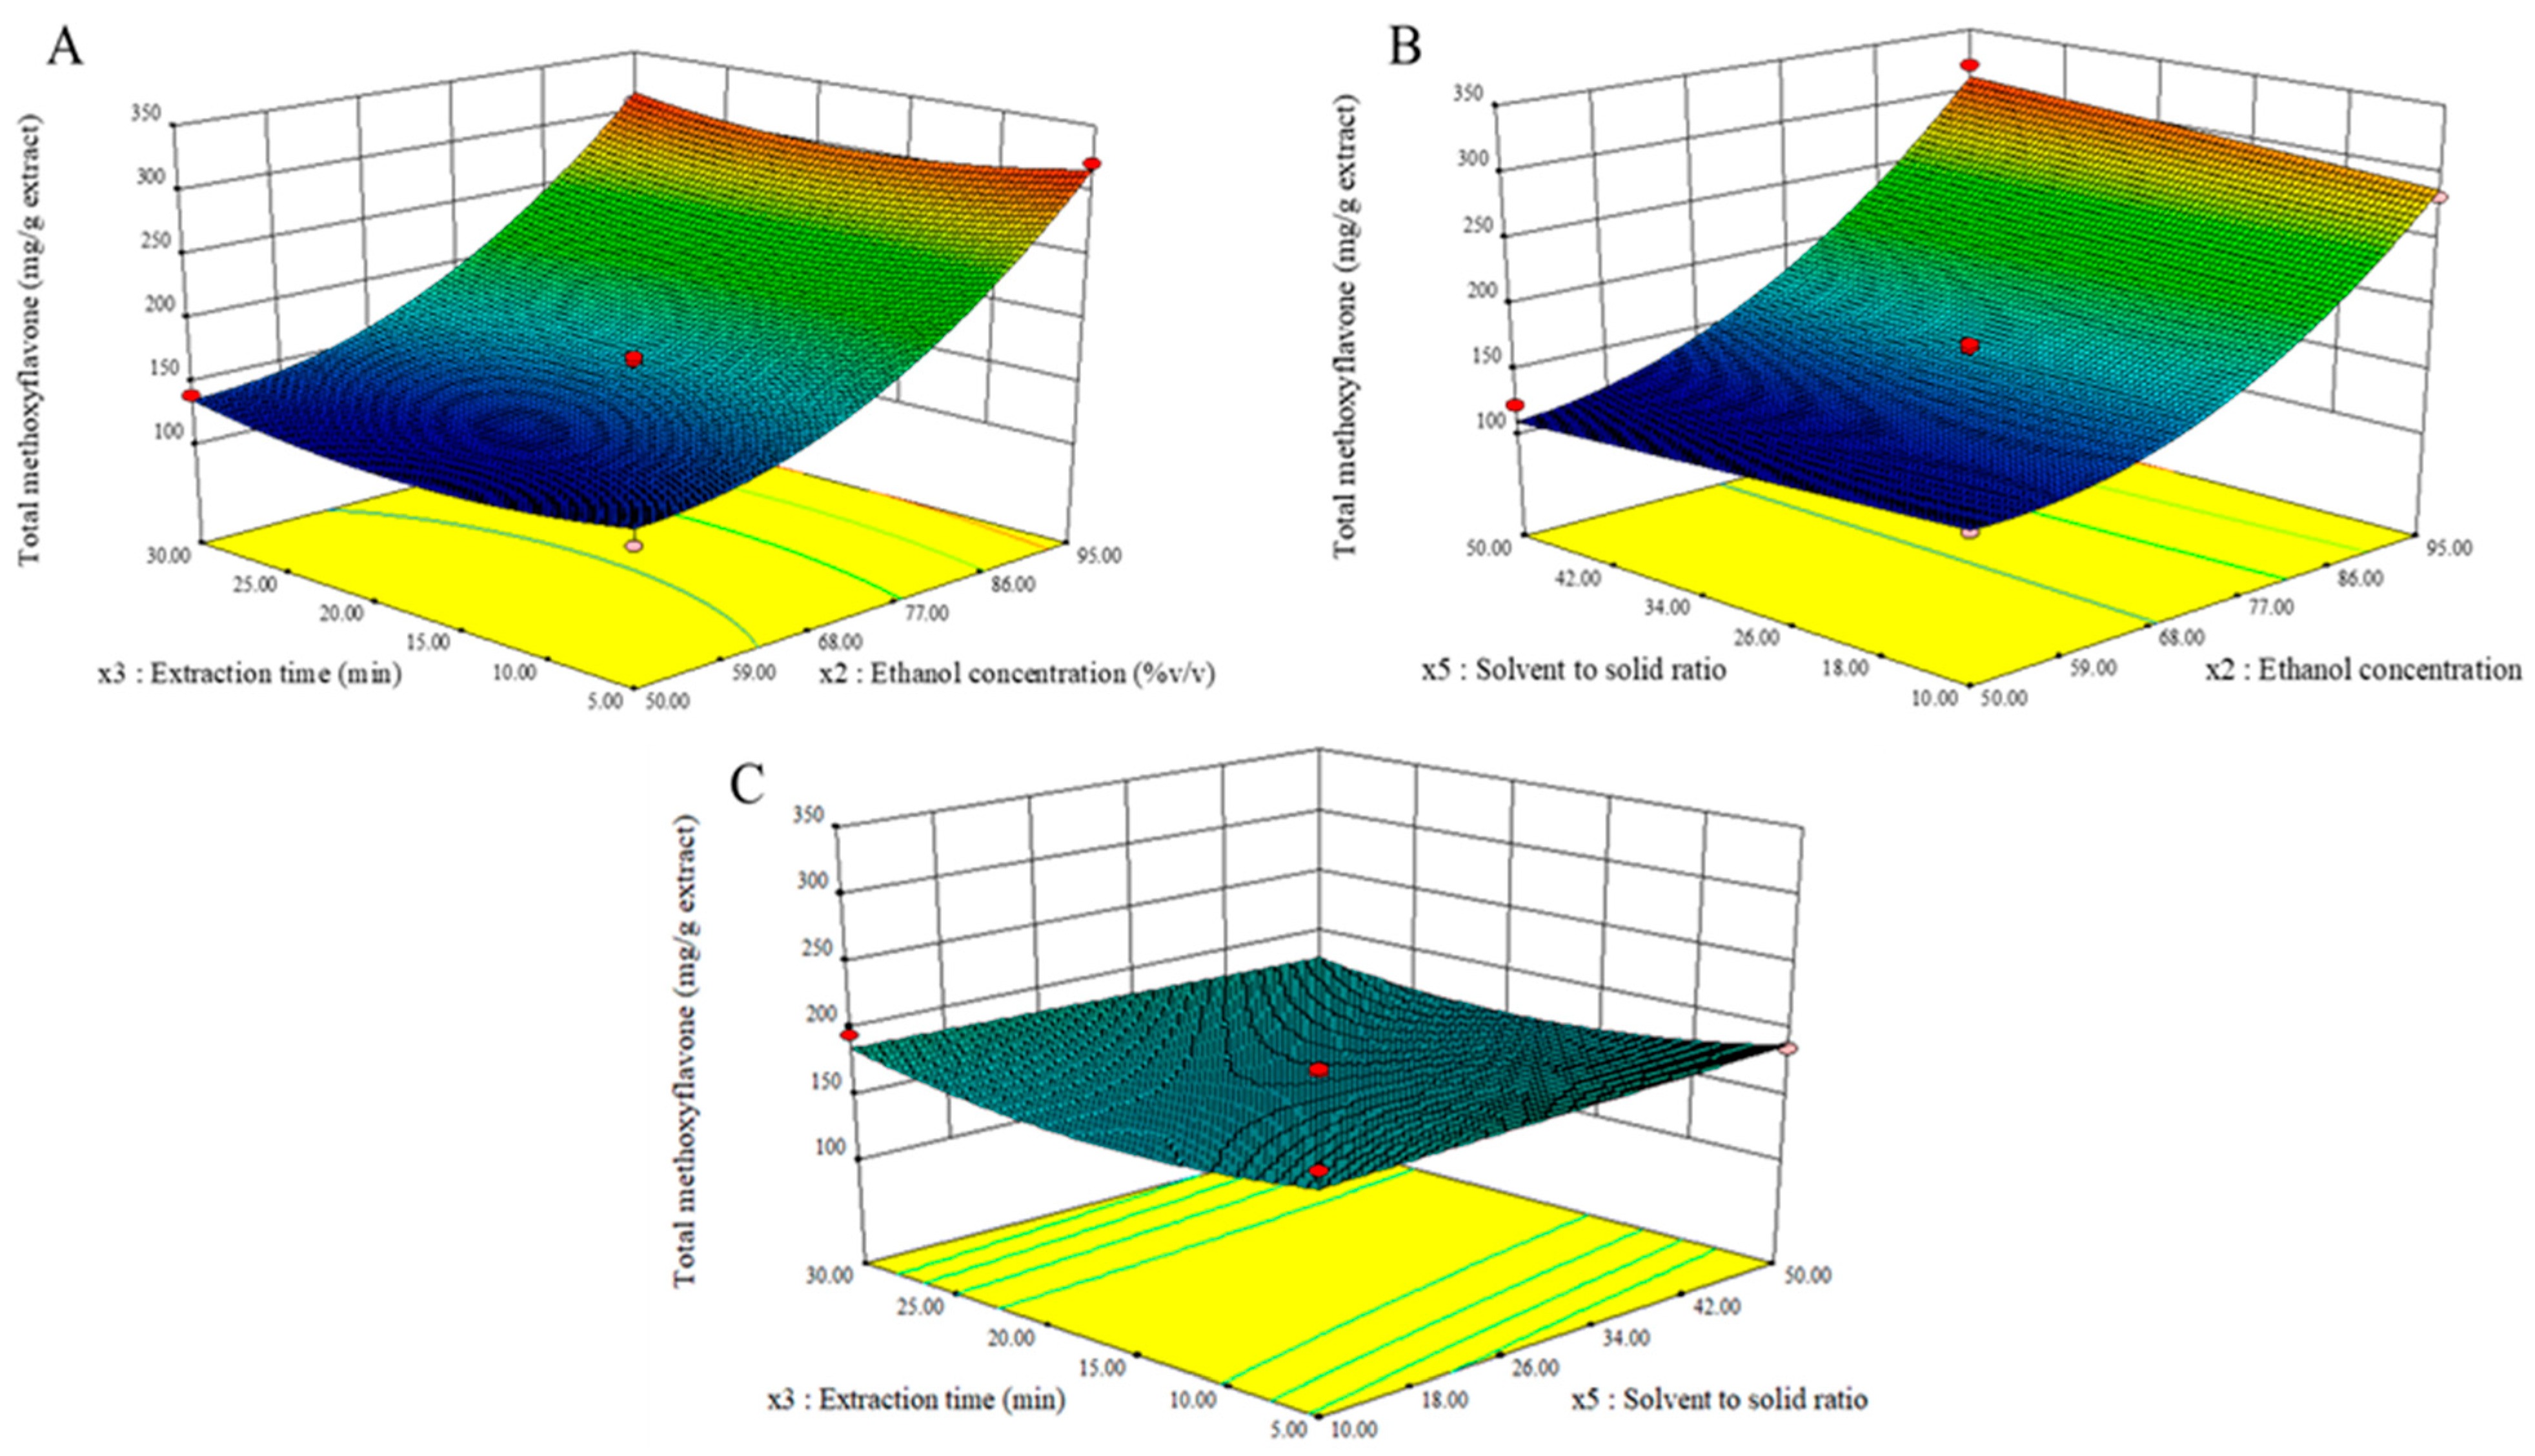
3.4. Optimization of Significant Variables by Box–Behnken Design
3.5. Verification of Predictive Model
4. Conclusions
Author Contributions
Funding
Institutional Review Board Statement
Informed Consent Statement
Data Availability Statement
Acknowledgments
Conflicts of Interest
Sample Availability
References
- Wattanathorn, J.; Muchinapura, S.; Tong-Un, T.; Saenghong, N.; Thukhum-mee, W.; Sripanidkulchai, B. Positive modulation effect of 8-week consumption of Kaempferia parviflora on health-related physical fitness and oxidative status in healthy elderly volunteers. Evid. Based Complement. Alternat. Med. 2012, 2012, 732816. [Google Scholar] [CrossRef] [PubMed]
- Chen, D.; Li, H.; Li, W.; Feng, S.; Deng, D. Kaempferia parviflora and its methoxyflavones: Chemistry and biological activities. Evid. Based Complement. Alternat. Med. 2018, 2018, 4057456. [Google Scholar] [CrossRef] [PubMed]
- Toda, K.; Hitoe, S.; Takeda, S.; Shimoda, H. Black ginger extract increases physical fitness performance and muscular endurance by improving inflammation and energy metabolism. Heliyon 2016, 2, e00115. [Google Scholar] [CrossRef]
- Krongrawa, K.; Limmatvapirat, S.; Saibua, S.; Limmatvapirat, C. Effects of gamma irradiation under vacuum and air packaging atmospheres on the phytochemical contents, biological activities, and microbial loads of Kaempferia parviflora rhizomes. Radiat. Phys. Chem. 2020, 173, 108947. [Google Scholar] [CrossRef]
- Araujo, P. Key aspects of analytical method validation and linearity evaluation. J. Chromatogr. B 2009, 877, 2224–2234. [Google Scholar] [CrossRef]
- Ab Rahman, Z.; Abd Shukor, S.; Abbas, H.; Machap, C.A.L.; Alias, M.S.B.; Mirad, R.; Sofiyanand, S.; Othman, A.N. Optimization of extraction conditions for total phenolics and total flavonoids from Kaempferia parviflora rhizomes. Adv. Biosci. Biotechnol. 2018, 9, 205–214. [Google Scholar] [CrossRef][Green Version]
- Chemat, F.; Pombaut, N.; Sicaire, A.G.; Meullemiestre, A.; Tixier, F.; Vian, M.A. Ultrasound assisted extraction of food and natural products. Mechanisms, techniques, combinations, protocols and applications. A review. Ultrason. Sonochem. 2017, 34, 540–560. [Google Scholar] [CrossRef]
- Falleh, H.; Ksouri, R.; Lucchessi, M.E.; Abdelly, C.; Magne, C. Ultrasound-assisted extraction: Effect of extraction time and solvent power on the levels of polyphenols and antioxidant activity of Mesembryanthemum edule L. Aizoaceae shoots. Trop. J. Pharm. Res. 2012, 11, 243–249. [Google Scholar] [CrossRef]
- Vinatoru, M.; Mason, T.J.; Calinescu, I. Ultrasonically assisted extraction (UAE) and microwave assisted extraction (MAE) of functional compounds from plant materials. Trends Analyt. Chem. 2017, 97, 159–178. [Google Scholar] [CrossRef]
- Wang, D.; Zhang, L.; Xu, Y.; Qi, X.; Wang, X.; Wang, X.; Zhang, Q.; Li, P. Optimization of an ultrasound-assisted extraction for simultaneous determination of antioxidants in sesame with response surface methodology. Antioxidants 2019, 8, 321. [Google Scholar] [CrossRef]
- Singh, J. International Conference on Harmonization of Technical Requirements for the Registration of Pharmaceuticals for Human Use. J. Pharmacol. Pharmacother. 2005, 6, 185–187. [Google Scholar] [CrossRef] [PubMed]
- Marquina, S.; García, Y.; Alvarez, L.; Tortoriello, J. 3-Acetoxy-7-methoxyflavone, a novel flavonoid from the anxiolytic extract of Salvia elegans (Lamiaceae). Nat. Prod. Commun. 2008, 3, 185–188. [Google Scholar] [CrossRef]
- Ono, S.; Yoshida, N.; Maekawa, D.; Kitakaze, T.; Kobayashi, Y.; Kitano, T.; Fujita, T.; Okuwa-Hayashi, H.; Harada, N.; Nakano, Y.; et al. 5-Hydroxy-7-methoxyflavone derivatives from Kaempferia parviflora induce skeletal muscle hypertrophy. Food Sci. Nutr. 2019, 7, 312–321. [Google Scholar] [CrossRef] [PubMed]
- Nutter, J.; Fernandez, M.V.; Jagus, R.J.; Agüero, M.V. Development of an aqueous ultrasound-assisted extraction process of bioactive compounds from beet leaves: A proposal for reducing losses and increasing biomass utilization. J. Sci. Food Agric. 2021, 101, 1989–1997. [Google Scholar] [CrossRef] [PubMed]
- Tuntiyasawasdikul, S.; Limpongsa, E.; Jaipakdee, N.; Sripanidkulchai, B. Transdermal permeation of Kaempferia parviflora methoxyflavones from isopropyl myristate-based vehicles. AAPS PharmSciTech. 2014, 15, 947–955. [Google Scholar] [CrossRef][Green Version]
- The United States Pharmacopeial Convention. The United States Pharmacopeia, 43rd Rev., and the National Formulary, 38th ed.; The United States Pharmacopeial Convention: Rockville, MD, USA, 2020.
- Đorđević, B.; Troter, D.; Stanojević, L.; Veljković, V. The extraction of quercetin from waste onion (Allium cepa L.): Tunic by the aqueous solutions of different deep eutectic solvents. Adv. Technol. 2018, 7, 5–10. [Google Scholar] [CrossRef]
- Chandran, S.; Singh, R.S.P. Comparison of various international guidelines for analytical method validation. Pharmazie 2007, 62, 4–14. [Google Scholar]
- Rafi, M.; Darusman, L.K.; Nurasiah, E.S.; Syafitri, U.D. Optimization of extraction conditions for andrographolide using fractional factorial design. Indonesian J. Pharm. 2014, 25, 145–152. [Google Scholar] [CrossRef]
- Zhang, Q.; Lin, L.; Ye, W. Techniques for extraction and isolation of natural products: A comprehensive review. Chin. Med. 2018, 13, 20. [Google Scholar] [CrossRef]
- Paulucci, V.P.; Couto, R.O.; Teixeira, C.C.C.; Freitas, L.A.P. Optimization of the extraction of curcumin from Curcuma longa rhizomes. Rev. Bras. Farmacogn. Braz. J. Pharmacogn. 2013, 23, 94–100. [Google Scholar] [CrossRef]
- Ngamkhaea, N.; Monthakantirat, O.; Chulikhit, Y.; Boonyarat, C.; Maneenet, J.; Khamphukdee, C.; Kwankhao, P.; Pitiporn, S.; Daodee, S. Optimization of extraction method for Kleeb Bua Daeng formula and comparison between ultrasound-assisted and microwave-assisted extraction. J. Appl. Res. Med. Aromat. Plants 2022, 28, 100369. [Google Scholar] [CrossRef]


| Symbols | Independent Variables | Levels | |
|---|---|---|---|
| −1 (Low Level) | +1 (High Level) | ||
| x1 | Type of solvent | Methanol | Ethanol |
| x2 | Organic solvent concentration (% v/v) | 50 | 95 |
| x3 | Extraction time (min) | 5 | 30 |
| x4 | Extraction temperature (°C) | 30 | 80 |
| x5 | Solvent-to-solid ratio (mL/g) | 10 | 50 |
| Symbols | Independent Variables | Levels | ||
|---|---|---|---|---|
| −1 (Low Level) | 0 (Center Level) | +1 (High Level) | ||
| x1 | Ethanol concentration (% v/v) | 50 | 72.5 | 95 |
| x2 | Solvent-to-solid ratio (mL/g) | 10 | 30 | 50 |
| x3 | Extraction time (min) | 5 | 17.5 | 30 |
| Methoxyflavones | Linearity Range (μg/mL) | Regression Equation | R2, n = 5 | LOD (μg/mL) | LOQ (μg/mL) |
|---|---|---|---|---|---|
| PMF | 2.61–104.50 | Y = 46.8460x + 11.6360 | 0.9999 | 0.99 | 2.98 |
| DMF | 2.76–110.51 | Y = 95.4880x + 24.4180 | 0.9995 | 0.52 | 1.48 |
| TMF | 3.22–128.74 | Y = 33.4950x + 3.5629 | 0.9999 | 1.44 | 4.40 |
| Methoxyflavones | Accuracy, n = 5 (% Recovery) | Precision, n = 5 | ||
|---|---|---|---|---|
| Concentration (μg/mL) | Intra-Day Precision (% RSD) | Inter-Day Precision (% RSD) | ||
| PMF | 109.00 ± 0.40–109.86 ± 3.72 | 2.61–104.50 | 0.06–0.29 | 0.34–1.70 |
| DMF | 92.23 ± 0.61–113.48 ± 0.51 | 2.76–110.51 | 0.06–0.46 | 1.17–3.15 |
| TMF | 92.41 ± 0.50–100.75 ± 0.88 | 3.22–128.74 | 0.03–0.95 | 0.52–1.83 |
| Run | Independent Variables | Dependent Variables (Responses) | |||||
|---|---|---|---|---|---|---|---|
| x1 | x2 (% v/v) | x3 (min) | x4 (°C) | x5 (mL/g) | Extraction Yields (%) | Total Methoxyflavone Contents (mg/g Extract) | |
| 1 | Ethanol | 50 | 5 | 30 | 10 | 7.81 | 88.94 |
| 2 | Methanol | 50 | 30 | 70 | 50 | 16.64 | 104.19 |
| 3 | Ethanol | 95 | 5 | 70 | 50 | 6.49 | 255.38 |
| 4 | Methanol | 95 | 5 | 30 | 10 | 3.67 | 273.73 |
| 5 | Methanol | 95 | 30 | 30 | 10 | 7.70 | 286.44 |
| 6 | Methanol | 50 | 30 | 70 | 10 | 10.36 | 103.69 |
| 7 | Ethanol | 50 | 30 | 30 | 50 | 14.72 | 111.63 |
| 8 | Ethanol | 95 | 30 | 30 | 50 | 9.08 | 273.87 |
| 9 | Methanol | 50 | 5 | 30 | 50 | 10.22 | 83.56 |
| 10 | Ethanol | 50 | 5 | 70 | 10 | 9.27 | 95.73 |
| 11 | Methanol | 95 | 5 | 70 | 50 | 8.66 | 240.29 |
| 12 | Ethanol | 95 | 30 | 70 | 10 | 8.89 | 277.09 |
| Source | Sum of Squares | df | Mean Square | F-Value | p-Value | Significant | Remarks |
|---|---|---|---|---|---|---|---|
| Y1 (Extraction yields) | |||||||
| Model | 119.35 | 5 | 23.87 | 13.69 | 0.0031 | Yes | |
| x1 | 0.08 | 1 | 0.08 | 0.05 | 0.8365 | No | |
| x2 | 50.05 | 1 | 50.05 | 28.70 | 0.0017 | Yes | |
| x3 | 37.71 | 1 | 37.71 | 21.62 | 0.0035 | Yes | |
| x4 | 4.22 | 1 | 4.22 | 2.42 | 0.1710 | No | |
| x5 | 27.30 | 1 | 27.30 | 15.65 | 0.0075 | Yes | |
| Residual | 10.46 | 6 | 1.74 | R2 = 0.9194 | |||
| Cor total | 129.82 | 11 | R2 (adj.) = 0.8522 | ||||
| Y2 (Total methoxyflavone contents) | |||||||
| Model | 88,146.13 | 5 | 17,629.23 | 293.68 | <0.0001 | Yes | |
| x1 | 9.61 | 1 | 9.61 | 0.16 | 0.7030 | No | |
| x2 | 86,537.84 | 1 | 86,537.84 | 1441.61 | <0.0001 | Yes | |
| x3 | 1185.45 | 1 | 1185.45 | 19.75 | 0.0044 | Yes | |
| x4 | 145.41 | 1 | 145.41 | 2.42 | 0.1706 | No | |
| x5 | 267.81 | 1 | 267.81 | 4.46 | 0.0791 | No | |
| Residual | 360.17 | 6 | 60.03 | R2 = 0.9259 | |||
| Cor total | 88,506.30 | 11 | R2 (adj.) = 0.9125 | ||||
| Run | Independent Variables | Dependent Variables (Responses) | |||
|---|---|---|---|---|---|
| x2 (% v/v) | x3 (min) | x5 (mL/g) | Y1 (Extraction Yields, %) | Y2 (Total Methoxyflavone Contents, mg/g Extract) | |
| 1 | 95 | 50 | 17.5 | 3.85 | 320.56 |
| 2 | 72.5 | 30 | 17.5 | 9.58 | 165.13 |
| 3 | 72.5 | 30 | 17.5 | 9.51 | 170.37 |
| 4 | 50 | 30 | 5 | 11.86 | 123.29 |
| 5 | 72.5 | 50 | 30 | 13.95 | 173.40 |
| 6 | 72.5 | 30 | 17.5 | 10.92 | 166.89 |
| 7 | 72.5 | 50 | 5 | 6.85 | 185.50 |
| 8 | 95 | 10 | 17.5 | 3.81 | 281.98 |
| 9 | 50 | 10 | 17.5 | 11.16 | 127.84 |
| 10 | 72.5 | 10 | 30 | 9.21 | 195.92 |
| 11 | 95 | 30 | 30 | 4.51 | 308.03 |
| 12 | 50 | 50 | 17.5 | 15.36 | 121.80 |
| 13 | 72.5 | 10 | 5 | 5.08 | 189.75 |
| 14 | 50 | 30 | 30 | 15.06 | 138.89 |
| 15 | 72.5 | 30 | 17.5 | 9.86 | 155.02 |
| 16 | 95 | 30 | 5 | 2.68 | 321.05 |
| 17 | 72.5 | 30 | 17.5 | 9.86 | 159.19 |
| Source | Sum of Squares | df | Mean Square | F-Value | p-Value | Significant | Remarks |
|---|---|---|---|---|---|---|---|
| Y1 (Extraction yields) | |||||||
| Model | 233.60 | 3 | 77.87 | 50.01 | <0.0001 | Yes | R2 = 0.9203 |
| x2 | 186.13 | 1 | 186.13 | 119.53 | <0.0001 | Yes | R2 (adj.) = 0.9019 |
| x3 | 14.45 | 1 | 14.45 | 9.28 | 0.0094 | Yes | Adeq. precision = 22.65 % CV = 9.85 |
| x5 | 33.02 | 1 | 33.02 | 21.20 | 0.0005 | Yes | |
| Residual | 20.24 | 13 | 1.56 | ||||
| Lack of fit | 5.55 | 3 | 1.85 | 6.47 | 0.0566 | No | |
| Pure error | 1.30 | 4 | 0.33 | ||||
| Y2 (Total methoxyflavone contents) | |||||||
| Model | 74,317.50 | 3 | 18,579.37 | 139.70 | <0.0001 | Yes | R2 = 0.9790 |
| x2 | 64,770.84 | 1 | 64,770.84 | 487.02 | <0.0001 | Yes | R2 (adj.) = 0.9720 |
| x22 | 8007.07 | 1 | 8007.07 | 60.21 | <0.0001 | Yes | Adeq. precision = 31.50 % CV = 5.93 |
| x32 | 1168.82 | 1 | 1168.82 | 8.79 | 0.0118 | Yes | |
| Residual | 1595.92 | 13 | 132.99 | ||||
| Lack of fit | 1444.30 | 9 | 180.54 | 4.76 | 0.0743 | No | |
| Pure error | 151.62 | 4 | 37.91 | ||||
| Run | Total Yields (%) | Total Methoxyflavone Contents (mg/g Extract) | ||||
|---|---|---|---|---|---|---|
| Predictive Value | Experimental Value | Error (%) | Predictive Value | Experimental Value | Error (%) | |
| 1 | 16.95 | 16.33 | 3.66 | 327.25 | 322.48 | 1.48 |
| 2 | 16.95 | 16.19 | 4.48 | 327.25 | 323.62 | 1.12 |
| 3 | 16.95 | 16.53 | 2.48 | 327.25 | 315.61 | 3.69 |
| 4 | 16.95 | 16.15 | 4.71 | 327.25 | 331.69 | 1.34 |
| 5 | 16.95 | 16.56 | 2.30 | 327.25 | 321.81 | 1.69 |
Publisher’s Note: MDPI stays neutral with regard to jurisdictional claims in published maps and institutional affiliations. |
© 2022 by the authors. Licensee MDPI, Basel, Switzerland. This article is an open access article distributed under the terms and conditions of the Creative Commons Attribution (CC BY) license (https://creativecommons.org/licenses/by/4.0/).
Share and Cite
Krongrawa, W.; Limmatvapirat, S.; Saibua, S.; Limmatvapirat, C. Optimization of Ultrasound-Assisted Extraction of Yields and Total Methoxyflavone Contents from Kaempferia parviflora Rhizomes. Molecules 2022, 27, 4162. https://doi.org/10.3390/molecules27134162
Krongrawa W, Limmatvapirat S, Saibua S, Limmatvapirat C. Optimization of Ultrasound-Assisted Extraction of Yields and Total Methoxyflavone Contents from Kaempferia parviflora Rhizomes. Molecules. 2022; 27(13):4162. https://doi.org/10.3390/molecules27134162
Chicago/Turabian StyleKrongrawa, Wantanwa, Sontaya Limmatvapirat, Supachai Saibua, and Chutima Limmatvapirat. 2022. "Optimization of Ultrasound-Assisted Extraction of Yields and Total Methoxyflavone Contents from Kaempferia parviflora Rhizomes" Molecules 27, no. 13: 4162. https://doi.org/10.3390/molecules27134162
APA StyleKrongrawa, W., Limmatvapirat, S., Saibua, S., & Limmatvapirat, C. (2022). Optimization of Ultrasound-Assisted Extraction of Yields and Total Methoxyflavone Contents from Kaempferia parviflora Rhizomes. Molecules, 27(13), 4162. https://doi.org/10.3390/molecules27134162