Article

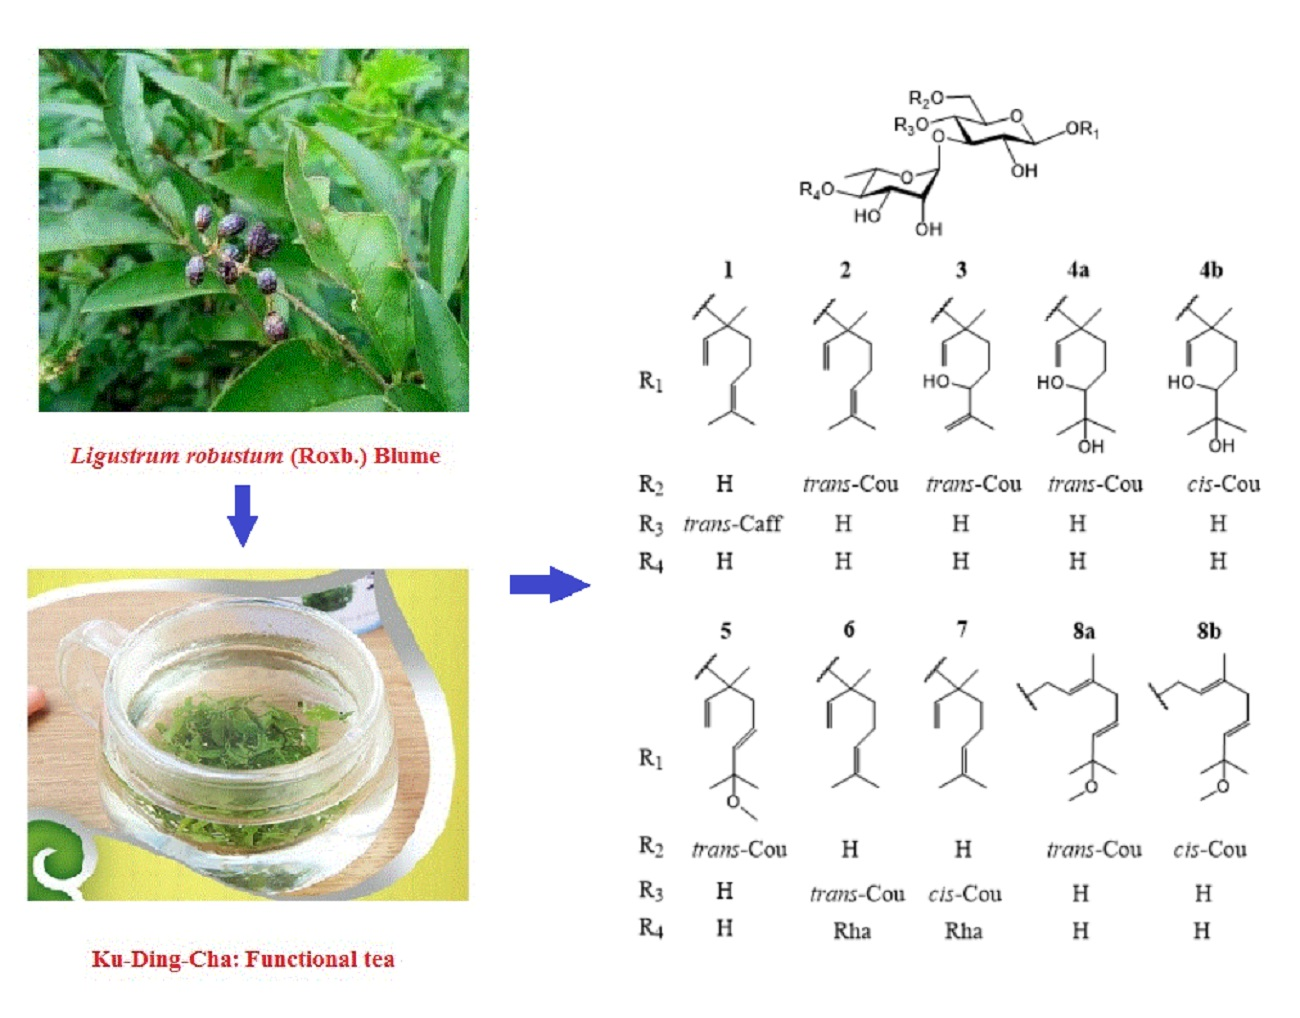
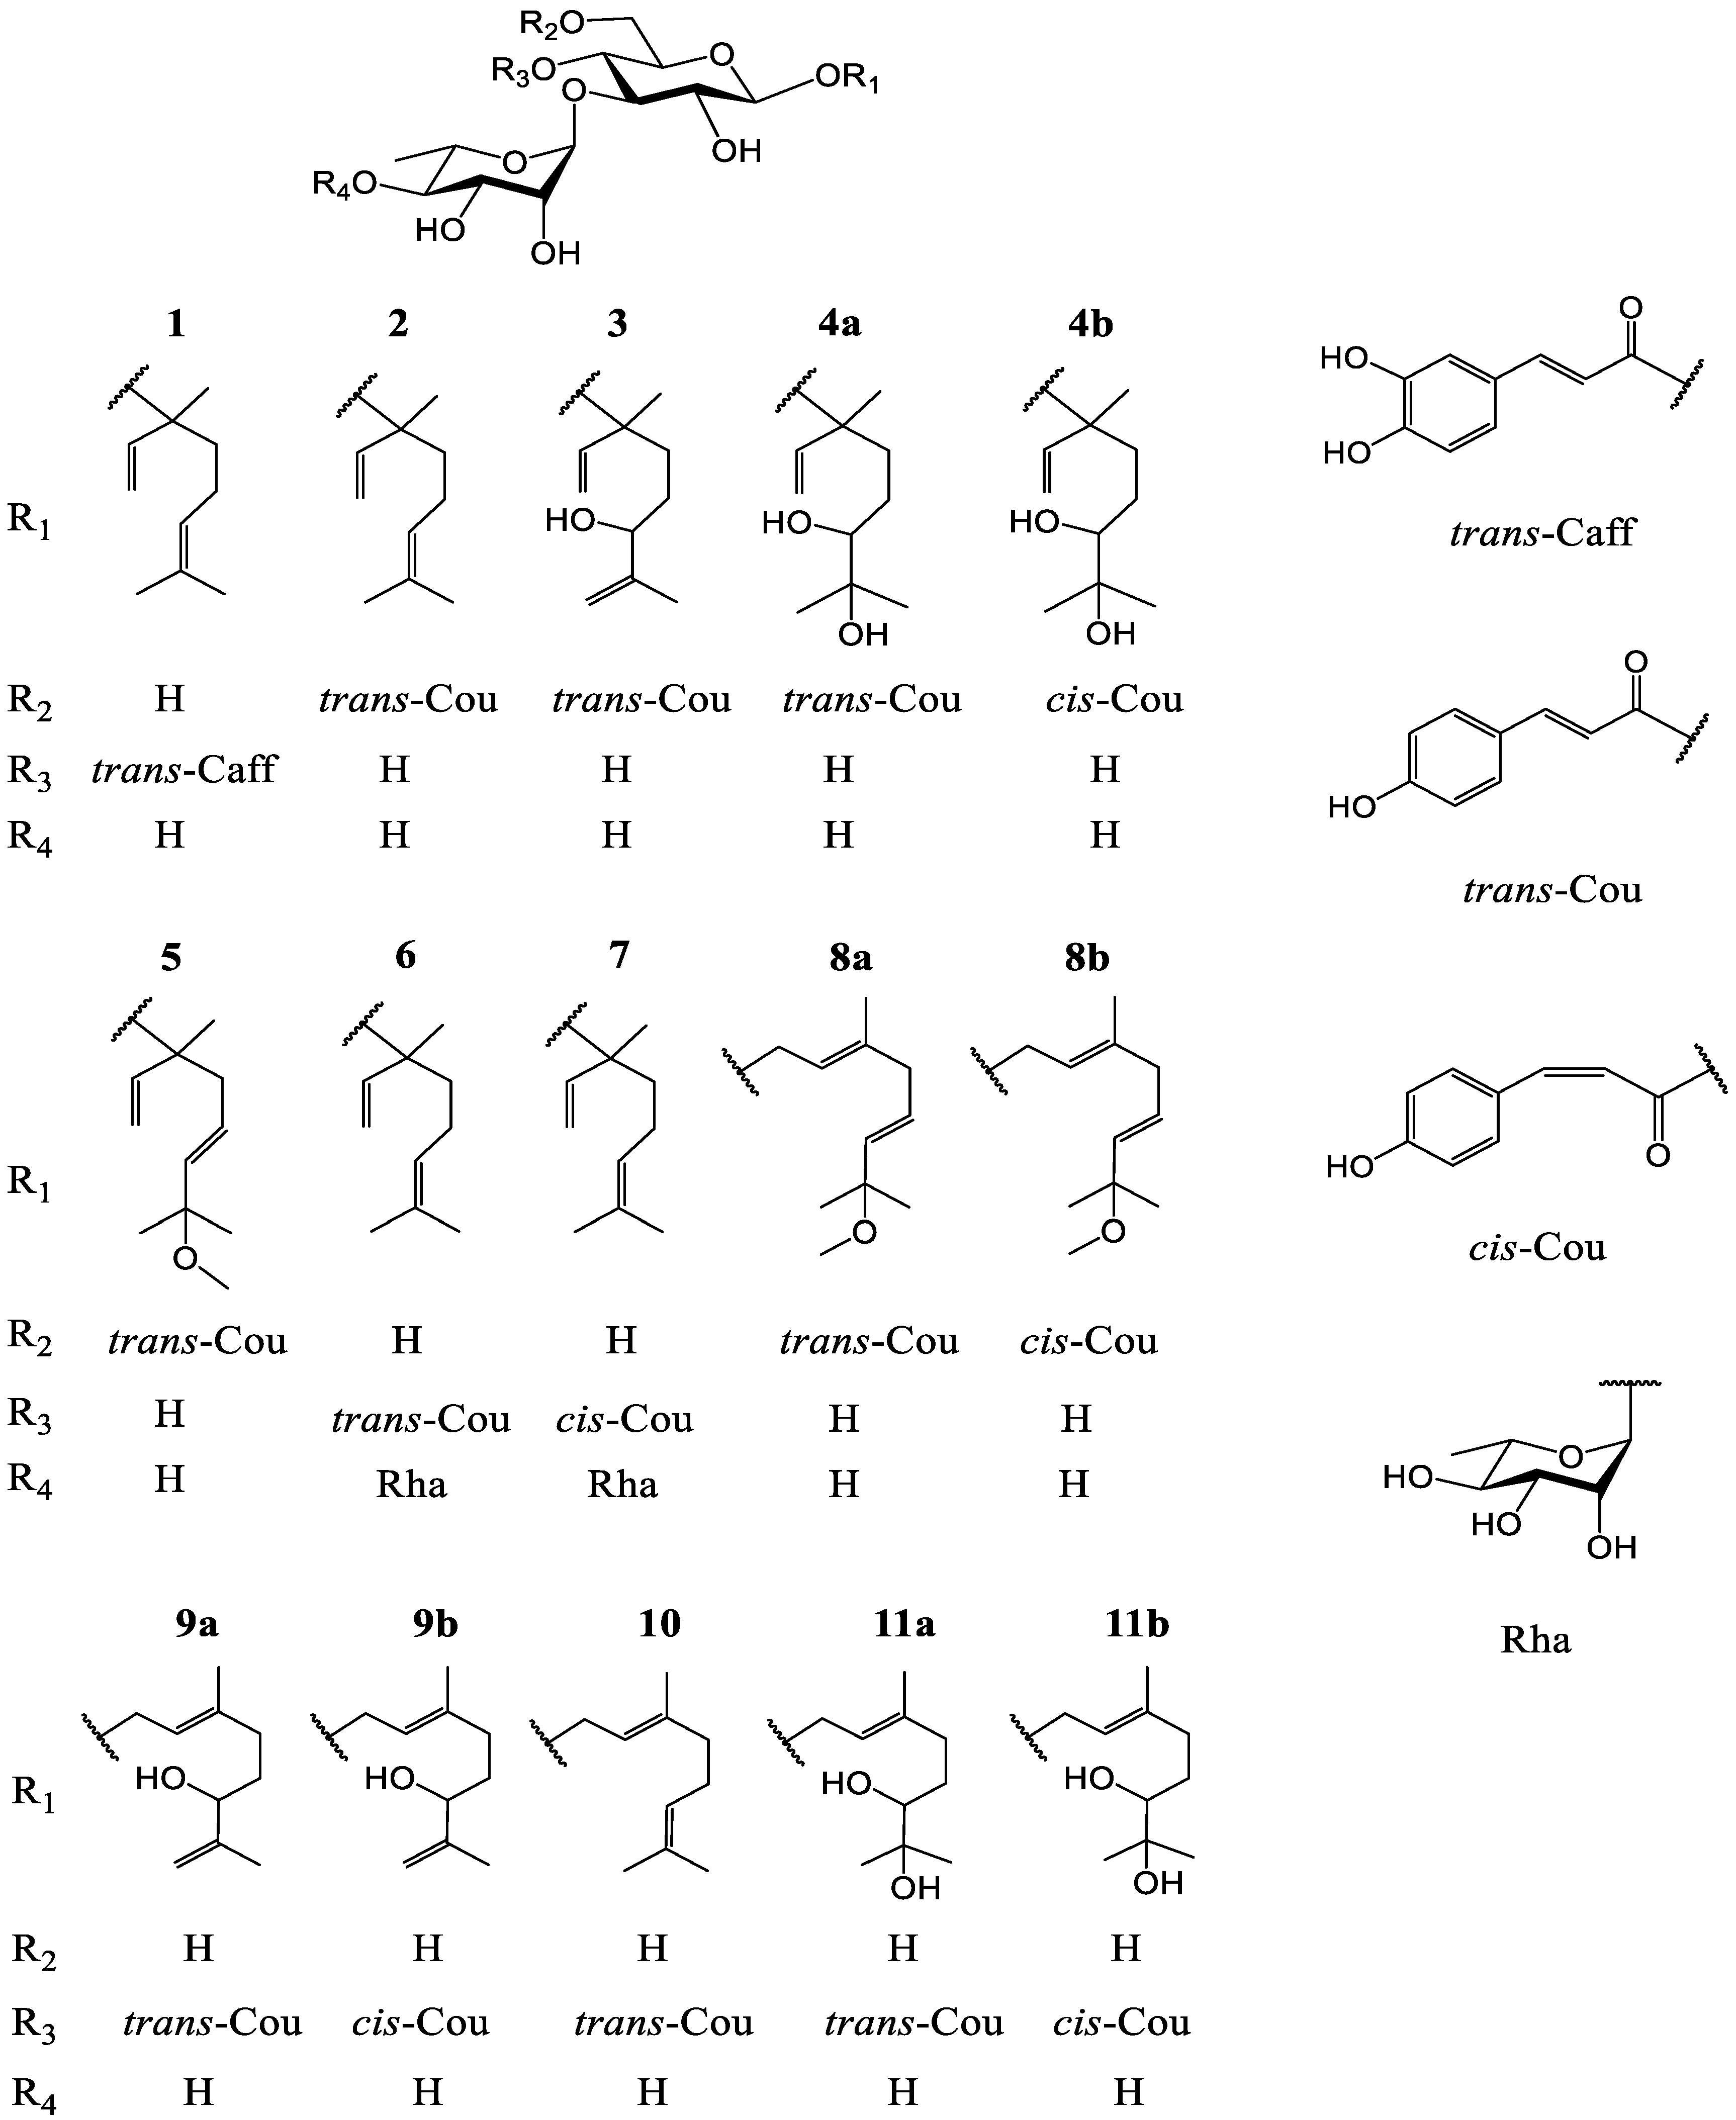
Monoterpenoid Glycosides from the Leaves of Ligustrum robustum and Their Bioactivities

1
College of Pharmacy, Youjiang Medical University for Nationalities, Baise 533000, China
2
Key Laboratory of Drug Targeting, Ministry of Education, West China School of Pharmacy, Sichuan University, Chengdu 610041, China
3
Department of Laboratory Science of Public Health, West China School of Public Health, Sichuan University, Chengdu 610041, China
*
Authors to whom correspondence should be addressed.
These authors contributed equally to this article.
Molecules 2022, 27(12), 3709; https://doi.org/10.3390/molecules27123709
Submission received: 8 May 2022 / Revised: 23 May 2022 / Accepted: 7 June 2022 / Published: 9 June 2022
(This article belongs to the Collection Bioactive Compounds)

Abstract

:
The leaves of Ligustrum robustum have been applied as Ku-Ding-Cha, a functional tea to clear heat, remove toxins, and treat obesity and diabetes, in Southwest China. The phytochemical research on the leaves of L. robustum led to the isolation and identification of eight new monoterpenoid glycosides (18) and three known monoterpenoid glycosides (911). Compounds 111 were tested for the inhibitory activities on fatty acid synthase (FAS), α-glucosidase, α-amylase, and the antioxidant effects. Compound 2 showed stronger FAS inhibitory activity (IC50: 2.36 ± 0.10 μM) than the positive control orlistat (IC50: 4.46 ± 0.13 μM), while compounds 1, 2, 5 and 11 displayed more potent ABTS radical scavenging activity (IC50: 6.91 ± 0.10~9.41 ± 0.22 μM) than the positive control L-(+)-ascorbic acid (IC50: 10.06 ± 0.19 μM). This study provided a theoretical basis for the leaves of L. robustum as a functional tea to treat obesity.

Graphical Abstract

1. Introduction

Ku-Ding-Cha has been used widely as a functional tea to clear heat, remove toxins, and treat obesity, diabetes and so on, in Southwest China for a long time [1,2]. It was produced from the leaves of more than 30 plants from 13 genera in 12 families, in which the most common categories were from the genus Ligustrum (Oleaceae) and the genus Ilex (Aquifoliaceae) [3]. Ligustrum robustum (Roxb.) Blume, distributed widely in Southwest China, India, Burma, Vietnam and Cambodia, has been consumed as Ku-Ding-Cha in Southwest China, especially in Guizhou Province [4]. L. robustum has been classified as a food by the Chinese Ministry of Health since 2011 [5]. In the past two decades, the phytochemical studies on L. robustum led to the isolation and identification of monoterpenoid glycosides, phenylethanoid glycosides, iridoid glycosides, flavonoid glycosides and triterpenoids [1,6,7,8,9,10,11]. The biological research on L. robustum reported the anti-obesity activity of the total glycosides and the aqueous extract [2,5], the antioxidative, anti-inflammatory and hepato-protective effects of the aqueous extract [4], and the antioxidant effect of some constituents [1,10]. In our previous study on L. robustum [12], some antioxidative and α-glucosidase inhibitory components, which might be a part of anti-diabetic ingredients of L. robustum [13,14,15,16], were discovered. However, to the best of our knowledge, the exact anti-obesity ingredients of L. robustum and their mechanisms are still unclear so far.
Studies revealed that fatty acid synthase (FAS) catalyzed the synthesis of saturated long-chain fatty acids from acetyl-coenzyme A, malonyl-CoA and NADPH; FAS expressed high in normal adipose, liver tissues, lactating mammary glands, and in patient tumor tissues at later stages of disease, while most normal tissues showed low levels of FAS expression [17,18,19]. Thus, FAS is a potential therapeutic target for anti-obesity and anti-cancer drugs. There have been no reports on the screening FAS inhibitors from the constituents of L. robustum. In this work, eight new monoterpenoid glycosides, named ligurobustosides T (1), T1 (2), T2 (3), T3-4 (4), T5 (5), T6 (6), T7 (7), T8–9 (8), and three known monoterpenoid glycosides (911) (Figure 1) were isolated from the leaves of L. robustum. This paper deals with the isolation and structure elucidation of 111, and it describes their inhibitory activities on FAS, α-glucosidase, α-amylase, and their antioxidant effects.

2. Material and Methods

2.1. General Experimental Procedure

First, 1D and 2D NMR spectra were measured on a Bruker AscendTM 400 NMR spectrometer (Bruker, Germany) (1H at 400 MHz, 13C at 100 MHz) or an Agilent 600/54 Premium Compact NMR spectrometer (Agilent, Santa Clara, CA, USA) (1H at 600 MHz, 13C at 150 MHz) with CD3OD as the solvent at 25 °C. Chemical shifts are expressed in δ (ppm) with tetramethylsilane (TMS) as the internal standard, and coupling constants (J) are reported in Hz. High-resolution electrospray ionization mass spectroscopy (HRESIMS) was carried out on a Waters Q-TOF Premier mass spectrometer (Waters, Milford, MA, USA). The IR absorption spectrum was measured with a PerkinElmer Spectrum Two FT-IR spectrometer (PerkinElmer, Waltham, MA, USA). UV spectrum was recorded using a UV2700 spectrophotometer (Shimadzu, Kyoto, Japan). Optical rotation value was analyzed with an AUTOPOL VI automatic polarimeter (Rudolph, Hackettstown, NJ, USA).
UV-vis absorbance was analyzed with a Spark 10M microplate reader (Tecan Trading Co. Ltd., Shanghai, China). Preparative HPLC was performed on a GL3000-300 mL system instrument (Chengdu Gelai Precision Instruments Co., Ltd., Chengdu, China) with a GL C-18 column (particle size 5 μm, 50 × 450 mm) and a UV-3292 detector operating at 215 nm, eluting with MeOH-H2O at a flow rate of 30 mL/min. Column chromatography (CC) was performed on silica gel (SiO2: 200–300 mesh, Qingdao Ocean Chemical Industry Co., Qingdao, China), MCI-gel CHP-20P (75–150 μm, Mitsubishi Chemical Co., Tokyo, Japan), and polyamide (60–90 mesh, Jiangsu Changfeng Chemical Industry Co., Yangzhou, China). TLC was carried out on precoated HPTLC Fertigplatten Kieselgel 60 F254 plates (Merck), and the spots were visualized by spraying with α-naphthol-sulfuric acid solution or 10% sulfuric acid ethanolic solution and heating at 105 °C for 2–5 min. NADPH and acetyl-coenzyme A (Ac-CoA) were obtained from Zeye Biochemical Co., Ltd. (Shanghai, China). Methylmalonyl coenzyme A tetralithium salt hydrate (Mal-CoA) was purchased from Sigma-Aldrich (St. Louis, MO, USA). 2,2-Diphenyl-1-picrylhydrazyl (DPPH) was obtained from Macklin Biochemical Co., Ltd. (Shanghai, China). 2,2′-Azino-bis(3-ethylbenzthiazoline-6- sulphonic acid) ammonium salt (ABTS) was purchased from Aladdin Industrial Co., Ltd. (Shanghai, China).

2.2. Plant Material

The leaves of L. robustum were collected from Yibin City, Sichuan Province, China, in April 2017, and identified by Professor Guo-Min Liu (Kudingcha Research Institute, Hainan University, Haikou, 570228, China). A voucher specimen (No. 201704lsh) was deposited in West China School of Pharmacy, Sichuan University, China.

2.3. Extraction and Isolation

The fresh leaves of L. robustum were stirred and dried at 120 °C for 50 min and then powdered. The dried raw powder (7.0 kg) was extracted under reflux with 70% ethanol (28 L × 1) in a multi-function extractor for 2 h. The ethanol extract was filtrated and concentrated in vacuo to obtain a dark brown paste (2.2 kg). The paste was dissolved in 95% ethanol (3 L), and then, the distilled water (3 L) was added to precipitate the chlorophyll. After filtration, the filtrate was concentrated in vacuo to gain a brown residue (1.0 kg). The residue was chromatographed on silica gel column, eluting with CH2Cl2-MeOH (10:0–0:10), to yield Fr. I (84 g), Fr. II (145 g), Fr. III (93 g), and Fr. IV (70 g). Fr. II was separated repeatedly by CC on silica gel, eluting with CH2Cl2-MeOH-H2O (200:10:1–40:10:1) or EtOAc-MeOH-H2O (50:2:1–50:3:1), and then subjected to polyamide column (EtOH-H2O, 0:10–7:3) and MCI column (MeOH-H2O, 3:7–7:3), and purified finally by preparative HPLC (MeOH-H2O, 40:60–65:35) or silica gel column (EtOAc- MeOH-H2O, 50:2:1–50:3:1), to yield 1 (48.5 mg), 2 (49.2 mg), 3 (11.8 mg), 4 (15.3 mg), 5 (8.2 mg), 6 (17.6 mg), 7 (8.2 mg), 8 (10.7 mg), 9 (20.0 mg), 10 (135.8 mg) and 11 (38.6 mg).
Compound 1: yellowish amorphous powder. [α]20D-91.9 (c 0.27, MeOH); UV (MeOH) λmax: (log ε) 214 (4.2), 244 (4.1), 331 (4.4) nm; IR (film) νmax: 3375, 2923, 1694, 1630, 1601, 1515, 1446, 1376, 1261, 1025, 928, 836, 811 cm−1; 1H NMR (CD3OD, 400 MHz) data, see Table 1; 13C NMR (CD3OD, 100 MHz) data, see Table 2; HRESIMS m/z 647.2679 [M + Na]+ (calculated for C31H44NaO13, 647.2680).
Compound 2: white amorphous powder. [α]23D-29.9 (c 0.98, MeOH); UV (MeOH) λmax (log ε): 209 (3.9), 230 (3.9), 314 (4.4) nm; IR (film) νmax: 3375, 2927, 1689, 1632, 1604, 1515, 1445, 1263, 1169, 1037, 832 cm1; 1H NMR (CD3OD, 400 MHz) data, see Table 1; 13C NMR (CD3OD, 100 MHz) data, see Table 2; HRESIMS m/z 631.2728 [M + Na]+ (calculated for C31H44NaO12, 631.2730).
Compound 3: white amorphous powder. [α]25D-11.0 (c 0.47, MeOH); UV (MeOH) λmax (log ε): 208 (3.9), 230 (3.9), 316 (4.4) nm; IR (film) νmax: 3370, 2926, 2855, 1696, 1605, 1514, 1448, 1262, 1169, 1036, 833 cm1; 1H NMR (CD3OD, 600 MHz) data, see Table 1; 13C NMR (CD3OD, 100 MHz) data, see Table 2; HRESIMS m/z 647.2680 [M + Na]+ (calculated for C31H44NaO13, 647.2680).
Compound 4: white amorphous powder. [α]23D-20.9 (c 0.31, MeOH); UV (MeOH) λmax (log ε): 208 (3.9), 229 (3.9), 315 (4.4) nm; IR (film) νmax: 3369, 2924, 2854, 1695, 1632, 1604, 1515, 1448, 1262, 1170, 833 cm1; 1H NMR (CD3OD, 400 MHz) data, see Table 1; 13C NMR (CD3OD, 100 MHz) data, see Table 2; HRESIMS m/z 665.2784 [M + Na]+ (calculated for C31H46NaO14, 665.2785).
Compound 5: white amorphous powder. [α]23D-29.3 (c 0.16, MeOH); UV (MeOH) λmax (log ε): 209 (3.9), 228 (3.9), 315 (4.4) nm; IR (film) νmax: 3375, 2926, 1694, 1632, 1605, 1515, 1377, 1262, 1169, 1038, 833 cm1; 1H NMR (CD3OD, 400 MHz) data, see Table 1; 13C NMR (CD3OD, 100 MHz) data, see Table 2; HRESIMS m/z 661.2833 [M + Na]+ (calculated for C32H46NaO13, 661.2836).
Compound 6: white amorphous powder. [α]23D-71.0 (c 0.35, MeOH); UV (MeOH) λmax (log ε): 209 (3.9), 230 (3.9), 313 (4.4) nm; IR (film) νmax: 3410, 2973, 1696, 1604, 1515, 1381, 1260, 1168, 1046, 834 cm1; 1H NMR (CD3OD, 400 MHz) data, see Table 1; 13C NMR (CD3OD, 150 MHz) data, see Table 2; HRESIMS m/z 777.3312 [M + Na]+ (calculated for C37H54NaO16, 777.3310).
Compound 7: white amorphous powder. [α]23D-71.0 (c 0.35, MeOH); UV (MeOH) λmax (log ε): 208 (3.9), 230 (3.9), 316 (4.4) nm; IR (film) νmax: 3410, 2973, 1696, 1604, 1515, 1381, 1260, 1168, 1046, 834 cm1; 1H NMR (CD3OD, 400 MHz) data, see Table 1; 13C NMR (CD3OD, 150 MHz) data, see Table 2; HRESIMS m/z 777.3312 [M + Na]+ (calculated for C37H54NaO16, 777.3310).
Compound 8: white amorphous powder. [α]23D-17.8 (c 0.21, MeOH); UV (MeOH) λmax (log ε): 208 (3.9), 230 (3.9), 316 (4.4) nm; IR (film) νmax: 3391, 2925, 1697, 1632, 1605, 1515, 1446, 1264, 1169, 1041, 834 cm1; 1H NMR (CD3OD, 400 MHz) data, see Table 1; 13C NMR (CD3OD, 100 MHz) data, see Table 2; HRESIMS m/z 661.2831 [M + Na]+ (calculated for C32H46NaO13, 661.2836).

2.4. Acid Hydrolysis of Compounds 18

Compounds 18 (2 mg) in MeOH (0.1 mL) were added to 1 M H2SO4 aqueous solution (2 mL) and heated in 95 °C water bath for 6 h, respectively. The hydrolyzed solution was neutralized with 1 M Ba(OH)2, filtered and concentrated to a small amount. The monosaccharides in the concentrated solution were identified by TLC with authentic samples, developing with EtOAc-MeOH-HOAc-H2O (8:1:1:0.7, 2 developments). The Rf values of d-glucose, d-mannose and l-rhamnose were 0.43, 0.46 and 0.73, respectively.

2.5. Enzymatic Hydrolysis of Compounds 12

Compound 1 or 2 (20 mg) was hydrolyzed with cellulase (30 mg) in HOAc-NaOAc buffer solution (pH 5.0, 12 mL) at 37 °C for 12 h. The hydrolyzed product was extracted with Et2O and purified on silica gel column (eluting with CH2Cl2), to give (R)-linalool and (S)-linalool (4:6) confirmed by [α]27D +3.5 (c 0.09, EtOAc) or +2.8 (c 0.07, EtOAc).

2.6. Determination of Bioactivities

The inhibitory activities on FAS, α-glucosidase and α-amylase, and the DPPH and ABTS radical scavenging effects of compounds 111 were evaluated according to the methods described in the literature [12,18,20], while orlistat, acarbose and L-(+)-ascorbic acid were used as the positive controls, respectively (S1).

2.7. Statistical Analyses

Statistical analyses were carried out on GraphPad Prism 5.01. All samples were measured in triplicate. The IC50 (the final concentration of sample needed to inhibit 50% of enzyme activity or scavenge 50% of free radical) was obtained by plotting the inhibition or scavenging percentage of each sample against its concentration. The results are reported as mean ± standard deviation (SD). Differences of means between groups were analyzed by one-way analysis of variance (ANOVA) on statistical package SPSS 13.0. The differences between groups were believed to be significant when p < 0.05.

3. Results and Discussion

3.1. Identification of Compounds 111

Compound 1 was analyzed as C31H44O13 by HRESIMS (m/z 647.2679 [M + Na]+, calculated 647.2680 for C31H44NaO13). The 1H NMR spectrum of 1 (Table 1) revealed the following signals: (1) a 3,4-disubstituted phenyl at δH 7.05 (1H, d, J = 2.0 Hz), 6.95 (1H, dd, J = 8.0, 2.0 Hz) and 6.77 (1H, d, J = 8.0 Hz); (2) a trans double bond at δH 7.58 and 6.27 (1H each, d, J = 16.0 Hz); (3) a monosubstituted double bond at δH 5.22 (1H, dd, J = 10.8, 1.2 Hz), 5.26 (1H, dd, J = 17.6, 1.2 Hz) and 5.93 (1H, dd, J = 17.6, 10.8 Hz); (4) an olefinic proton at δH 5.10 (1H, tt, J = 7.2, 1.6 Hz); (5) two anomeric protons at δH 4.43 (1H, d, J = 8.0 Hz) and 5.18 (1H, d, J = 1.6 Hz); (6) two methylene groups at δH 2.04 (2H, m), 1.58, 1.62 (1H each, m), and four methyl groups at δH 1.67, 1.60, 1.39 (3H each, s), and 1.08 (3H, d, J = 6.4 Hz). The 13C NMR spectrum of 1 (Table 2) showed a carbonyl at δC 168.3, three double bonds at δC 114.7–148.0, a benzene ring at δC 115.2–149.8, two anomeric carbons at δC 99.4 and 103.1, nine sugar carbons at δC 62.5–82.0, a quaternary carbon at δC 81.6, two methylene groups at δC 23.6 and 42.6, and four methyl groups at δC 17.7–25.9. The above 1H and 13C NMR features of 1 were related closely to those of linaloyl-(3-O-α-l-rhamnopyranosyl)-(4-O-trans-p-coumaroyl)-β-d-glucopyranoside (lipedoside B-III) [21], except that the 4-substituted phenyl in lipedoside B-III was replaced by the 3,4-disubstituted phenyl in 1. The acid hydrolysis experiment of 1 gave d-glucose and l-rhamnose identified by TLC. Furthermore, the HMBC experiment of 1 (Figure 2) displayed the long-distance correlations: between δH 4.33 (H-1′ of glucosyl) and δC 81.6 (C-3 of aglycone), between δH 5.18 (H-1″ of rhamnosyl) and δC 82.0 (C-3′ of glucosyl), between δH 7.58 (H-7′′′ of caffeoyl) and δC 127.6 (C-1′′′ of caffeoyl), and between δH 4.89 (H-4′ of glucosyl) and δC 168.3 (carbonyl of caffeoyl). In addition, the enzymatic hydrolysis experiment of 1 gave (R)-linalool and (S)-linalool (4:6). The 1H and 13C NMR signals of 1 were assigned by 1H-1H COSY, HSQC and HMBC experiments (Figure S1). Based on the above evidence, compound 1 was characterized as a mixture (R:S = 4:6) of 3(R)- and 3(S)-linaloyl-(3-O-α-l-rhamnopyranosyl)-(4-O-trans-caffeoyl)-O-β-d-glucopyranoside. It is a novel monoterpenoid glycoside, named ligurobustoside T.
Compound 2 was determined as C31H44O12 by HRESIMS (m/z 631.2728 [M + Na]+, calculated 631.2730 for C31H44NaO12). The 1H and 13C NMR data of 2 (Table 1 and Table 2) were similar to those of 1, except the 4-O-trans-caffeoyl in 1 was replaced by a trans-p-coumaroyl [δH 6.81, 7.45 (2H each, d, J = 8.8 Hz)] at a different position in 2. The acid hydrolysis experiment of 2 gave d-glucose and l-rhamnose identified by TLC. The HMBC experiment of 2 (Figure 2) showed the long-distance correlations: between δH 4.39 (H-1′ of glucosyl) and δC 81.5 (C-3 of aglycone), between δH 5.17 (H-1″ of rhamnosyl) and δC 84.4 (C-3′ of glucosyl), and between δH 4.30, 4.45 (H-6′ of glucosyl) and δC 169.0 (carbonyl of coumaroyl). Additionally, the enzymatic hydrolysis experiment of 2 gave (R)-linalool and (S)-linalool (4:6). The 1H and 13C NMR signals of 2 were assigned by 1H-1H COSY, HSQC and HMBC experiments (Figure S2). Thus, compound 2 was confirmed as a mixture (R:S = 4:6) of 3(R)- and 3(S)-linaloyl-(3-O-α-l-rhamnopyranosyl)-(6-O-trans-p-coumaroyl)-O-β-d-glucopyranoside, which is a new monoterpenoid glycoside and named ligurobustoside T1.
Compound 3 was analyzed as C31H44O13 by HRESIMS (m/z 647.2680 [M + Na]+, calculated 647.2680 for C31H44NaO13). The 1H and 13C NMR data of 3 (Table 1 and Table 2) are similar to those of 2 except for some data of the aglycone. The HSQC experiment of 3 displayed the correlations between δH 4.78 (H-8a of aglycone), 4.88 (H-8b of aglycone) and δC 111.4 (C-8 of aglycone), meaning that the C-6 double bond in 2 was replaced by the C-7 double bond in 3. The 1H-1H COSY experiment of 3 (Figure 2) displayed the correlations between δH 1.22 (H-4 of aglycone), 3.95 (H-6 of aglycone) and δH 1.60 (H-5 of aglycone), meaning that a hydroxyl was linked at C-6 in 3. Thus, the aglycone of 3 was 3,7-dimethyl-octa-1,7-diene-3,6-diol. The acid hydrolysis experiment of 3 gave d-glucose and l-rhamnose identified by TLC. The HMBC experiment of 3 (Figure 2) displayed the long-distance correlations: between δH 4.38 (H-1′ of glucosyl) and δC 81.4 (C-3 of aglycone), between δH 5.17 (H-1″ of rhamnosyl) and δC 84.4 (C-3′ of glucosyl), and between δH 4.30, 4.45 (H-6′ of glucosyl) and δC 169.0 (carbonyl of coumaroyl). The 1H and 13C NMR signals of 3 were assigned by 1H-1H COSY, HSQC and HMBC experiments (Figure S3). Therefore, compound 3 was determined to be 3-(3,6-dihydroxy-3,7-dimethyl-octa-1,7-dienyl)-(3-O-α-l-rhamnopyranosyl)-(6-O-trans-p-coumaroyl)-O-β-d-glucopyranoside. It is a novel monoterpenoid glycoside named ligurobustoside T2.
Compound 4 was analyzed as C31H46O14 by HRESIMS (m/z 665.2784 [M + Na]+, calculated 665.2785 for C31H46NaO14). The NMR spectra of 4 showed two stereoisomers 4a and 4b (2:1). The 1H NMR spectrum of 4a (Table 1) displayed the following signals: (1) a 4-substituted phenyl at δH 6.81, 7.46 (2H each, d, J = 8.8 Hz); (2) a trans double bond at δH 6.34, 7.64 (1H each, d, J = 16.0 Hz); (3) a monosubstituted double bond at δH 5.19 (1H, dd, J = 10.8, 2.0 Hz), 5.24 (1H, dd, J = 18.0, 2.0 Hz) and 5.92 (1H, dd, J =18.0, 10.8 Hz); (4) two anomeric protons at δH 4.41 (1H, d, J = 8.0 Hz), 5.18 (1H, d, J = 2.0 Hz); (5) a methenyl at δH 3.21 (1H, dd, J = 10.4, 2.0 Hz); (6) two methylene groups at δH 1.32–1.90 (4H, m); (7) four methyl groups at δH 1.11, 1.14, 1.36 (3H each, s), 1.25 (3H, d, J = 6.4 Hz). The 13C NMR spectrum of 4a (Table 2) revealed a carbonyl at δC 169.0, two double bonds at δC 115.0–146.8, a 4-substituted phenyl at δC 116.9–161.4, two anomeric carbons at δC 99.4 and 102.7, nine sugar carbons at δC 64.9–84.2, two quaternary carbons at δC 73.9 and 81.5, a methenyl at δC 80.1, two methylene groups at δC 26.4 and 39.9, and four methyl groups at δC 17.9–25.8. The above 1H and 13C NMR data of 4a were similar to those of 3-(6,7-dihydroxy-3,7-dimethyloct-1-enyl)-(3-O-α-l-rhamnopyranosyl)-(4-O-trans-p-coumaroyl)-O-β-d-glucopyranoside (lipedoside B-VI) [21], except the trans-p-coumaroyl was linked at different positions. The acid hydrolysis experiment of 4 gave d-glucose and l-rhamnose identified by TLC. The HMBC experiment of 4a (Figure 2) displayed the long-distance correlations: between δH 4.41 (H-1′ of glucosyl) and δC 81.5 (C-3 of aglycone), between δH 5.18 (H-1″ of rhamnosyl) and δC 84.2 (C-3′ of glucosyl), and between δH 4.30, 4.45 (H-6′ of glucosyl) and δC 169.0 (carbonyl of coumaroyl). The 1H and 13C NMR signals of 4 were assigned by 1H-1H COSY, HSQC and HMBC experiments (Figure S4). So, 4a was identified as 3-(3,6,7-trihydroxy-3,7-dimethyloct-1-enyl)-(3-O-α-l-rhamnopyranosyl)-(6-O-trans-p-coumaroyl)-O-β-d-glucopyranoside.
The NMR data of 4b (Table 1 and Table 2) are similar to those of 4a, except the trans-p-coumaroyl in 4a was replaced by the cis-p-coumaroyl (δH 6.87, 5.78 (1H each, d, J = 12.8 Hz, H-7′′′, H-8′′′)) in 4b. The HMBC experiment of 4b (Figure 2) showed the long-distance correlations: between δH 4.36 (H-1′ of glucosyl) and δC 81.5 (C-3 of aglycone), between δH 5.15 (H-1″ of rhamnosyl) and δC 84.2 (C-3′ of glucosyl), and between δH 4.25, 4.40 (H-6′ of glucosyl) and δC 168.1 (carbonyl of coumaroyl). So, 4b was identified as 3-(3,6,7-trihydroxy-3,7-dimethyloct-1-enyl)-(3-O-α-l-rhamnopyranosyl)-(6-O-cis-p-cou-maroyl)-O-β-d-glucopyranoside. In conclusion, compound 4 is a mixture of novel monoterpenoid glycosides 4a and 4b, named ligurobustoside T3-4.
Compound 5 was analyzed as C32H46O13 by HRESIMS (m/z 661.2833 [M + Na]+, calculated 661.2836 for C32H46NaO13). The 1H and 13C NMR data of 5 (Table 1 and Table 2) are similar to those of 2 except for some data of the aglycone. The 1H-1H COSY experiment of 5 (Figure 2) displayed the correlations between δH 2.36 (2H, d, J = 7.2 Hz, H-4 of aglycone), 5.40 (1H, d, J = 16.0 Hz, H-6 of aglycone) and δH 5.64 (1H, dt, J = 16.0, 7.2 Hz, H-5 of aglycone), meaning that the C-6 double bond in 2 was replaced by the C-5(E) double bond in 5. The HMBC experiment of 5 (Figure 2) displayed the correlation between δH 3.09 (OCH3) and δC 76.5 (C-7 of aglycone). Hence, the aglycone of 5 was (5E)-7-methoxy-3,7-dimethyl-octa-1,5-dien-3-ol. The acid hydrolysis experiment of 5 gave d-glucose and l-rhamnose identified by TLC. The HMBC experiment of 5 (Figure 2) displayed the long-distance correlations: between δH 4.41 (H-1′ of glucosyl) and δC 81.2 (C-3 of aglycone), between δH 5.17 (H-1″ of rhamnosyl) and δC 84.2 (C-3′ of glucosyl), and between δH 4.32, 4.45 (H-6′ of glucosyl) and δC 168.9 (carbonyl of coumaroyl). The 1H and 13C NMR signals of 5 were assigned by 1H-1H COSY, HSQC and HMBC experiments (Figure S5). Therefore, compound 5 was determined to be (5E)-3-(3-hydroxy-7-methoxy-3,7-dimethyl-octa-1,5-dienyl)-(3-O-α-l-rhamnopyranosyl)-(6-O-trans-p-coumaroyl)-O-β-d-glucopyranoside. It is a novel monoterpenoid glycoside, named ligurobustoside T5.
Compound 6 was determined as C37H54O16 by HRESIMS (m/z 777.3312 [M + Na]+, calculated 777.3310 for C37H54NaO16). The 1H and 13C NMR data of 6 (Table 1 and Table 2) are similar to those of lipedoside B-III [21], except there was another rhamnosyl in 6. The acid hydrolysis experiment of 6 yielded d-glucose and l-rhamnose identified by TLC. The HMBC experiment of 6 (Figure 2) showed the long-distance correlations: between δH 4.44 (H-1′ of glucosyl) and δC 81.6 (C-3 of aglycone), between δH 5.19 (H-1″ of inner rhamnosyl) and δC 81.9 (C-3′ of glucosyl), between δH 5.04 (H-1′′′ of outer rhamnosyl) and δC 81.7 (C-4″ of inner rhamnosyl), and between δH 4.91 (H-4′ of glucosyl) and δC 168.2 (carbonyl of coumaroyl). The 1H and 13C NMR signals of 6 were assigned by 1H-1H COSY, HSQC and HMBC experiments (Figure S6). Thus, compound 6 was confirmed as linaloyl-[3-O-α-l-rhamnopyranosyl-(1→4)-α-l-rhamnopyranosyl]-(4-O-trans-p-coumaroyl)-O-β-d-glucopyranoside, which is a new monoterpenoid glycoside and named ligurobustoside T6.
Compound 7 was determined as C37H54O16 by HRESIMS (m/z 777.3312 [M + Na]+, calculated 777.3310 for C37H54NaO16). The 1H and 13C NMR data of 7 (Table 1 and Table 2) are related closely to those of 6, except the trans-p-coumaroyl (δH 7.66, 6.33 (1H each, d, J = 16.0 Hz, H-7′′′′, H-8′′′′)) in 6 was replaced by the cis-p-coumaroyl (δH 6.98, 5.76 (1H each, d, J = 12.8 Hz, H-7′′′′, H-8′′′′)) in 7. The acid hydrolysis experiment of 7 yielded d-glucose and l-rhamnose identified by TLC. The HMBC experiment of 7 (Figure 2) showed the long-distance correlations: between δH 4.41 (H-1′ of glucosyl) and δC 81.6 (C-3 of aglycone), between δH 5.29 (H-1″ of inner rhamnosyl) and δC 79.8 (C-3′ of glucosyl), between δH 5.13 (H-1′′′ of outer rhamnosyl) and δC 80.6 (C-4″ of inner rhamnosyl), and between δH 4.86 (H-4′ of glucosyl) and δC 166.9 (carbonyl of coumaroyl). The 1H and 13C NMR signals of 7 were assigned by 1H-1H COSY, HSQC and HMBC experiments (Figure S7). Thus, compound 7 was identified as linaloyl-[3-O-α-l-rhamnopyranosyl-(1→4)-α-l-rhamnopyranosyl]-(4-O-cis-p-coumaroyl)-O-β-d-glucopyranoside. It is a new monoterpenoid glycoside, named ligurobustoside T7.
Compound 8 was analyzed as C32H46O13 by HRESIMS (m/z 661.2831 [M + Na]+, calculated 661.2836 for C32H46NaO13). The NMR spectra of 8 exhibited two stereoisomers 8a and 8b (2:1). The 1H NMR spectrum of 8a (Table 1) displayed the following signals: (1) a 4-substituted phenyl at δH 6.80, 7.45 (2H each, d, J = 8.4 Hz); (2) two trans double bonds at δH 6.35, 7.64 (1H each, d, J = 16.0 Hz), 5.44 (1H, d, J = 15.6 Hz), 5.55 (1H, m); (3) an olefinic proton at δH 5.41 (1H, t, J = 8.0 Hz); (4) two anomeric protons at δH 4.31 (1H, d, J = 8.0 Hz), 5.17 (1H, d, J = 2.0 Hz); (5) two methylene groups at δH 4.27 (2H, d, J = 8.0 Hz), 2.76 (2H, d, J = 10.2 Hz); (6) four methyl groups at δH 1.23, 1.23, 1.65 (3H each, s), 1.24 (3H, d, J = 6.4 Hz); and (7) a methoxy at δH 3.12 (3H, s). The 13C NMR spectrum of 8a (Table 2) revealed a carbonyl at δC 169.1, three double bonds at δC 114.8–146.9, a 4-substituted phenyl at δC 117.0–161.7, two anomeric carbons at δC 102.6 and 102.7, nine sugar carbons at δC 64.7–84.0, a quaternary carbon at δC 76.4, two methylene groups at δC 66.3, 43.5, a methoxy at δC 50.6, and four methyl groups at δC 16.6-26.2. The above 1H and 13C NMR data of 8a were similar to those of (2E,5E)-1-(1,7-dihydroxy-3,7-dimethyl-2,5-octa- dienyl)-(3-O-α-l-rhamnopyranosyl)-(4-O-trans-p-coumaroyl)-O-β-d-glucopyranoside (ligurobustoside I) [8], except the trans-p-coumaroyl was linked at different positions, and there was another methyl in 8a. The HMBC experiment of 8a (Figure 2) showed the correlation between δH 3.12 (OCH3) and δC 76.4 (C-7 of aglycone). The NOEDS experiment of 8a (Figure 2) displayed the correlation between δH 5.41 (H-2 of aglycone) and δH 2.76 (H-4 of aglycone). Therefore, the aglycone of 8a was (2E,5E)-7-methoxy- 3,7-dimethyl-octa-2,5-dien-1-ol. The acid hydrolysis experiment of 8 gave d-glucose and l-rhamnose identified by TLC. The HMBC experiment of 8a (Figure 2) displayed the long-distance correlations: between δH 4.31 (H-1′ of glucosyl) and δC 66.3 (C-1 of aglycone), between δH 5.17 (H-1″ of rhamnosyl) and δC 84.0 (C-3′ of glucosyl), and between δH 4.35, 4.50 (H-6′ of glucosyl) and δC 169.1 (carbonyl of coumaroyl). The 1H and 13C NMR signals of 8 were assigned by 1H-1H COSY, HSQC and HMBC experiments (Figure S8). Consequently, the structure of 8a was determined to be (2E,5E)-1-(1-hydroxy-7-methoxy-3,7-dimethyl-octa-2,5-dienyl)-(3-O-α-l-rhamnopyranosyl)-(6-O- trans-p-coumaroyl)-O-β-d-glucopyranoside.
The NMR data of 8b (Table 1 and Table 2) are similar to those of 8a, except the trans-p-coumaroyl in 8a was replaced by the cis-p-coumaroyl (δH 6.87, 5.79 (1H each, d, J = 12.8 Hz, H-7′′′, H-8′′′)) in 8b. The HMBC experiment of 8b (Figure 2) displayed the long-distance correlations: between δH 4.27 (H-1′ of glucosyl) and δC 66.3 (C-1 of aglycone), between δH 5.16 (H-1″ of rhamnosyl) and δC 84.0 (C-3′ of glucosyl), and between δH 4.31, 4.48 (H-6′ of glucosyl) and δC 168.1 (carbonyl of coumaroyl). So, 8b was identified as (2E,5E)-1-(1-hydroxy-7-methoxy-3,7-dimethyl-octa-2,5-dienyl)-(3-O-α-l-rhamnopyranosyl)-(6-O-cis-p-coumaroyl)-O-β-d-glucopyranoside. In conclusion, compound 8 is a mixture of novel monoterpenoid glycosides 8a and 8b, named ligurobustoside T8–9.
Compounds 911 (NMR data see Tables S1–S3) were identified as ligurobustosides G (9a) and H (9b), ligurobustoside C (10), ligurobustosides K (11a) and L (11b), respectively, by direct comparison with published spectral data (1H, 13C NMR) [8,9].

3.2. The Bioactivities of Compounds 111

Compounds 111 from the leaves of L. robustum were tested for the inhibitory activities on FAS, α-glucosidase, α-amylase, and the antioxidant effects. The results of bioactivity assays are shown in Table 3. As shown in Table 3, compound 2 revealed stronger FAS inhibitory activity (IC50: 2.36 ± 0.10 μM) than the positive control orlistat (IC50: 4.46 ± 0.13 μM); compound 2 showed weaker α-glucosidase inhibitory effect than the positive control acarbose; compounds 26, 8, 9 and 11 displayed weaker α-amylase inhibitory effect than the positive control acarbose; compounds 1, 2, 5 and 11 exhibited more potent ABTS radical scavenging activity (IC50: 6.91 ± 0.10~9.41 ± 0.22 μM) than the positive control L-(+)-ascorbic acid (IC50: 10.06 ± 0.19 μM), while compound 1 displayed weaker DPPH radical scavenging activity (IC50: 19.74 ± 0.23 μM) than L-(+)-ascorbic acid (IC50: 13.66 ± 0.13 μM).
Because FAS is a potential therapeutic target for anti-obesity drugs [17,18,19], compounds 2, 6 and 10 with strong FAS inhibitory activity might be a part of the constituents with anti-obesity activity in L. robustum. In addition, the results suggested that the FAS inhibitory activity would reduce or disappear when the monoterpene unit of glycoside was substituted with hydroxyl, or the trans-p-coumaroyl of glycoside was replaced by other groups.

4. Conclusions

In summary, the phytochemical research on the leaves of L. robustum resulted in the separation of eleven monoterpenoid glycosides (111), including eight new compounds (18) identified with spectroscopic method (1H, 13C NMR, 1H-1H COSY, HSQC, HMBC, NOEDS, HRESIMS), and physical and chemical methods. The biological study showed that compound 2 revealed stronger FAS inhibitory activity (IC50: 2.36 ± 0.10 μM) than the positive control orlistat (IC50: 4.46 ± 0.13 μM); compounds 1, 2, 5 and 11 displayed more potent ABTS radical scavenging activity (IC50: 6.91 ± 0.10~9.41 ± 0.22 μM) than the positive control L-(+)-ascorbic acid (IC50: 10.06 ± 0.19 μM); compound 2 revealed also moderate α-glucosidase and α-amylase inhibitory activities. This study provided a theoretical basis for the leaves of L. robustum as a functional tea to treat obesity.

Supplementary Materials

The following are available online https://www.mdpi.com/article/10.3390/molecules27123709/s1. 1H NMR, 13C NMR, 1H-1H COSY, HSQC, HMBC, HRESIMS and IR spectra of compounds 1 (Figure S1) and 36 (Figures S3–S6); 1H NMR, 13C NMR, HMBC, HRESIMS and IR spectra of compounds 2 (Figure S2) and 7 (Figure S7); 1H NMR, 13C NMR, 1H-1H COSY, HSQC, HMBC, NOEDS, HRESIMS and IR spectra of compound 8 (Figure S8); 1H NMR and 13C NMR data of 911 (Tables S1–S3); determination of bioactivities (S1).

Author Contributions

Conceptualization, S.-H.L., J.H. and H.-J.Z.; methodology, S.-H.L.; formal analysis, S.-H.L. and Z.-B.Z.; investigation, S.-H.L., H.-J.Z., Z.-B.Z. and C.-Y.Y.; data curation, J.H.; writing—original draft preparation, S.-H.L.; writing review and editing, J.H. and Z.-L.H.; supervision, J.H. and Z.-L.H.; funding acquisition, S.-H.L. All authors have read and agreed to the published version of the manuscript.

Funding

This research was funded by the Guangxi Natural Science Foundation Project (grant number 2020GXNSFAA297129), Guangxi Science and Technology Base and Talents Special Project (grant number Guike AD21075006), and Youjiang Medical University for Nationalities Science Research Project (grant number yy2021sk004).

Institutional Review Board Statement

Not applicable.

Informed Consent Statement

Not applicable.

Data Availability Statement

Not applicable.

Acknowledgments

The authors thank sincerely You Zhou and Fu Su, West China School of Pharmacy, Sichuan University, for the NMR measurements. The authors are grateful to Ming-Hai Tang, State Key Laboratory of Biotherapy, West China Hospital, Sichuan University, for the HRESIMS measurement.

Conflicts of Interest

The authors declare no conflict of interest. The funders had no role in the design of the study; in the collection, analyses, or interpretation of data; in the writing of the manuscript, or in the decision to publish the results.

Sample Availability

Samples of the compounds are not available from the authors.

References

  1. He, Z.D.; Lau, K.M.; But, P.P.-H.; Jiang, R.W.; Dong, H.; Ma, S.C.; Fung, K.P.; Ye, W.C.; Sun, H.D. Antioxidative glycosides from the leaves of Ligustrum robustum. J. Nat. Prod. 2003, 66, 851–854. [Google Scholar] [CrossRef] [PubMed]
  2. Yang, R.M.; Liu, F.; He, Z.D.; Ji, M.; Chu, X.X.; Kang, Z.Y.; Cai, D.Y.; Gao, N.N. Anti-obesity effect of total phenylpropanoid glycosides from Ligustrum robustum Blume in fatty diet-fed mice via up-regulating leptin. J. Ethnopharmacol. 2015, 169, 459–465. [Google Scholar] [CrossRef] [PubMed]
  3. Zhu, F.; Cai, Y.Z.; Sun, M.; Ke, J.X.; Lu, D.Y.; Corke, H. Comparison of major phenolic constituents and in vitro antioxidant activity of diverse kudingcha genotypes from Ilex kudingcha, Ilex cornuta, and Ligustrum robustum. J. Agric. Food Chem. 2009, 57, 6082–6089. [Google Scholar] [CrossRef] [PubMed]
  4. Lau, K.M.; He, Z.D.; Dong, H.; Fung, K.P.; But, P.P.-H. Anti-oxidative, anti-inflammatory and hepato-protective effects of Ligustrum robustum. J. Ethnopharmacol. 2002, 83, 63–71. [Google Scholar] [CrossRef]
  5. Xie, Z.M.; Zhou, T.; Liao, H.Y.; Ye, Q.; Liu, S.; Qi, L.; Huang, J.; Zuo, H.J.; Pei, X.F. Effects of Ligustrum robustum on gut microbes and obesity in rats. World J. Gastroenterol. 2015, 21, 13042–13054. [Google Scholar] [CrossRef]
  6. Li, L.; Peng, Y.; Xu, L.J.; Wu-Lan, T.N.; Shi, R.B.; Xiao, P.G. Chemical constituents from Ligustrum robustum Bl. Biochem. Syst. Ecol. 2010, 38, 398–401. [Google Scholar] [CrossRef]
  7. Li, L.; Peng, Y.; Liu, Y.; Xu, L.J.; Guo, N.; Shi, R.B.; Xiao, P.G. Two new phenethanol glycosides from Ligustrum robustum. Chin. Chem. Lett. 2011, 22, 326–329. [Google Scholar] [CrossRef]
  8. Tian, J.; Zhang, H.J.; Sun, H.D.; Pan, L.T.; Yao, P.; Chen, D.Y. Monoterpenoid glycosides from Ligustrum robustum. Phytochemistry 1998, 48, 1013–1018. [Google Scholar] [CrossRef]
  9. Tian, J.; Sun, H.D. New monoterpenoid glycosides from Ligustrum robustum. Chin. J. Appl. Environ. Biol. 1999, 5, 501–506. [Google Scholar]
  10. Yu, Z.L.; Zeng, W.C. Antioxidant, antibrowning, and cytoprotective activities of Ligustrum robustum (Roxb.) Blume extract. J. Food Sci. 2013, 78, 1354–1362. [Google Scholar]
  11. Yu, Z.L.; Gao, H.X.; Zhang, Z.; He, Z.; He, Q.; Jia, L.R.; Zeng, W.C. Inhibitory effects of Ligustrum robustum (Roxb.) Blume extract on α-amylase and α-glucosidase. J. Funct. Foods 2015, 19, 204–213. [Google Scholar] [CrossRef]
  12. Lu, S.-H.; Zuo, H.-J.; Shi, J.-X.; Li, C.-R.; Li, Y.-H.; Wang, X.; Li, L.-R.; Huang, J. Two new glycosides from the leaves of Ligustrum robustum and their antioxidant activities and inhibitory effects on α-glucosidase and α-amylase. S. Afr. J. Bot. 2019, 125, 521–526. [Google Scholar] [CrossRef]
  13. Jang, J.H.; Park, J.E.; Han, J.S. Scopoletin inhibits α-glucosidase in vitro and alleviates postprandial hyperglycemia in mice with diabetes. Eur. J. Pharmacol. 2018, 834, 152–156. [Google Scholar] [CrossRef]
  14. Sirdah, M.M. Protective and therapeutic effectiveness of taurine in diabetes mellitus: A rationale for antioxidant supplementation. Diabetes Metab. Syndr. Clin. Res. Rev. 2015, 9, 55–64. [Google Scholar] [CrossRef] [PubMed]
  15. Spadiene, A.; Savickiene, N.; Ivanauskas, L.; Jakstas, V.; Skesters, A.; Silova, A.; Rodovicius, H. Antioxidant effects of Camellia sinensis L. extract in patients with type 2 diabetes. J. Food Drug Anal. 2014, 22, 505–511. [Google Scholar] [CrossRef] [Green Version]
  16. Zemestani, M.; Rafraf, M.; Asghari-Jafarabadi, M. Chamomile tea improves glycemic indices and antioxidants status in patients with type 2 diabetes mellitus. Nutrition 2016, 32, 66–72. [Google Scholar] [CrossRef]
  17. Buckley, D.; Duke, G.; Heuer, T.S.; O’Farrell, M.; Wagman, A.S.; McCulloch, W.; Kemble, G. Fatty acid synthase—Modern tumor cell biology insights into a classical oncology target. Pharmacol. Therapeut. 2017, 177, 23–31. [Google Scholar] [CrossRef]
  18. Fan, H.J.; Wu, D.; Tian, W.X.; Ma, X.F. Inhibitory effects of tannic acid on fatty acid synthase and 3T3-L1 preadipocyte. Biochim. Biophys. Acta 2013, 1831, 1260–1266. [Google Scholar] [CrossRef]
  19. Lu, T.B.; Schubert, C.; Cummings, M.D.; Bignan, G.; Connolly, P.J.; Smans, K.; Ludovici, D.; Parker, M.H.; Meyer, C.; Rocaboy, C.; et al. Design and synthesis of a series of bioavailable fatty acid synthase (FASN) KR domain inhibitors for cancer therapy. Bioorg. Med. Chem. Lett. 2018, 28, 2159–2164. [Google Scholar] [CrossRef]
  20. Wu, D.; Ma, X.F.; Tian, W.X. Pomegranate husk extract, punicalagin and ellagic acid inhibit fatty acid synthase and adipogenesis of 3T3-L1 adipocyte. J. Func. Foods 2013, 5, 633–641. [Google Scholar] [CrossRef]
  21. He, Z.D.; Ueda, S.; Akaji, M.; Fujita, T.; Inoue, K.; Yang, C.R. Monoterpenoid and phenylethanoid glycosides from Ligustrum Pedunculare. Phytochemistry 1994, 36, 709–716. [Google Scholar] [CrossRef]
Figure 1. Structures of compounds 111 from the leaves of L. robustum.
Molecules 27 03709 g001
Figure 2. Key HMBC, 1H-1H COSY and NOEDS correlations of compounds 18.
Molecules 27 03709 g002
Table 1. 1H NMR data of compounds 18 from L. robustum in CD3OD a.
No1 b2 b3 c4a b4b b
15.22 dd (10.8, 1.2)5.19 dd (10.8, 1.2)5.19 br. d (10.8)5.19 dd (10.8, 2.0)5.19 dd (10.8, 2.0)
5.26 dd (17.6, 1.2)5.23 dd (18.0, 1.2)5.24 br. d (18.0)5.24 dd (18.0, 2.0)5.24 dd (18.0, 2.0)
25.93 dd (17.6, 10.8)5.90 dd (18.0, 10.8)5.90 dd (18.0, 10.8)5.92 dd (18.0, 10.8)5.92 dd (18.0, 10.8)
41.58 m 1.56 m 1.22 dd (10.8, 2.4) 1.57 m1.57 m
1.62 m 1.60 m 1.90 m1.90 m
52.04 m2.02 m1.60 m1.32 m1.32 m
1.70 m1.70 m
65.10 tt (7.2, 1.6)5.07 tt (7.2, 1.2)3.95 m3.21 dd (10.4, 2.0)3.21 dd (10.4, 2.0)
81.67 s1.62 br. s4.78 br. s1.11 s1.11 s
4.88 br. s
91.60 s1.56 br. s1.67 s1.14 s1.14 s
101.39 s1.34 s1.35 s1.36 s1.36 s
7-OCH3
Glc
1′4.43 d (8.0)4.39 d (8.0)4.38 d (8.4)4.41 d (8.0)4.36 d (8.0)
2′3.36 m3.29 m3.29 m3.29 m3.27 m
3′3.77 t (9.2)3.49 m3.48 m3.50 t (8.8)3.46 t (8.8)
4′4.89 m3.34 m3.32 m3.33 m3.29 m
5′3.45 m3.49 m3.48 m3.47 m3.42 m
6′3.49 m4.30 dd (12.0, 6.8)4.30 dd (12.0, 6.6)4.30 dd (12.0, 6.0)4.25 dd (12.0, 6.0)
3.57 m4.45 dd (12.0, 2.4)4.45 dd (12.0, 2.4)4.45 dd (12.0, 2.4)4.40 dd (12.0, 2.4)
inner- Rha
1″5.18 d (1.6)5.17 d (2.0)5.17 d (1.8)5.18 d (2.0)5.15 d (2.0)
2″3.91 dd (3.2, 1.6)3.94 dd (3.2, 2.0)3.94 m3.94 dd (3.2, 2.0)3.94 dd (3.2, 2.0)
3″3.58 m3.70 dd (9.6, 3.2)3.70 dd (9.6, 3.6)3.70 dd (9.6, 3.2)3.70 dd (9.6, 3.2)
4″3.29 t (9.6)3.40 t (9.6)3.39 t (9.6)3.39 t (9.6)3.39 t (9.6)
5″3.56 m4.00 dd (9.6, 6.4)4.00 m3.99 dd (9.6, 6.4)3.99 dd (9.6, 6.4)
6″1.08 d (6.4)1.25 d (6.4)1.24 d (6.6)1.25 d (6.4)1.24 d (6.4)
outer- Rha
1′′′
2′′′
3′′′
4′′′
5′′′
6′′′
Ester
2′′′′7.05 d (2.0)7.45 d (8.8)7.46 d (8.4)7.46 d (8.8)7.64 d (8.8)
3′′′′ 6.81 d (8.8)6.80 d (8.4)6.81 d (8.8)6.76 d (8.8)
5′′′′6.77 d (8.0)6.81 d (8.8)6.80 d (8.4)6.81 d (8.8)6.76 d (8.8)
6′′′′6.95 dd (8.0, 2.0)7.45 d (8.8)7.46 d (8.4)7.46 d (8.8)7.64 d (8.8)
7′′′′7.58 d (16.0)7.64 d (16.0)7.64 d (16.2)7.64 d (16.0)6.87 d (12.8)
8′′′′6.27 d (16.0)6.33 d (16.0)6.33 d (16.2)6.34 d (16.0)5.78 d (12.8)
No5 b6 b7 b8a b8b b
15.19 dd (10.8, 1.2)5.23 dd (10.8, 1.6)5.22 dd (10.8, 1.6)4.27 d (8.0)4.27 d (8.0)
5.22 dd (17.6, 1.2)5.25 dd (17.6, 1.6)5.24 dd (17.6, 1.6)
25.90 dd (17.6, 10.8)5.93 dd (17.6, 10.8)5.92 dd (17.6, 10.8)5.41 t (8.0)5.41 t (8.0)
42.36 d (7.2) 1.58 m 1.58 m 2.76 d (10.2) 2.76 d (10.2)
1.62 m 1.62 m
55.64 dt (16.0, 7.2)2.05 m2.04 m5.55 m5.55 m
65.40 d (16.0)5.10 m5.10 m5.44 d (15.6)5.44 d (15.6)
81.20 s1.67 s1.67 s1.23 s1.23 s
91.20 s1.60 s1.60 s1.23 s1.23 s
101.33 s1.39 s1.38 s1.65 s1.65 s
7-OCH33.09 s 3.12 s3.12 s
Glc
1′4.41 d (8.0)4.44 d (7.6)4.41 d (8.0)4.31 d (8.0)4.27 d (8.0)
2′3.31 m3.37 m3.37 m3.30 m3.28 m
3′3.50 t (8.8)3.77 t (9.6)3.77 t (9.6)3.51 m3.46 m
4′3.35 m4.91 t (9.6)4.86 t (9.6)3.37 m3.33 m
5′3.49 m3.46 m3.46 m3.51 m3.47 m
6′4.32 dd (12.0, 7.2)3.50 m3.50 m4.35 dd (12.0, 6.0)4.31 dd (12.0, 6.0)
4.45 dd (12.0, 2.0)3.57 m3.57 m4.50 dd (12.0, 2.0)4.48 dd (12.0, 2.0)
inner- Rha
1″5.17 d (2.0)5.19 d (2.0)5.29 d (2.0)5.17 d (2.0)5.16 d (2.0)
2″3.94 dd (3.6, 2.0)3.86 dd (3.2, 2.0)3.82 dd (3.2, 2.0)3.94 m3.92 m
3″3.70 dd (9.6, 3.6)3.68 dd (9.6, 3.2)3.68 dd (9.6, 3.2)3.70 dd (9.6, 3.2)3.68 dd (9.6, 3.2)
4″3.40 t (9.6)3.39 m3.45 m3.40 m3.40 m
5″4.00 dd (9.6, 6.4)3.59 m3.60 m4.00 dd (9.6, 6.4)4.00 dd (9.6, 6.4)
6″1.25 d (6.4)1.08 d (6.0)1.21 d (6.4)1.24 d (6.4)1.23 d (6.4)
outer- Rha
1′′′ 5.04 d (2.0)5.13 d (2.0)
2′′′ 3.90 dd (3.2, 2.0)3.82 dd (3.2, 2.0)
3′′′ 3.51 m3.51 m
4′′′ 3.32 m3.34 m
5′′′ 3.46 m3.46 m
6′′′ 1.04 d (6.0)1.21 d (6.4)
Ester
2′′′′7.45 d (8.4)7.48 d (8.4)7.72 d (8.4)7.45 d (8.4)7.65 d (8.4)
3′′′′6.81 d (8.4)6.82 d (8.4)6.77 d (8.4)6.80 d (8.4)6.75 d (8.4)
5′′′′6.81 d (8.4)6.82 d (8.4)6.77 d (8.4)6.80 d (8.4)6.75 d (8.4)
6′′′′7.45 d (8.4)7.48 d (8.4)7.72 d (8.4)7.45 d (8.4)7.65 d (8.4)
7′′′′7.63 d (16.0)7.66 d (16.0)6.98 d (12.8)7.64 d (16.0)6.87 d (12.8)
8′′′′6.32 d (16.0)6.33 d (16.0)5.76 d (12.8)6.35 d (16.0)5.79 d (12.8)
a Coupling constants (J values in Hz) are shown in parentheses. b At 400 MHz. c At 600 MHz.
Table 2. 13C NMR data of compounds 18 from L. robustum in CD3OD.
No1 a2 a3 a4a a4b a
1115.9115.7115.8115.9115.9
2144.3144.3144.3144.3144.3
381.681.581.481.581.5
442.642.530.239.939.9
523.623.630.126.426.4
6125.7125.776.980.180.1
7132.2132.1148.773.973.9
825.925.8111.424.924.9
917.717.717.725.825.8
1023.223.523.523.923.9
7-OCH3
Glc
1′99.499.399.499.499.3
2′76.375.775.875.875.8
3′82.084.484.484.284.2
4′70.770.870.870.770.7
5′75.775.075.175.175.0
6′62.565.064.964.962.7
inner-Rha
1″103.1102.8102.8102.7102.4
2″72.472.472.472.472.4
3″72.072.372.372.372.3
4″73.874.074.074.074.0
5″70.470.070.070.070.0
6″18.517.917.917.917.9
outer-Rha
1′′′
2′′′
3′′′
4′′′
5′′′
6′′′
Ester
1′′′′127.6127.1126.9127.1127.6
2′′′′115.2131.1131.2131.2133.8
3′′′′146.8116.9117.0116.9115.9
4′′′′149.8161.5161.9161.4160.2
5′′′′116.5116.9117.0116.9115.9
6′′′′123.2131.1131.2131.2133.8
7′′′′148.0146.7148.7146.8145.3
8′′′′114.7115.0114.8115.0116.2
CO168.3169.0169.0169.0168.1
No5 a6 b7 b8a a8b a
1116.0115.9115.966.366.3
2144.0144.3144.3122.3122.3
381.281.681.6140.9140.9
445.542.642.643.543.5
5127.423.623.7129.3129.3
6139.2125.7125.7138.1138.1
776.5132.2132.276.476.4
826.125.925.926.226.2
926.117.717.726.226.2
1023.523.223.116.616.6
7-OCH350.7 50.650.6
Glc
1′99.399.499.4102.6102.6
2′75.876.376.575.675.6
3′84.281.979.884.084.0
4′70.870.670.470.570.4
5′75.075.775.675.575.4
6′64.962.462.564.764.5
inner-Rha
1″102.8102.7101.9102.7102.8
2″72.472.772.972.472.4
3″72.372.973.072.272.2
4″74.081.780.674.074.0
5″70.068.968.670.070.3
6″17.919.218.917.917.9
outer-Rha
1′′′ 103.5103.2
2′′′ 72.372.3
3′′′ 72.372.3
4′′′ 73.873.9
5′′′ 70.370.3
6′′′ 17.717.8
Ester
1′′′′127.1127.0127.5126.9127.5
2′′′′131.2131.4134.3131.2133.8
3′′′′116.9117.0116.0117.0116.0
4′′′′161.4161.5160.3161.7160.3
5′′′′116.9117.0116.0117.0116.0
6′′′′131.2131.4134.3131.2133.8
7′′′′146.7147.5147.4146.9145.3
8′′′′115.0114.8115.8114.8116.2
CO168.9168.2166.9169.1168.1
a At 100 MHz. b At 150 MHz.
Table 3. The results of bioactivity assays of compounds 111 from L. robustum a.
CompoundsFAS IC50 (μM) bα-Glucosidase Inhibition at 0.1 mM (%)α-Amylase Inhibition at 0.1 mM (%)DPPH IC50 (μM) bABTS•+ IC50 (μM) b
1NA cNANA19.74 ± 0.23 b6.91 ± 0.10 a
22.36 ± 0.10 a48.1 ± 4.3 b 31.5 ± 0.5 b>2509.41 ± 0.22 c
321.77 ± 0.38 c27.3 ± 0.3 c32.5 ± 6.3 bNA16.00 ± 0.69 g
4>100NA28.2 ± 3.9 bNA9.66 ± 0.17 cd
523.71 ± 0.45 d13.8 ± 2.0 d35.6 ± 2.0 bNA6.93 ± 0.01 a
64.78 ± 0.14 b12.0 ± 1.7 d26.1 ± 3.0 bNA11.30 ± 0.16 e
7>100NANANA20.21 ± 0.33 j
825.83 ± 0.47 e24.7 ± 3.5 c31.4 ± 1.9 bNA19.50 ± 0.46 i
921.67 ± 0.46 c12.4 ± 5.6 d29.2 ± 8.4 bNA18.66 ± 0.47 h
104.68 ± 0.16 b28.7 ± 2.1 cNANA15.10 ± 0.10 f
1161.74 ± 0.45 fNA31.3 ± 1.3 bNA7.92 ± 0.23 b
Orlistat d4.46 ± 0.13 b
Acarbose d 93.2 ± 0.1 a51.8 ± 2.5 a
L-(+)-ascorbic acid d 13.66 ± 0.13 a10.06 ± 0.19 d
a Data are expressed as mean ± SD (n = 3). Means with the same letter are not significantly different (one-way analysis of variance, α = 0.05). b IC50: the final concentration of sample needed to inhibit 50% of enzyme activity or scavenge 50% of free radical. c NA: no activity. d Positive control.
Publisher’s Note: MDPI stays neutral with regard to jurisdictional claims in published maps and institutional affiliations.

