
Equilibrium and Kinetic Study of Anionic and Cationic Pollutants Remediation by Limestone–Chitosan–Alginate Nanocomposite from Aqueous Solution

 , ,
, ,  , and
, and
Abstract
1. Introduction
2. Results and Discussion
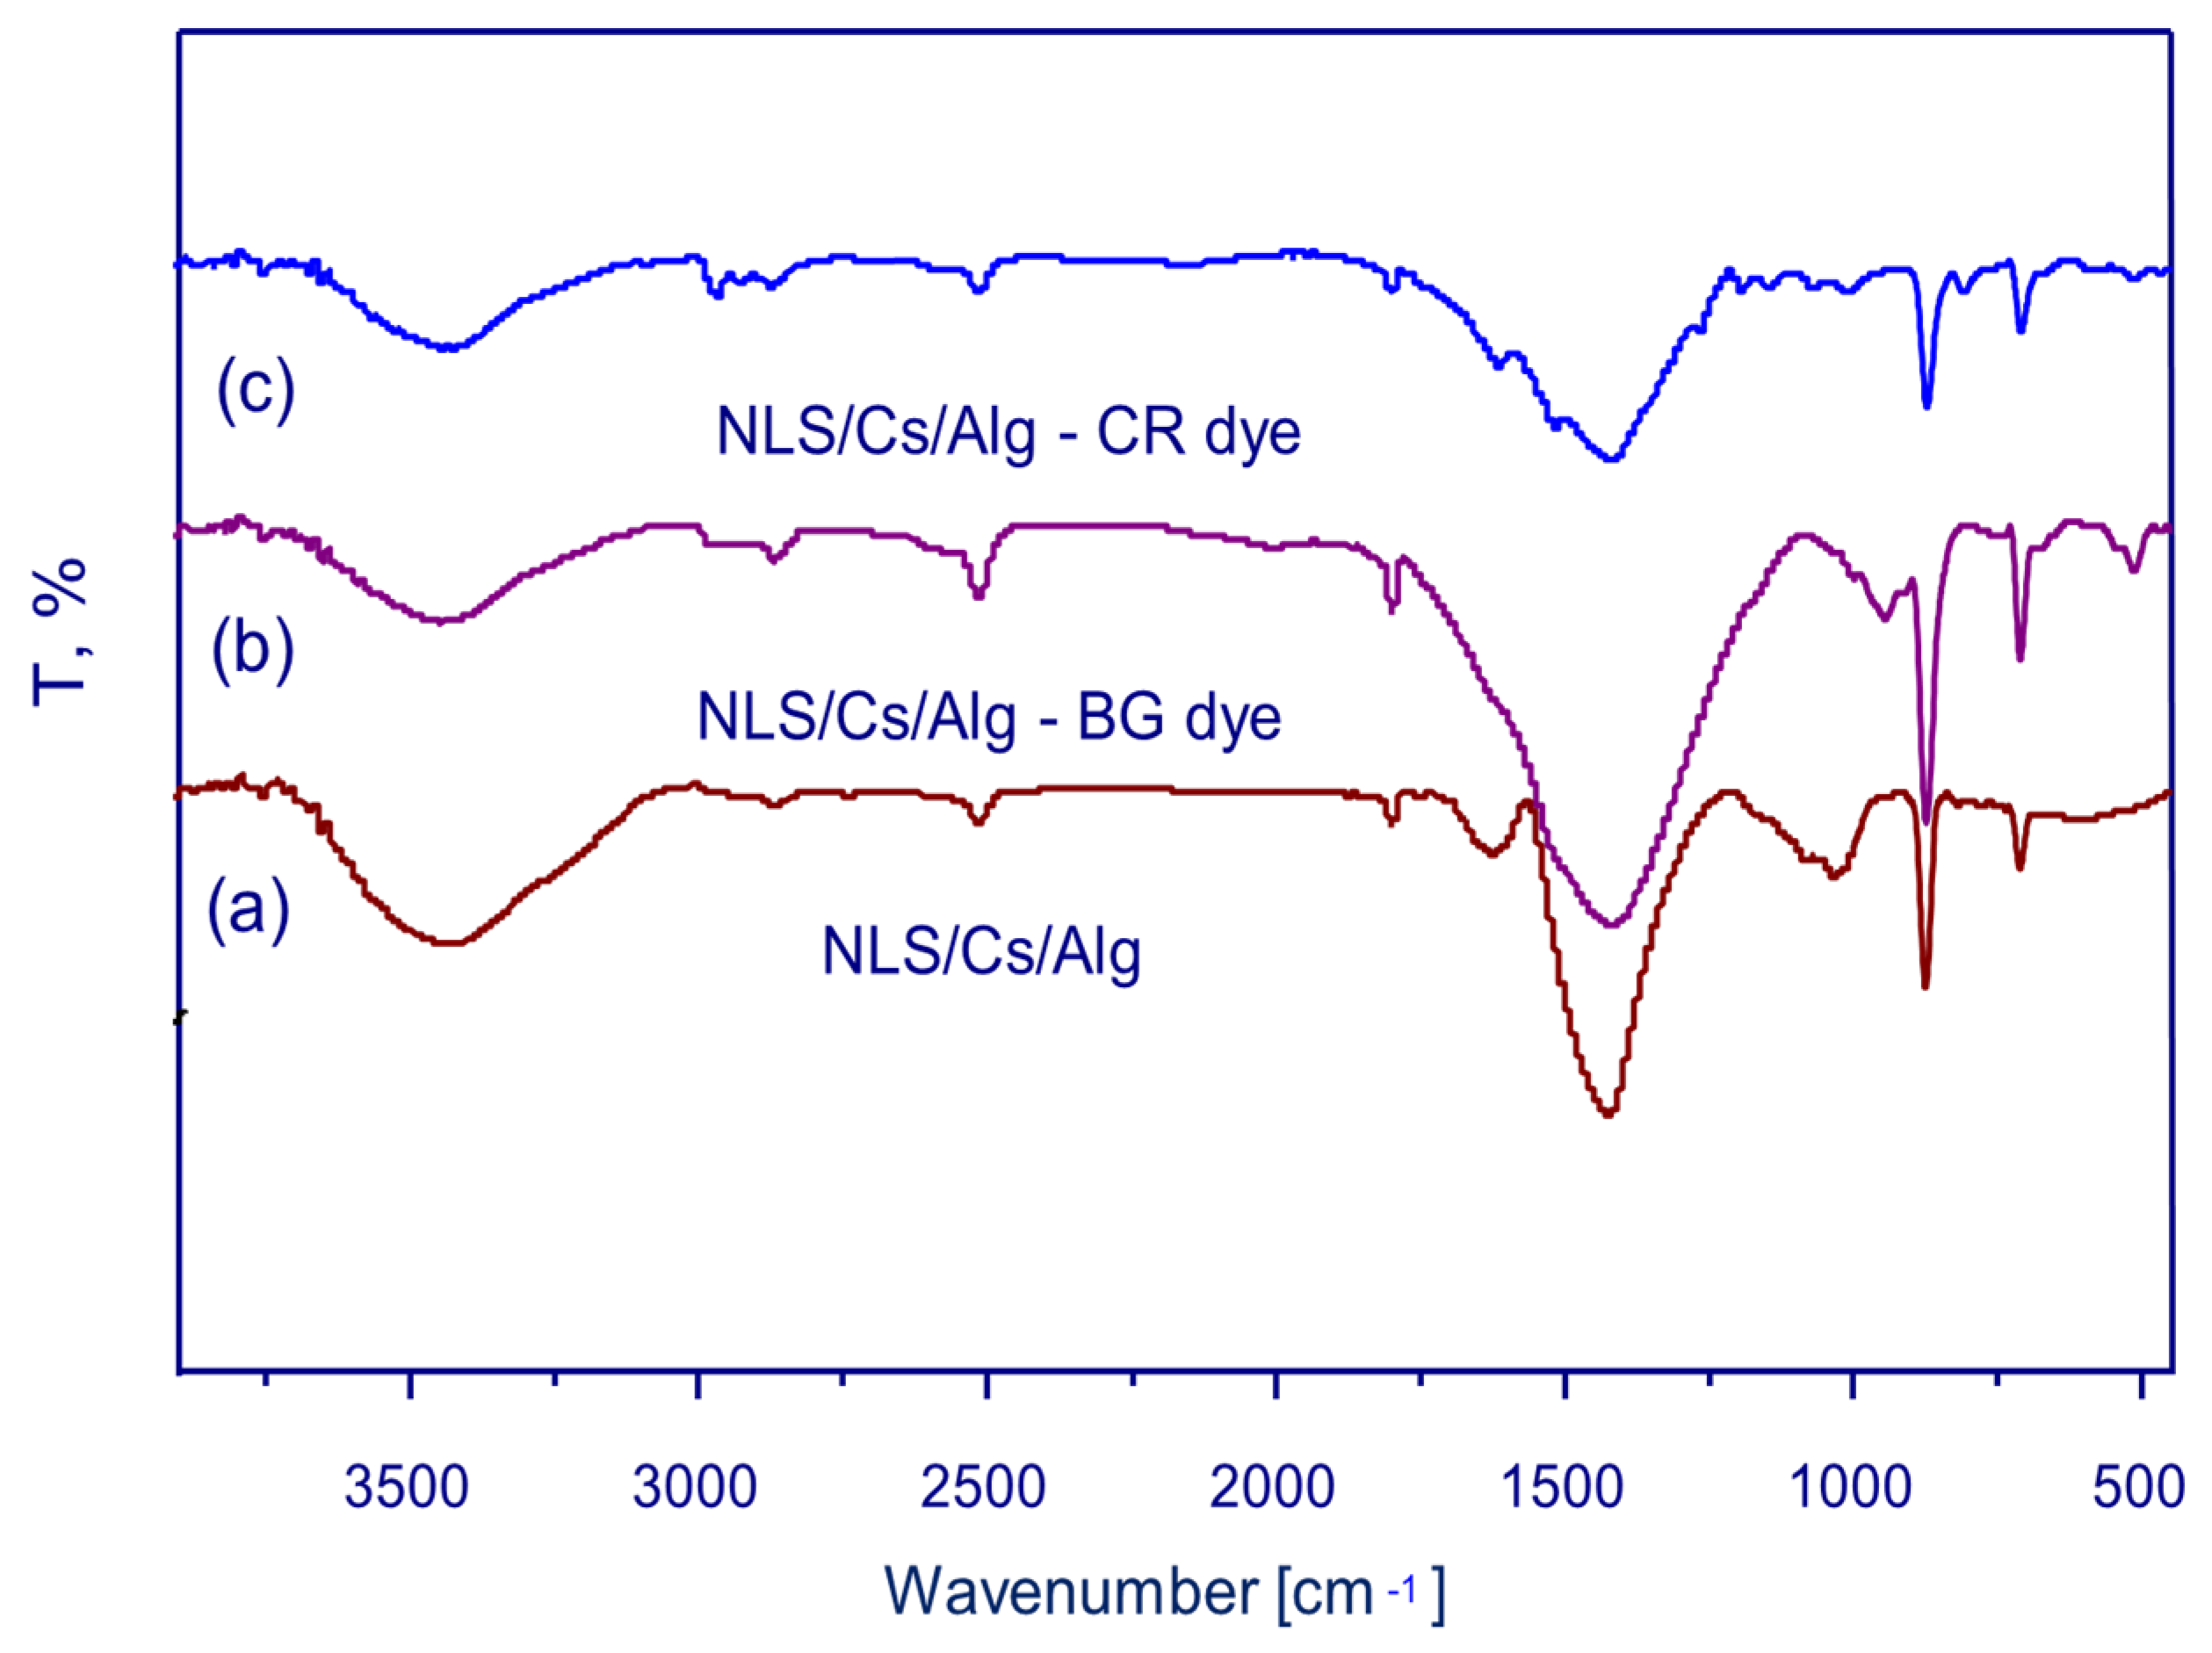
2.1. Structural and Surface Characterization of the Adsorbent
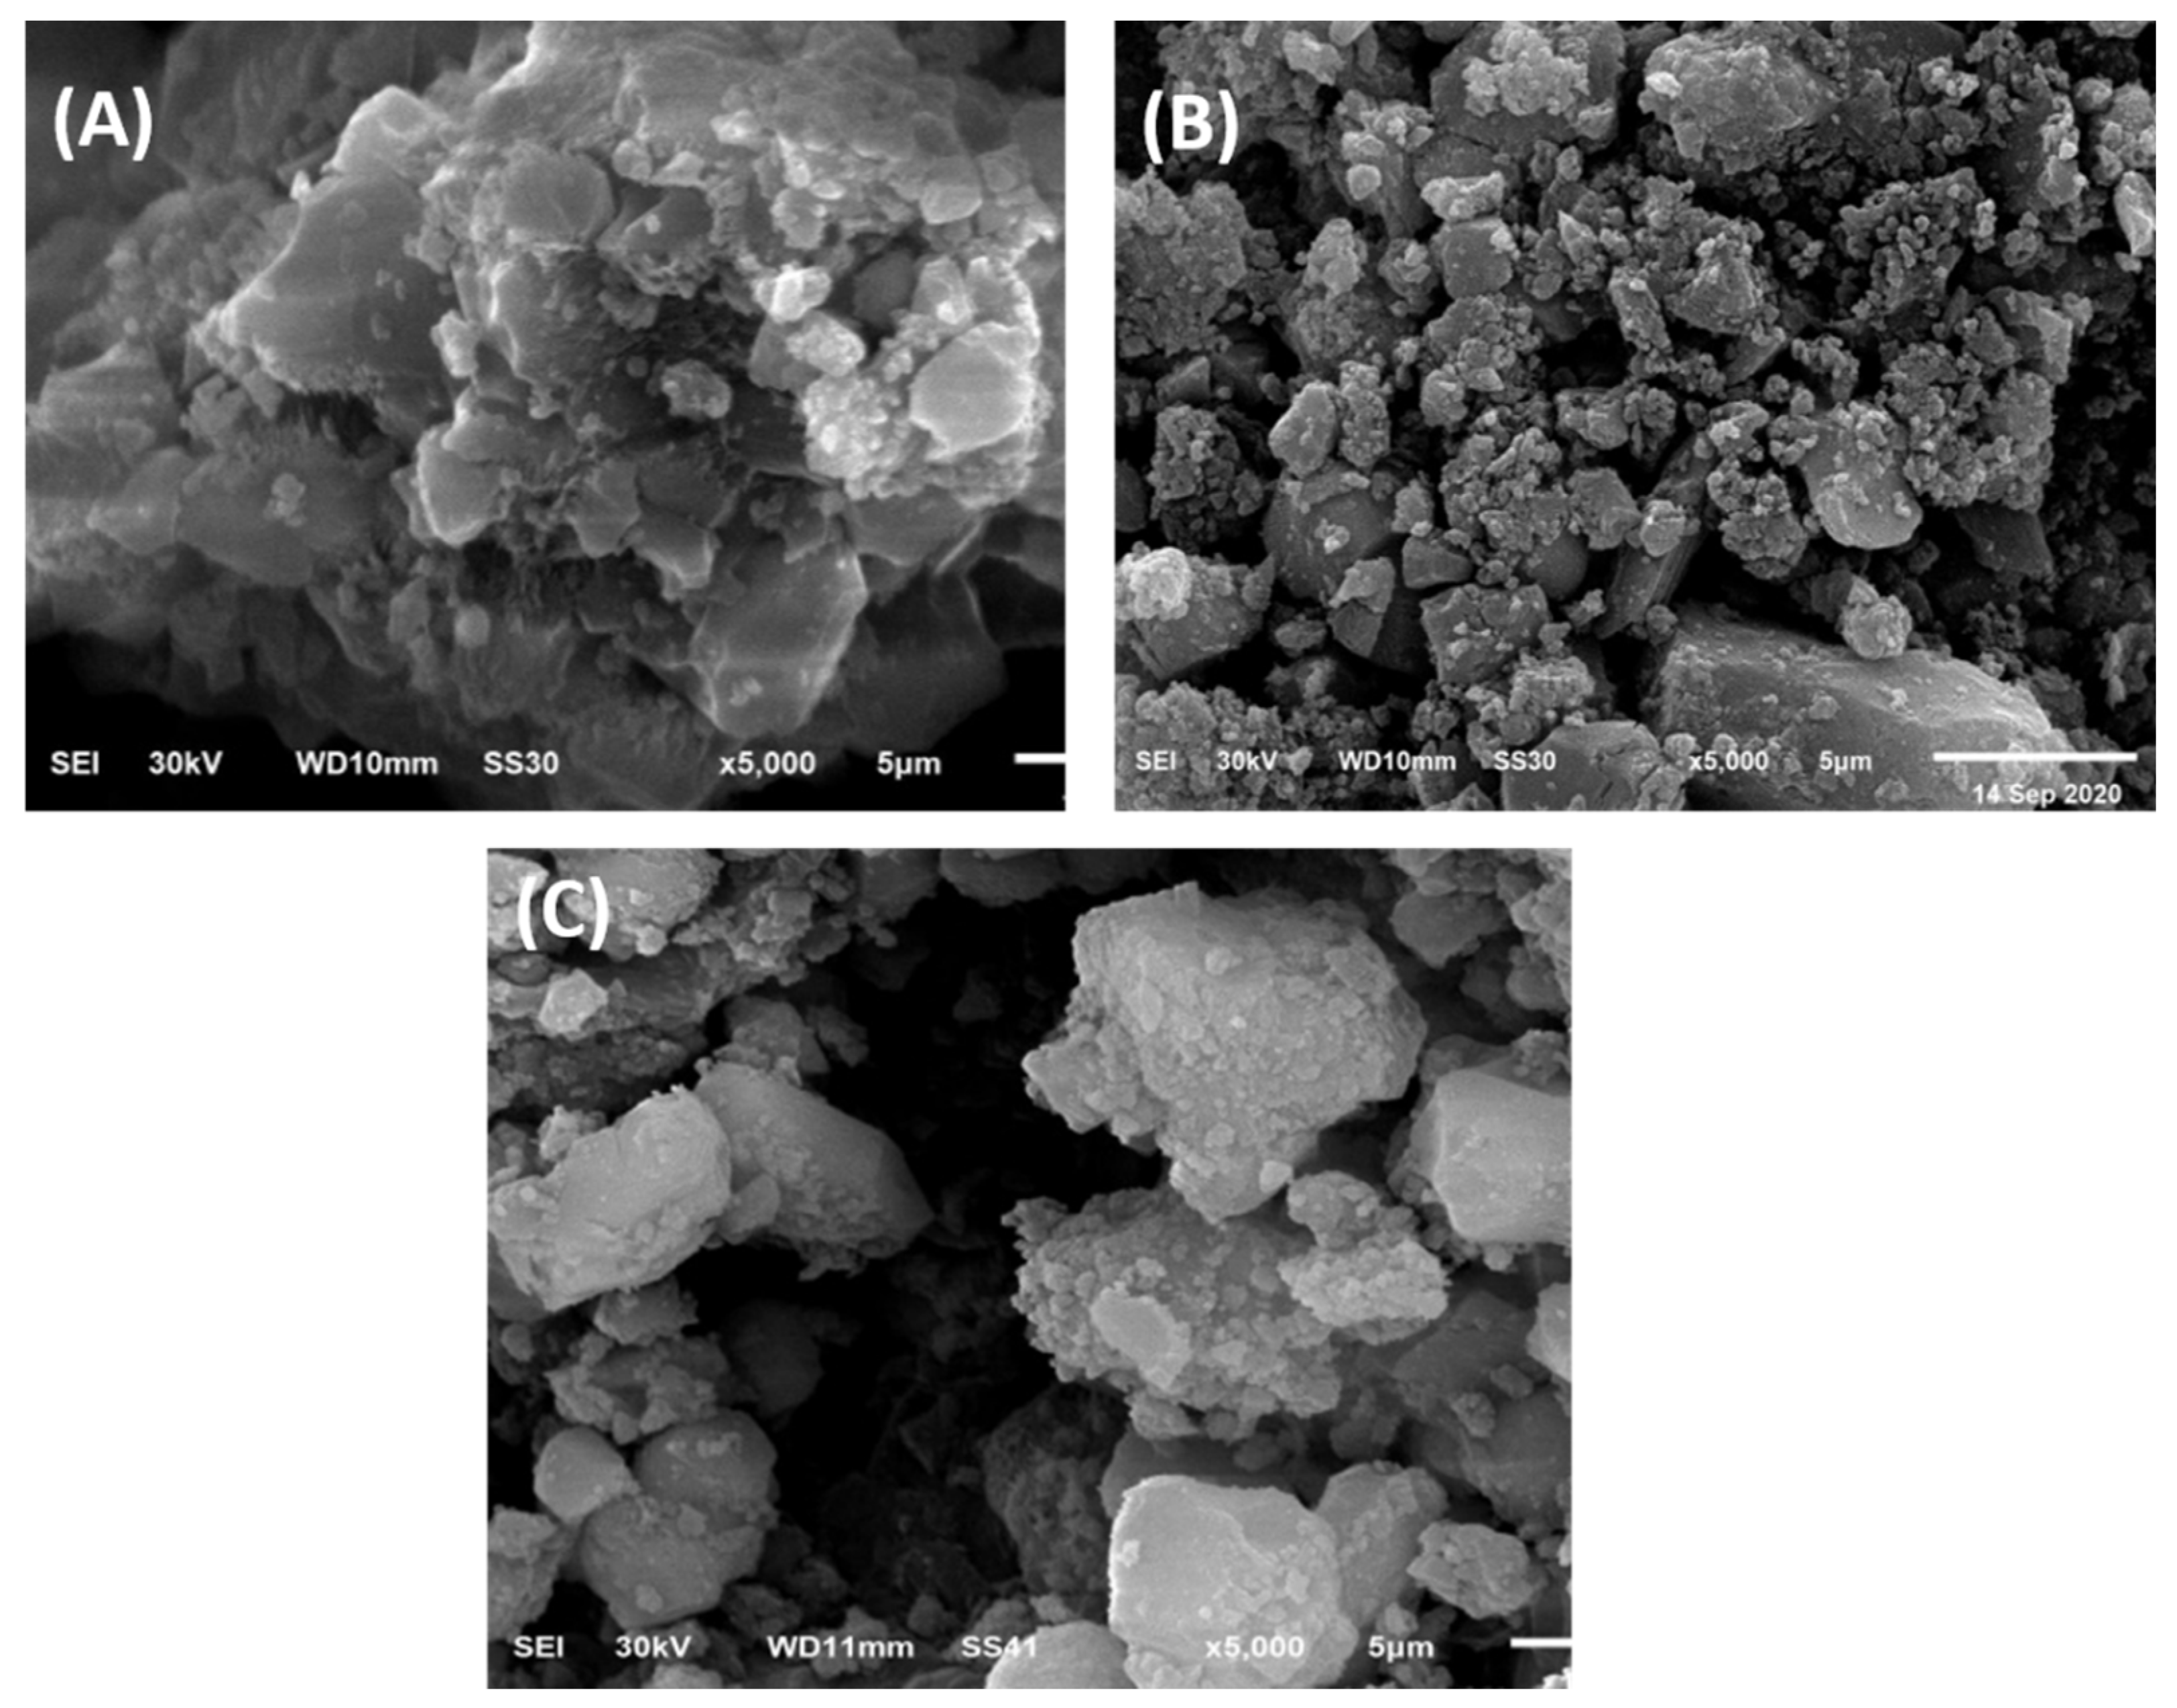
2.1.1. SEM Study
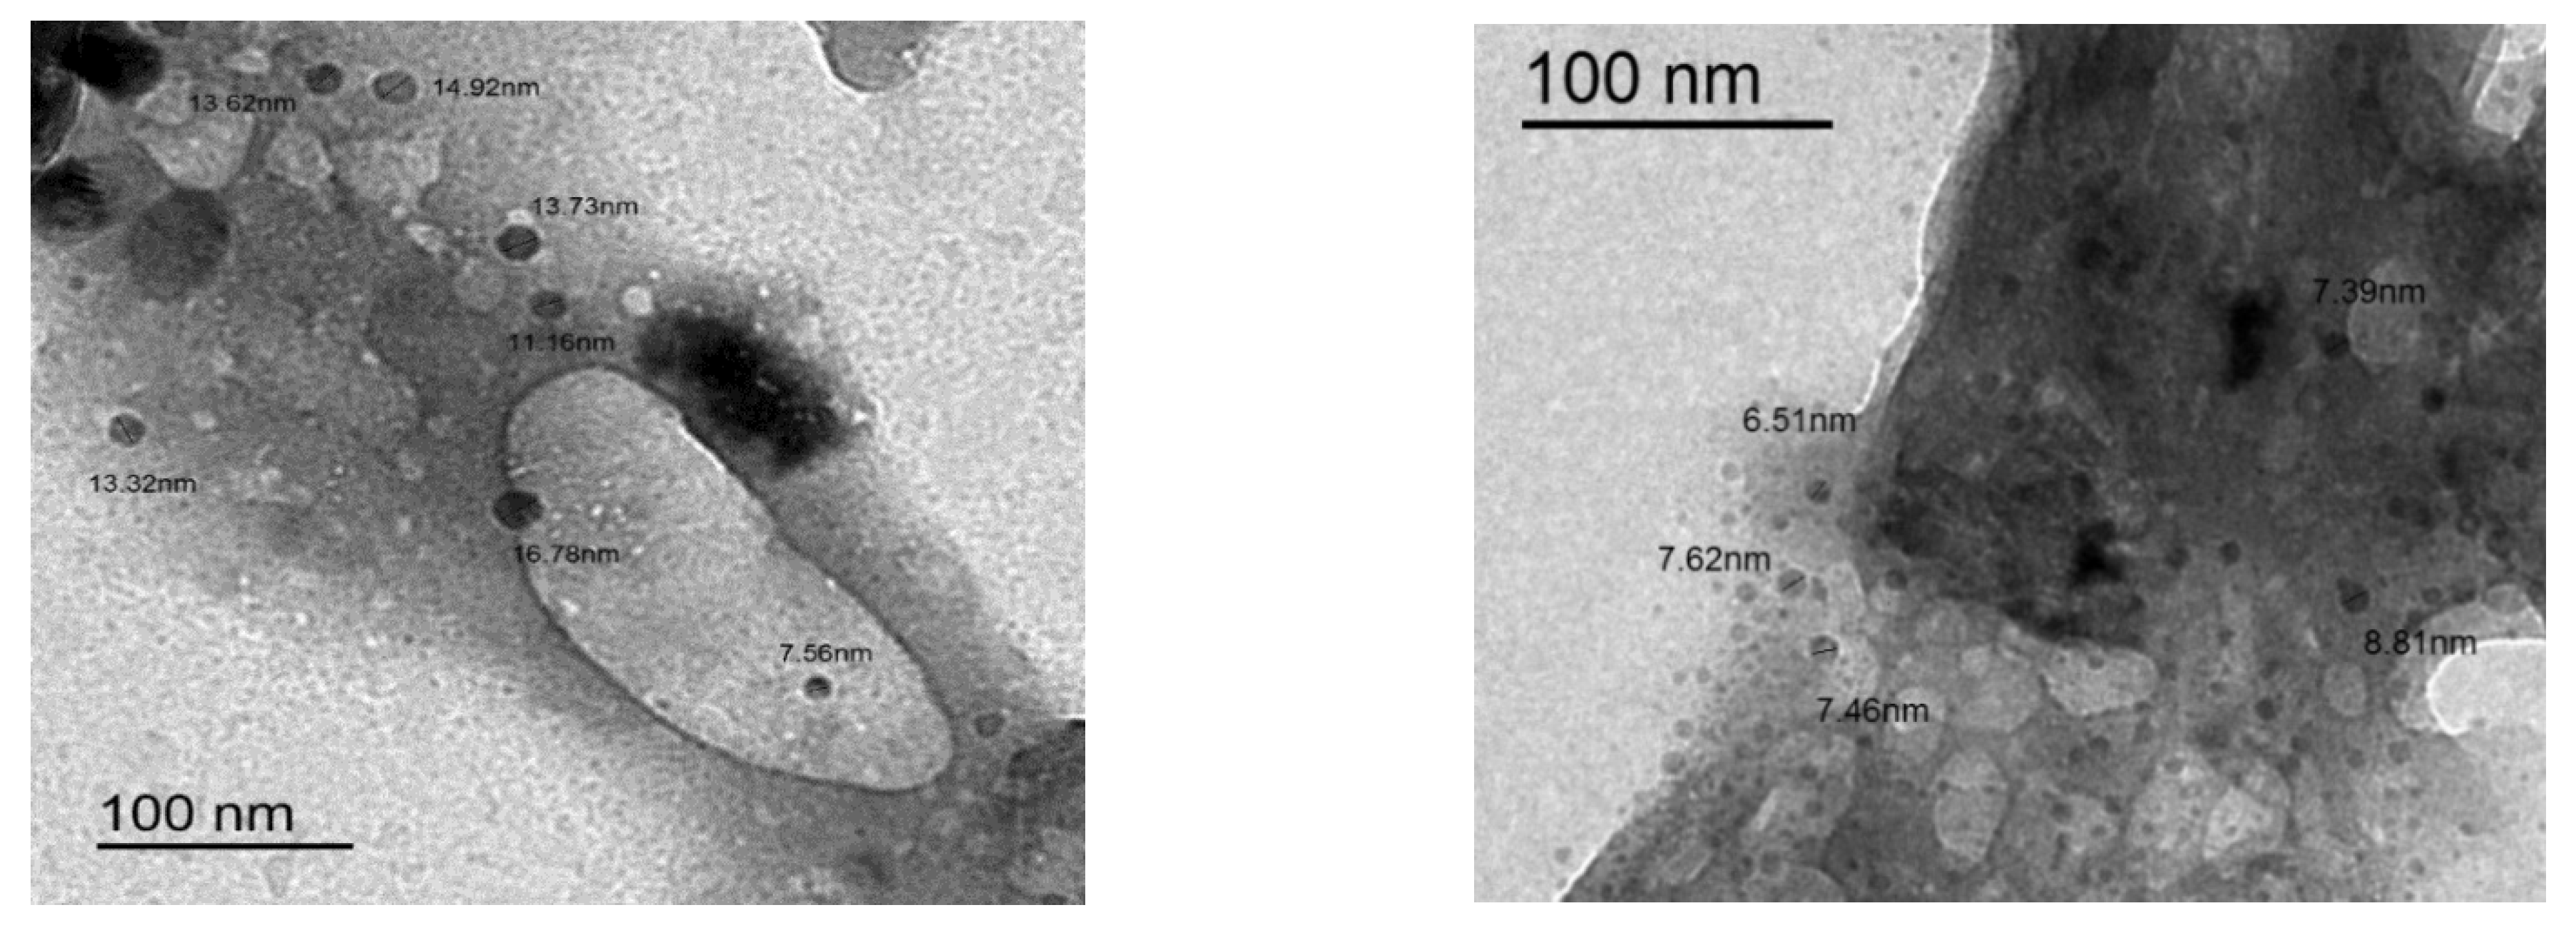
2.1.2. TEM Study
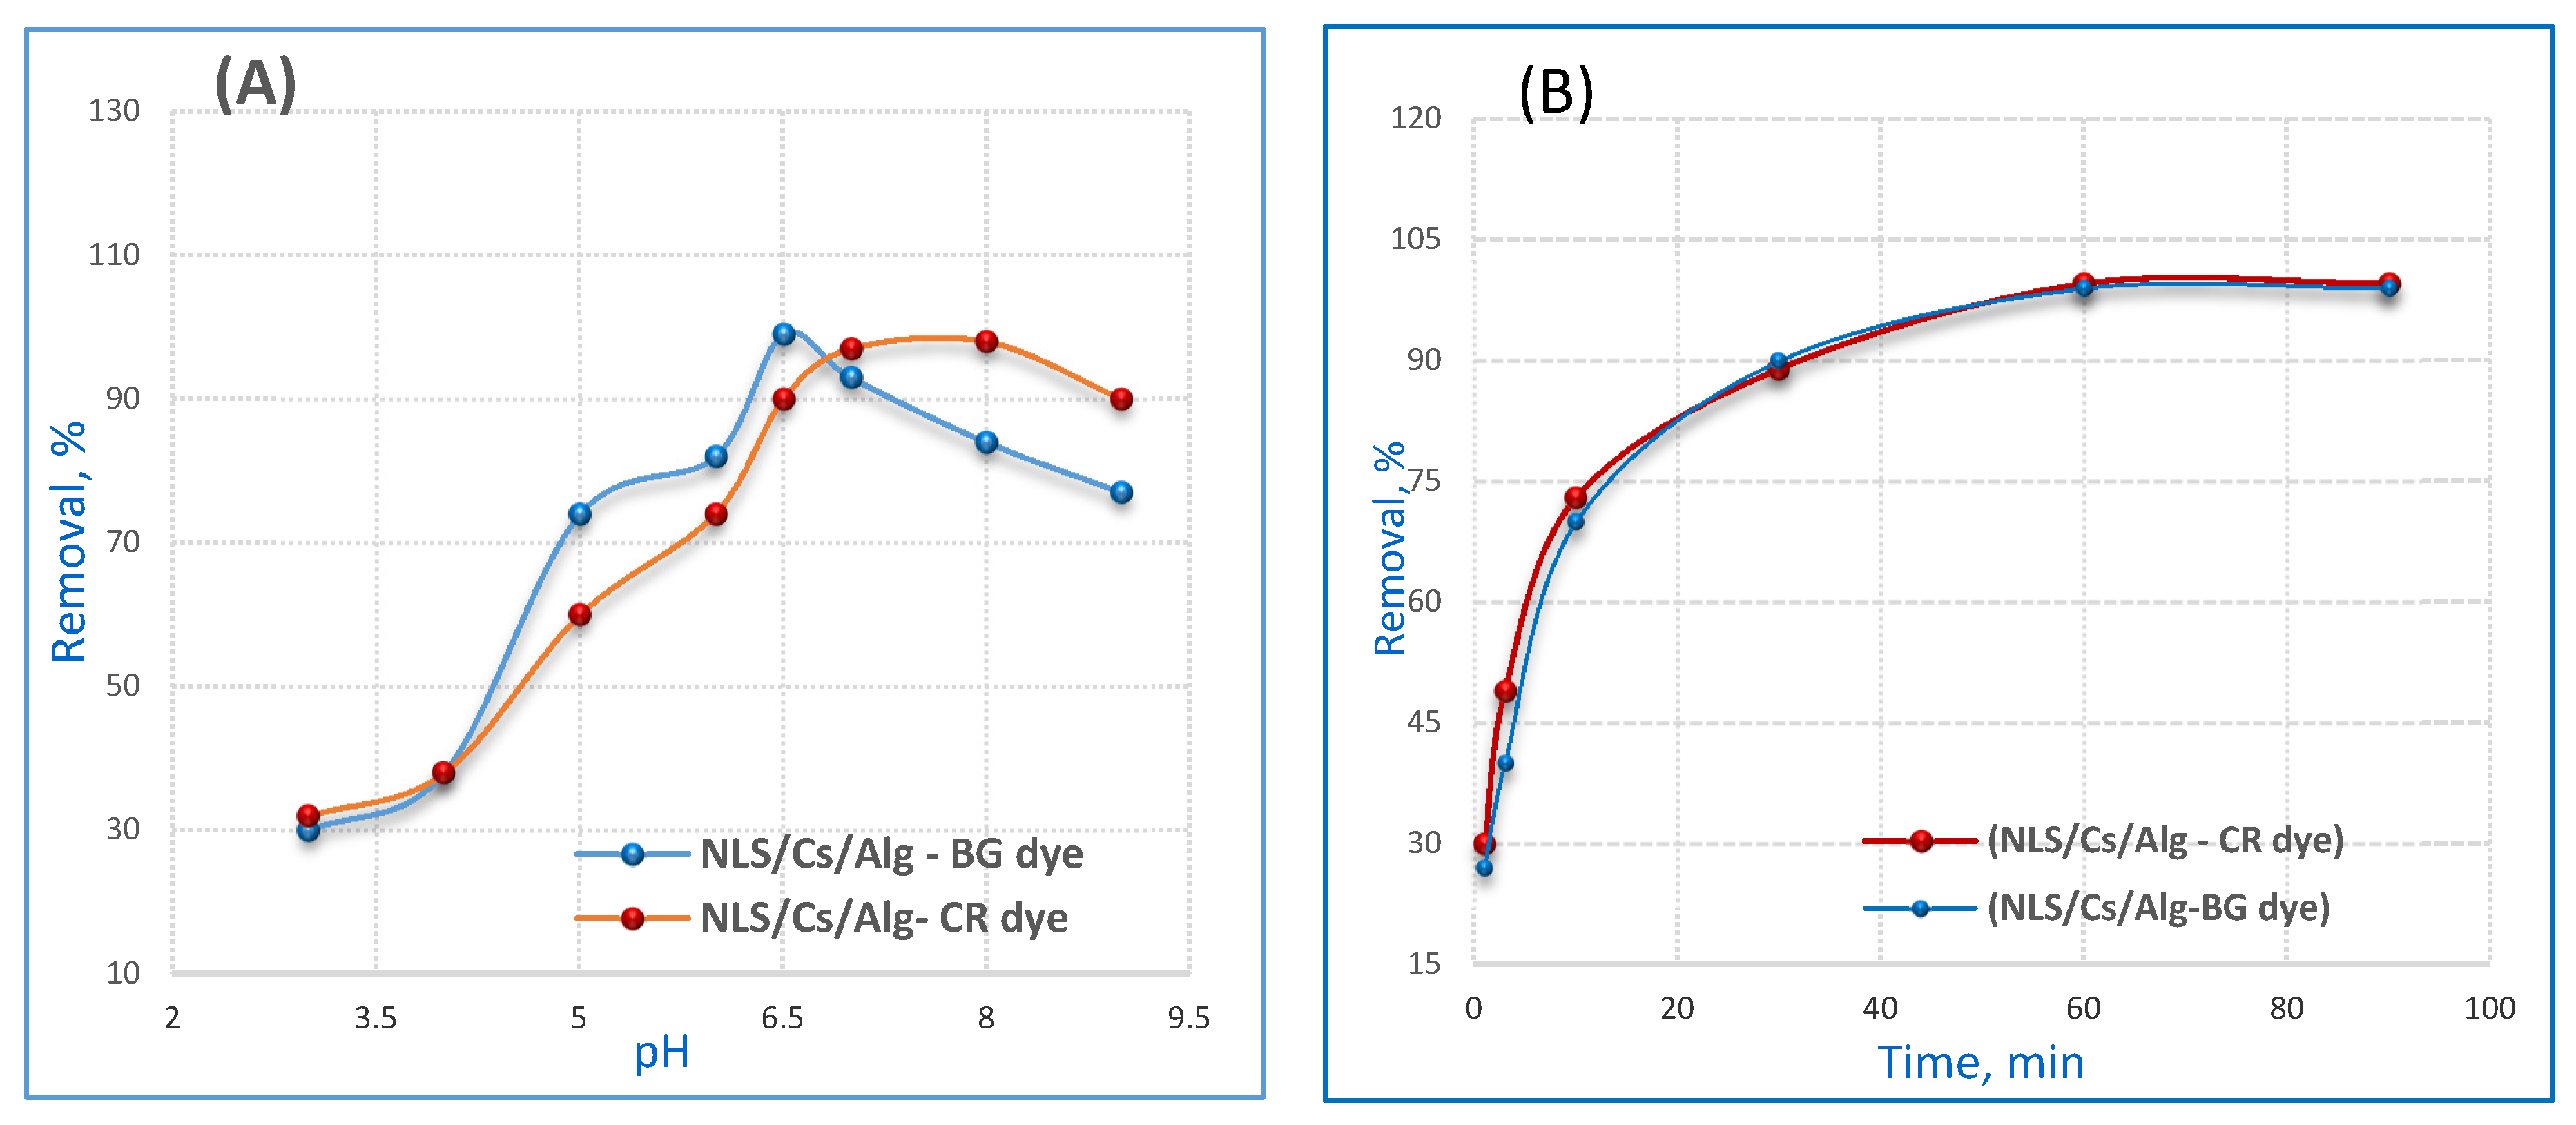
2.2. Effect of pH
2.3. Effect of Contact Time
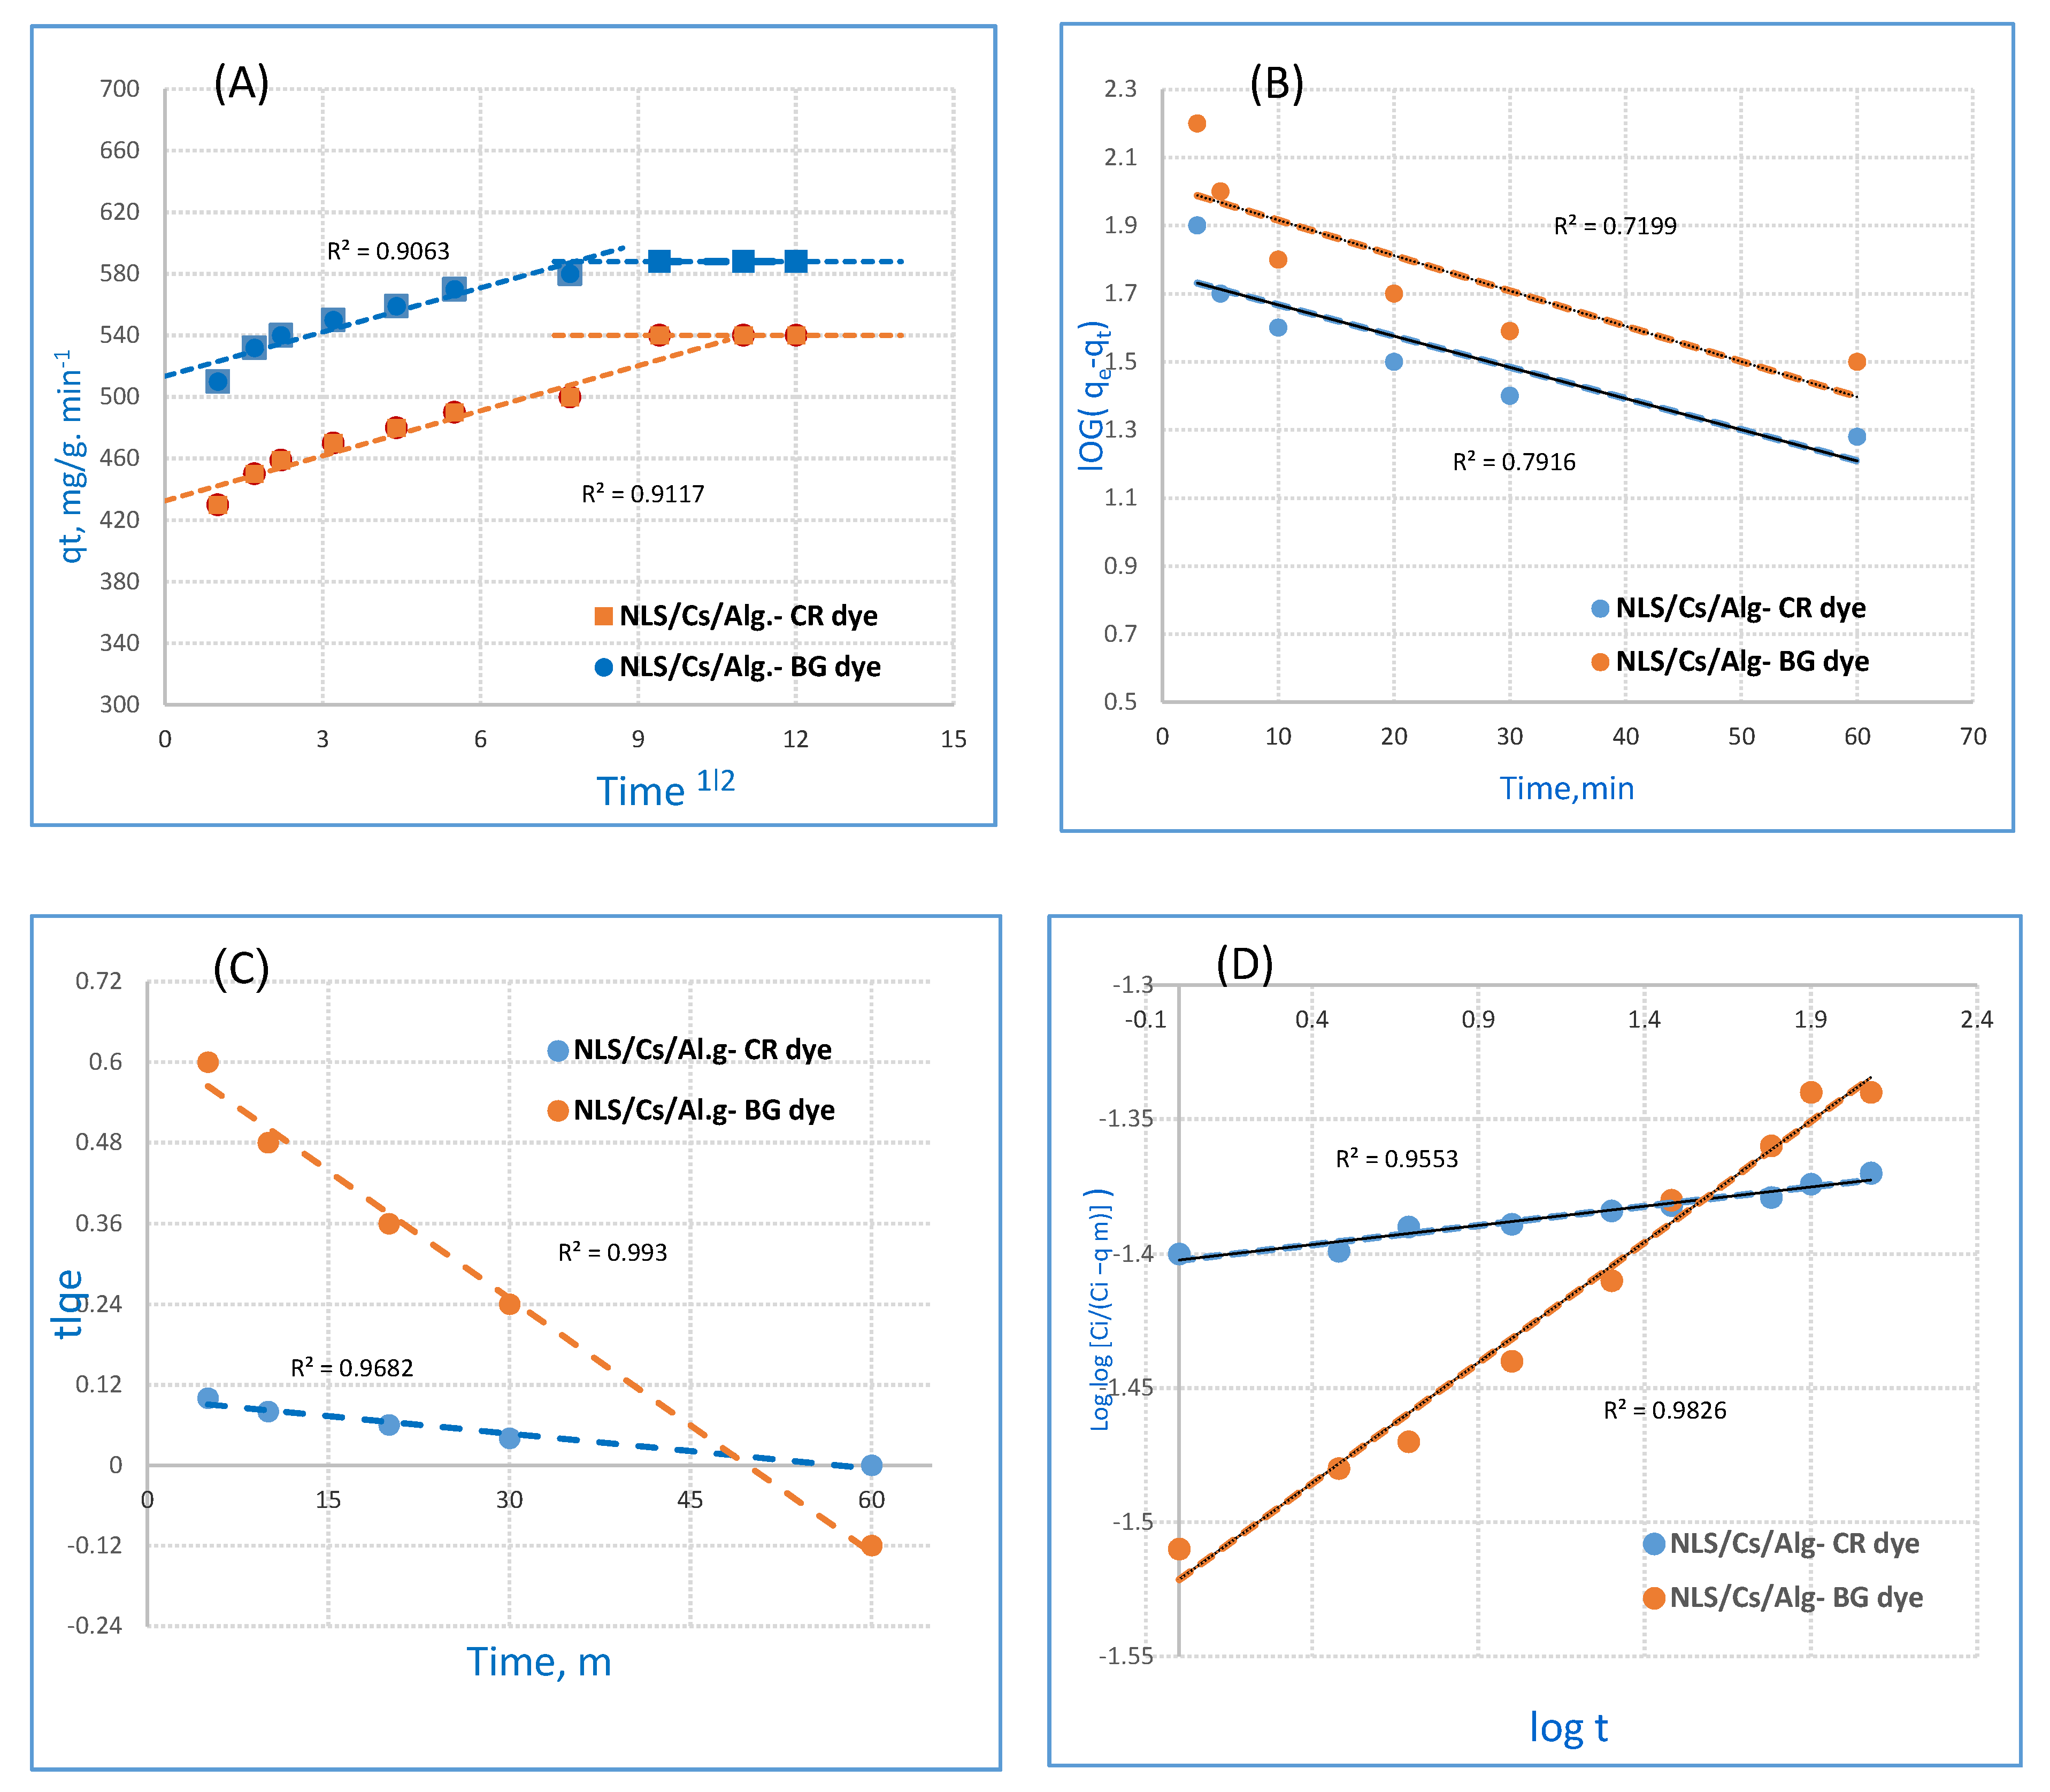
2.4. Sorption Model
2.5. Isotherm Models
2.5.1. Langmuir Isotherm
2.5.2. Freundlich Isotherm
2.5.3. Dubinin–Radushkevich–Kanager Isotherm
2.6. Thermodynamic Parameters
3. Experimental Methods
3.1. Primary Materials
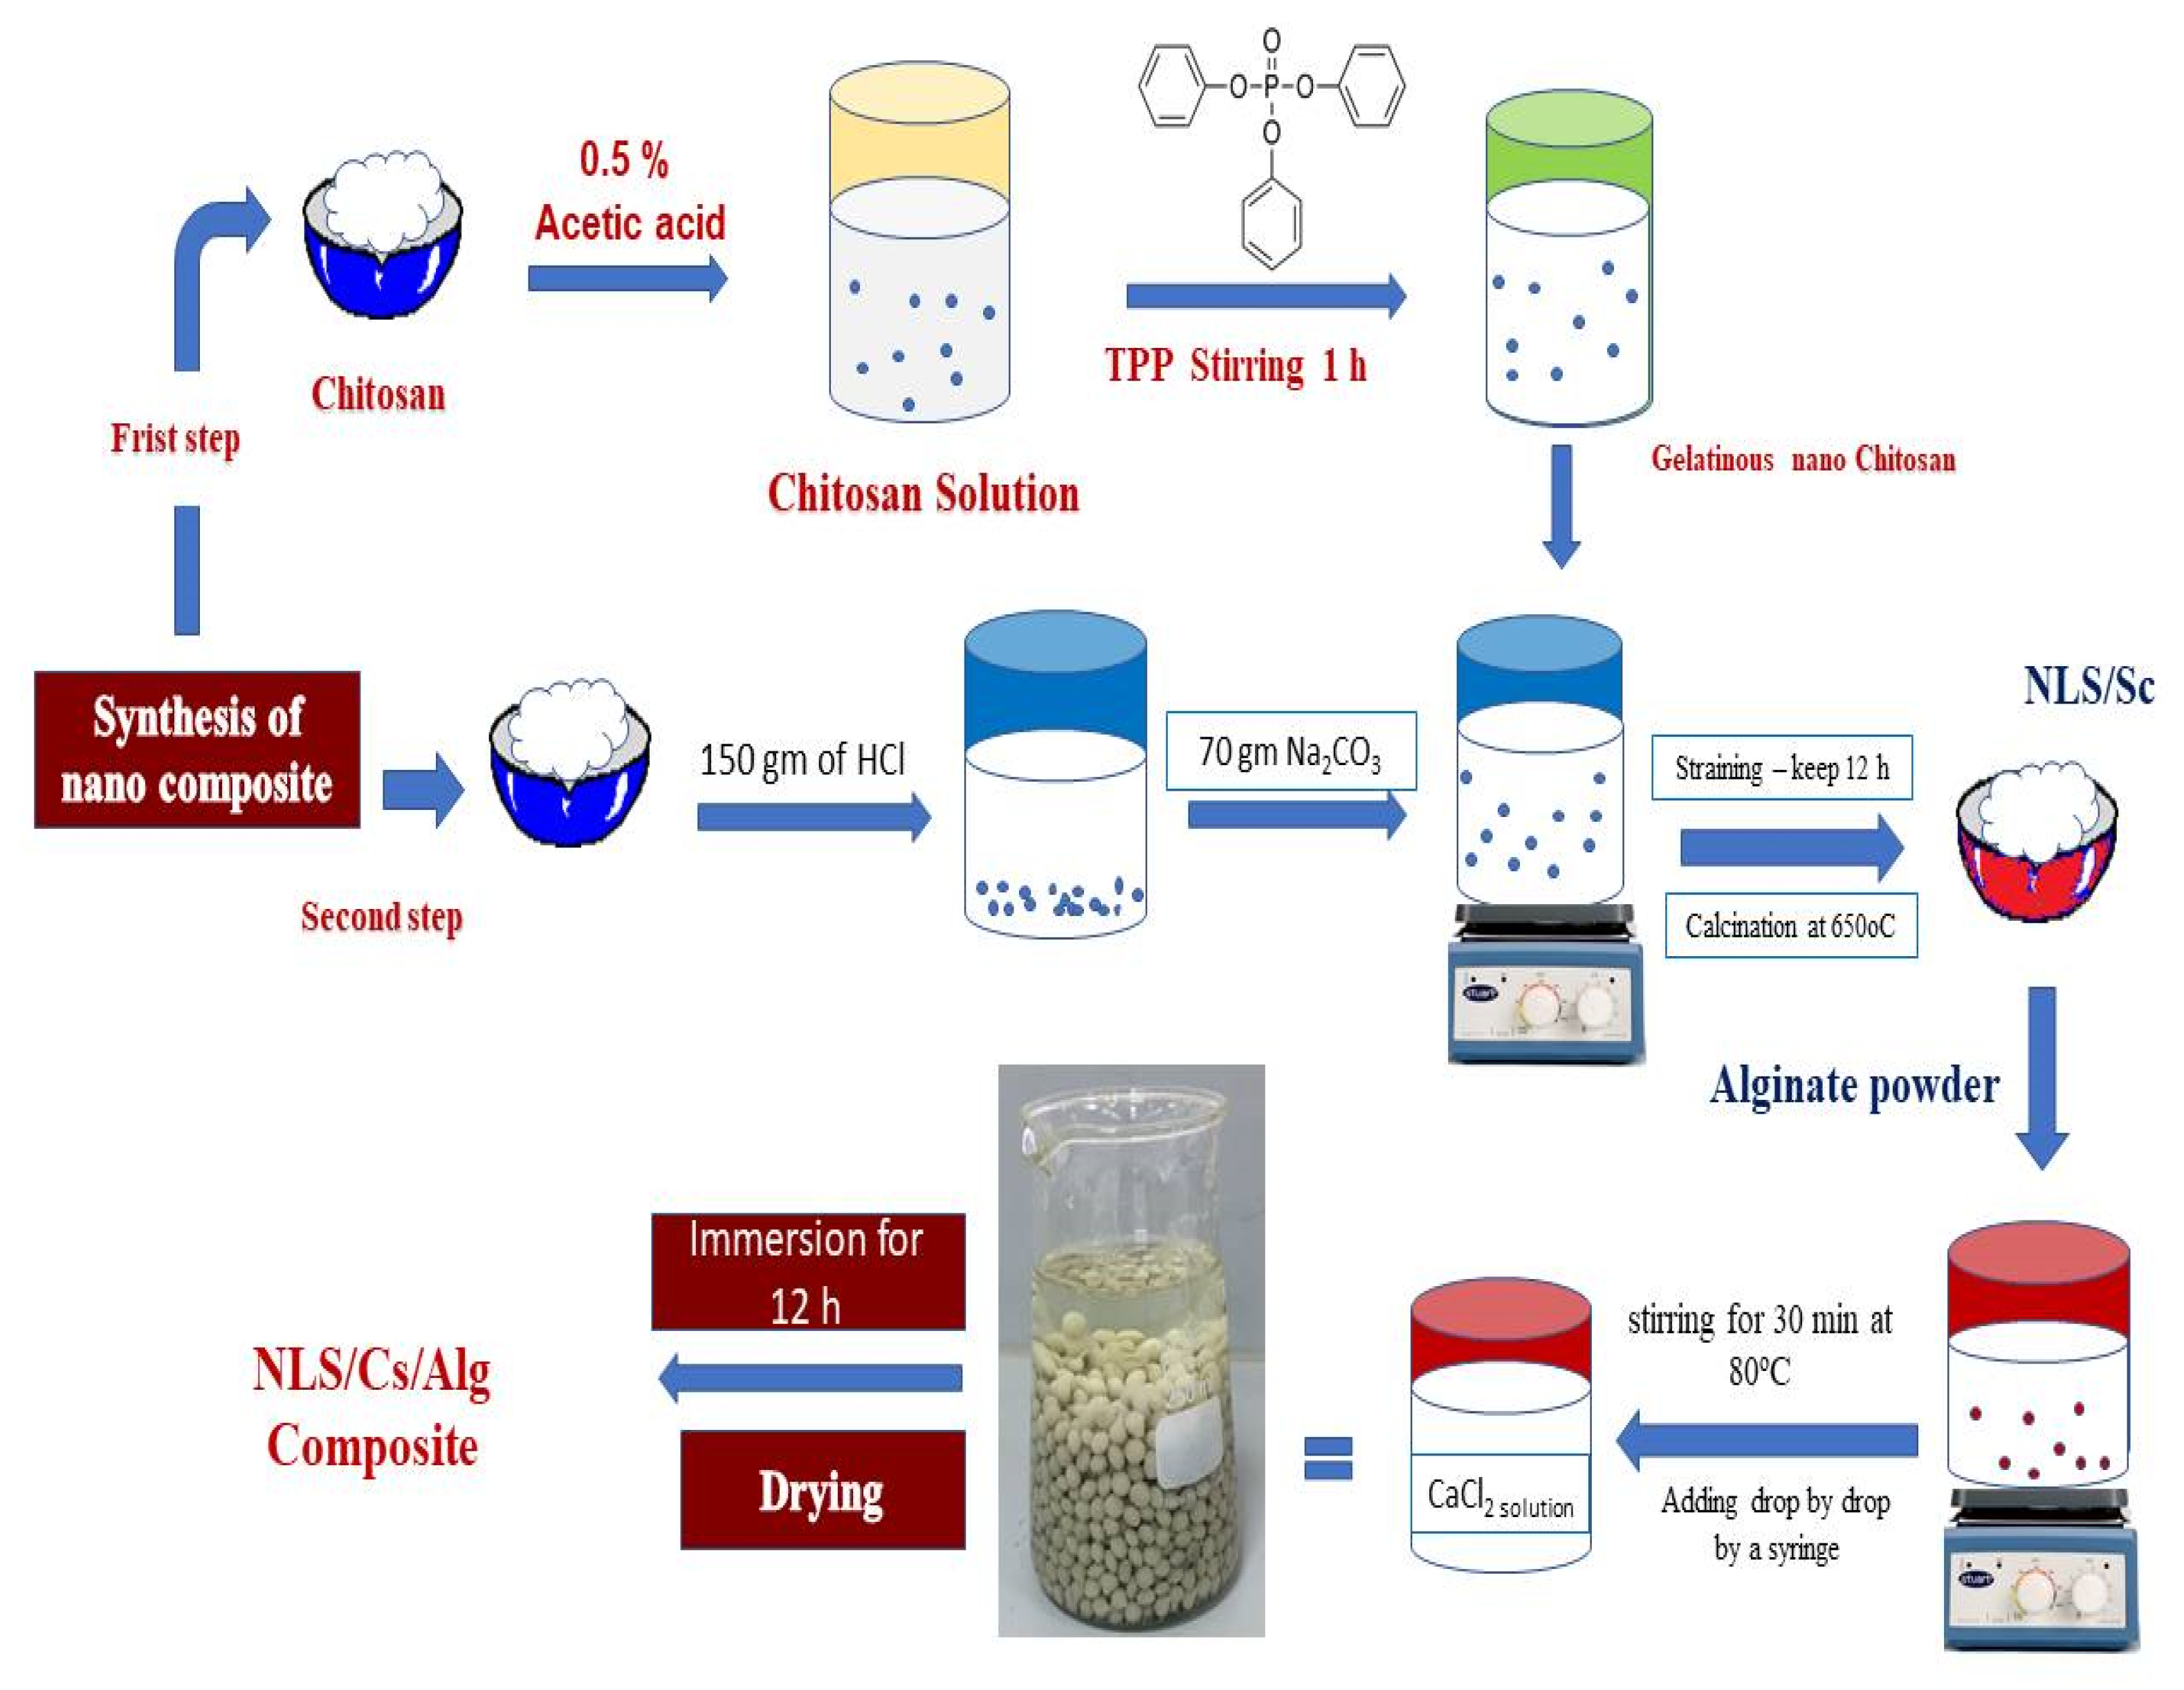
3.2. Synthesis of Nanolimestone
3.3. Synthesis of Nanolimestone/Alginate Composite
3.4. Structural and Surface Characterization of the NLS/Cs/Alg. Nanocomposite
3.4.1. Analytical Instruments
3.4.2. Dye Adsorption Studies
3.4.3. Experimental Data Analysis
4. Conclusions
Author Contributions
Funding
Institutional Review Board Statement
Informed Consent Statement
Data Availability Statement
Acknowledgments
Conflicts of Interest
Sample Availability
References
- Islam, A.; Awual, R.; Angove, M.J. A Review on Nickel(II) Adsorption in Single and Binary Component Systems and Future Path; Science Publishing: New York, NY, USA, 2019; pp. 1–6. [Google Scholar]
- Almeida, E.J.R.; Corso, C.R. Decolorization and removal of toxicity of textile azo dyes using fungal biomass pelletized. Int. J. Environ. Sci. Technol. 2019, 16, 1319–1328. [Google Scholar] [CrossRef]
- Edison, T.N.J.I.; Atchudan, R.; Sethuraman, M.G.; Lee, Y.R. Reductive-degradation of carcinogenic azo dyes using Anacardium occidentale testa derived silver nanoparticles. J. Photochem. Photobiol. B 2016, 162, 604–610. [Google Scholar] [CrossRef]
- World Health Organization (Ed.) Global Water Supply and Sanitation Assessment; Report; World Health Organization: Geneva, Switzerland; UNICEF: New York, NY, USA, 2000. [Google Scholar]
- Saratale, R.G.; Saratale, G.D.; Chang, J.S.; Govindwar, S.P. Bacterial decolorization and degradation of azo dyes: A review. J. Taiwan Inst. Chem. Eng. 2011, 42, 138–157. [Google Scholar] [CrossRef]
- Yang, S.S.; Kang, J.H.; Xie, T.R.; He, L.; Xing, D.F.; Ren, N.Q.; Wu, W.M. Generation of high-efficient biochar for dye adsorption using frass of yellow mealworms (larvae of Tenebrio molitor Linnaeus) fed with wheat straw for insect biomass production. J. Clean. Prod. 2019, 227, 33–47. [Google Scholar] [CrossRef]
- De Campos Ventura-Camargo, B.; Marin-Morales, M.A. Azo dyes: Characterization and toxicity—A review. Text. Light Ind. Sci. Technol. 2013, 2, 85–103. [Google Scholar]
- Zhuang, M.; Sanganyado, E.; Xu, L.; Zhu, J.; Li, P.; Liu, W. High Throughput Sediment DNA Sequencing Reveals Azo Dye Degrading Bacteria Inhabit Nearshore Sediments. Microorganisms 2020, 8, 233. [Google Scholar] [CrossRef]
- Mishra, S.; Nayak, J.K.; Maiti, A. Bacteria-mediated bio-degradation of reactive azo dyes coupled with bio-energy generation from model wastewater. Clean Technol. Environ. Policy 2020, 22, 651–667. [Google Scholar] [CrossRef]
- Al-Tohamy, R.; Sun, J.; Fareed, M.F.; Kenawy, E.R.; Ali, S.S. Ecofriendly biodegradation of Reactive Black 5 by newly isolated Sterigmatomyces halophilus SSA1575, valued for textile azo dye wastewater processing and detoxification. Sci. Rep. 2020, 10, 1–16. [Google Scholar]
- Behera, S.S.; Das, S.; Parhi, P.K.; Tripathy, S.K.; Mohapatra, R.K.; Debata, M. Kinetics, thermodynamics and isotherm studies on adsorption of methyl orange from aqueous solution using ion exchange resin Amberlite IRA400. Desalination Water Treat. 2017, 60, 249–260. [Google Scholar] [CrossRef]
- Kumar, R.; Ansari, M.O.; Barakat, M.A. Adsorption of brilliant green by surfactant doped polyaniline/MWCNTs composite: Evaluation of the kinetic, thermodynamic, and isotherm. Ind. Eng. Chem. Res. 2014, 53, 7167–7175. [Google Scholar] [CrossRef]
- Ghaedi, M.; Zeinali, N.; Ghaedi, A.M.; Teimuori, M.; Tashkhourian, J. Artificial neural network-genetic algorithm based optimization for the adsorption of methylene blue and brilliant green from aqueous solution by graphite oxide nanoparticle. Spectrochimica Acta Part A Mol. Biomol. Spectrosc. 2014, 125, 264–277. [Google Scholar] [CrossRef]
- Zhang, L.; Liu, X.; Guo, X.; Su, M.; Xu, T.; Song, X. Investigation on the degradation of brilliant green induced oxidation by NiFe2O4 under microwave irradiation. Chem. Eng. J. 2011, 173, 737–742. [Google Scholar] [CrossRef]
- Kismir, Y.; Aroguz, A.Z. Adsorption characteristics of the hazardous dye Brilliant Green on Saklıkent mud. Chem. Eng. J. 2011, 172, 199–206. [Google Scholar] [CrossRef]
- Rehman, R.; Muhammad, S.J.; Arshad, M. Brilliant green and acid orange 74 dyes removal from water by Pinus roxburghii leaves in naturally benign way: An application of green chemistry. J. Chem. 2019, 2019. [Google Scholar] [CrossRef]
- Zabłocka-Godlewska, E.; Przystaś, W. Fed-Batch Decolourization of Mixture of Brilliant Green and Evans Blue by Bacteria Species Applied as Pure and Mixed Cultures: Influence of Growth Conditions. WaterAirSoil Pollut. 2020, 231, 1–23. [Google Scholar] [CrossRef]
- Allen, S.J.; Mckay, G.; Porter, J.F. Adsorption isotherm models for basic dye adsorption by peat in single and binary component systems. J. Colloid Interface Sci. 2004, 280, 322–333. [Google Scholar] [CrossRef]
- Saeed, A.; Sharif, M.; Iqbal, M. Application potential of grapefruit peel as dye sorbent: Kinetics, equilibrium and mechanism of crystal violet adsorption. J. Hazard. Mater. 2010, 179, 564–572. [Google Scholar] [CrossRef]
- Han, R.; Ding, D.; Xu, Y.; Zou, W.; Wang, Y.; Li, Y.; Zou, L. Use of rice husk for the adsorption of Congo red from aqueous solution in column mode. Bioresour Technol. 2008, 99, 2938–2946. [Google Scholar] [CrossRef]
- Sadaf, S.; Bhatti, H.N. Batch and fxed bed column studies for the removal of Indosol Yellow BG dye by peanut husk. J. Taiwan Inst. Chem. Eng. 2008, 45, 541–553. [Google Scholar] [CrossRef]
- Munagapati, V.S.; Yarramuthi, V.; Kim, Y.; Lee, K.M.; Kim, D.S. Removal of anionic dyes (Reactive Black 5 and Congo Red) from aqueous solutions using Banana Peel Powder as an adsorbent. Ecotoxicol. Environ. Saf. 2018, 148, 601–607. [Google Scholar] [CrossRef]
- Jain, R.; Sikarwar, S. Removal of hazardous dye Congo red from waste material. J. Hazard. Mater. 2008, 152, 942–948. [Google Scholar] [CrossRef]
- Arami, M.; Limaee, N.Y.; Mahmoodi, N.M.; Tabrizi, N.S. Removal of dyes from colored textile wastewater by orange peel adsorbent: Equilibrium and kinetic studies. J. Colloid Interface Sci. 2005, 288, 371–376. [Google Scholar] [CrossRef] [PubMed]
- Alhujaily, A.; Yu, H.; Zhang, X.; Ma, F. Adsorptive removal of anionic dyes from aqueous solutions using spent mushroom waste. Appl. Water Sci. 2020, 10, 1–12. [Google Scholar] [CrossRef]
- Filice, S.; D’Angelo, D.; Scarangella, A.; Iannazzo, D.; Compagnini, G.; Scalese, S. Highly effective and reusable sulfonated pentablock copolymer nanocomposites for water purification applications. RSC Adv. 2017, 7, 45521–45534. [Google Scholar] [CrossRef]
- Scalese, S.; Nicotera, I.; D’Angelo, D.; Filice, S.; Libertino, S.; Simari, C.; Privitera, V. Cationic and anionic azo-dye removal from water by sulfonated graphene oxide nanosheets in Nafion membranes. New J. Chem. 2016, 40, 3654–3663. [Google Scholar] [CrossRef]
- Ragab, A.H.; Ahmed, I. Sorption of Cd (II) and Pb (II) ions by nanolimestone from underground water samples from Tehama region of Saudi Arabia. Indian J. Chem. Sect. A (IJCA) 2020, 59, 333–340. [Google Scholar]
- Pathania, D.; Sharma, A.; Siddiqi, Z.M. Removal of Congo red dye from aqueous system using Phoenix dactylifera seeds. J. Mol. Liq. 2016, 219, 359–367. [Google Scholar] [CrossRef]
- Popoola, L.T.; Aderibigbe, T.A.; Yusuff, A.S.; Munir, M.M. Brilliant green dye adsorption onto composite snail shell–rice husk: Adsorption isotherm, kinetic, mechanistic, and thermodynamics analysis. Environ. Qual. Manag. 2018, 28, 63–78. [Google Scholar] [CrossRef]
- Nallathambi, G.; Ramachandran, T.; Rajendran, V.; Palanivelu, R. Effect of silica nanoparticles and BTCA on physical properties of cotton fabrics. Mater. Res. 2011, 14, 552–559. [Google Scholar] [CrossRef]
- Wang, F.; Jiang, J.; Sun, F.; Sun, L.; Wang, T.; Liu, Y.; Li, M. Flexible wearable graphene/alginate composite non-woven fabric temperature sensor with high sensitivity and anti-interference. Cellulose 2020, 27, 2369–2380. [Google Scholar] [CrossRef]
- Chen, L.; Zhang, G.; Wang, L.; Wu, W.; Ge, J. Zeta potential of limestone in a large range of salinity. Colloids Surf. A Physicochem. Eng. Asp. 2014, 450, 1–8. [Google Scholar] [CrossRef]
- Nkutha, C.S.; Shooto, N.D.; Naidoo, E.B. Adsorption studies of methylene blue and lead ions from aqueous solution by using mesoporous coral limestones. South Afr. J. Chem. Eng. 2020, 34, 151–157. [Google Scholar] [CrossRef]
- Tan, K.L.; Hameed, B.H. Insight into the adsorption kinetics models for the removal of contaminants from aqueous solutions. J. Taiwan Inst. Chem. Eng. 2017, 74, 25–48. [Google Scholar] [CrossRef]
- Largittea, L.; Pasquierb, R. A review of the kinetics adsorption models and their application to the adsorption of Pb by an activated carbon. Chem. Eng. Res. Des. 2016, 109, 495–504. [Google Scholar] [CrossRef]
- Weber, W.J.; Morris, J.C. Kinetics of Adsorption on Carbon from Solutions. J. Sanit. Eng. Division Am. Soc. Civ. Eng. 1963, 89, 31–60. [Google Scholar]
- McKay, G.; Otterburn, M.S.; Sweeney, A.G. The removal of colour from effluent using various adsorbents—III. Silica: Rate processes. Water Res. 1980, 14, 15–20. [Google Scholar] [CrossRef]
- Filice, S.; Mazurkiewicz-Pawlicka, M.; Malolepszy, A.; Stobinski, L.; Kwiatkowski, R.; Boczkowska, A.; Scalese, S. Sulfonated pentablock copolymer membranes and graphene oxide addition for efficient removal of metal ions from water. Nanomaterials 2020, 10, 1157. [Google Scholar] [CrossRef]
- Qiu, H.; Lu, L.V.; Pan, B.; Zhang, Q.; Zhang, W.; Zhang, Q. Critical review in adsorption kinetic models. J. Zhejiang Univ. Sci. A 2009, 10, 716–724. [Google Scholar] [CrossRef]
- Kajjumba, G.W.; Emik, S.; Öngen, A.; Özcan, H.K.; Aydın, S. Modelling of adsorption kinetic processes—errors, theory and application. In Advanced Sorption Process Applications; BoD–Books on Demand: Norderstedt, Germany, 2018; pp. 1–19. [Google Scholar]
- Mishra, V. Modeling of batch sorber system: Kinetic, mechanistic, and thermodynamic modelling. Appl. Water Sci. 2017, 7, 3173. [Google Scholar] [CrossRef]
- Özcan, A.; Öncü, M.; Özcan, S. Kinetics, isotherm and thermodynamic studies of adsorption of Acid Blue 193 from aqueous solutions onto natural sepiolite. Colloid Surf. A. 2006, 277, 90–97. [Google Scholar] [CrossRef]
- Al-Jlil, A. Adsorption of cobalt ions from waste water on activated Saudi clays. Appl. Water Sci. 2017, 7, 383. [Google Scholar] [CrossRef]
- Tan, X.; Chen, C.; Yu, S.; Wang, X. Sorption of Ni2+ on Na–rectorite studied by batch and spectroscopy methods. Appl. Geochem. 2008, 23, 2767. [Google Scholar] [CrossRef]
- Sari, A.; Tuzen, M.; Soylak, M. Adsorption of Pb(II) and Cr(III) from aqueous solution on Celtek clay. Hazard. Mater. 2007, 144, 41. [Google Scholar] [CrossRef]
- Tahir, S.S.; Rauf, N. Thermodynamics studies of Nickel(II) adsorptions onto bentonite from aqueous solution. J. Chem. Thermodyn. 2003, 35, 2203. [Google Scholar] [CrossRef]
- Ho, S. Selection of Optimum Sorption Isotherm. Carbon 2004, 42, 2115. [Google Scholar] [CrossRef]
- Chatterjee, S.; Guha, N.; Krishnan, S.; Singh, A.K.; Mathur, P.; Rai, D.K. Selective and Recyclable Congo Red Dye Adsorption by Spherical Fe3O4 Nanoparticles Functionalized with 1, 2, 4, 5-Benzenetetracarboxylic Acid. Sci. Rep. 2020, 10, 1–11. [Google Scholar] [CrossRef]
- Alshammari, M.; Al Juboury, M.F.; Naji, L.A.; Faisal, A.A.; Zhu, H.; Al-Ansari, N.; Naushad, M. Synthesis of a novel composite sorbent coated with siderite nanoparticles and its application for remediation of water contaminated with Congo red dye. Inter. J. Env. Res. 2020, 14, 177–191. [Google Scholar] [CrossRef]
- Kim, S.H.; Choi, P.P. Enhanced Congo red dye removal from aqueous solutions using iron nanoparticles: Adsorption, kinetics, and equilibrium studies. Dalton Trans. 2017, 46, 15470–15479. [Google Scholar] [CrossRef] [PubMed]
- Yang, K.; Li, Y.; Zheng, H.; Luan, X.; Li, H.; Wang, Y.; Xia, Y. Adsorption of Congo red with hydrothermal treated shiitake mushroom. Mater. Res. Express 2019, 7, 015103. [Google Scholar] [CrossRef]
- Mansour, R.A.; El Shahawy, A.; Attia, A.; Beheary, M.S. Brilliant Green Dye Biosorption Using Activated Carbon Derived from Guava Tree Wood. Int. J. Chem. Eng. 2020, 2020. [Google Scholar] [CrossRef]
- Abbas, M. Removal of brilliant green (BG) by activated carbon derived from medlar nucleus (ACMN)–Kinetic, isotherms and thermodynamic aspects of adsorption. Adsorpt. Sci. Technol. 2020, 38, 464–482. [Google Scholar] [CrossRef]
- Pathak, P.; Gedam, V.V.; Deokar, S.; Bhagat, S.; Chahande, A.; Raut, P. Studies on the removal of Brilliant Green dye using low cost agricultural waste. Indian J. Chem. Techn. 2020, 27, 333–339. [Google Scholar]
- Hariharan, M.; Varghese, N.; Cherian, A.B.; Paul, J. Synthesis and characterisation of CaCO3 (Calcite) nano particles from cockle shells using chitosan as precursor. Int. J. Sci. Res. Publ. 2014, 4, 1–5. [Google Scholar]
- Ashish, D.K.; Verma, S.K.; Kumar, R.; Sharma, N. Properties of concrete incorporating sand and cement with waste marble powder. Adv. Concr. Constr. 2016, 4, 145. [Google Scholar] [CrossRef]


| Lagrange (Pseudo-First-Order) | Kads (min−1) | qe, cal (mg g−1) | R2 |
|---|---|---|---|
| CR dye | 0.012 | 94.9 | 0.719 |
| BG dye | 0.018 | 31.7 | 0.791 |
| (Pseudo-Second-Order) | K2 (g mg−1 min−1) | qe, cal (mg g−1) | R2 |
| CR dye | 2.07 | 94.9 | 0.968 |
| BG dye | 1.99 | 31.7 | 0.993 |
| Bangham | A | Ko | R2 |
| CR dye | 0.04 | 87.7 | 0.982 |
| BG dye | 0.7 | 128.9 | 0.955 |
| Morris–Weber | Kd (mg g−1 min0.5) | C (mg·g−1) | R2 |
| CR dye | 10.7 | 510 | 0.911 |
| BG dye | 11.1 | 430 | 0.906 |
| Langmuir | |||
| Dye | b (L·mg−1) | Qmax (mg·g−1) | R2 |
| CR | 5.3 × 10⁻³ | 2250 | 0.998 |
| BG | 6.6 × 10⁻³ | 2010 | 0.988 |
| Freundlich | |||
| Dye | Kf (moln−1 Ln g−1) | n | R2 |
| CR | 312 | 3.3 | 0.998 |
| BG | 178 | 2.1 | 0.979 |
| D–R model | |||
| Dye | E (kJ mol−1) | q(DR) (mg·g−1) | R2 |
| CR | 7.9 | 3890 | 0.995 |
| BG | 7.4 | 3080 | 0.968 |
| ∆So (J·mol−1·K−1) | ∆Ho (kJ·mol−1) | ∆Go (kJ·mol−1) | ln Kd | T(K) | Dye |
|---|---|---|---|---|---|
| 89.1 | 37.7 | −5.1 | 10.49 | 288 | CR |
| −27.1 | 10.82 | 298 | |||
| −29.9 | 11.41 | 313 | |||
| −32.4 | 11.72 | 323 | |||
| 79.1 | 8.71 | −21.5 | 9.02 | 288 | BG |
| −22.5 | 9.14 | 298 | |||
| −24.8 | 9.44 | 313 | |||
| −27.4 | 9.70 | 323 |
| Dye | Adsorbent | qe (mg/g) | References |
|---|---|---|---|
| CR | Spherical Fe3O4 nanoparticles functionalized with 1, 2, 4, 5-benzenetetracarboxylic acid | 192 | [49] |
| Synthesis of siderite | 9416 | [50] | |
| Iron nanoparticles | 887 | [51] | |
| Shiitake mushroom | 217.8 | [52] | |
| BG | Activated carbon | 90 | [53] |
| Activated carbon derived from medlar nucleus (ACMN) | 833.33 | [54] | |
| Nanohydroxyapatite | 49.1 | [18] | |
| Low cost agricultural waste | 24.23 | [55] |
Publisher’s Note: MDPI stays neutral with regard to jurisdictional claims in published maps and institutional affiliations. |
© 2021 by the authors. Licensee MDPI, Basel, Switzerland. This article is an open access article distributed under the terms and conditions of the Creative Commons Attribution (CC BY) license (https://creativecommons.org/licenses/by/4.0/).
Share and Cite
Ahmed, I.A.; H. Ragab, A.; Habila, M.A.; Alomar, T.S.; Aljuhani, E.H. Equilibrium and Kinetic Study of Anionic and Cationic Pollutants Remediation by Limestone–Chitosan–Alginate Nanocomposite from Aqueous Solution. Molecules 2021, 26, 2586. https://doi.org/10.3390/molecules26092586
Ahmed IA, H. Ragab A, Habila MA, Alomar TS, Aljuhani EH. Equilibrium and Kinetic Study of Anionic and Cationic Pollutants Remediation by Limestone–Chitosan–Alginate Nanocomposite from Aqueous Solution. Molecules. 2021; 26(9):2586. https://doi.org/10.3390/molecules26092586
Chicago/Turabian StyleAhmed, Inas A., Ahmed H. Ragab, Mohamed A. Habila, Taghrid S. Alomar, and Enas H. Aljuhani. 2021. "Equilibrium and Kinetic Study of Anionic and Cationic Pollutants Remediation by Limestone–Chitosan–Alginate Nanocomposite from Aqueous Solution" Molecules 26, no. 9: 2586. https://doi.org/10.3390/molecules26092586
APA StyleAhmed, I. A., H. Ragab, A., Habila, M. A., Alomar, T. S., & Aljuhani, E. H. (2021). Equilibrium and Kinetic Study of Anionic and Cationic Pollutants Remediation by Limestone–Chitosan–Alginate Nanocomposite from Aqueous Solution. Molecules, 26(9), 2586. https://doi.org/10.3390/molecules26092586