
Improving Environmental Efficiency of Reverse Filling Cementitious Materials through Packing Optimization and Fiber Incorporation


Abstract
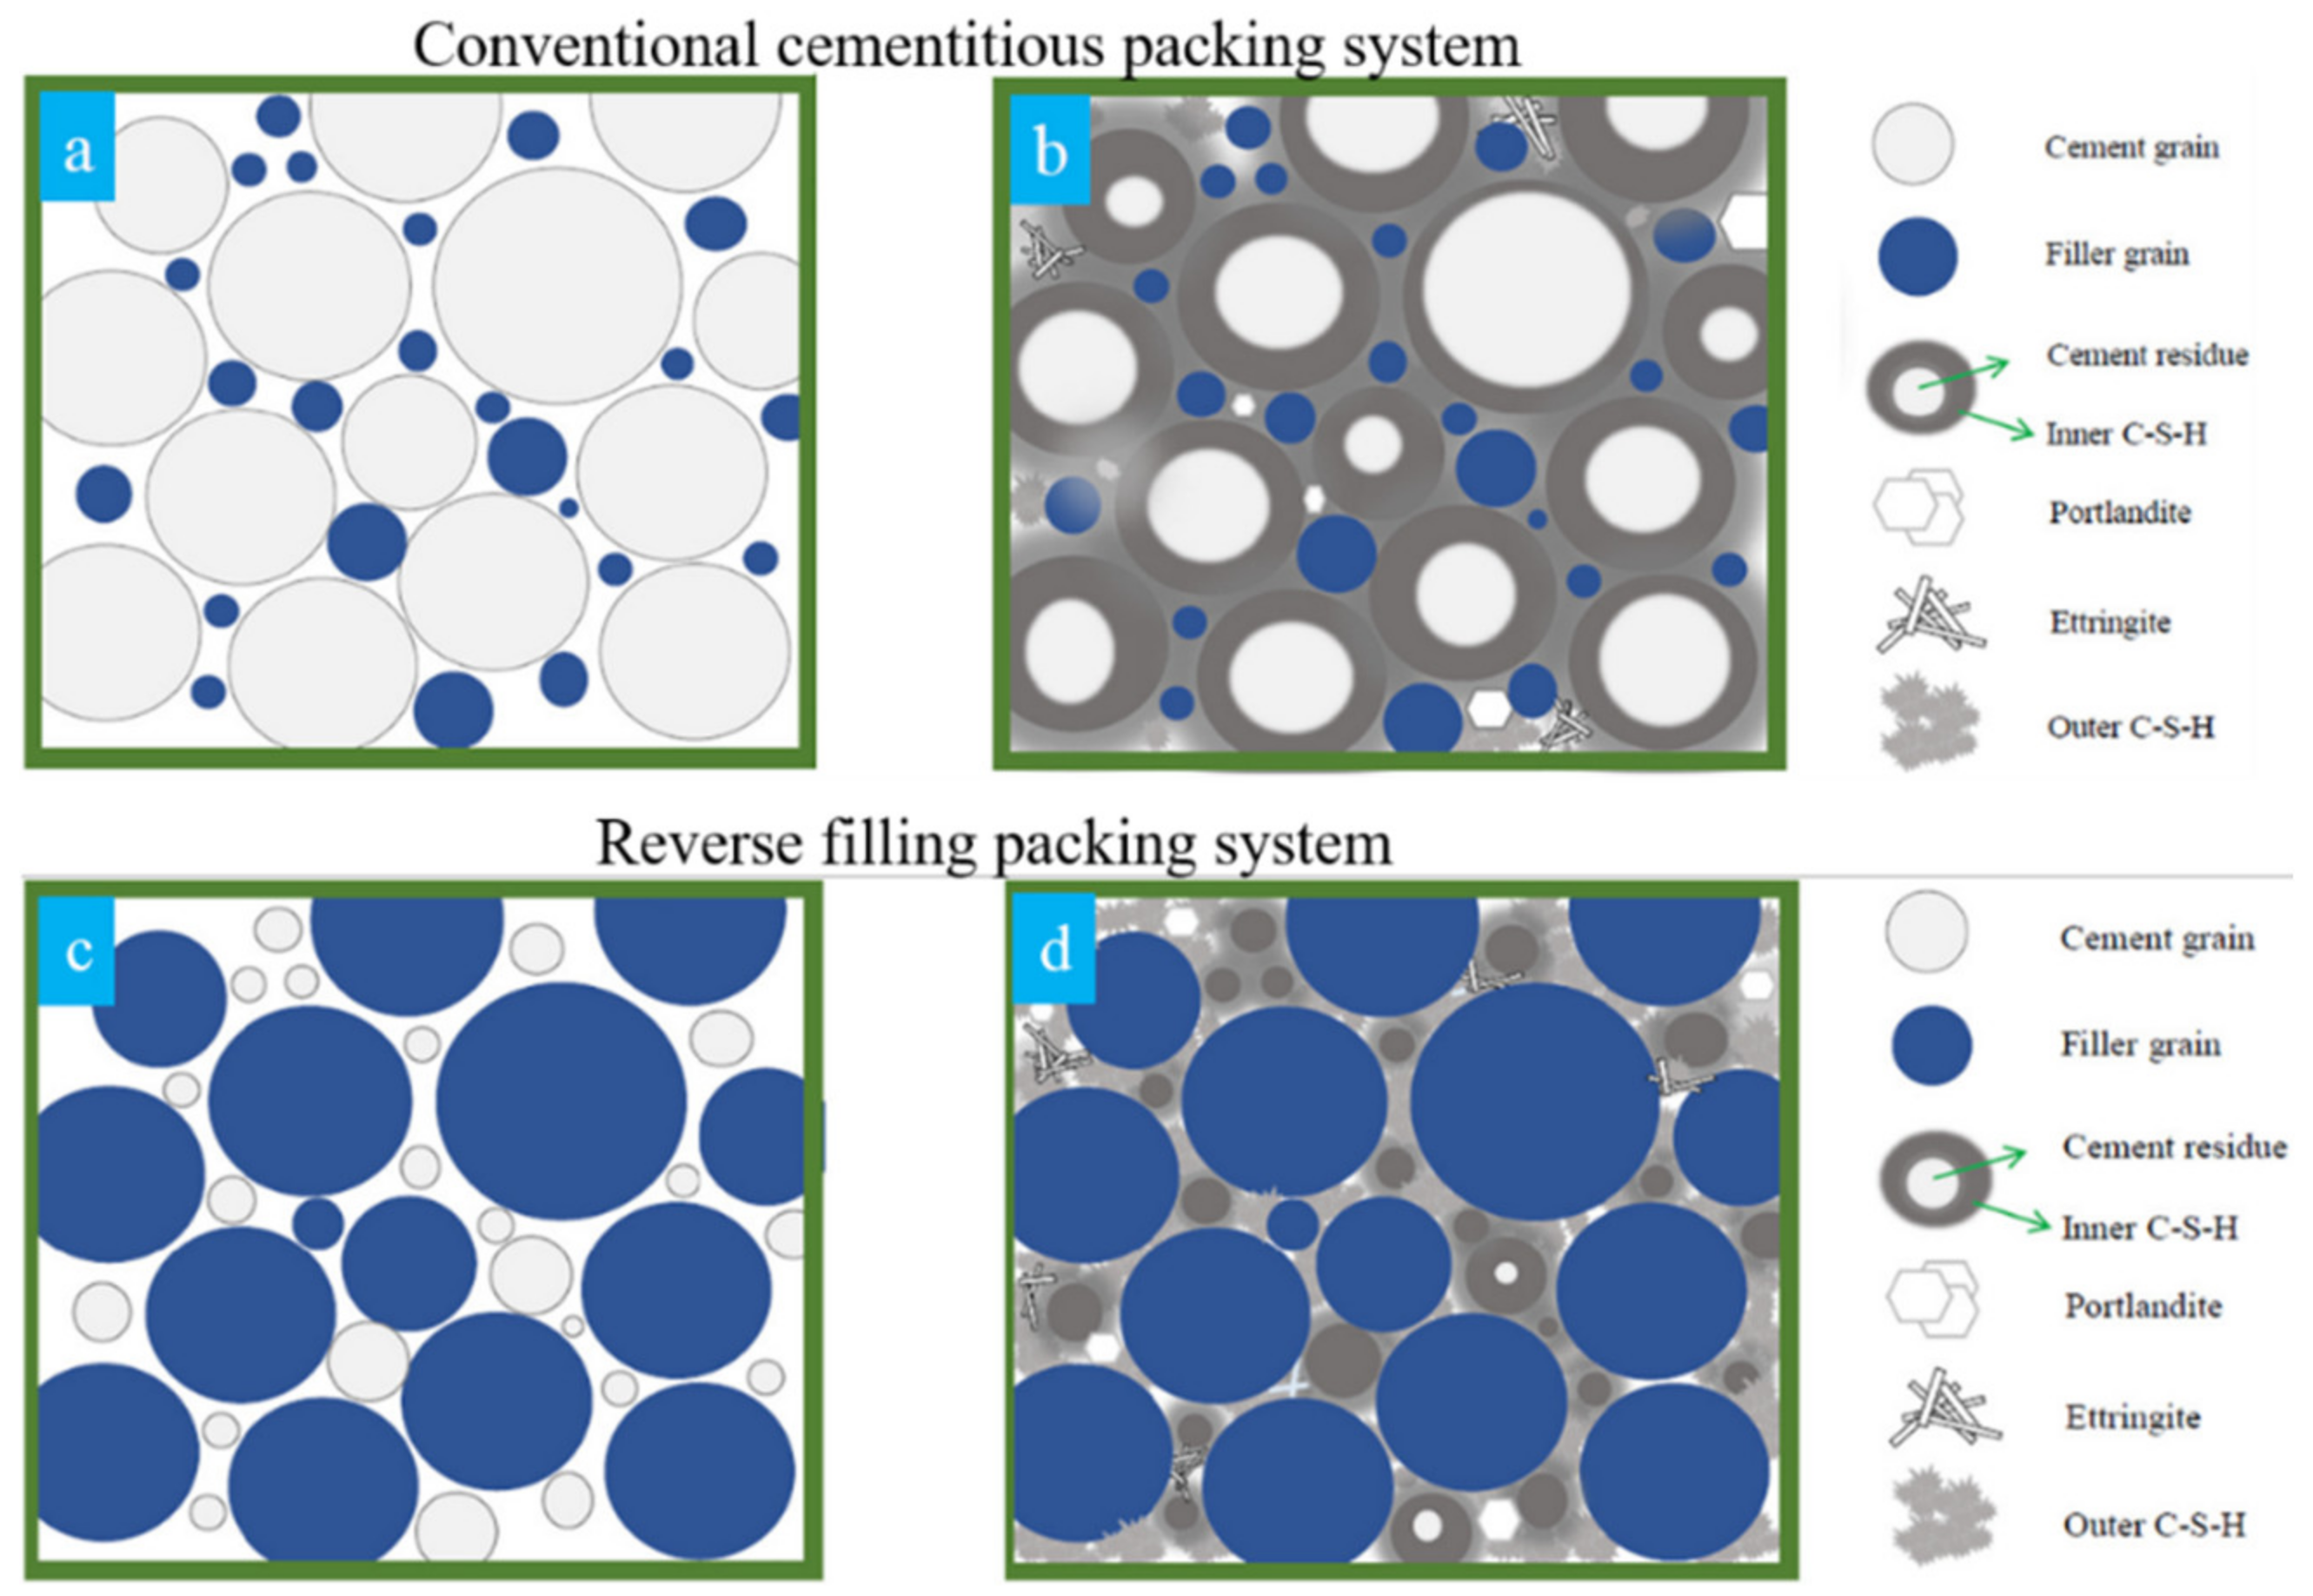
1. Introduction
2. Materials and Methods
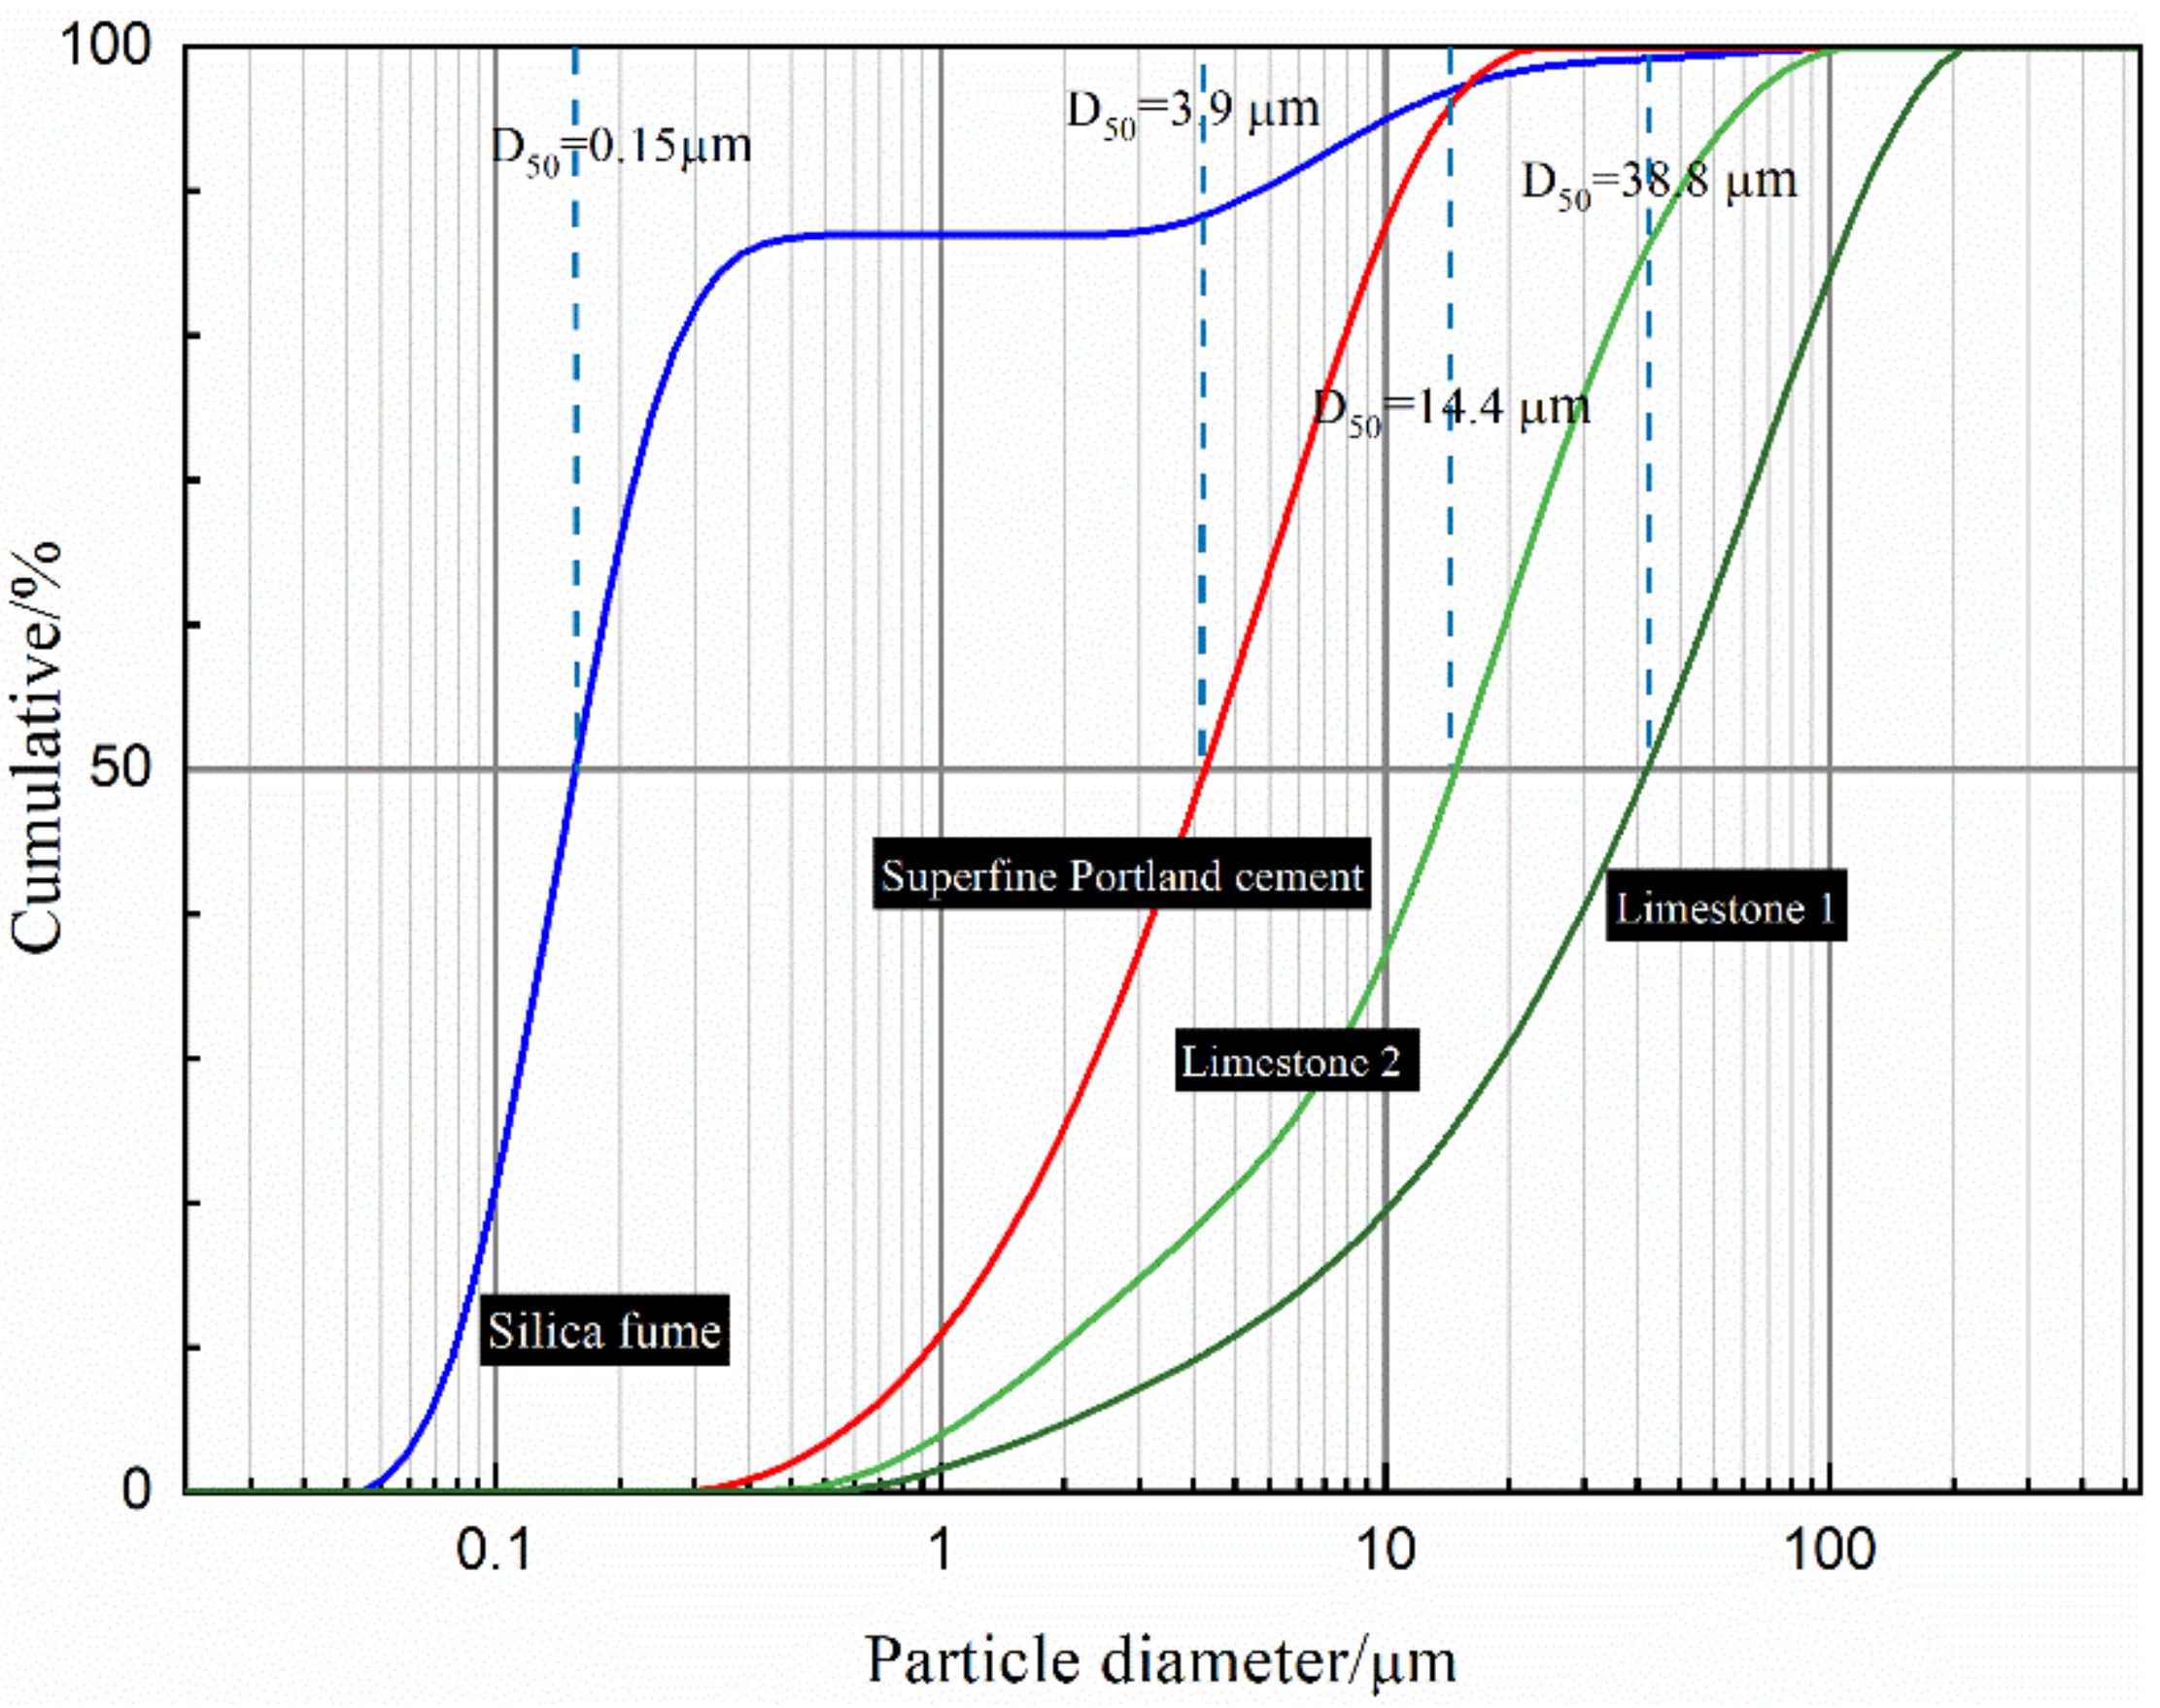
2.1. Raw Materials
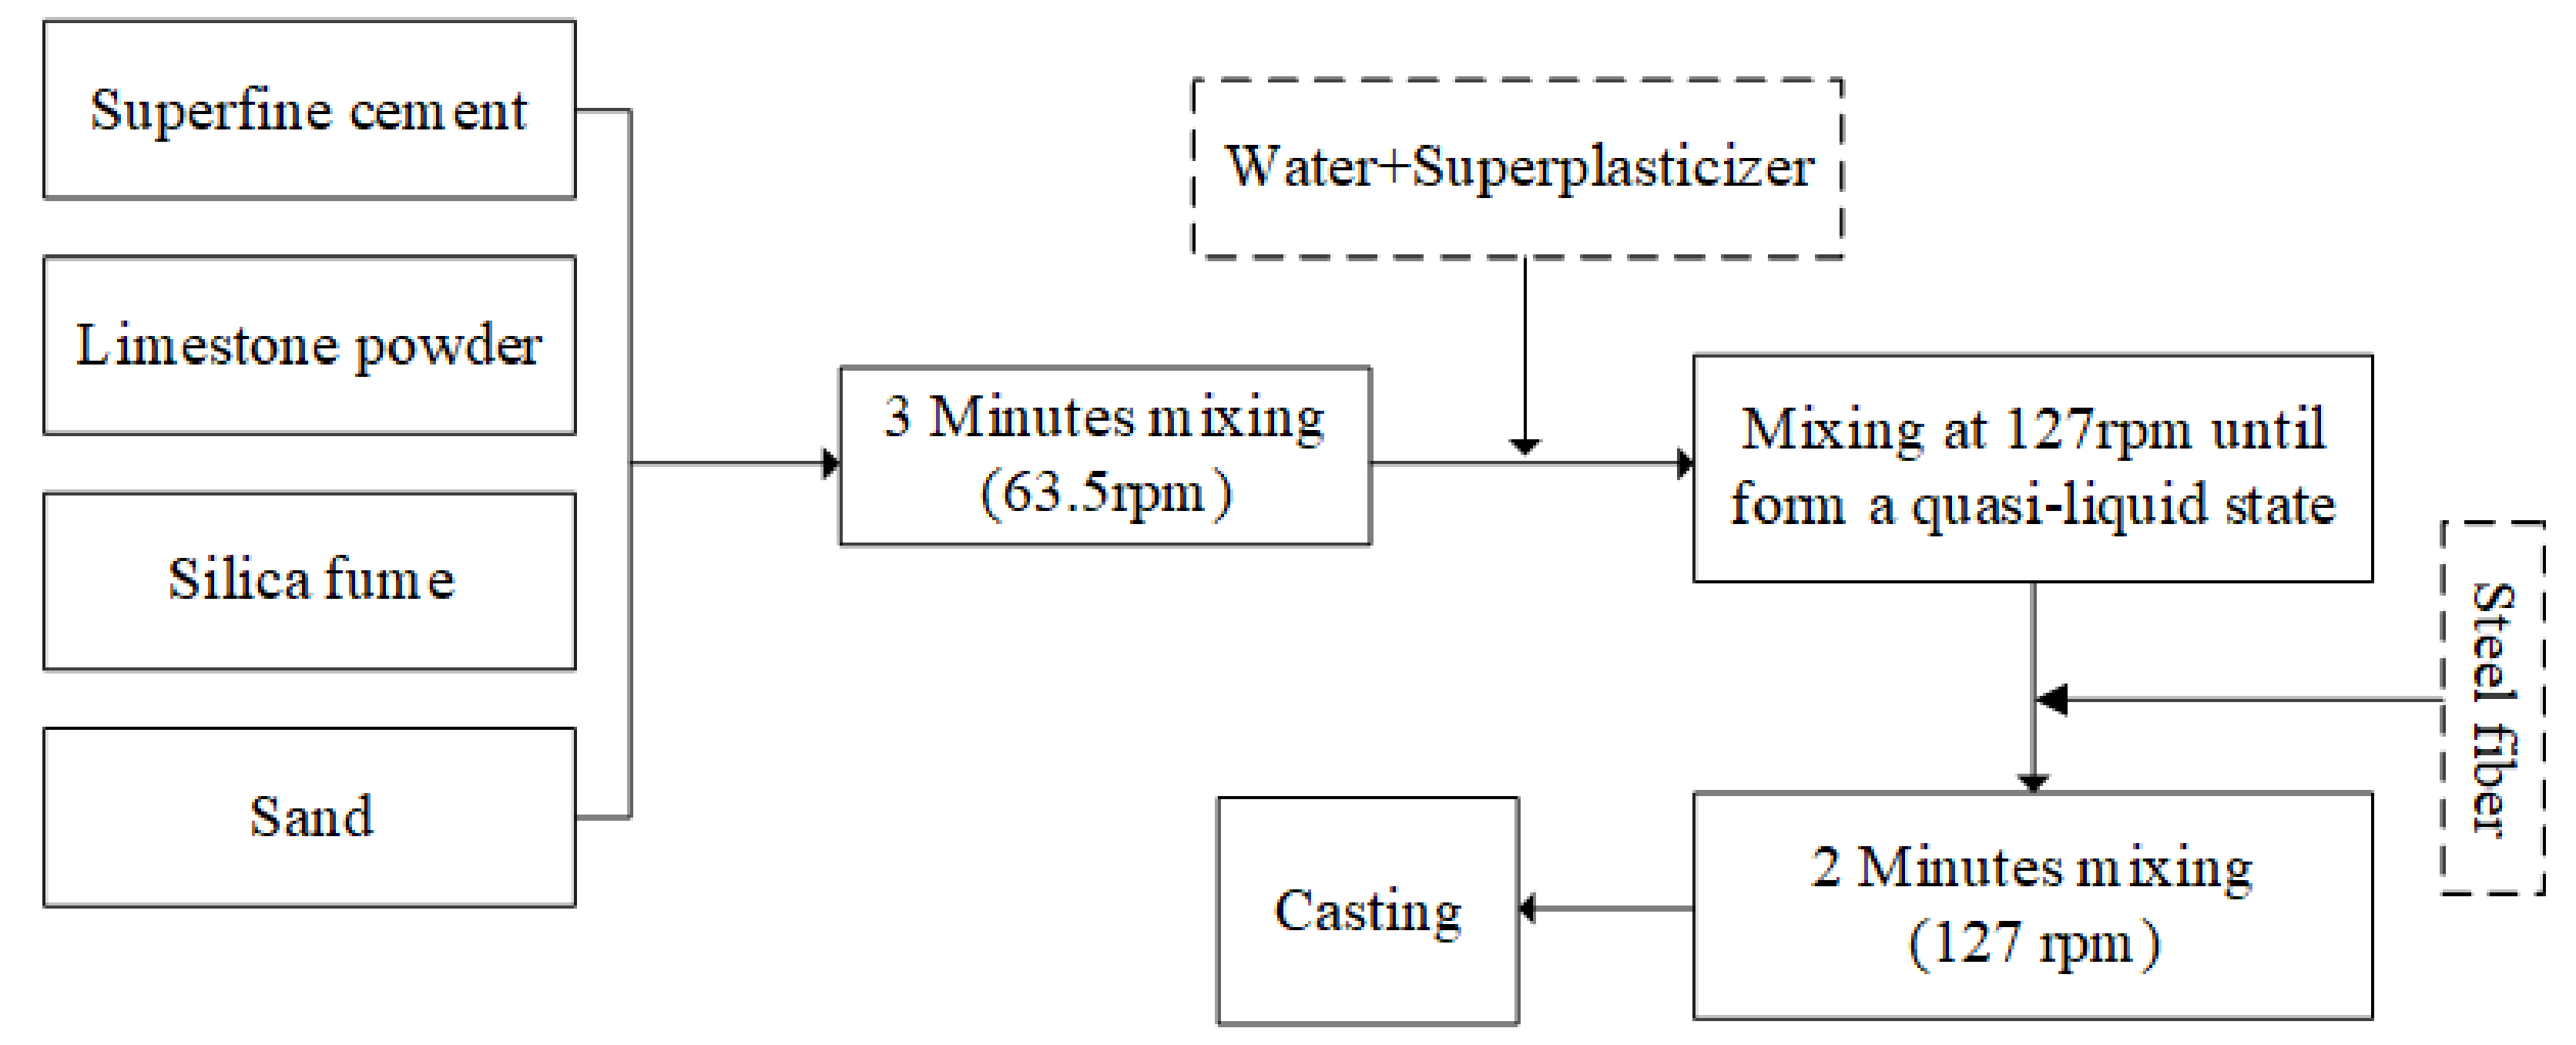
2.2. Mixing and Casting Procedure
2.3. Flowability
2.4. Mechanical Property
2.5. Hydration Degree
2.6. Environmental Efficiency
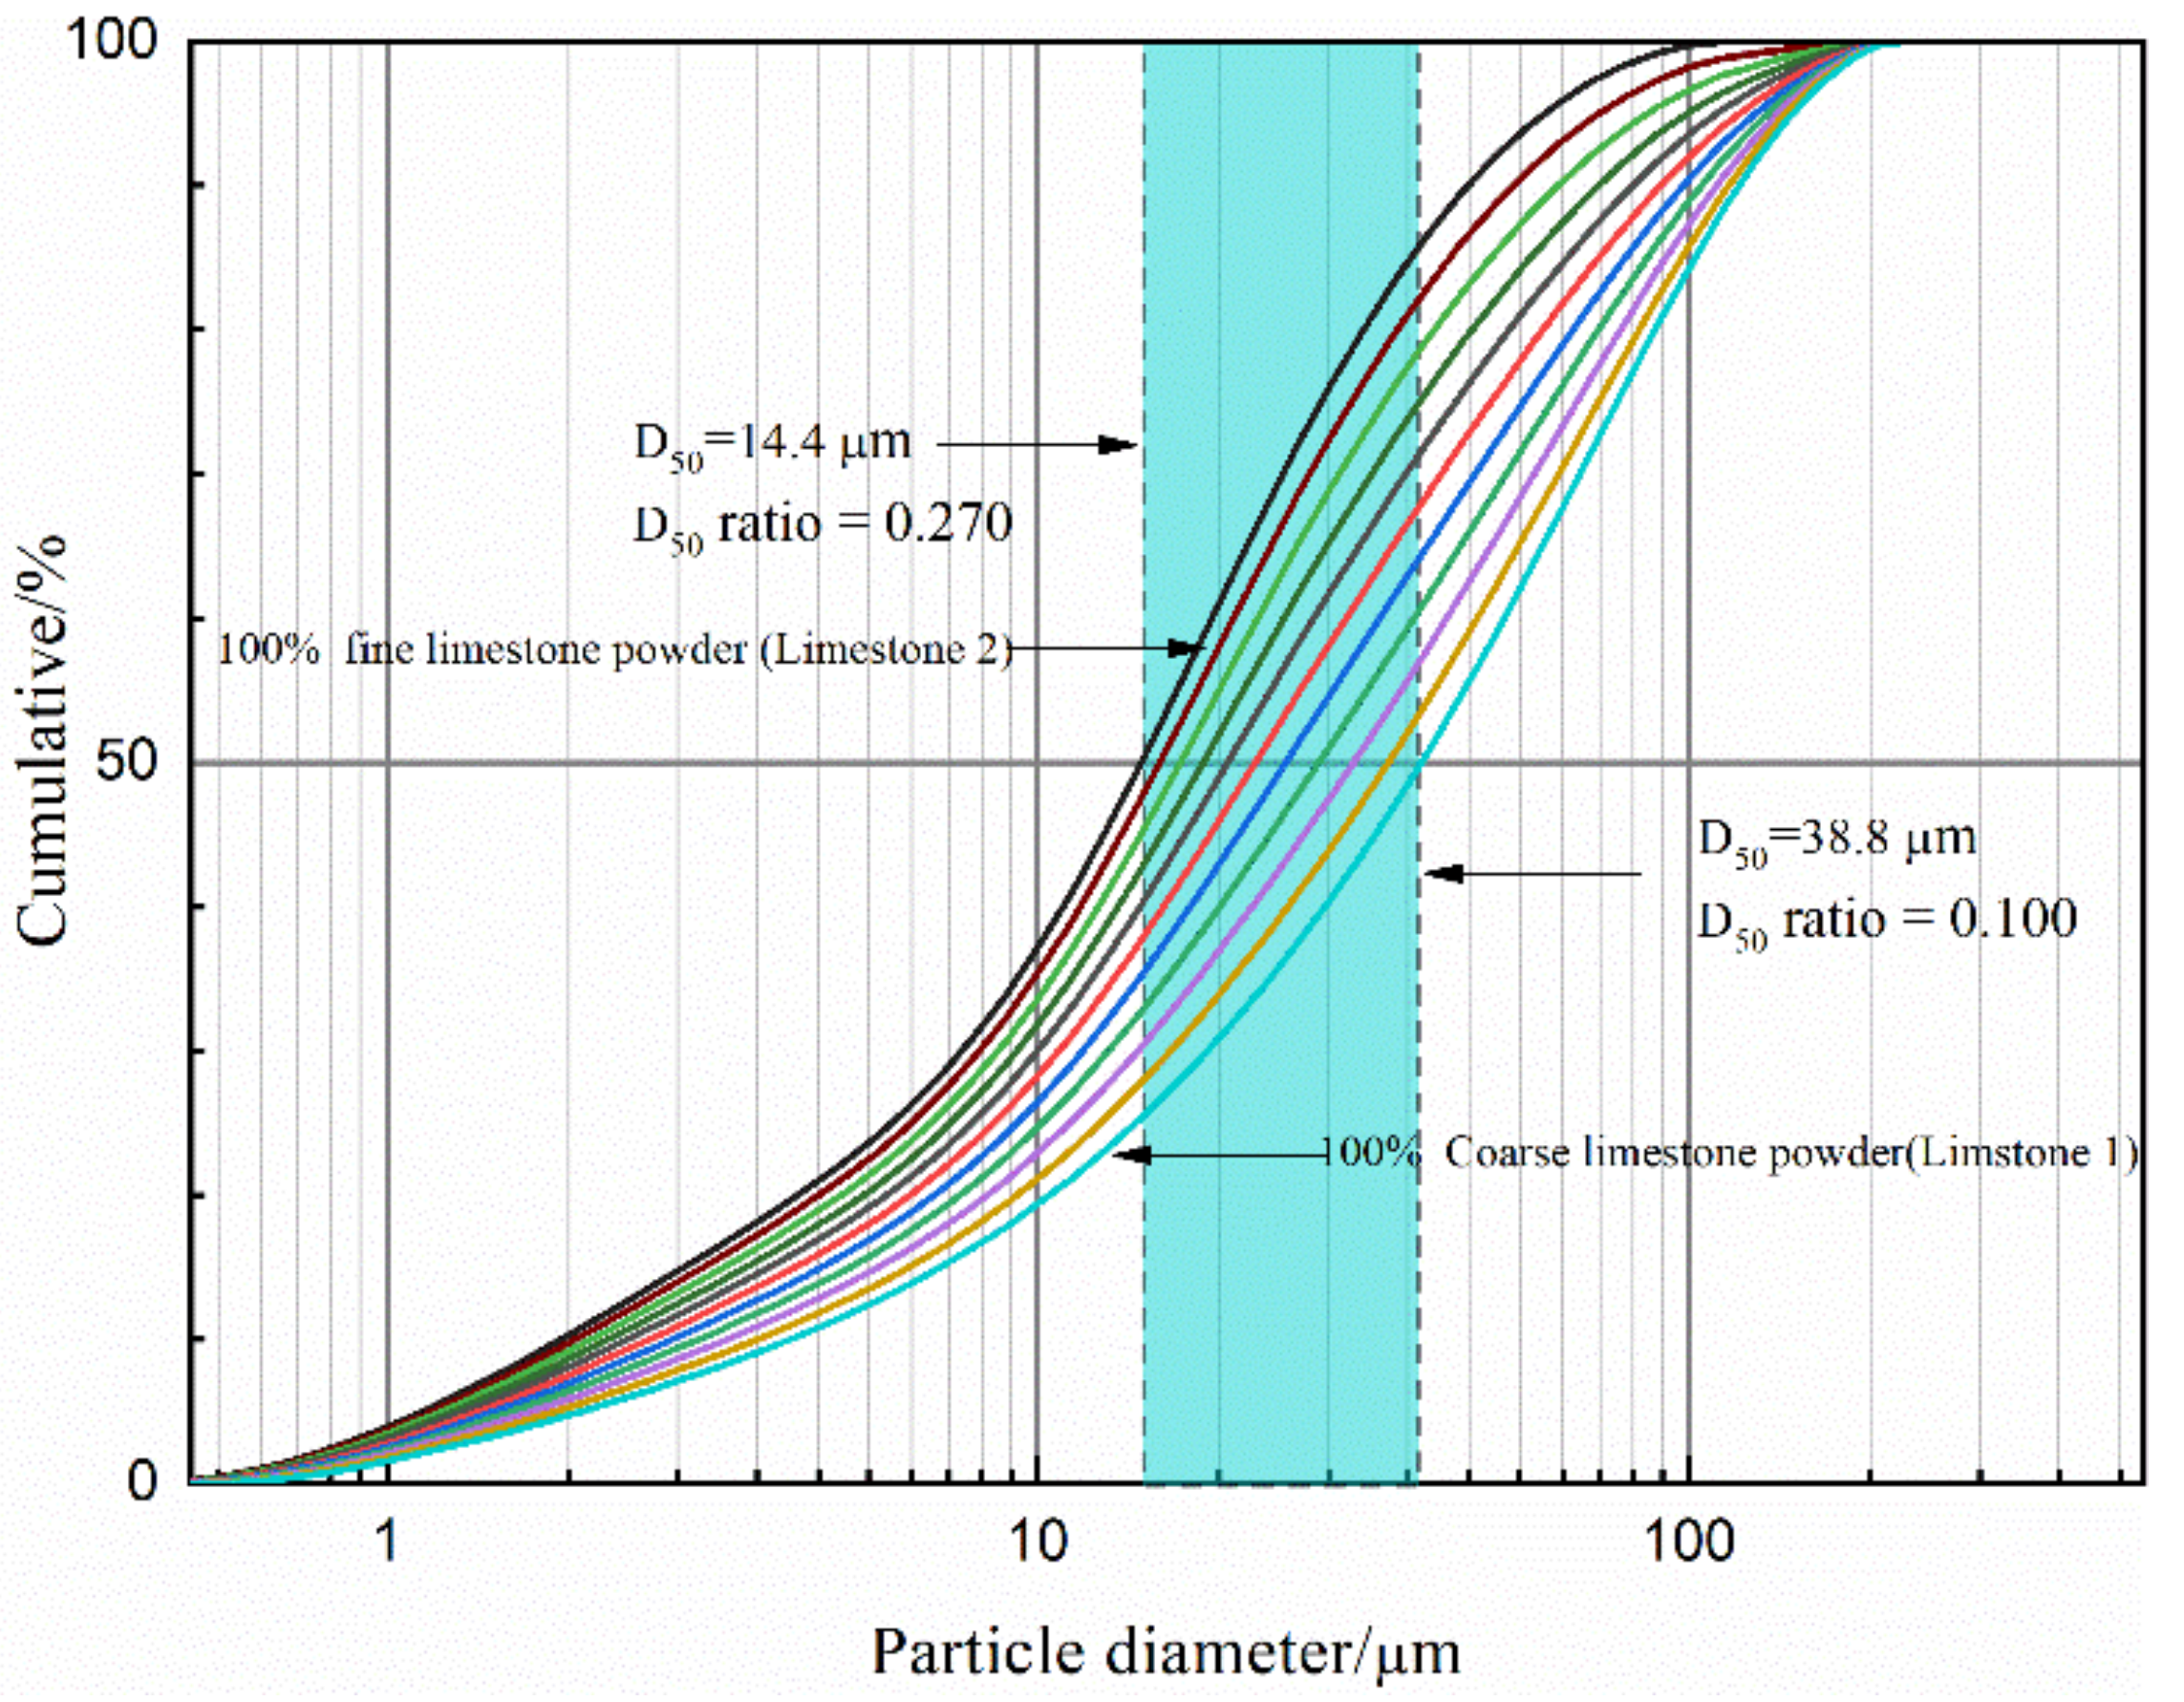
3. Improvement Approaches
4. Results and Discussion
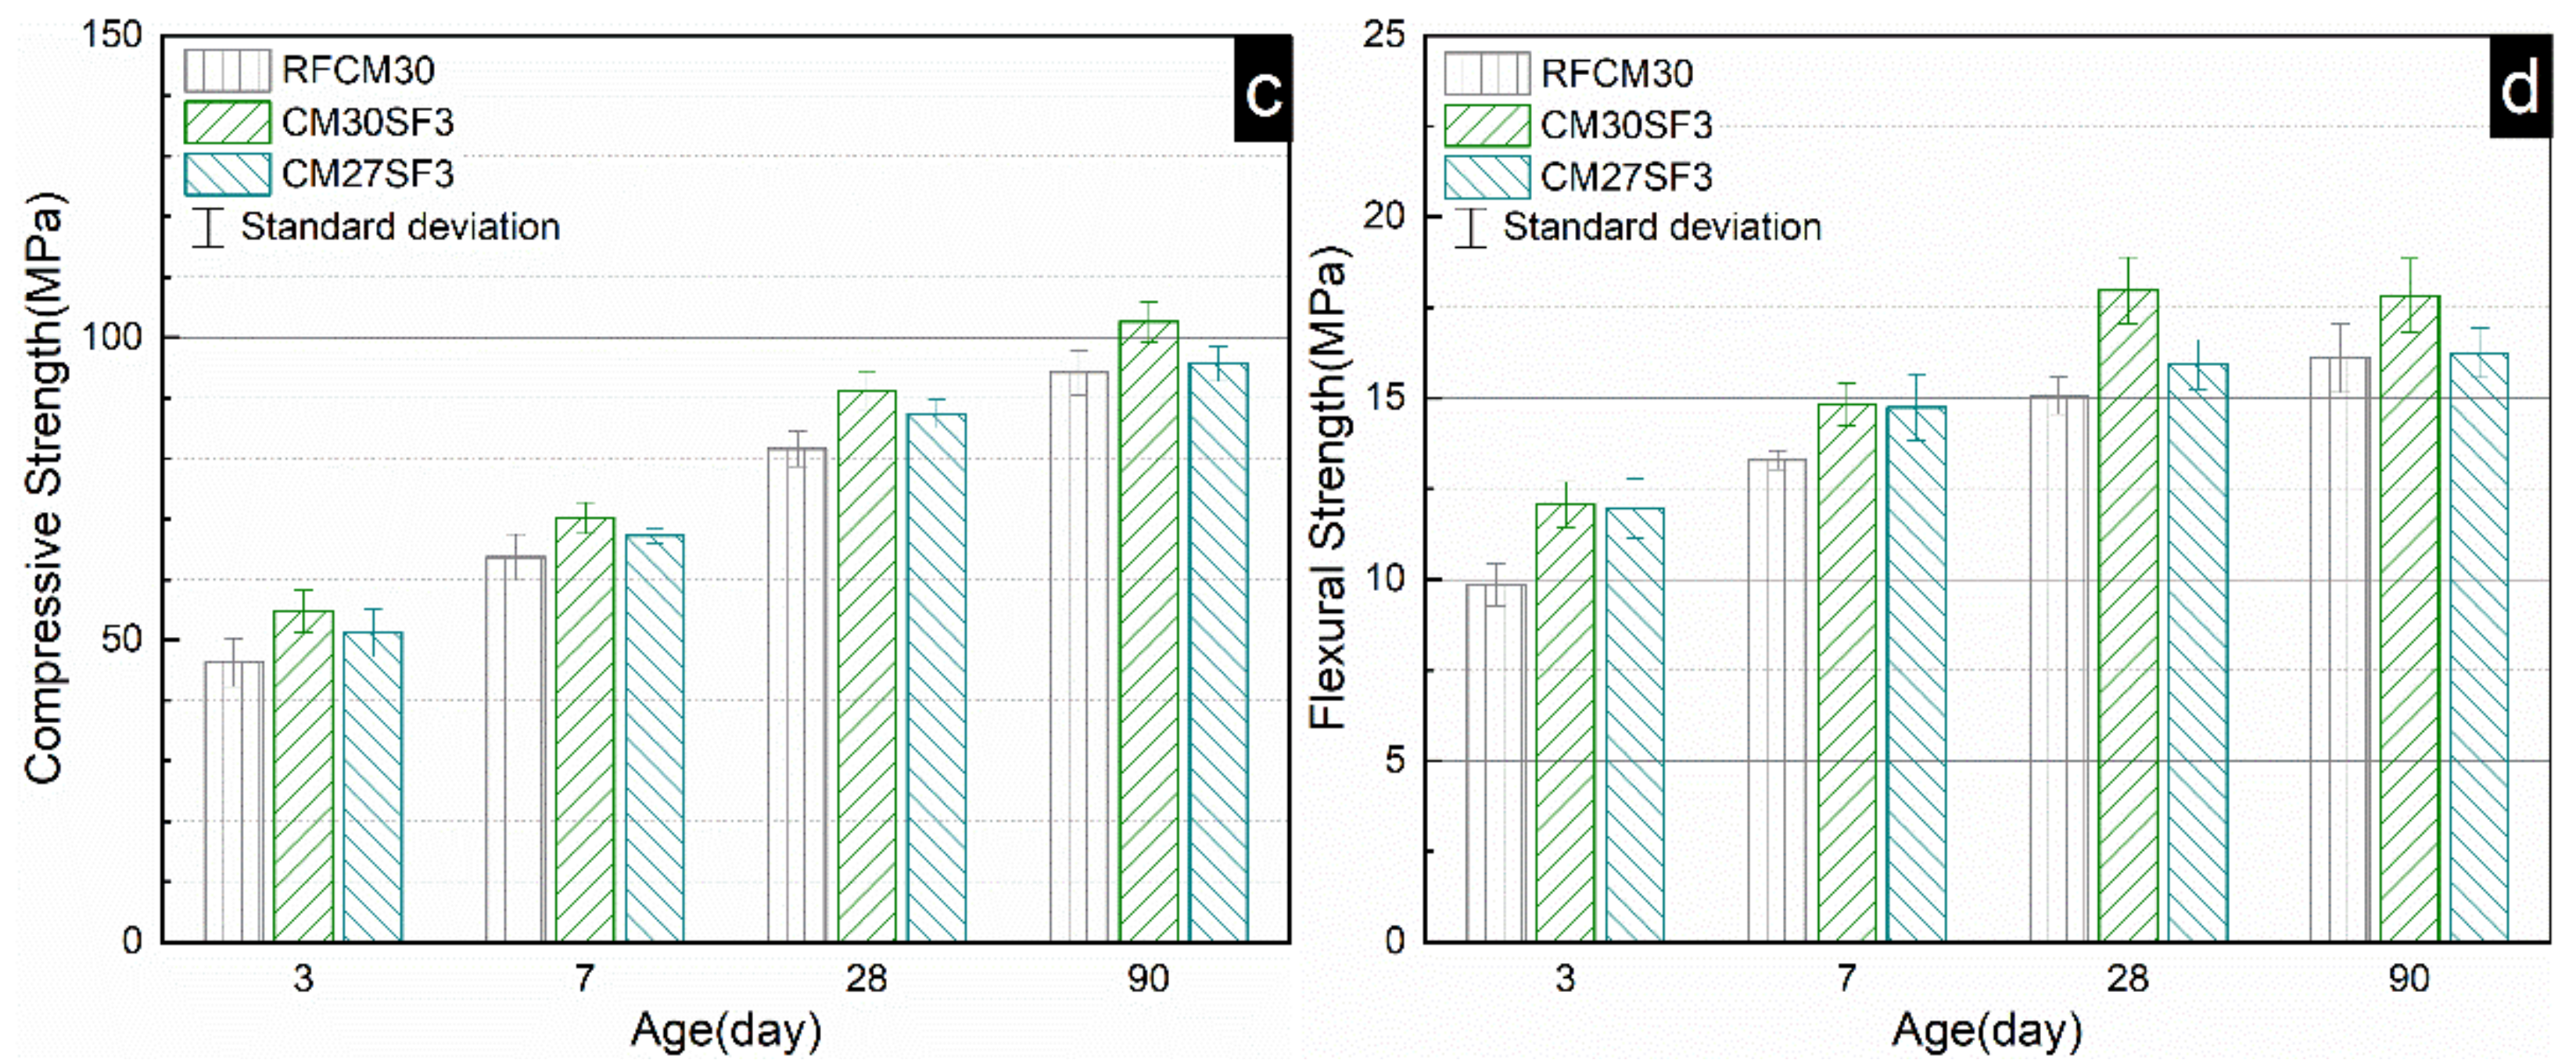
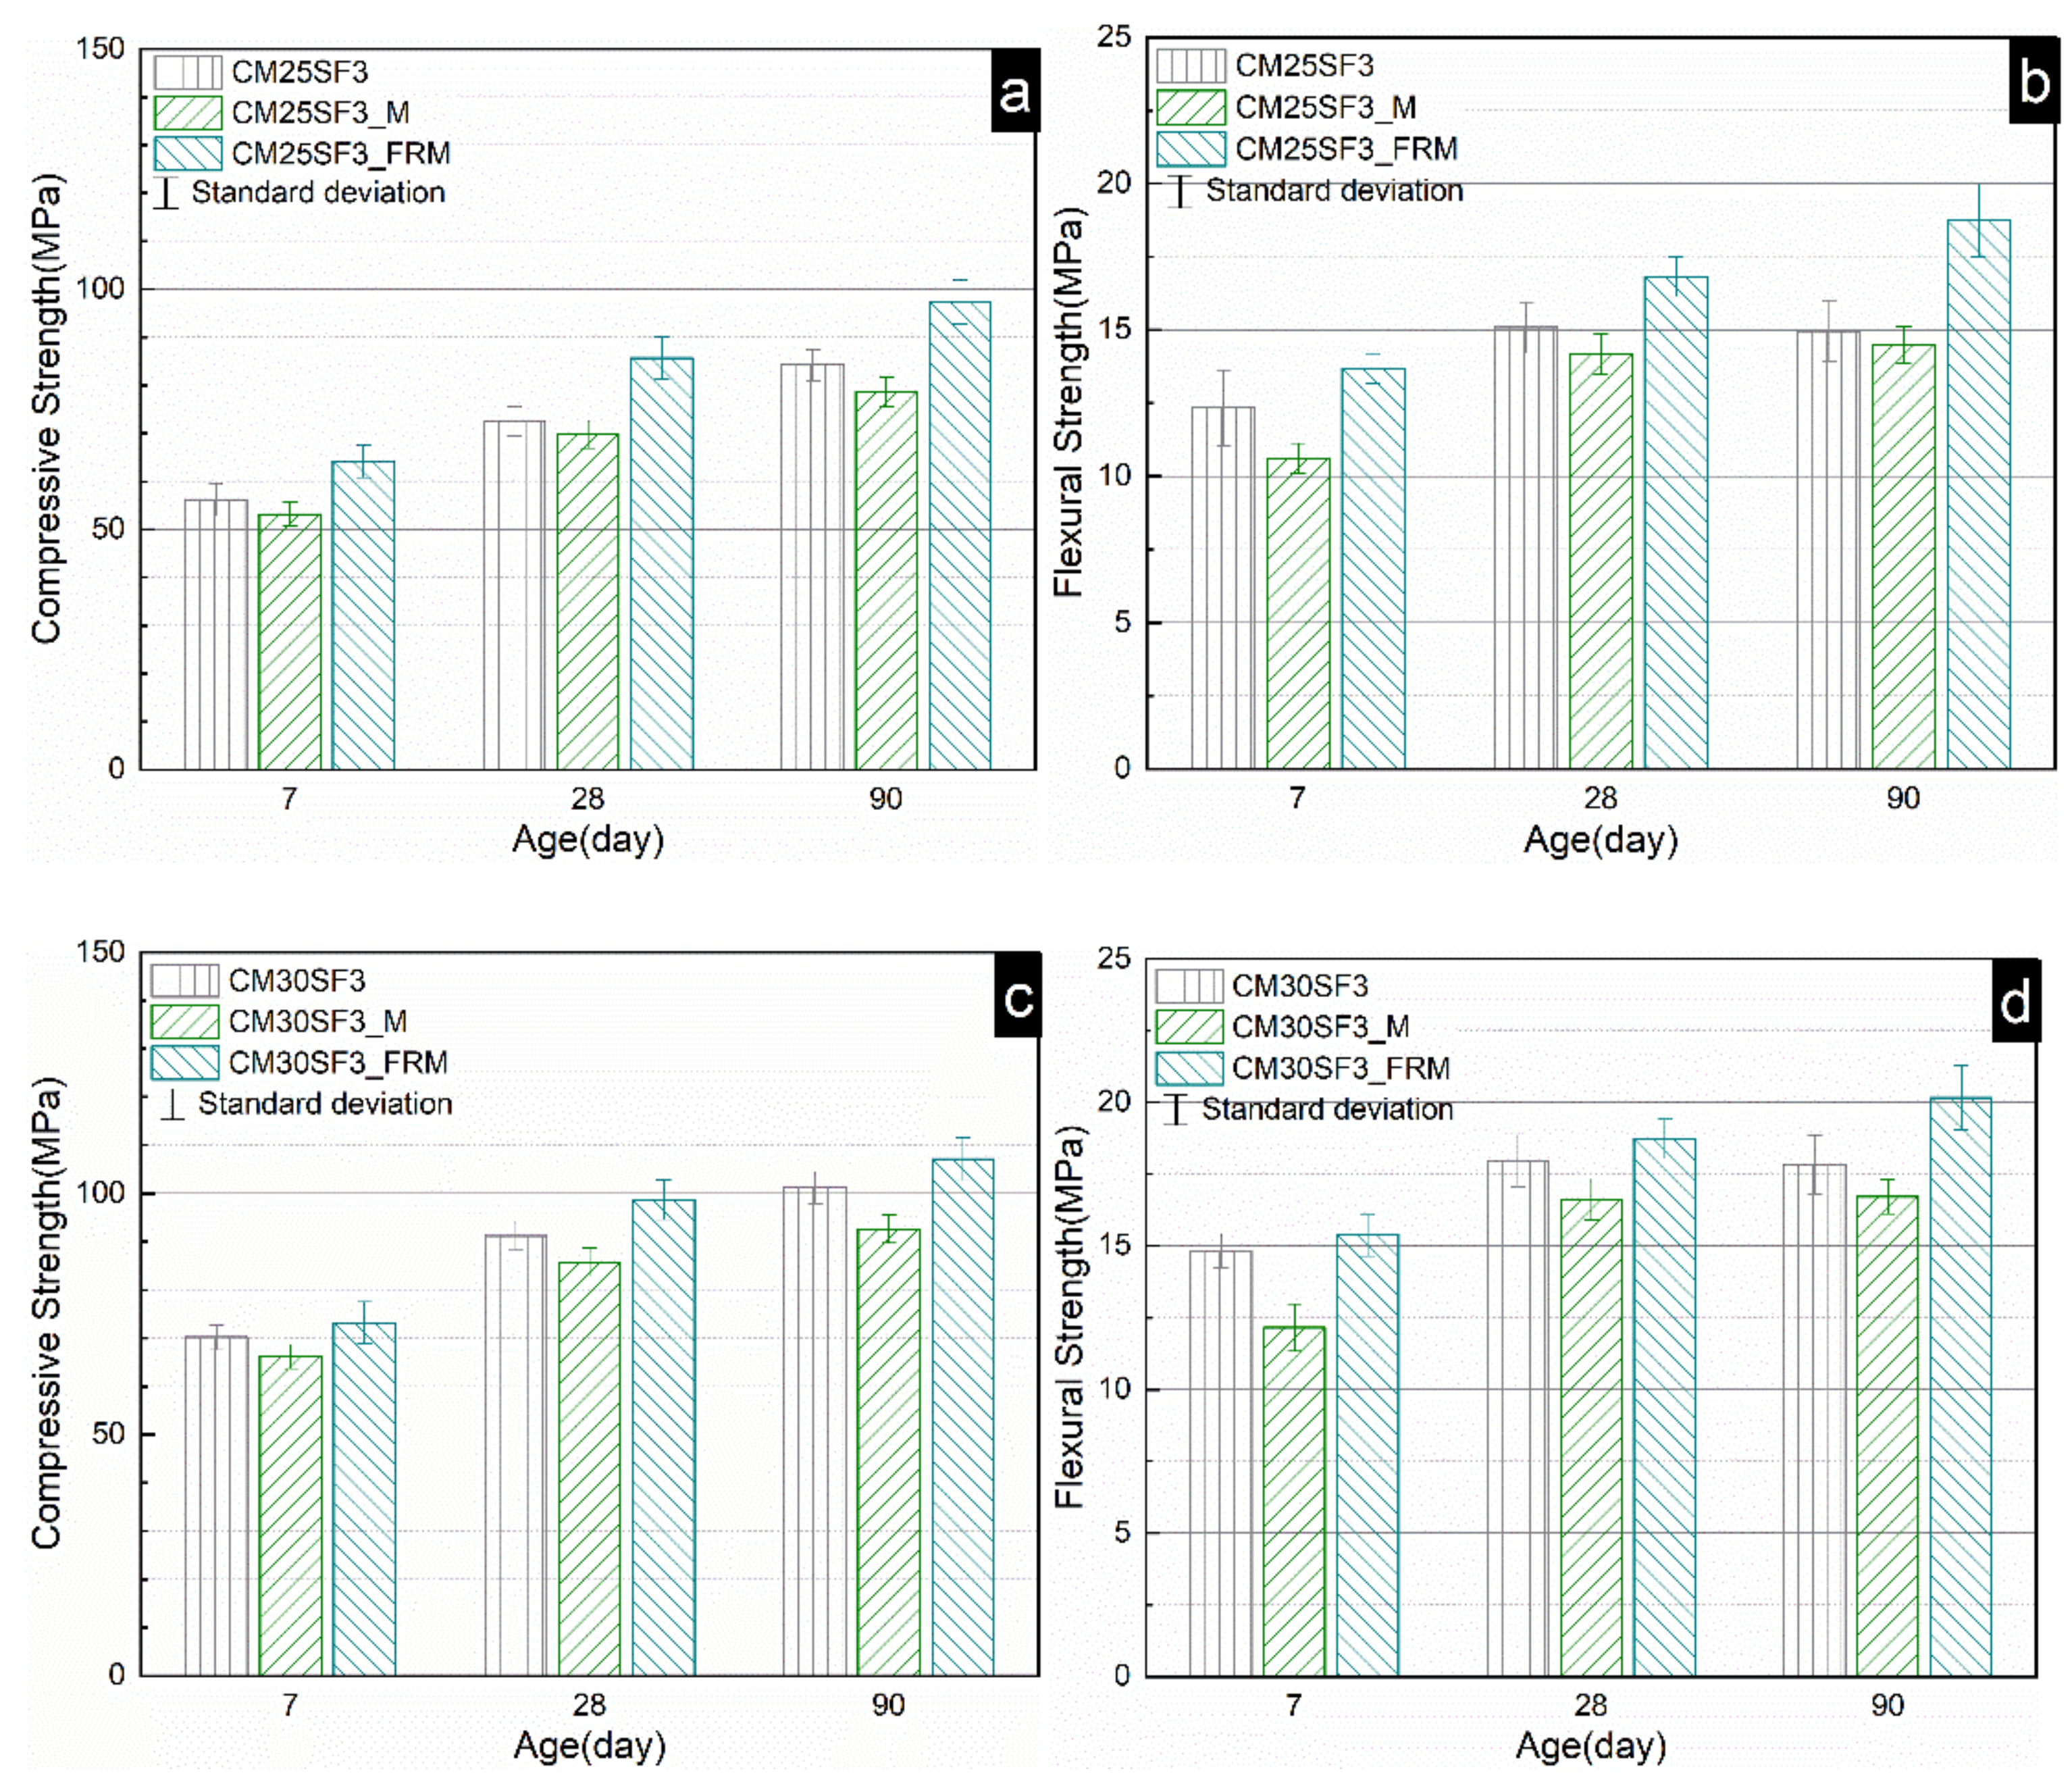
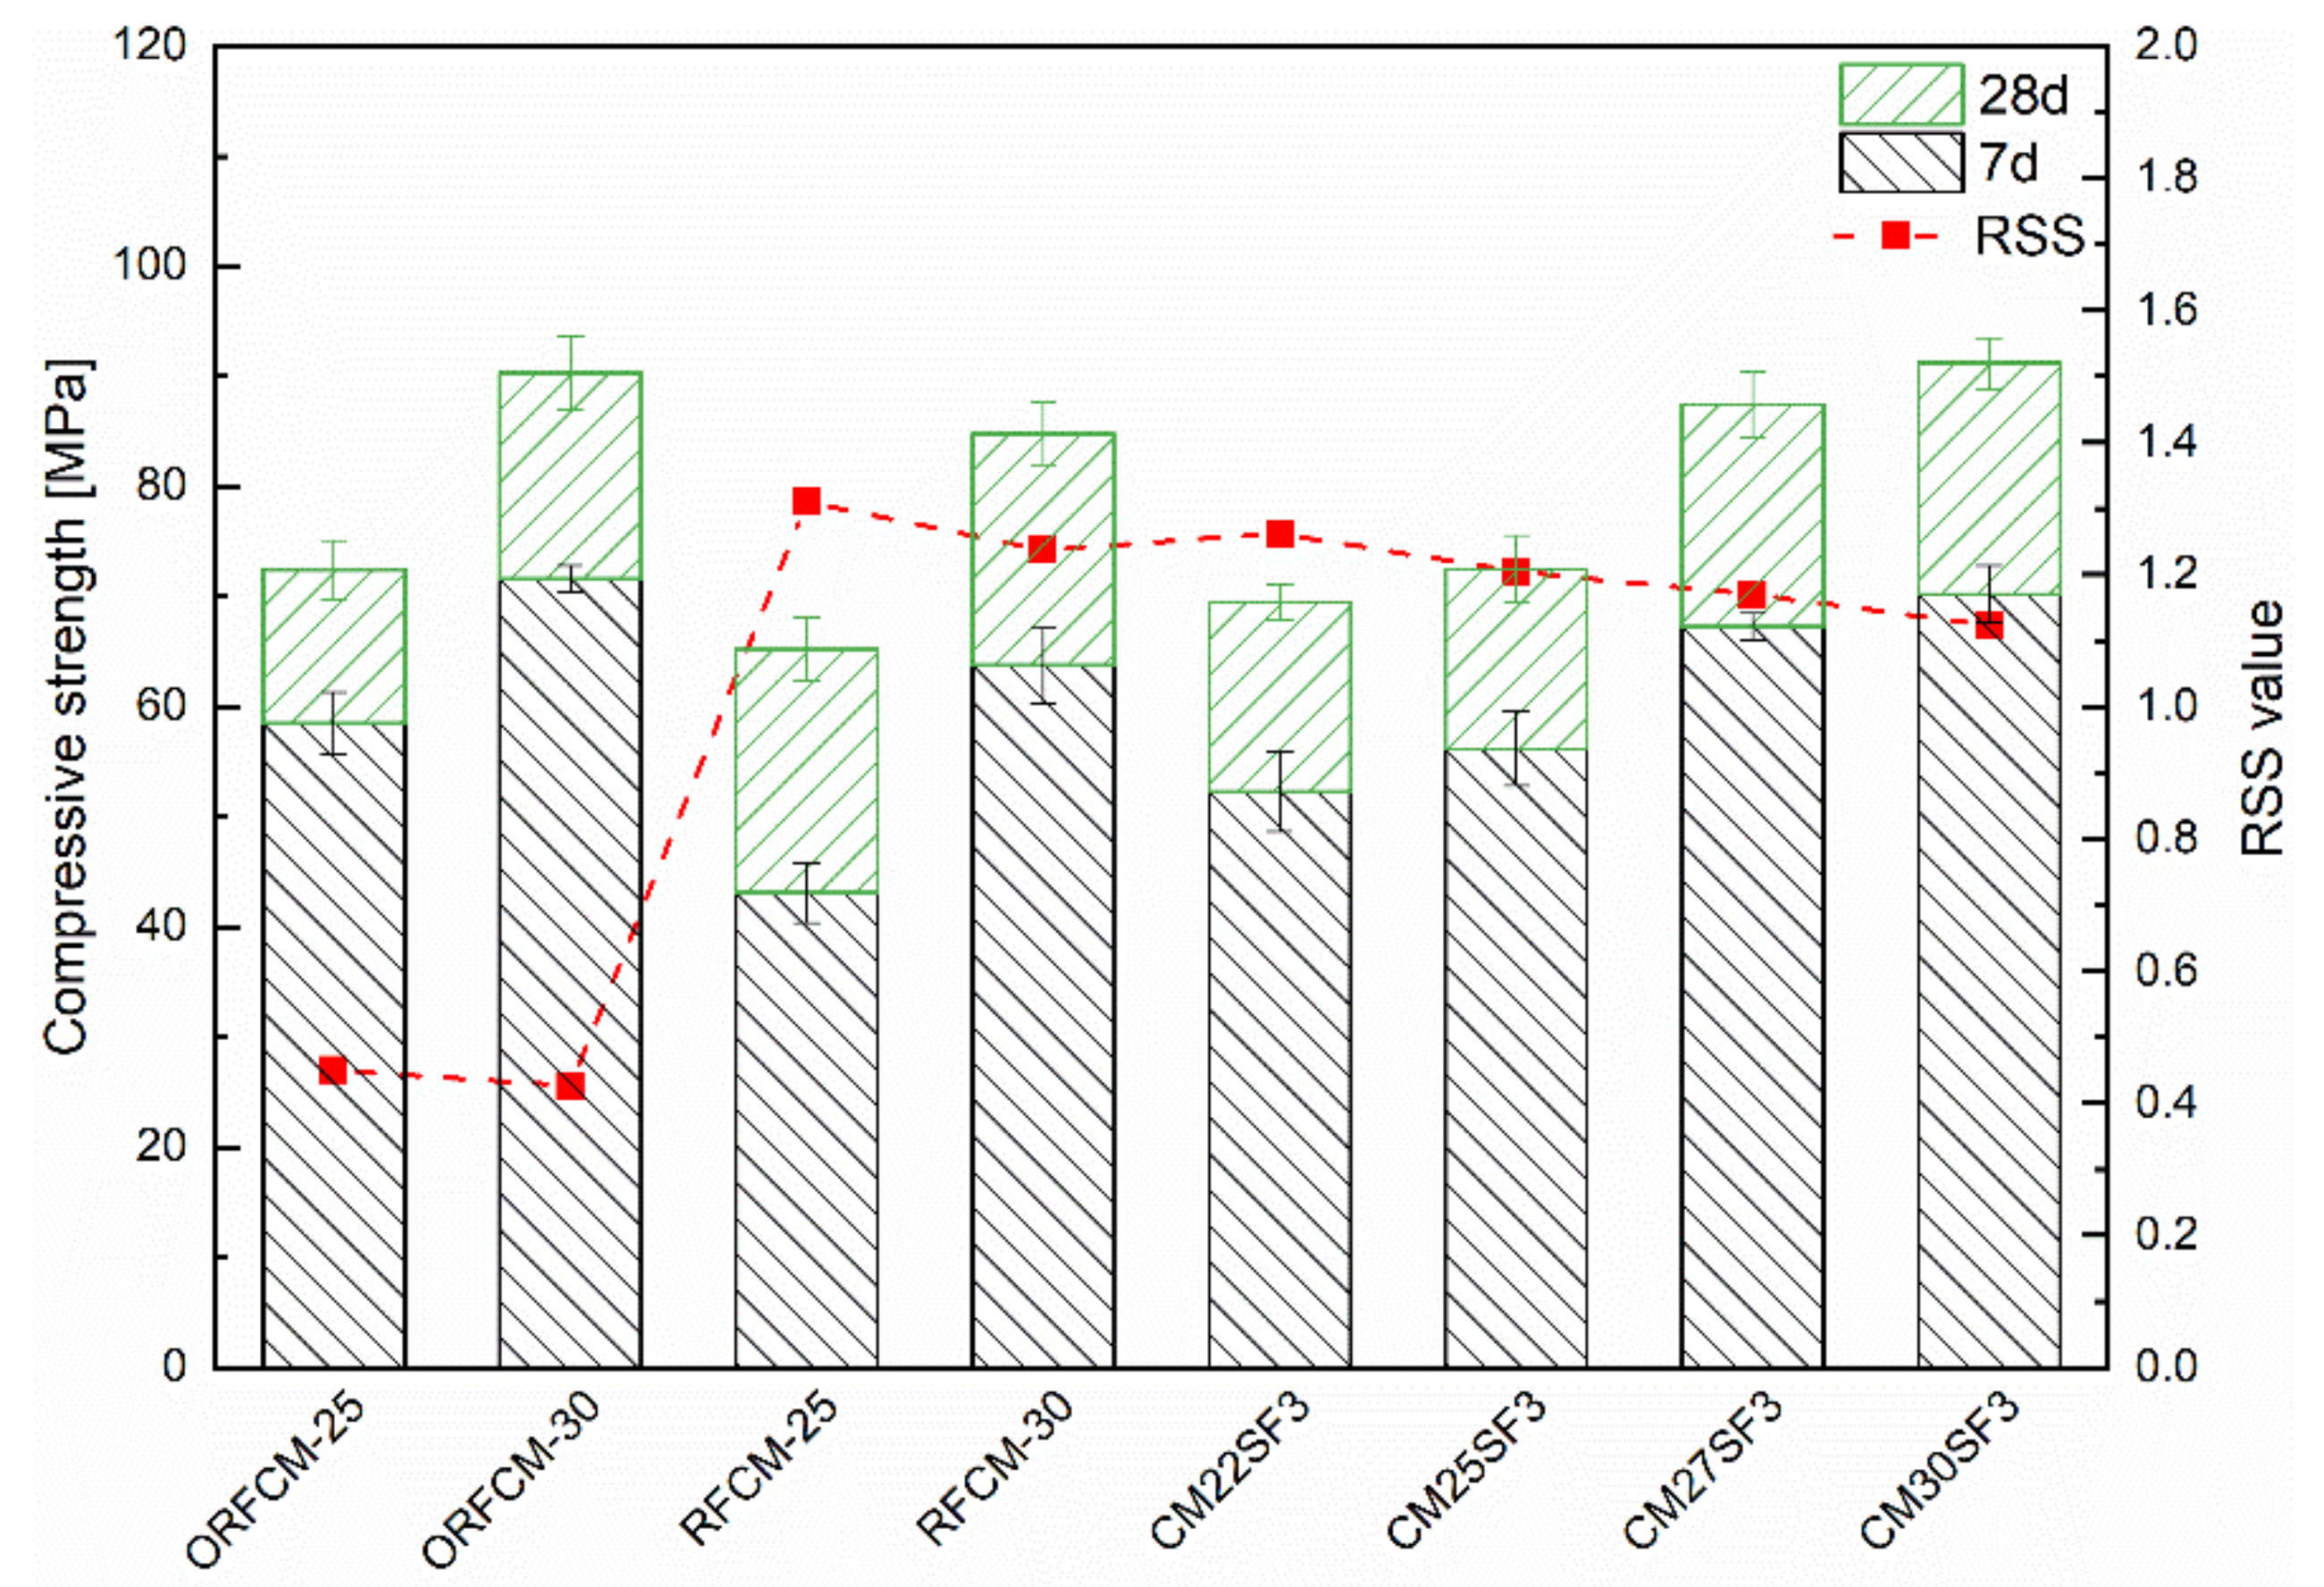
4.1. Mechanical Property
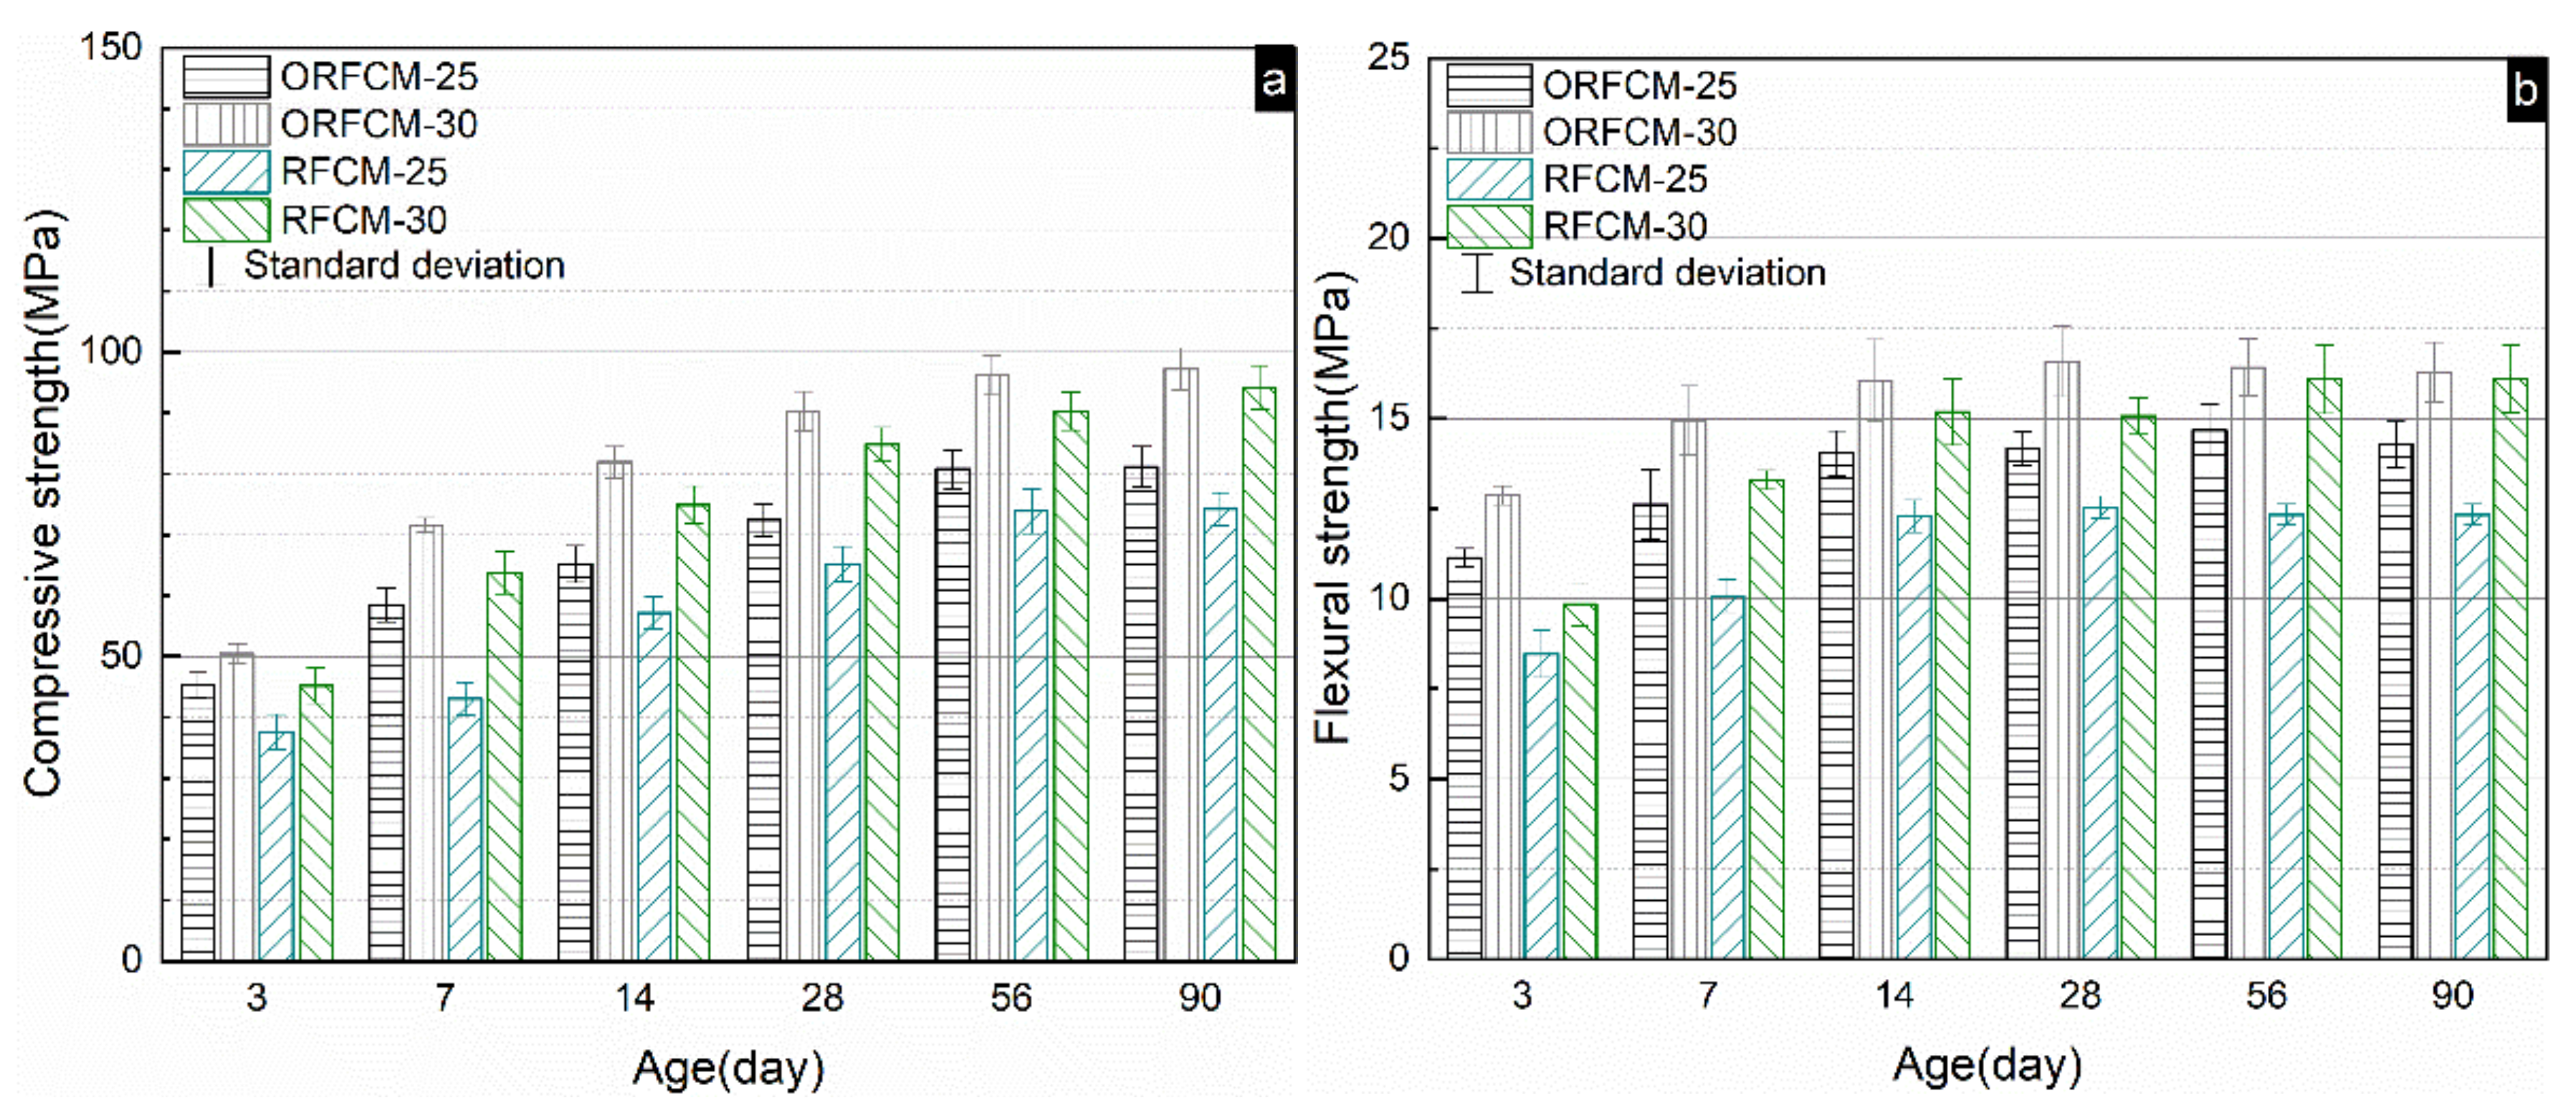
4.1.1. Effect of Optimized Packing Density and Cement Proportion
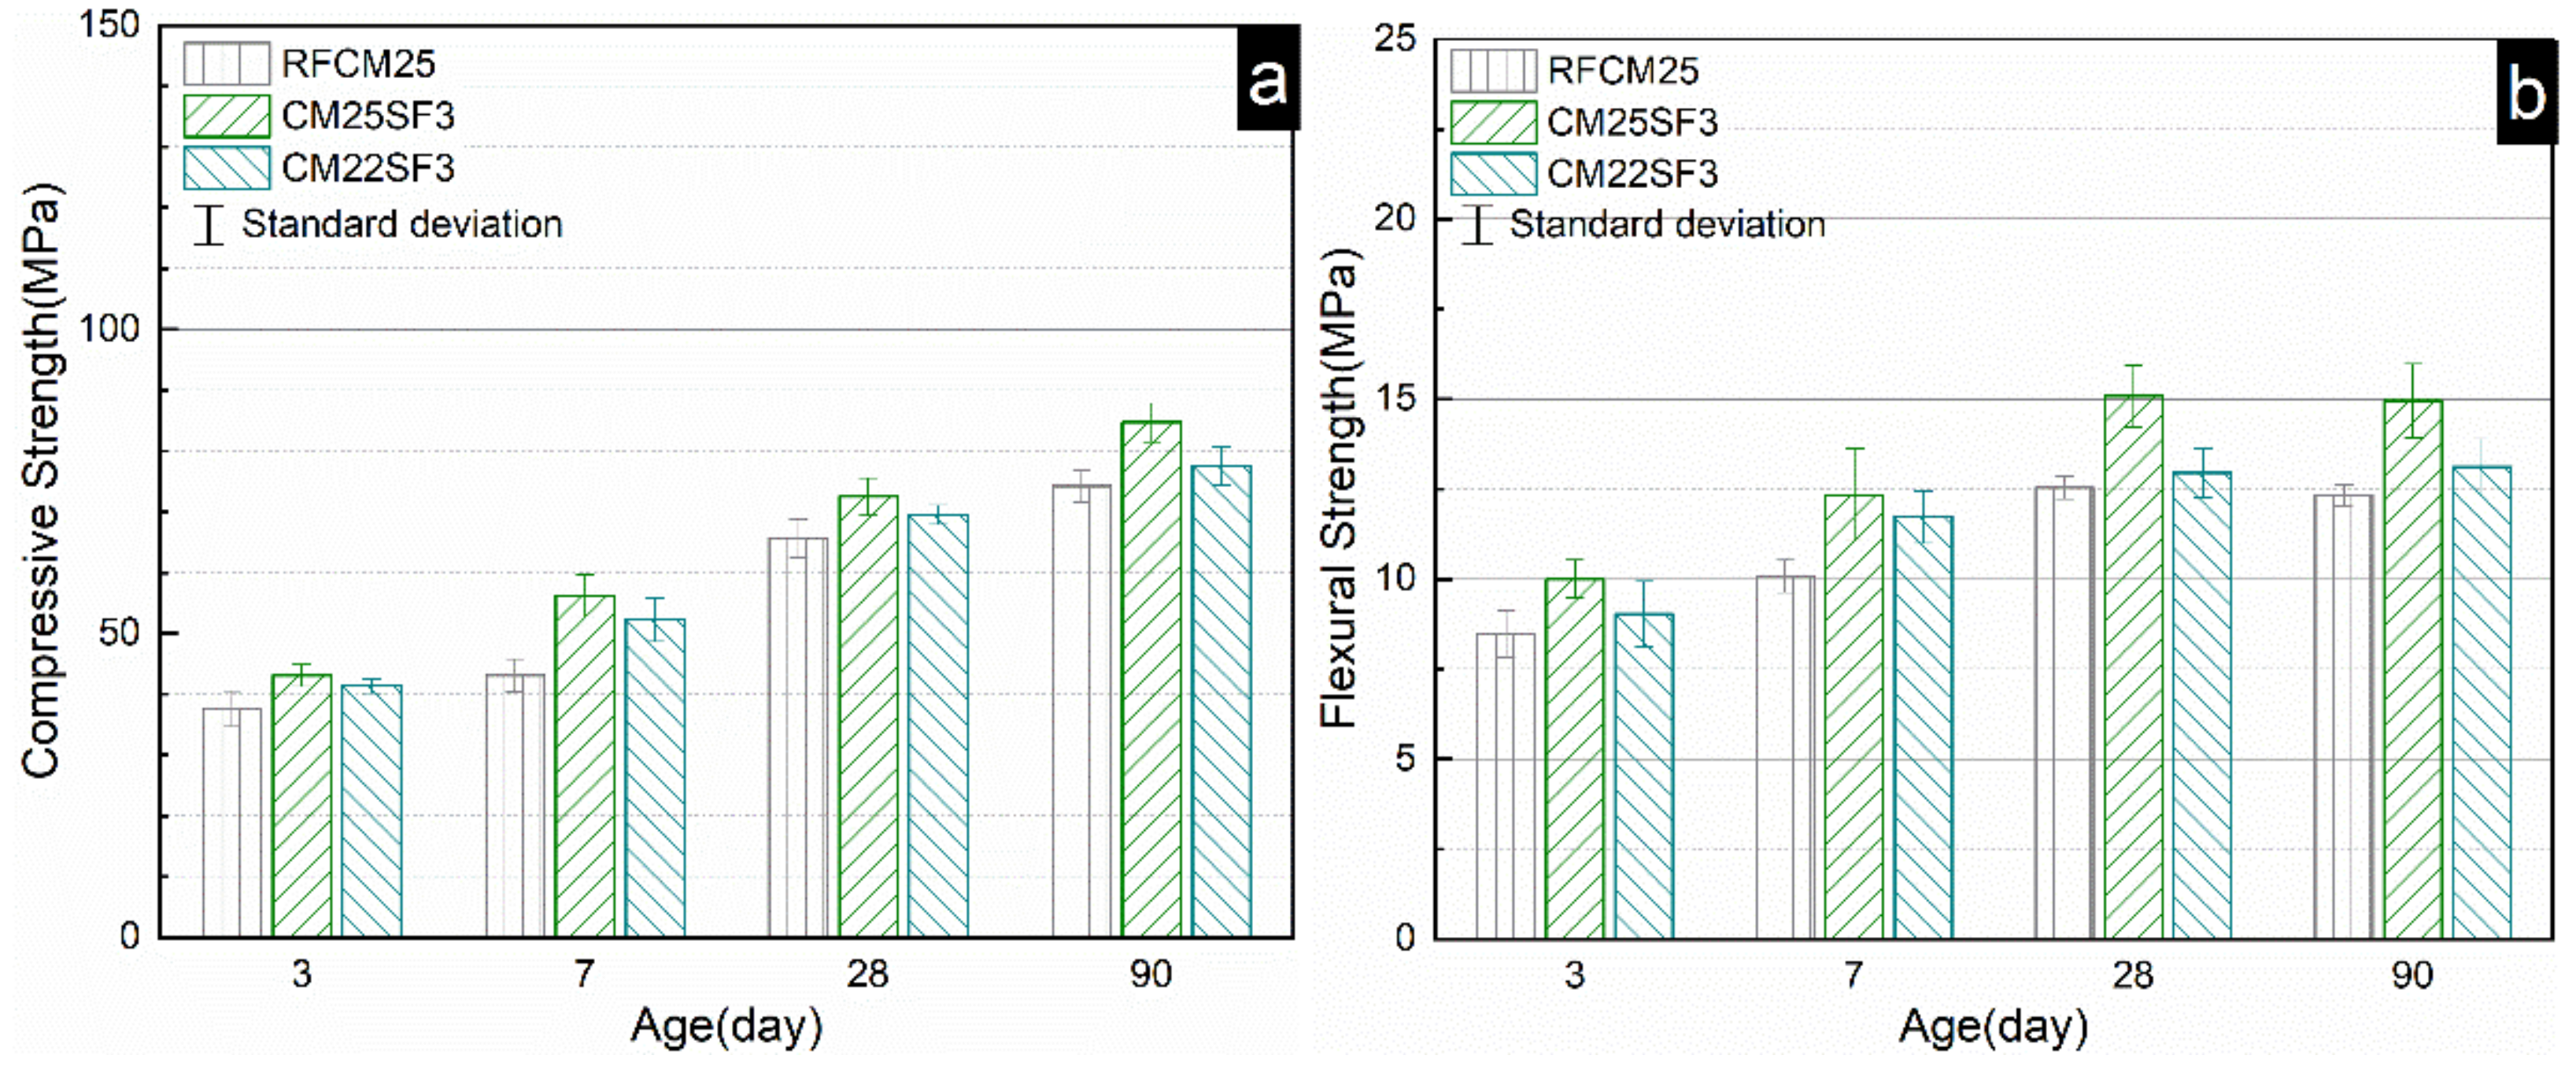
4.1.2. Effect of Silica Fume and Steel Fiber
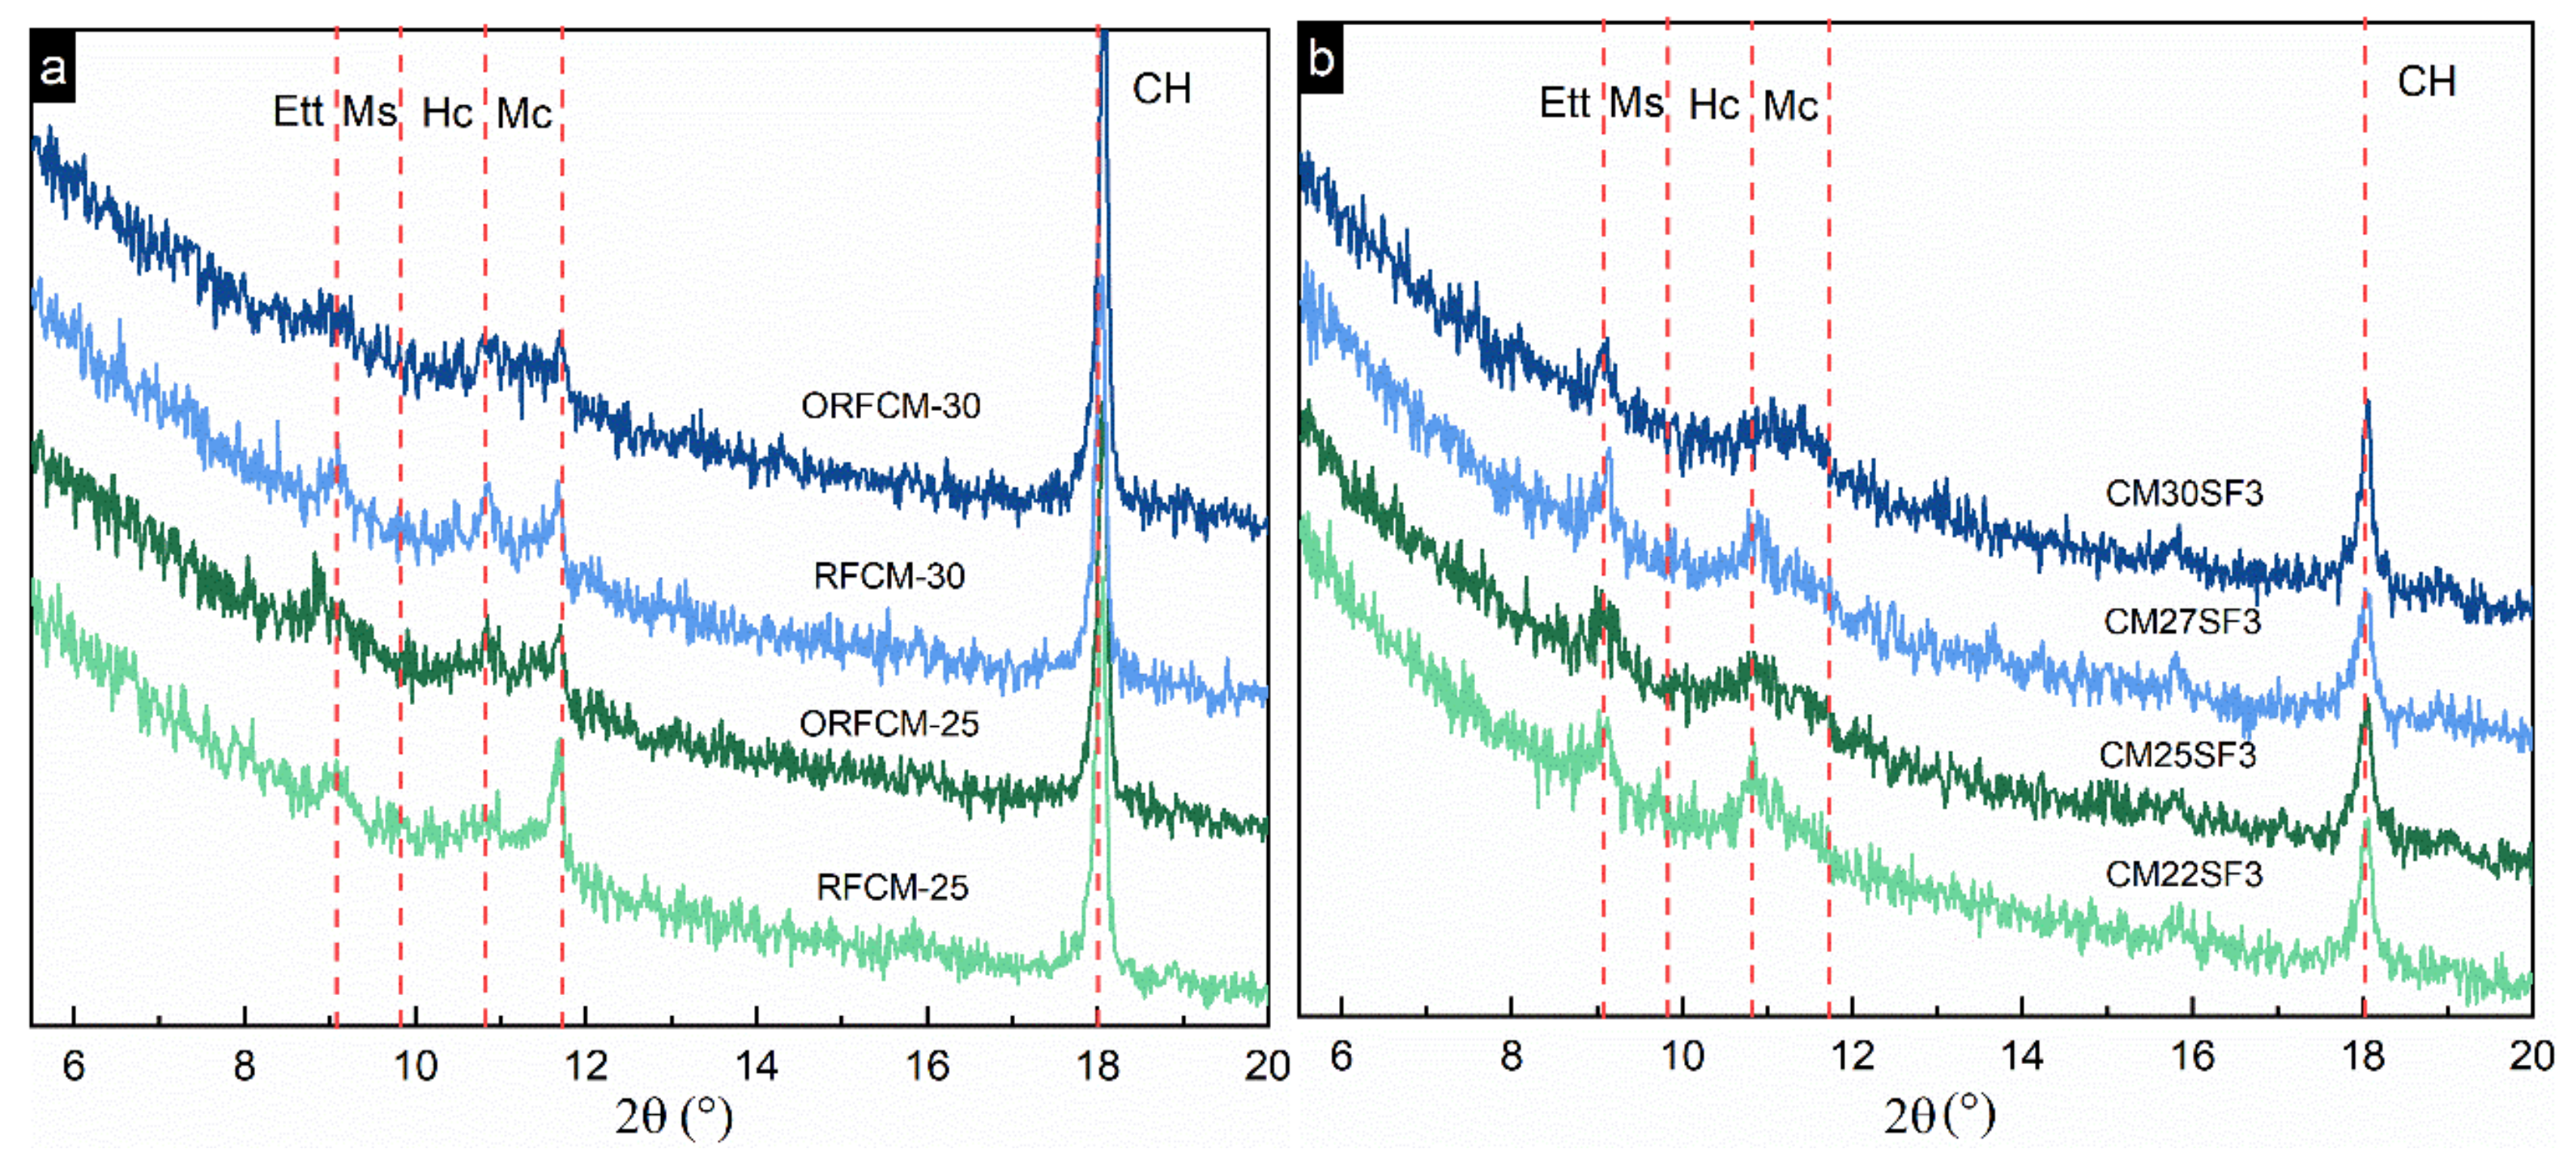
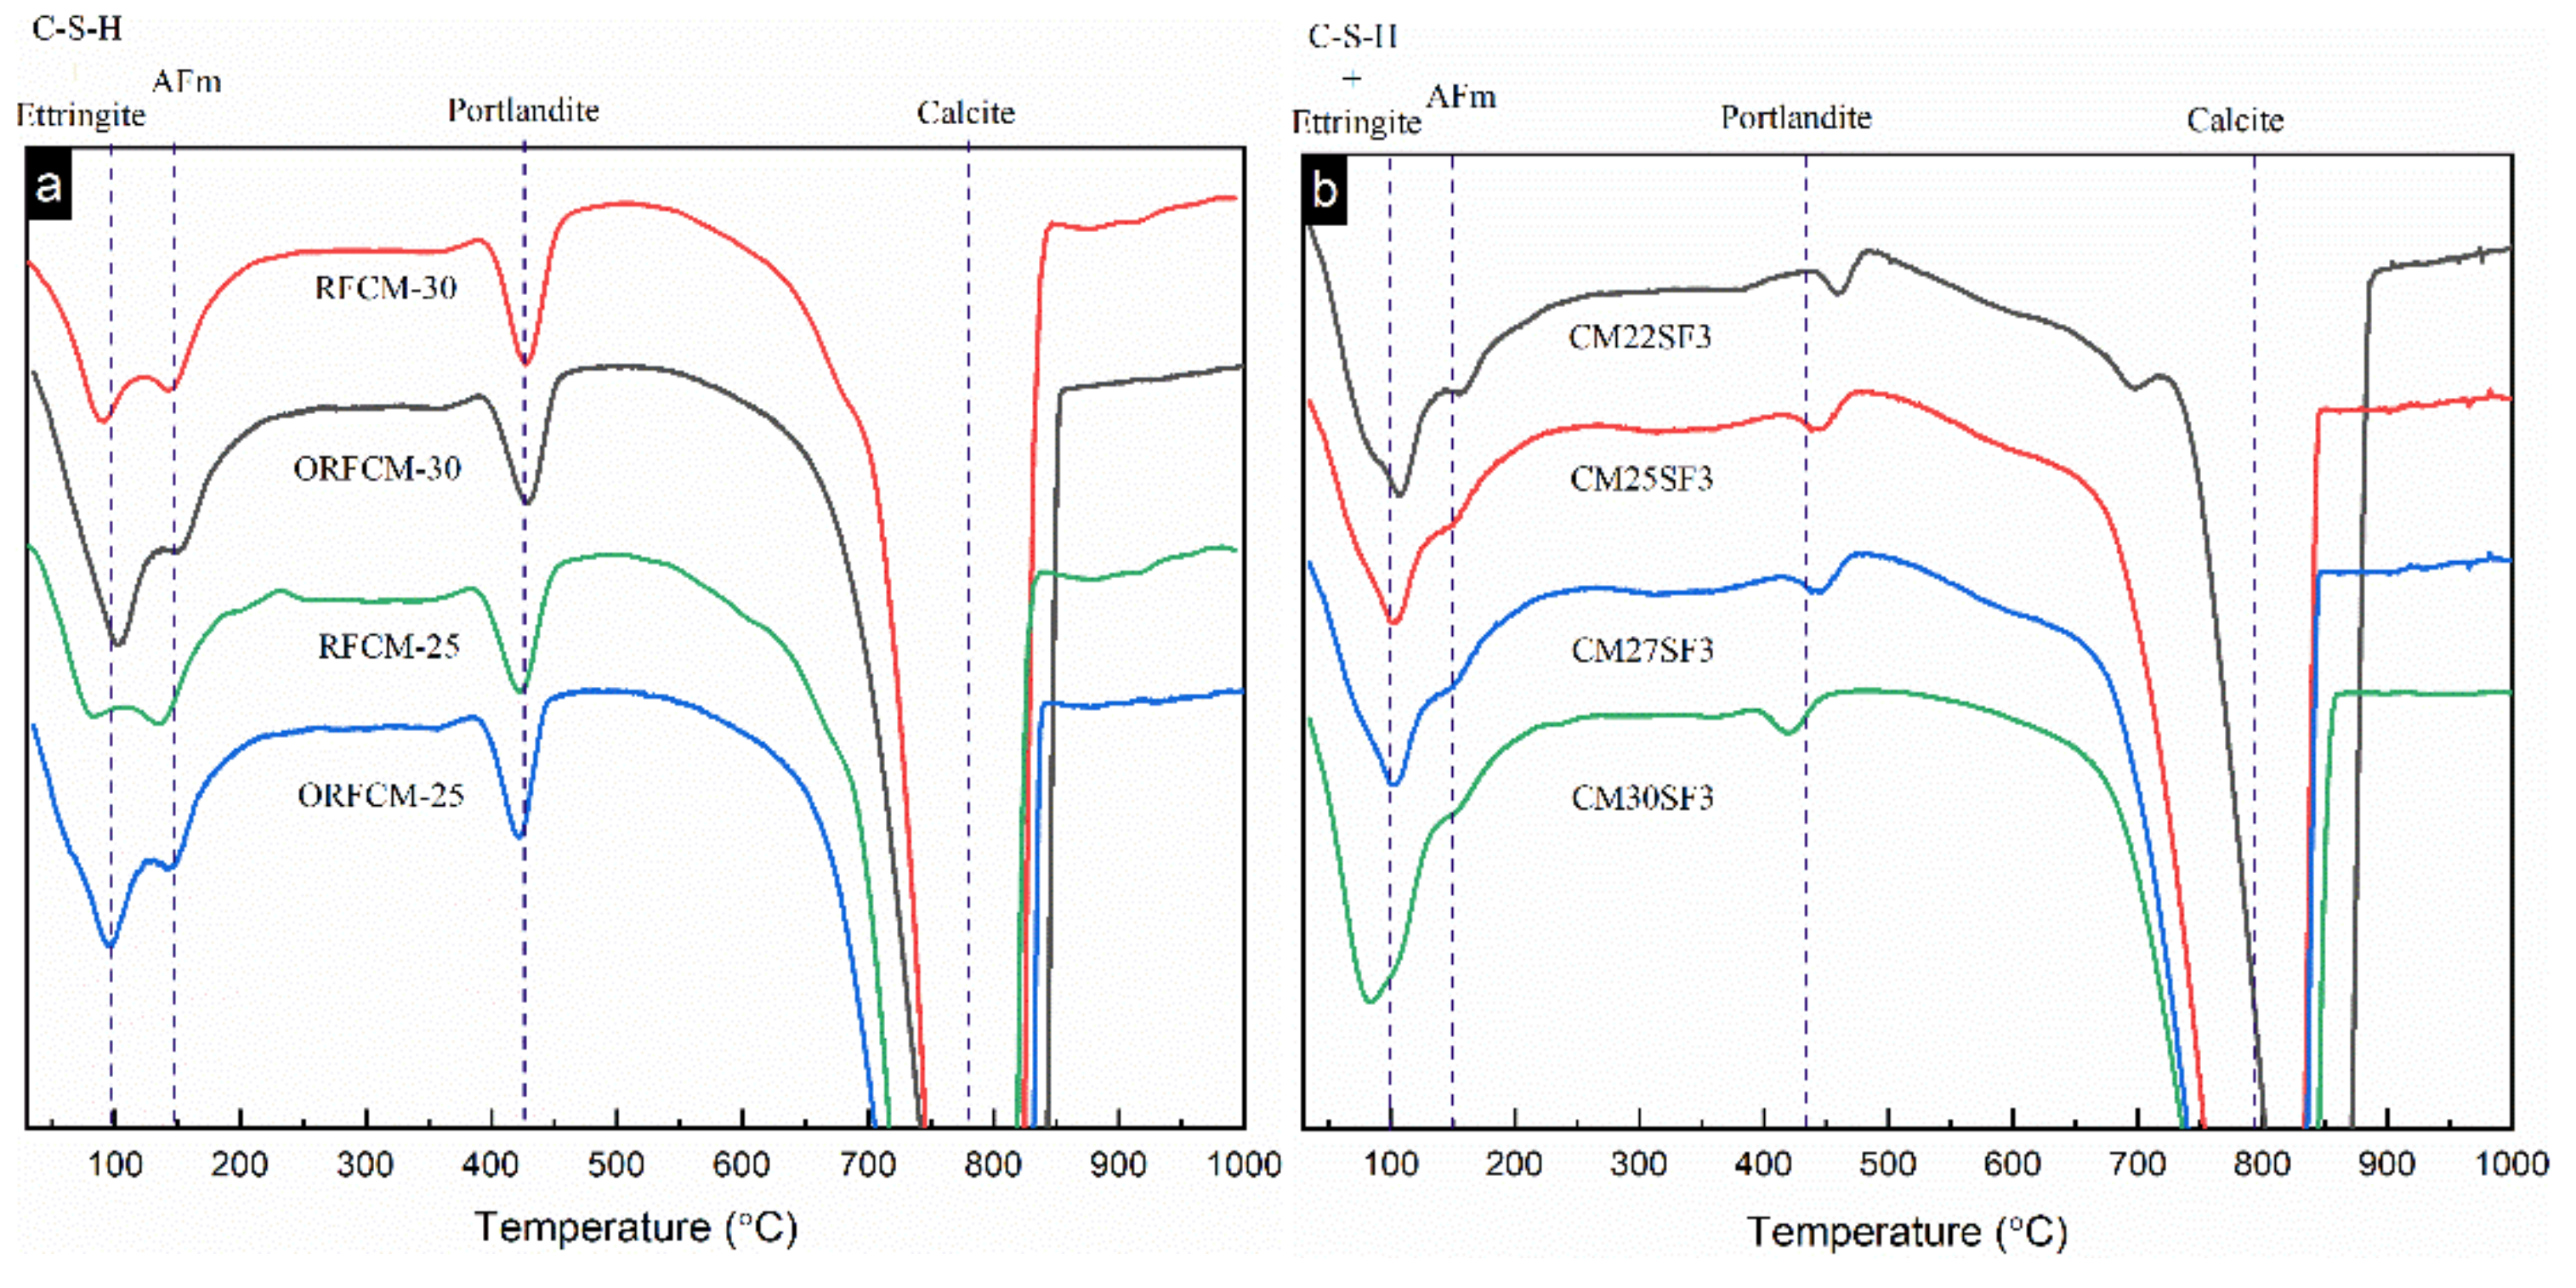
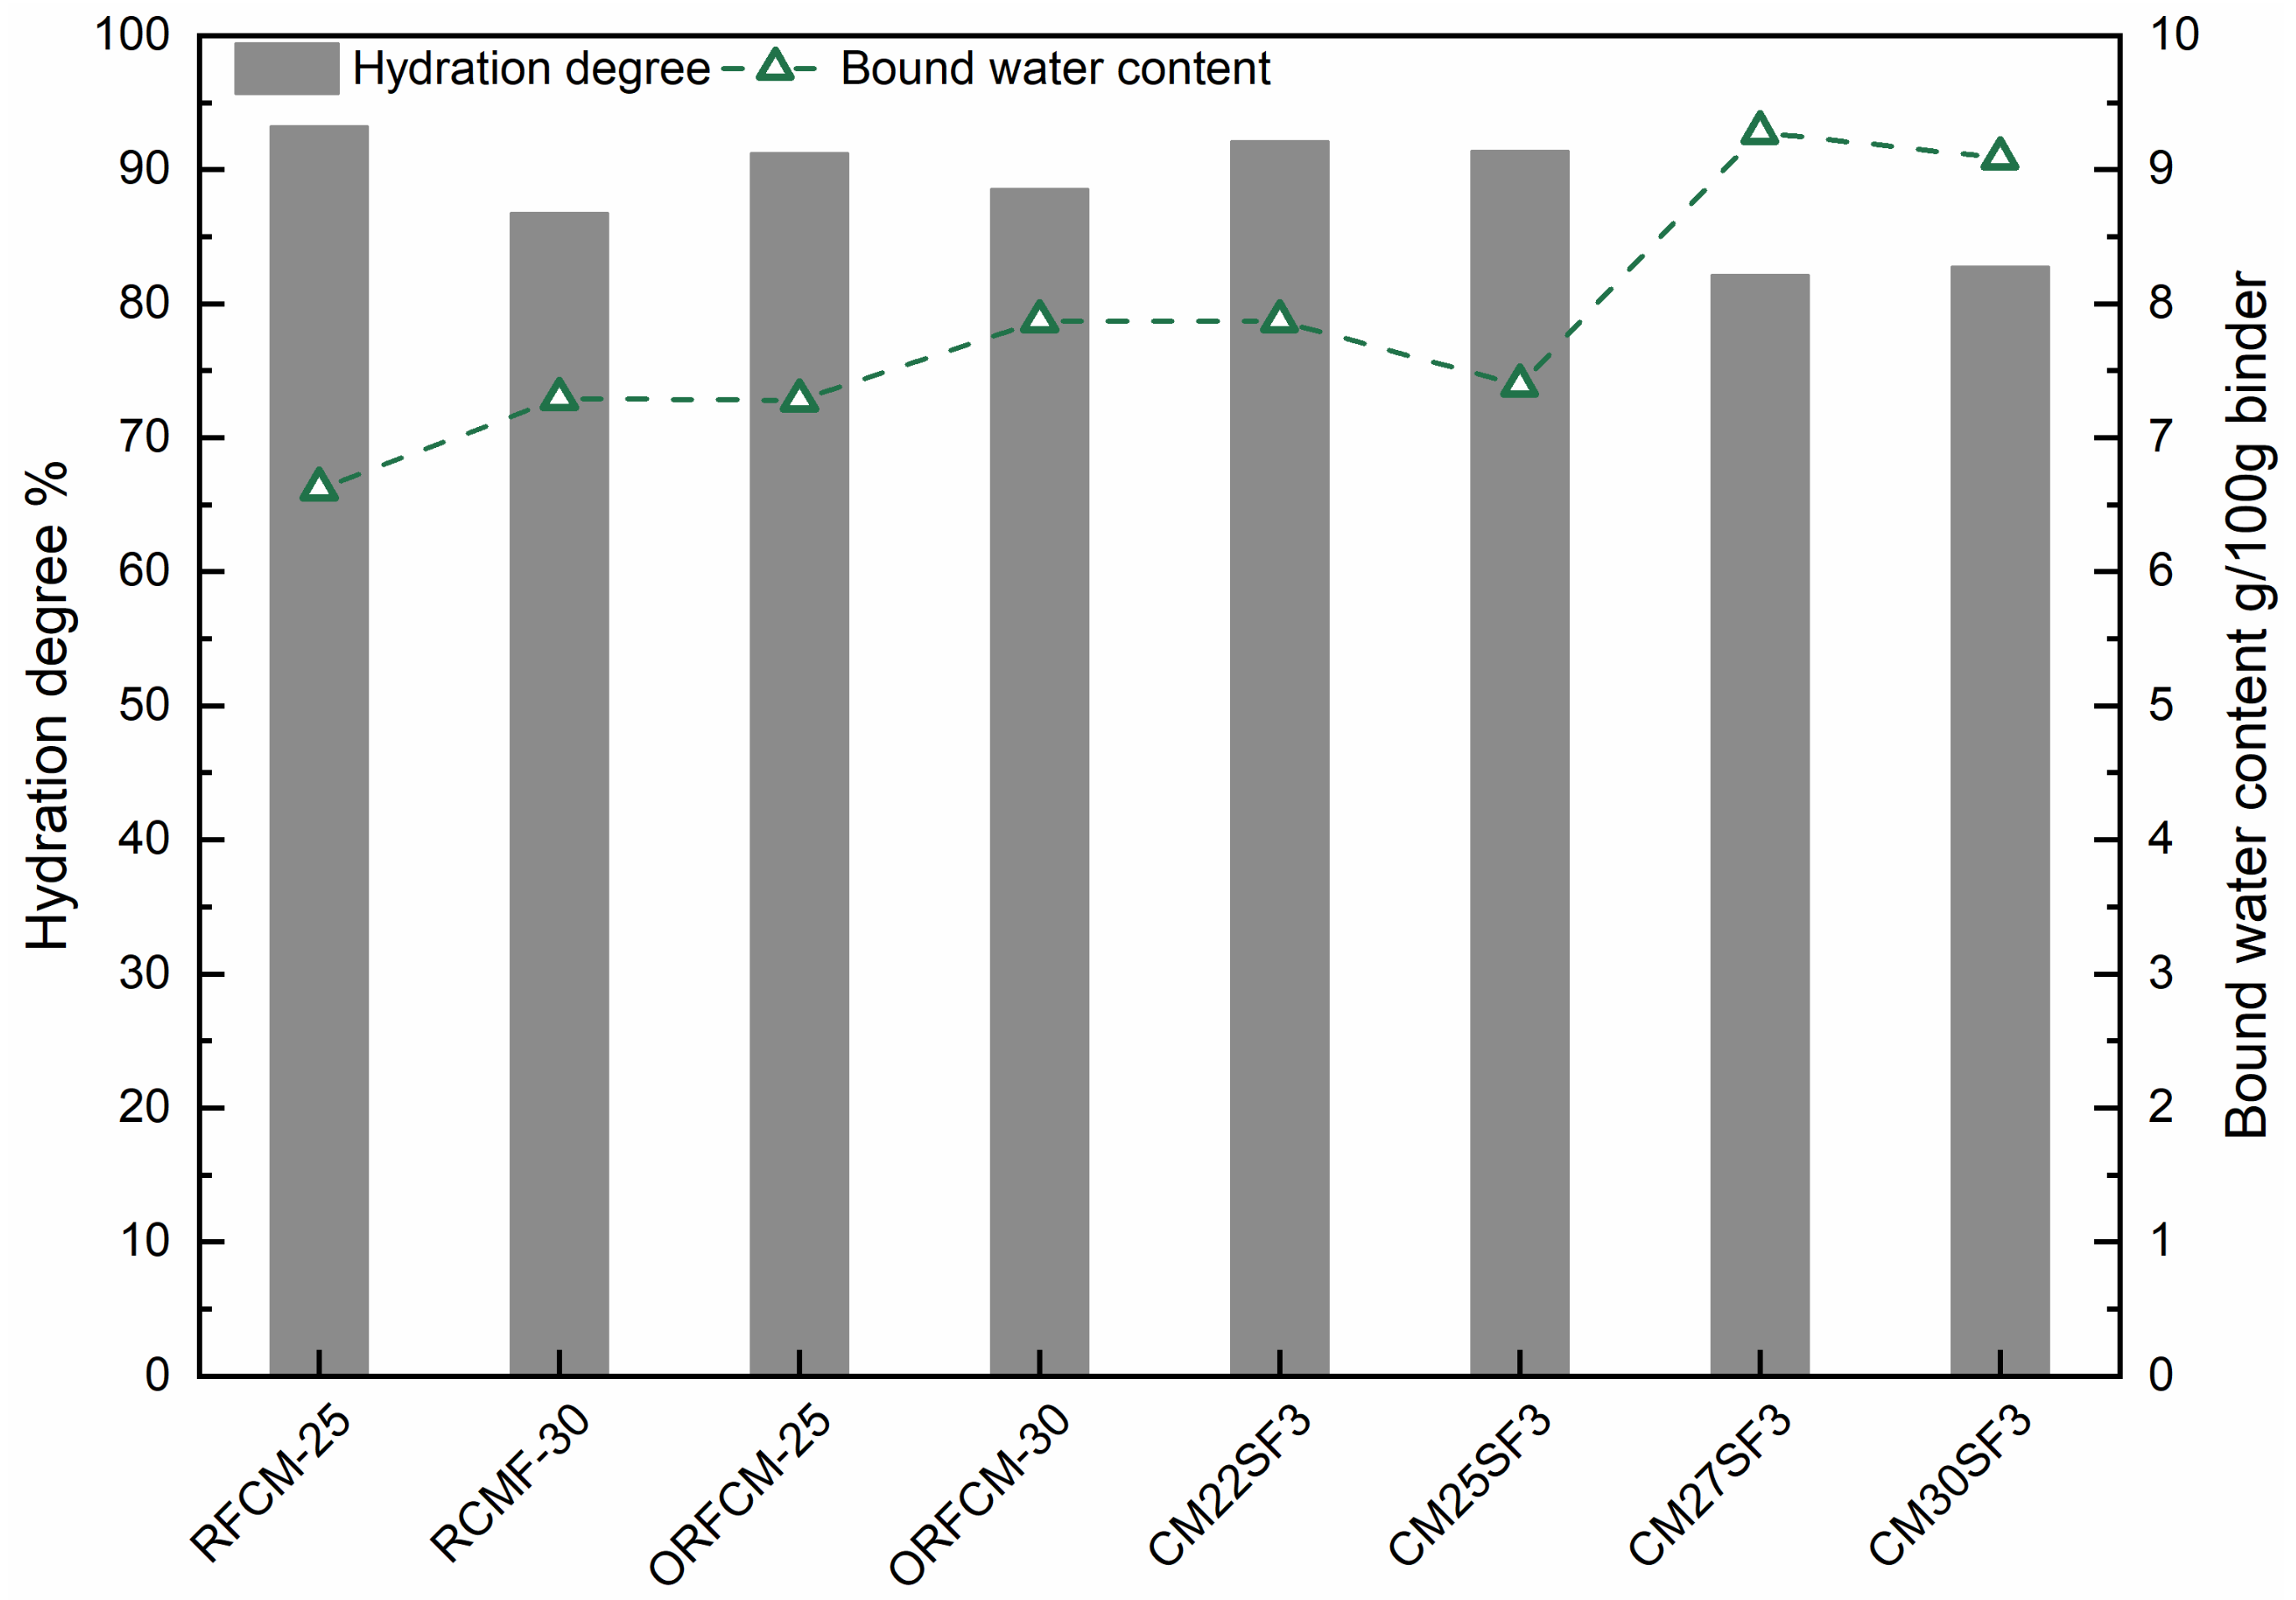
4.2. Hydration Degree
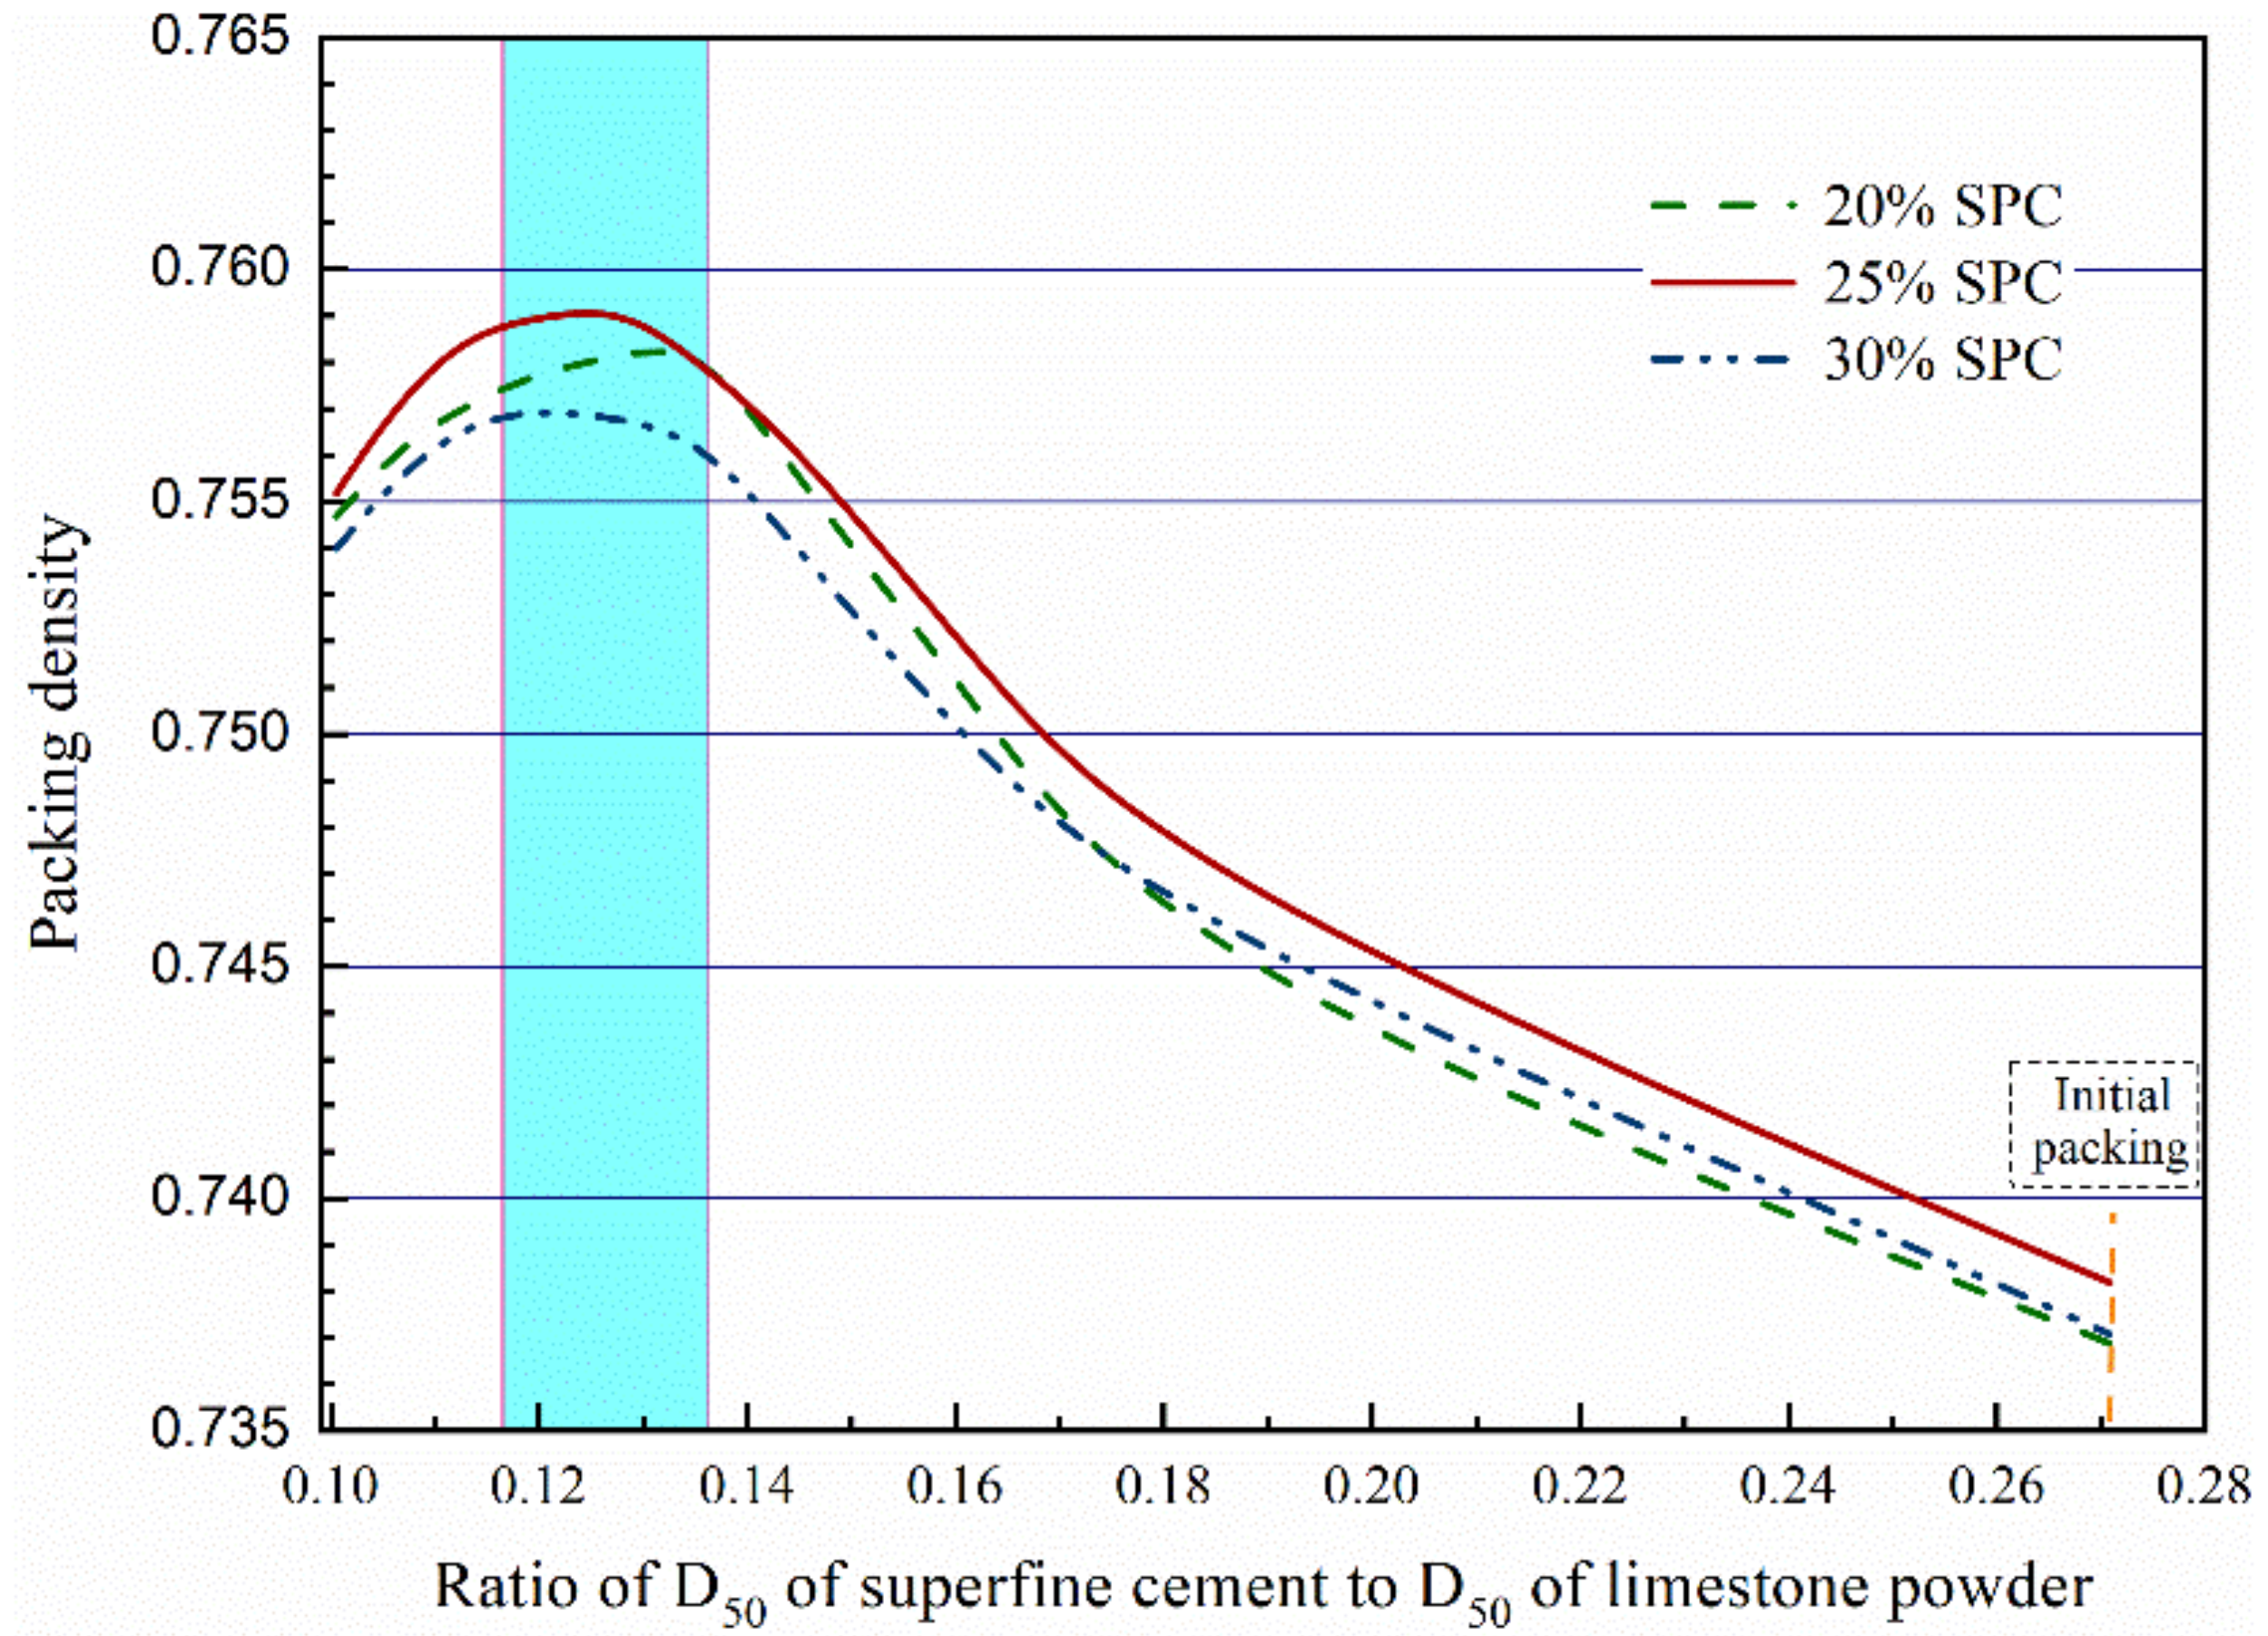
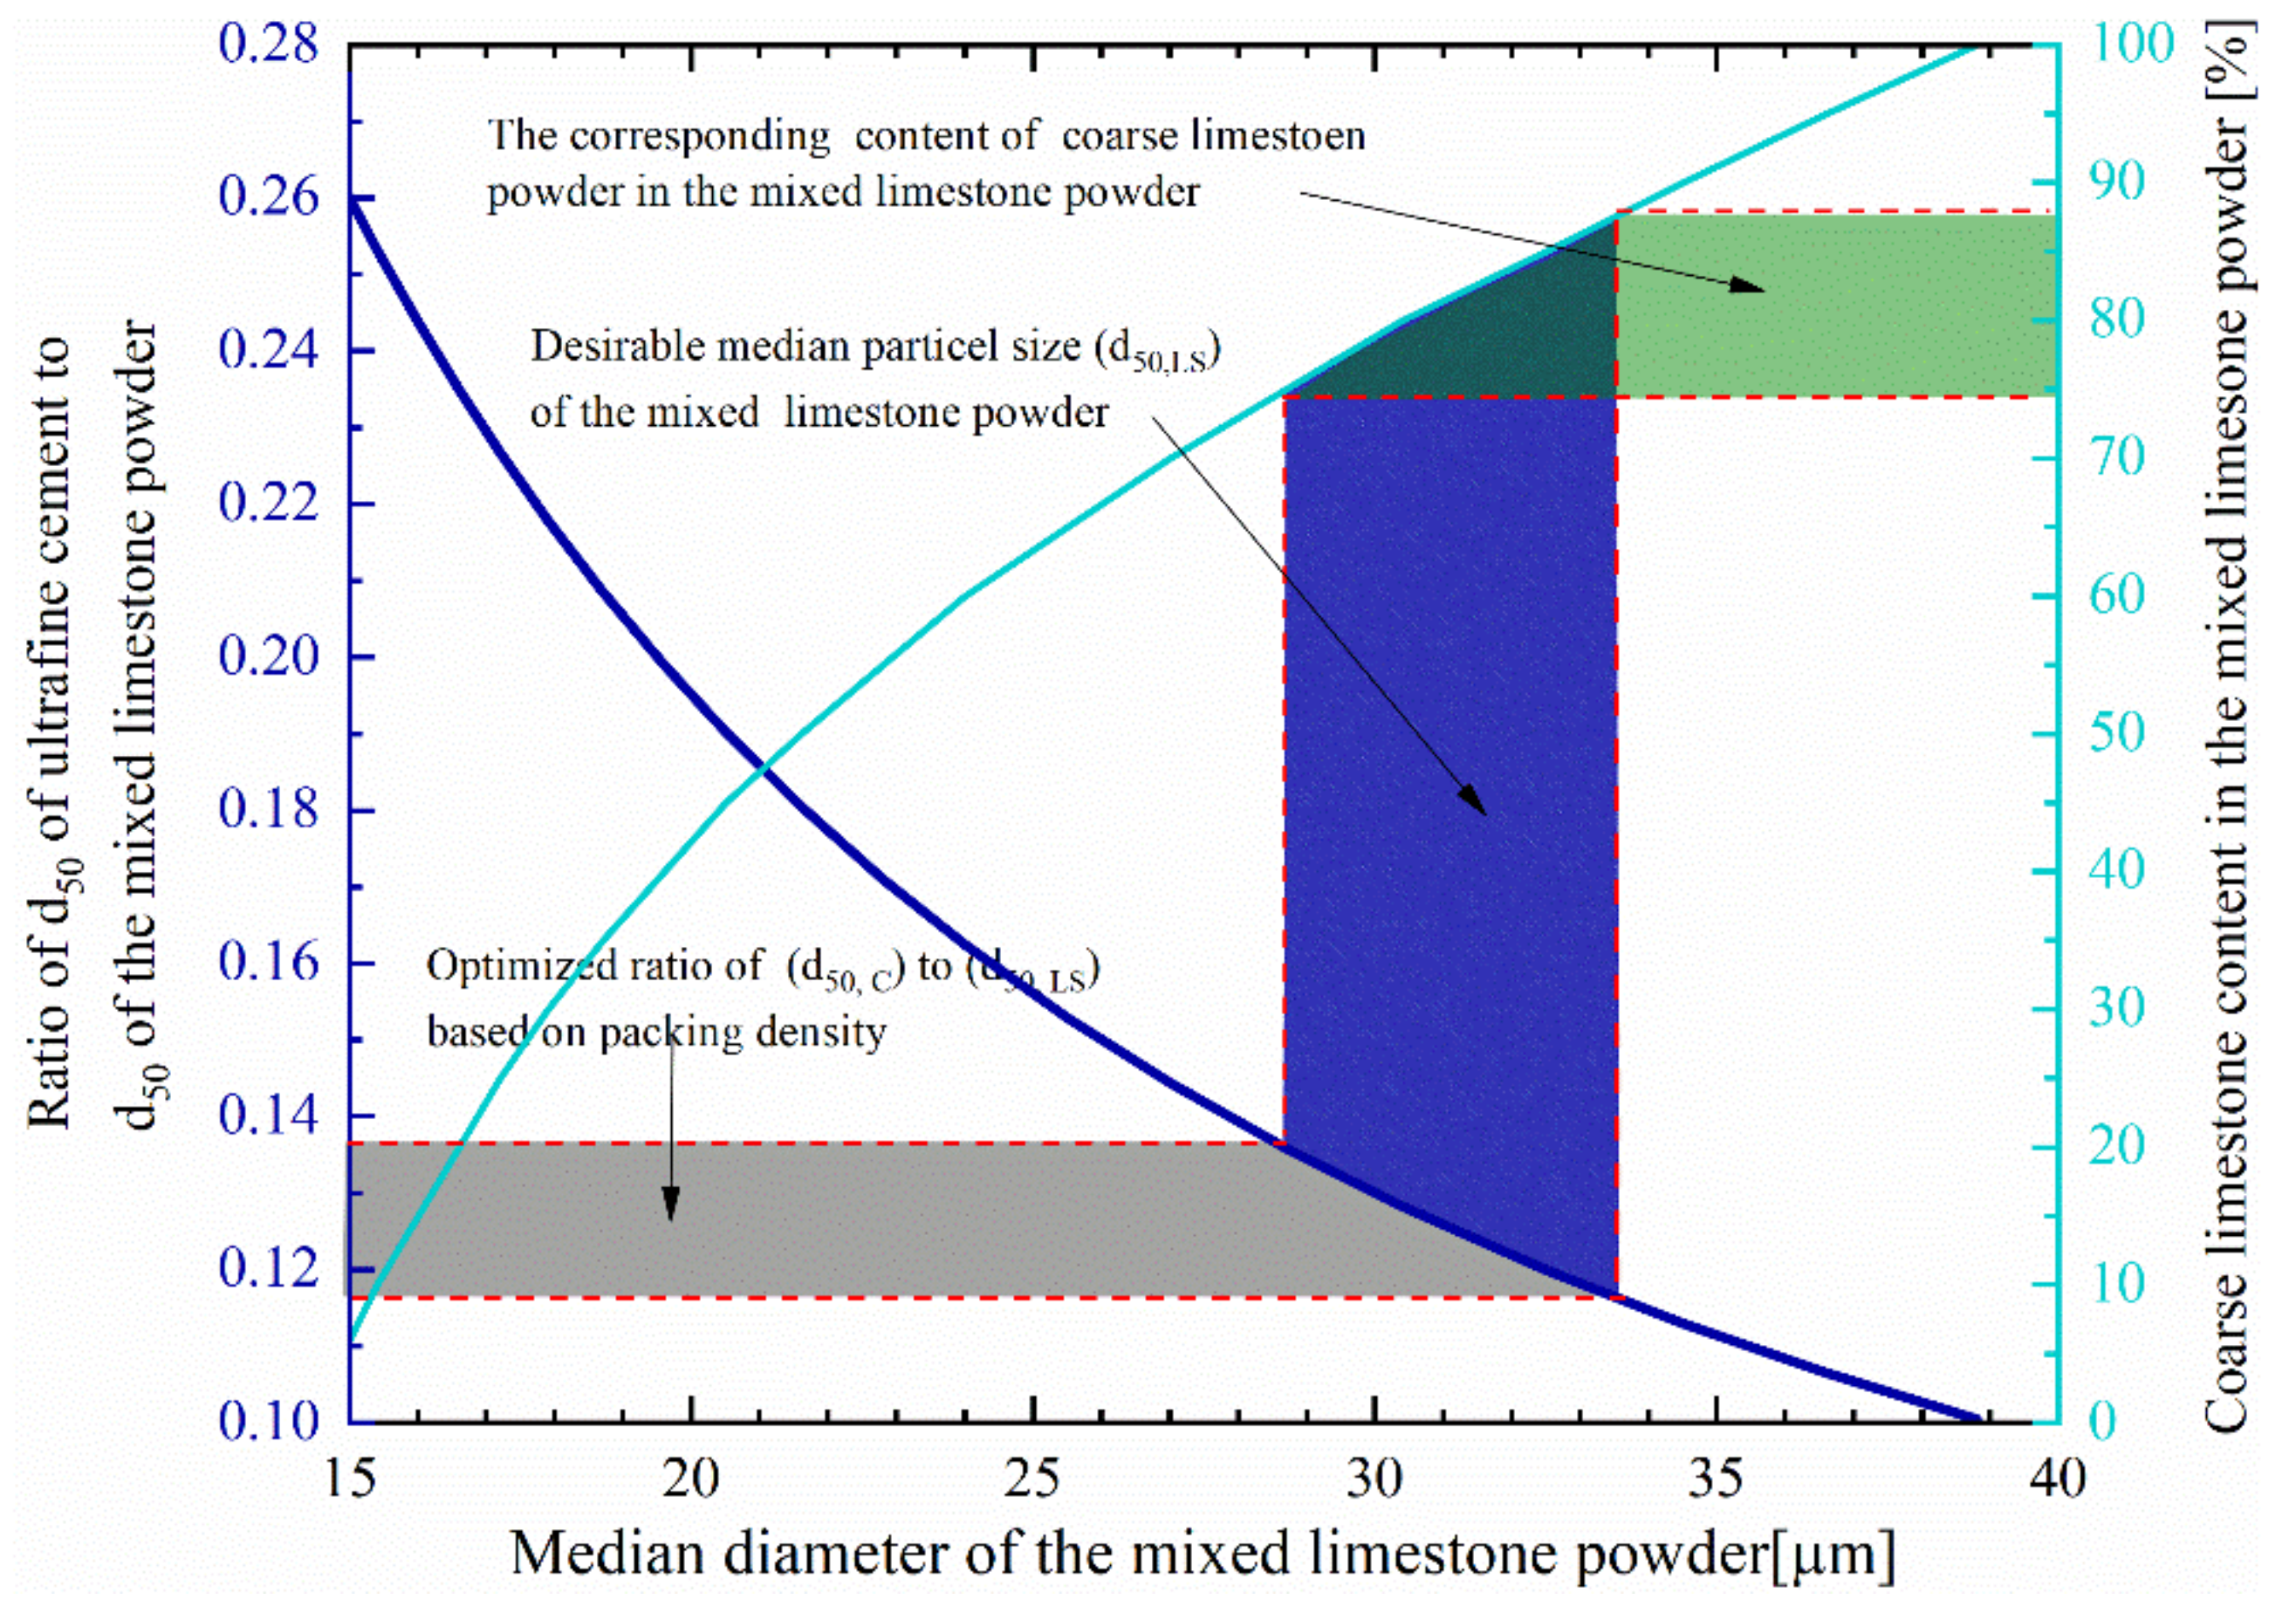
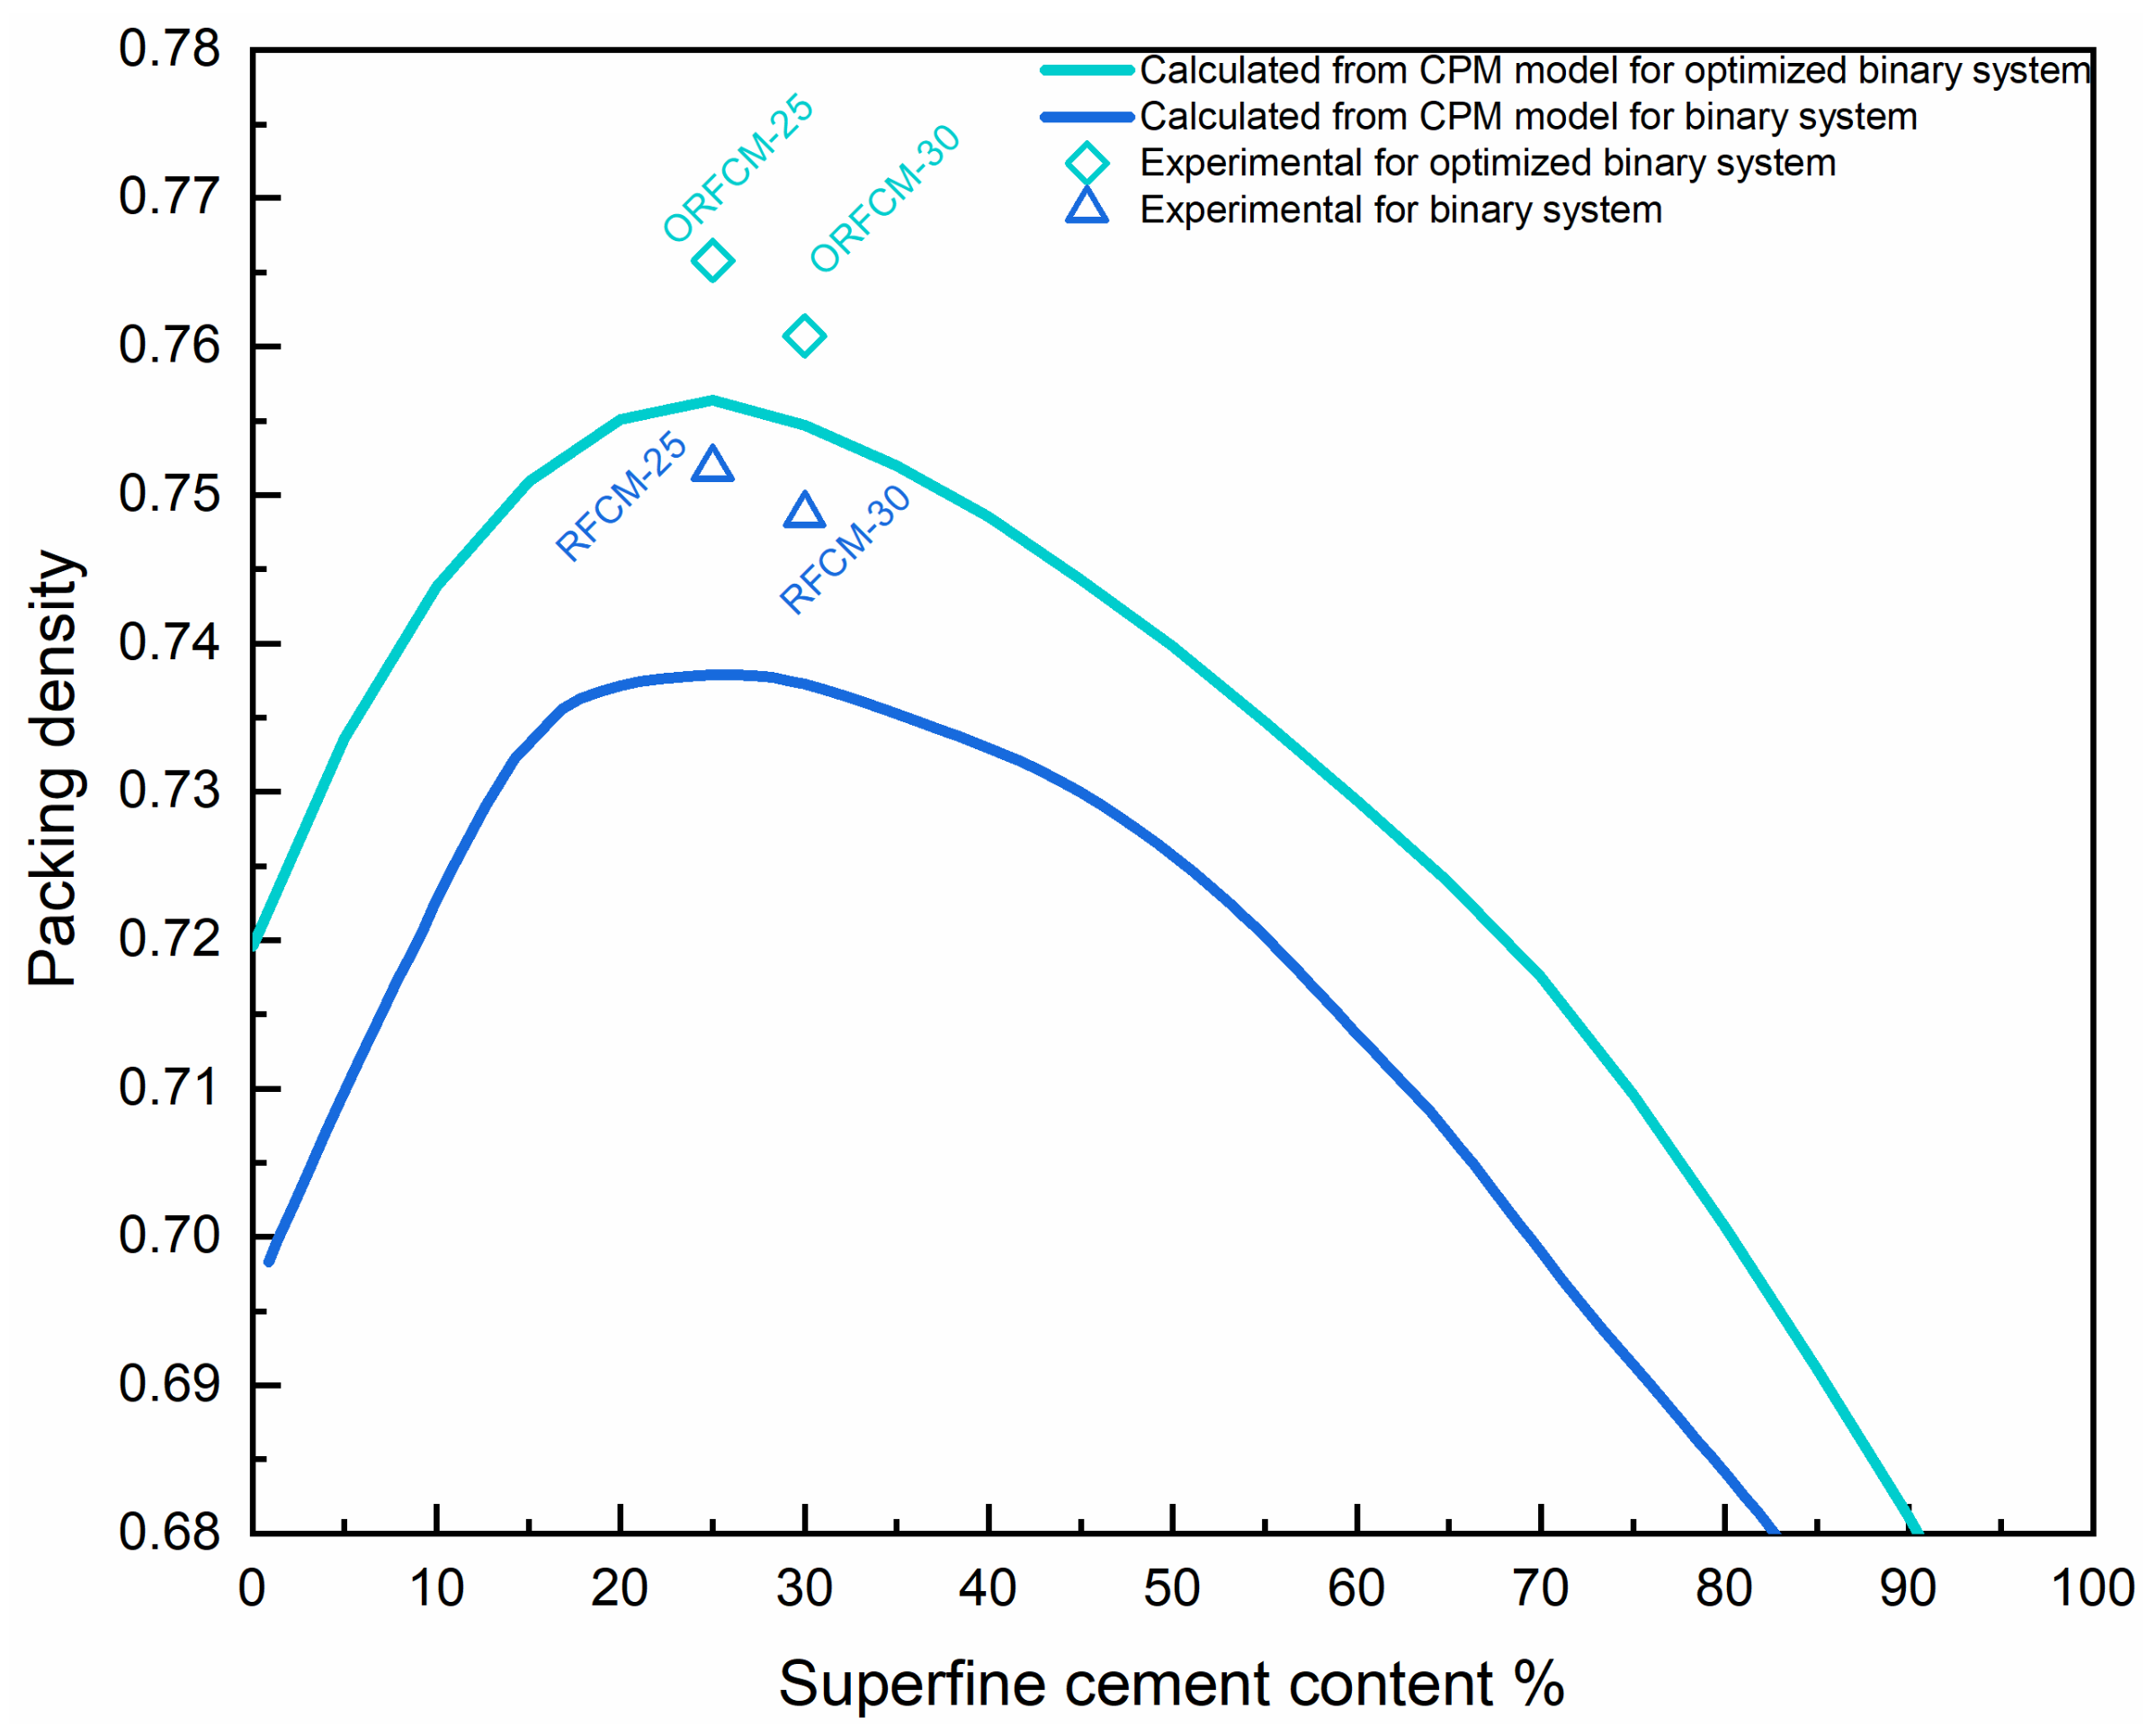
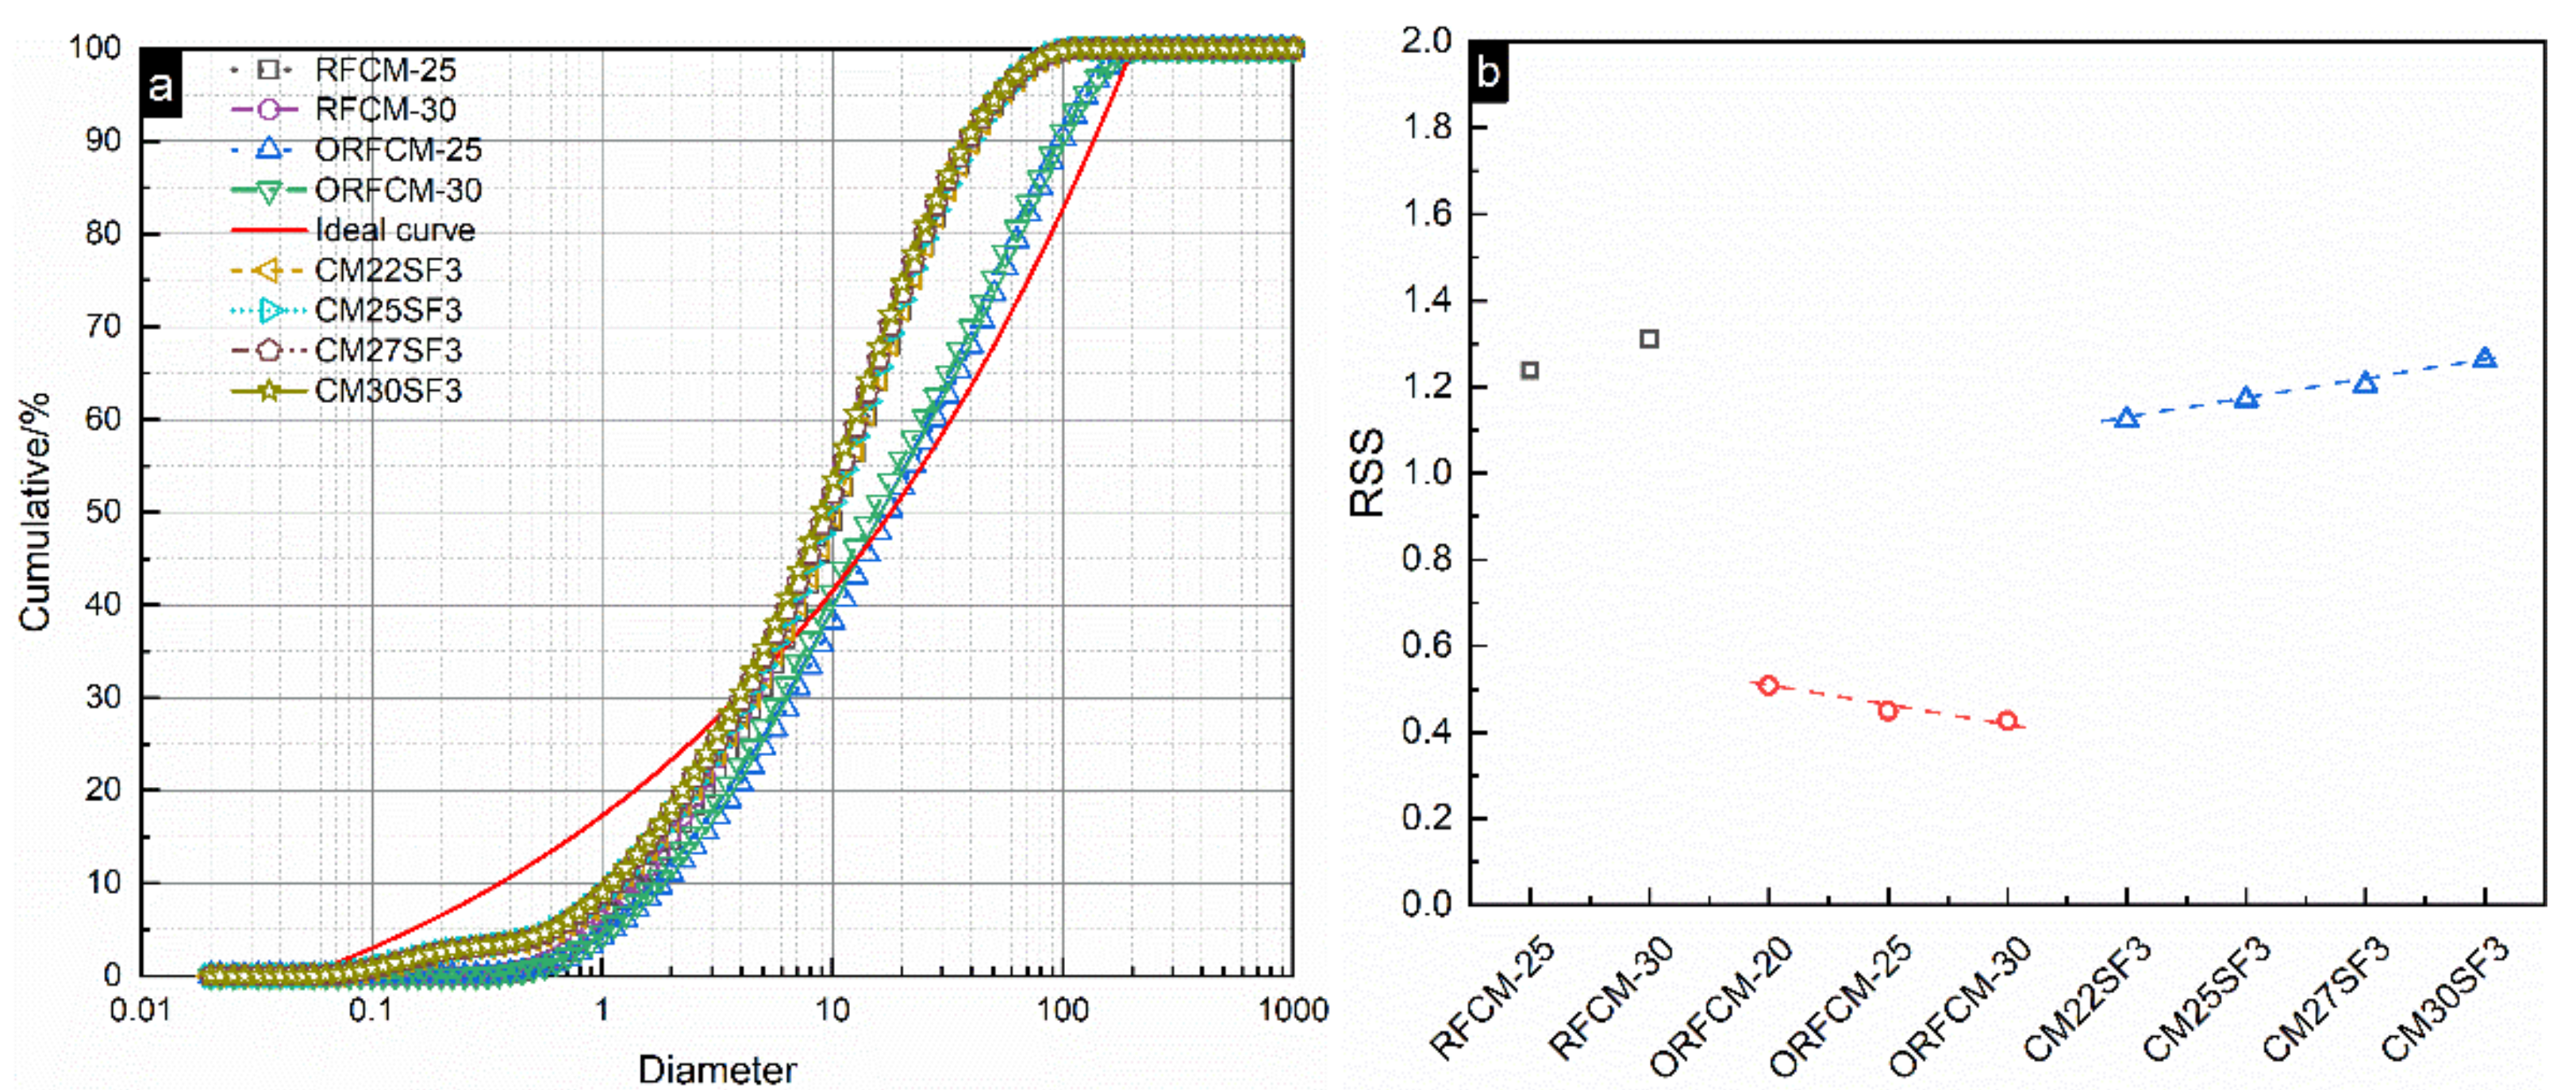
4.3. Packing Density and Its Correlation with Mechanical Property
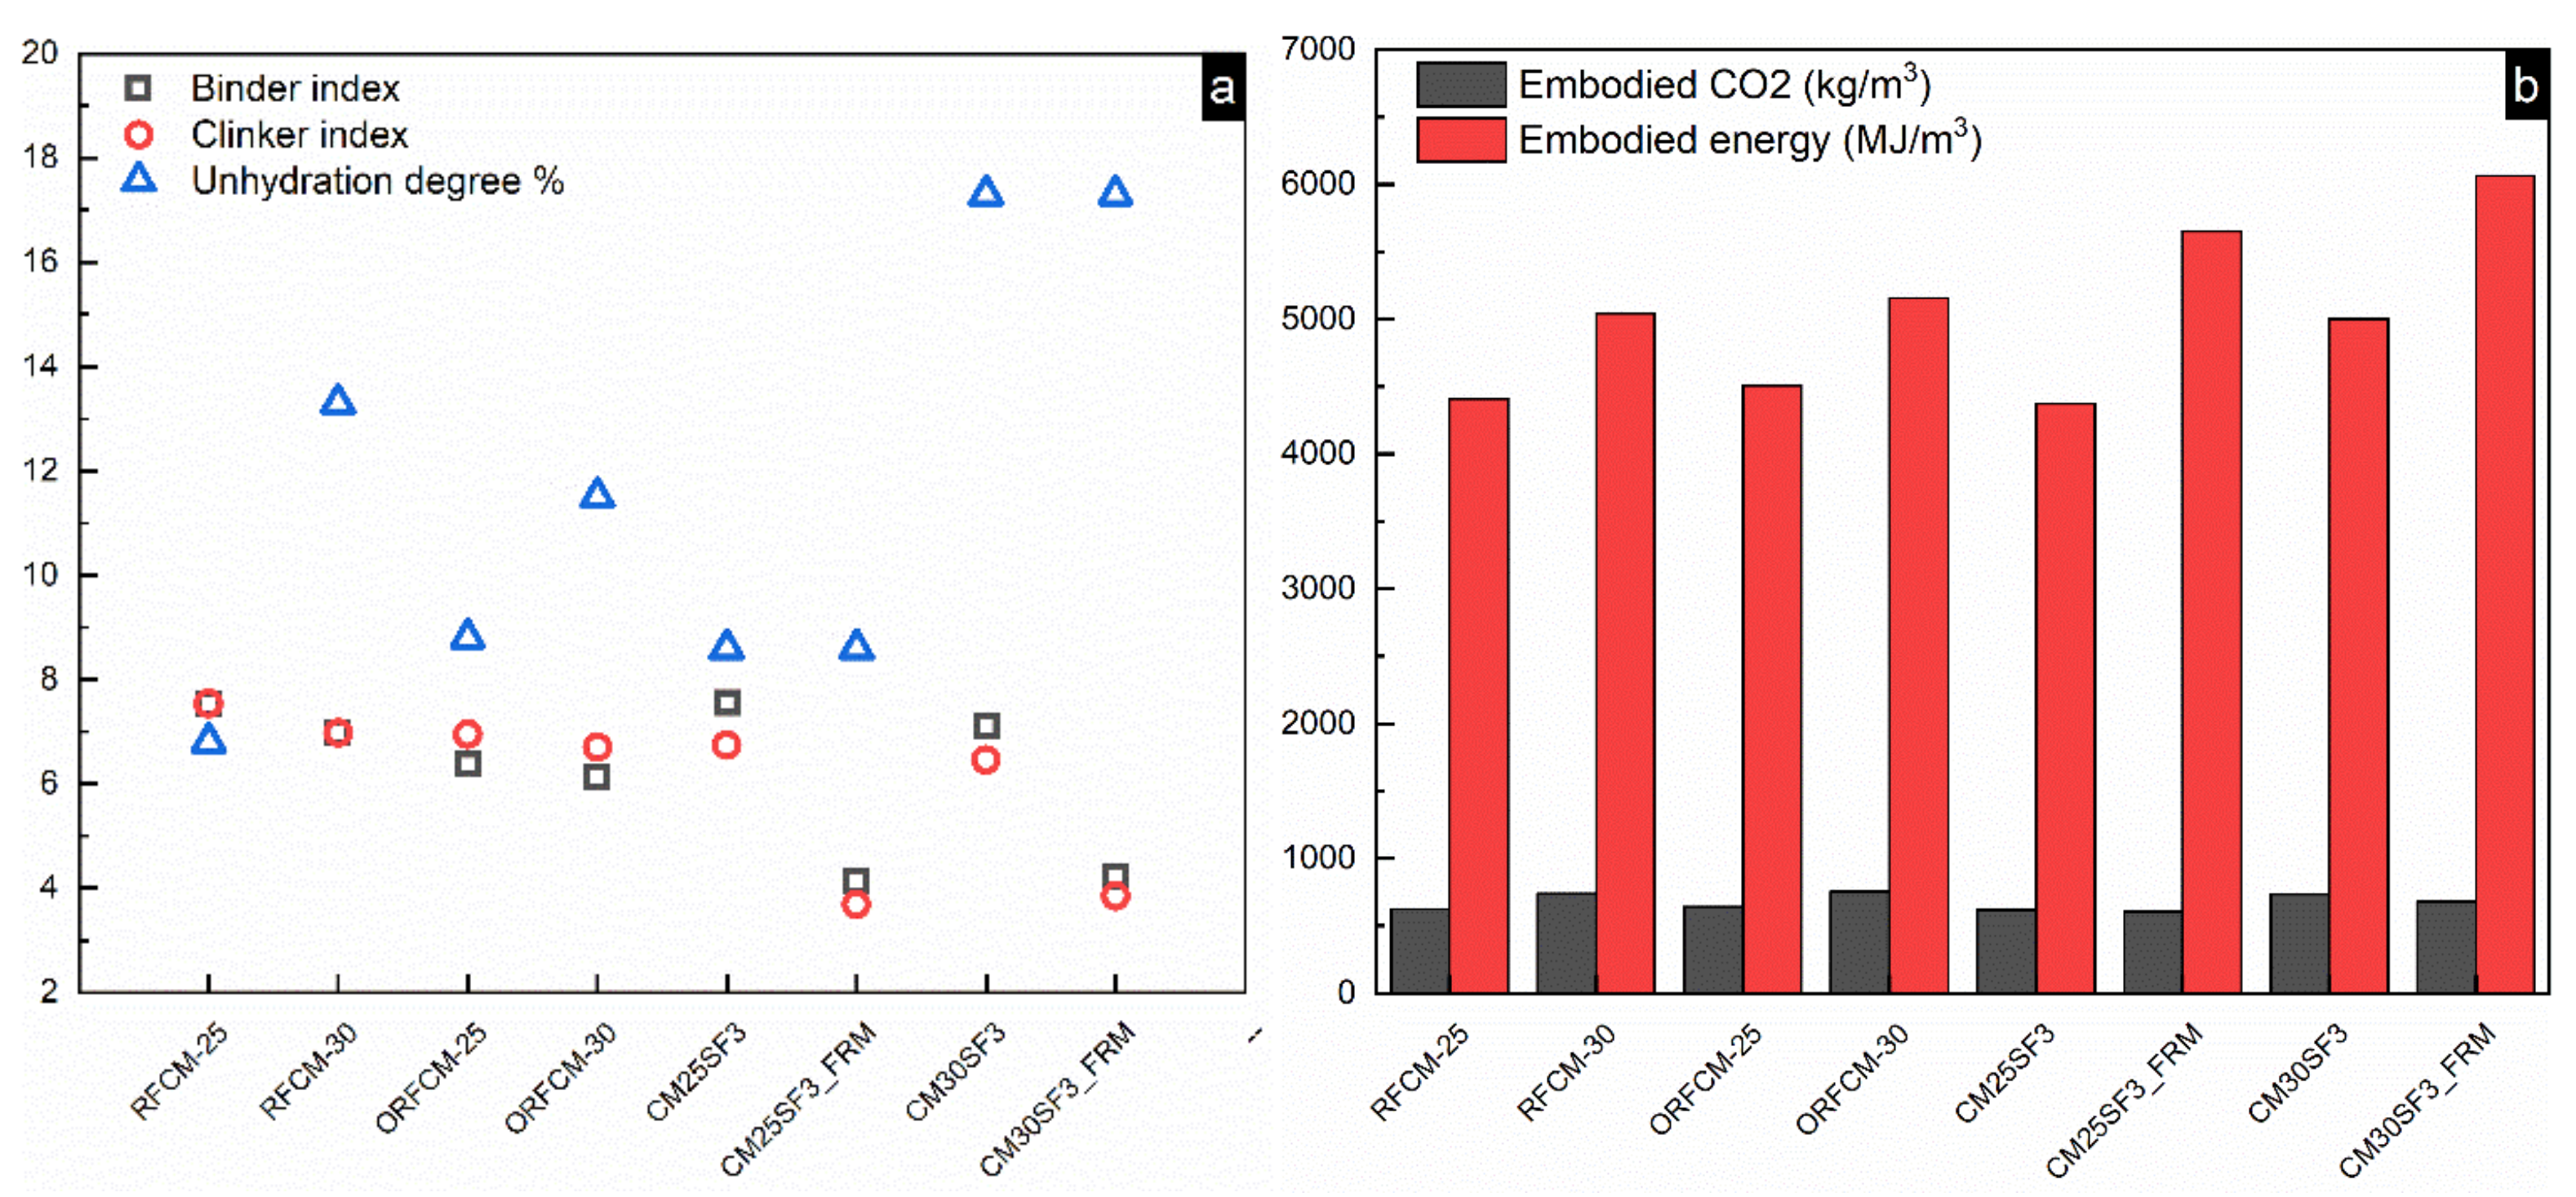
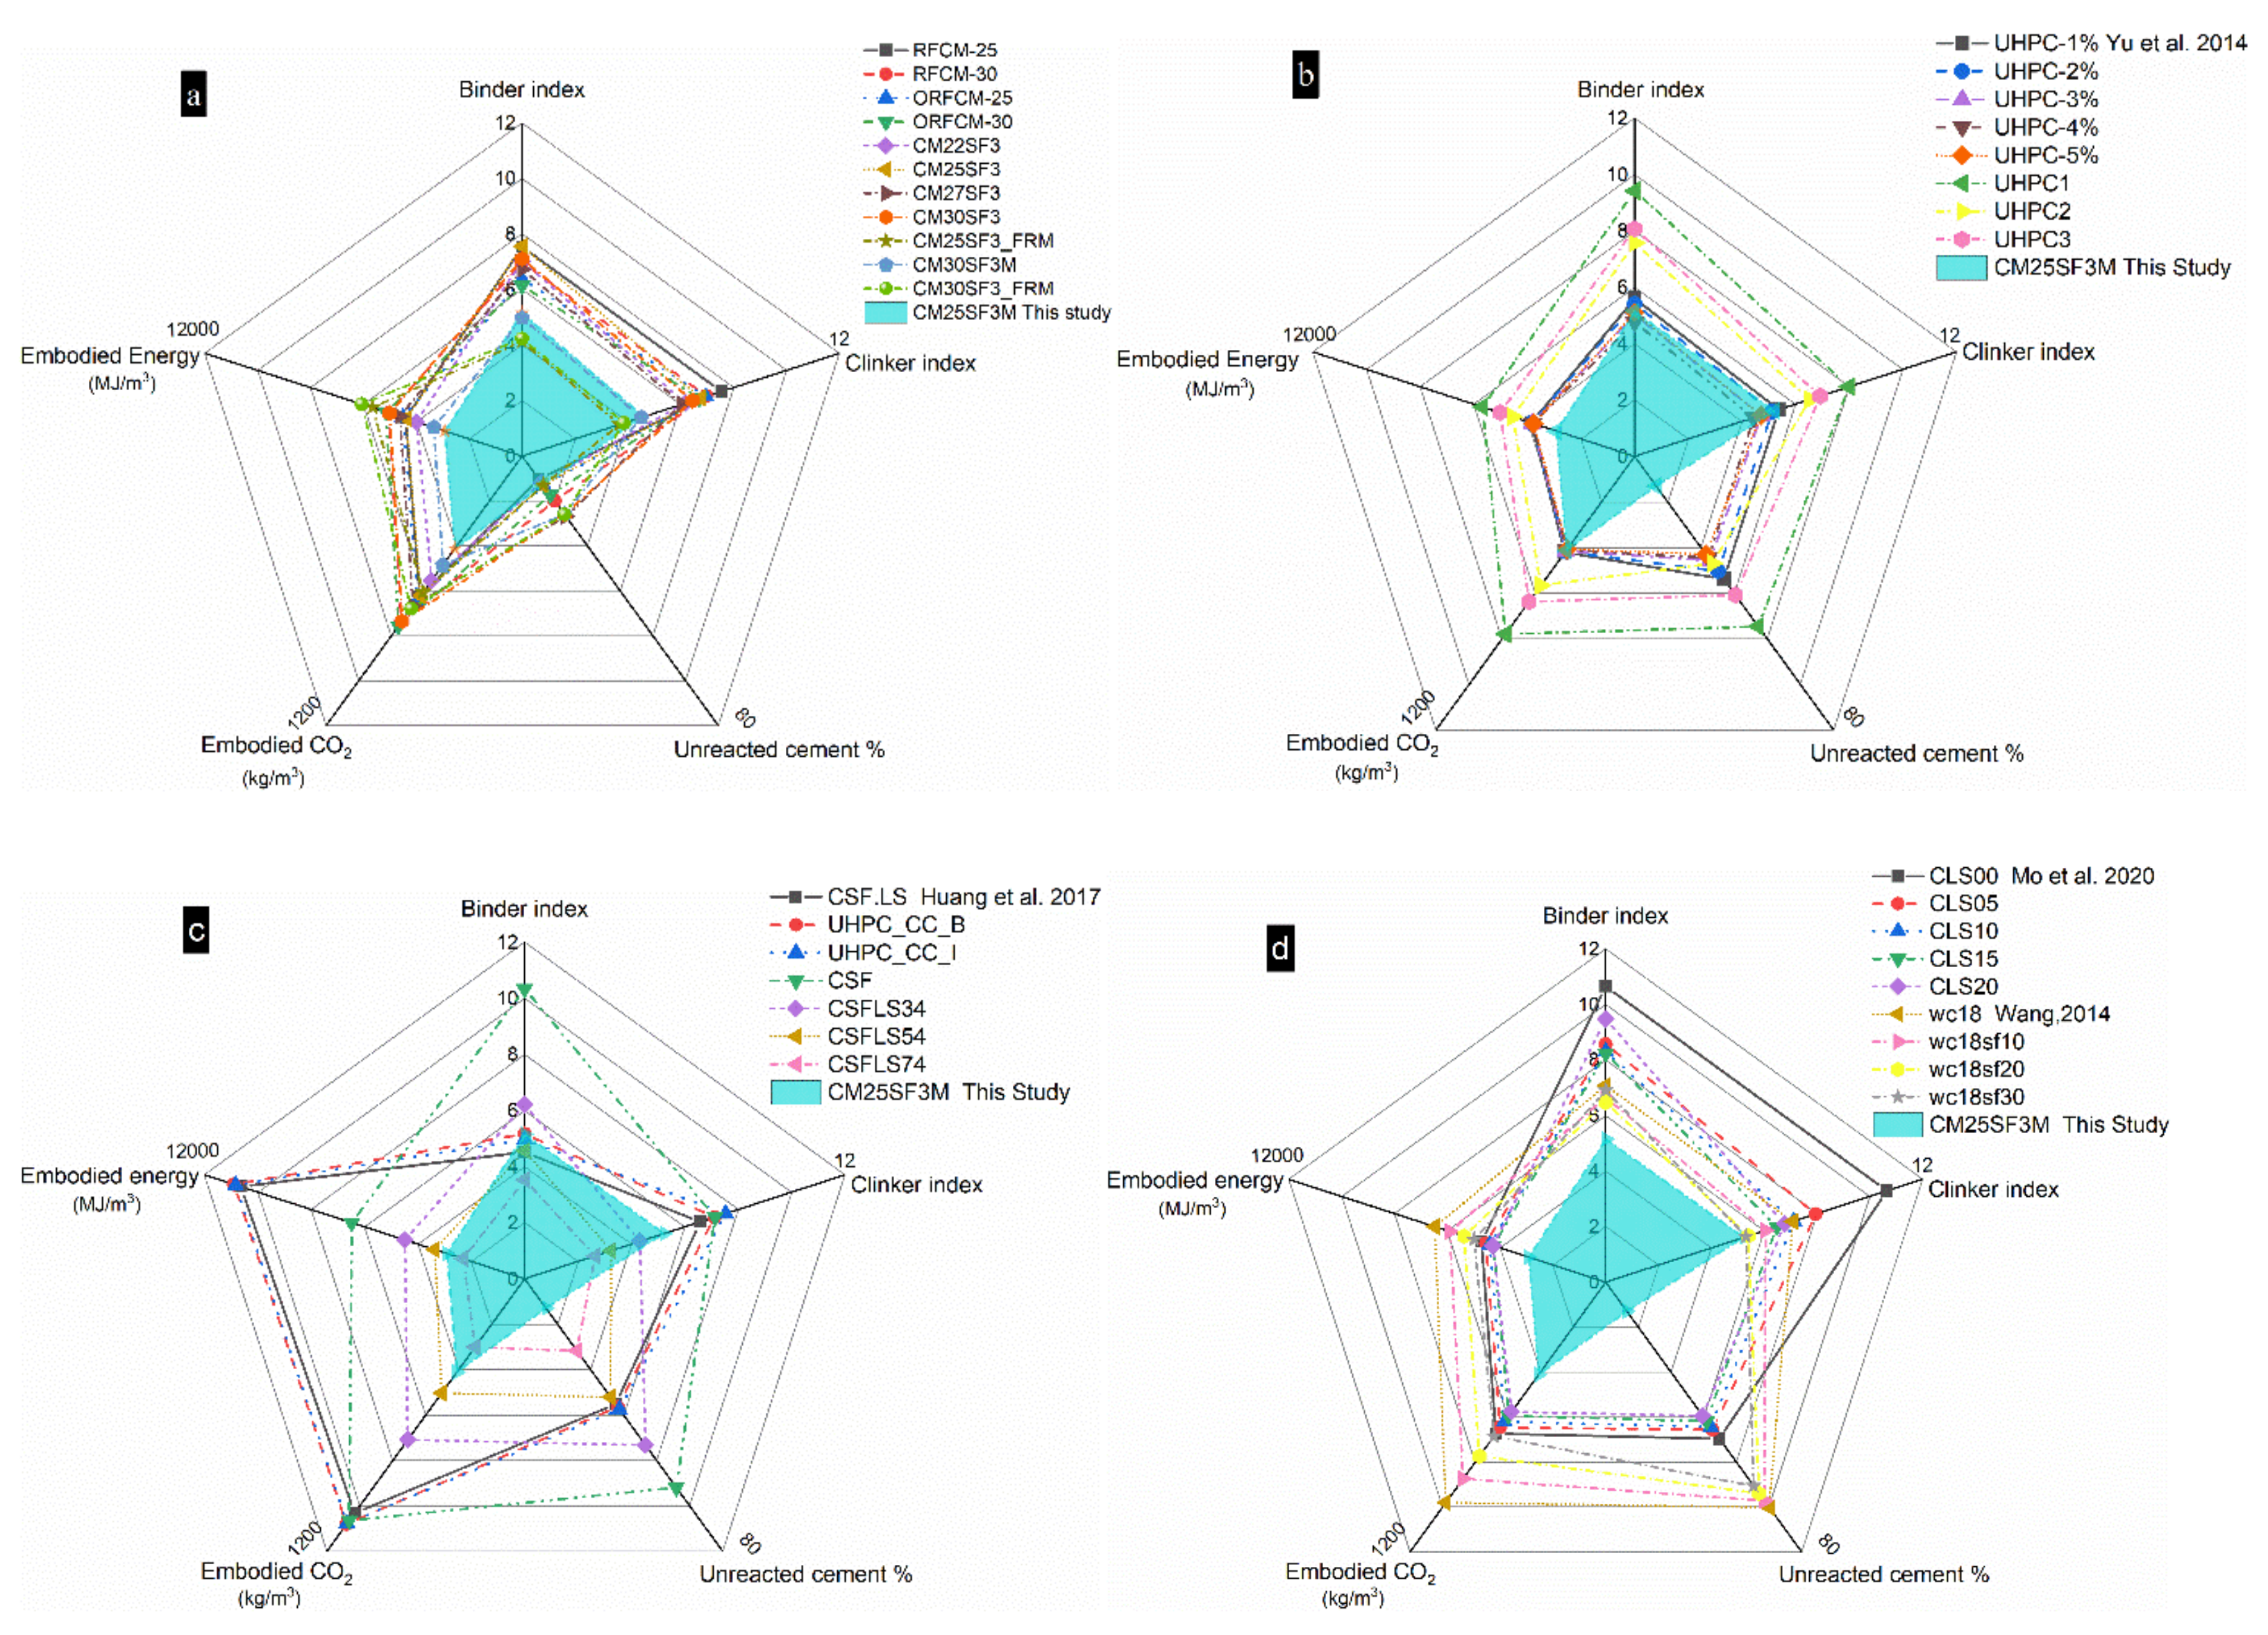
4.4. Cement Use Efficiency and Environmental Impact
5. Conclusions
Author Contributions
Funding
Institutional Review Board Statement
Informed Consent Statement
Data Availability Statement
Conflicts of Interest
References
- Barcelo, L.; Kline, J.; Walenta, G.; Gartner, E. Cement and carbon emissions. Mater. Struct. 2014, 47, 1055–1065. [Google Scholar] [CrossRef]
- Hammond, G.; Jones, C.; Lowrie, F.; Tse, P. Inventory of Carbon & Energy: ICE; Sustainable Energy Research Team, Department of Mechanical Engineering, University of Bath: Bath, UK, 2011; Volume 5. [Google Scholar]
- IEA. Technology Roadmap Low Carbon Transition in the Cement Industry; International Energy Agency: Paris, France, 2018. [Google Scholar]
- Yu, R.; Song, Q.; Wang, X.; Zhang, Z.; Shui, Z.; Brouwers, H.J.H. Sustainable development of Ultra-High Performance Fibre Reinforced Concrete (UHPFRC): Towards to an optimized concrete matrix and efficient fibre application. J. Clean. Prod. 2017, 162, 220–233. [Google Scholar] [CrossRef]
- Shi, C.; Wu, Z.; Xiao, J.; Wang, D.; Huang, Z.; Fang, Z. A review on ultra high performance concrete: Part I. Raw materials and mixture design. Constr. Build. Mater. 2015, 101, 741–751. [Google Scholar] [CrossRef]
- Chen, J.; Ng, P.; Chu, S.; Guan, G.; Kwan, A. Ternary blending with metakaolin and silica fume to improve packing density and performance of binder paste. Constr. Build. Mater. 2020, 252, 119031. [Google Scholar] [CrossRef]
- Yu, R.; Spiesz, P.; Brouwers, H. Mix design and properties assessment of ultra-high performance fibre reinforced concrete (UHPFRC). Cem. Concr. Res. 2014, 56, 29–39. [Google Scholar] [CrossRef]
- Arora, A.; Almujaddidi, A.; Kianmofrad, F.; Mobasher, B.; Neithalath, N. Material design of economical ultra-high performance concrete (UHPC) and evaluation of their properties. Cem. Concr. Compos. 2019, 104, 103346. [Google Scholar] [CrossRef]
- Korpa, A.; Kowald, T.; Trettin, R. Phase development in normal and ultra high performance cementitious systems by quantitative X-ray analysis and thermoanalytical methods. Cem. Concr. Res. 2009, 39, 69–76. [Google Scholar] [CrossRef]
- Huang, W.; Kazemi-Kamyab, H.; Sun, W.; Scrivener, K. Effect of replacement of silica fume with calcined clay on the hydration and microstructural development of eco-UHPFRC. Mater. Des. 2017, 121, 36–46. [Google Scholar] [CrossRef]
- Huang, W.; Kazemi-Kamyab, H.; Sun, W.; Scrivener, K. Effect of cement substitution by limestone on the hydration and microstructural development of ultra-high performance concrete (UHPC). Cem. Concr. Compos. 2017, 77, 86–101. [Google Scholar] [CrossRef]
- Van Tuan, N.; Ye, G.; Van Breugel, K.; Copuroglu, O. Hydration and microstructure of ultra high performance concrete incorporating rice husk ash. Cem. Concr. Res. 2011, 41, 1104–1111. [Google Scholar] [CrossRef]
- Van Tuan, N.; Ye, G.; Van Breugel, K.; Fraaij, A.L.; Dai Bui, D. The study of using rice husk ash to produce ultra high performance concrete. Constr. Build. Mater. 2011, 25, 2030–2035. [Google Scholar] [CrossRef]
- Kazemi Kamyab, M. Autogenous Shrinkage and Hydration Kinetics of SH-UHPFRC under Moderate to Low Temperature Curing Conditions; EPFL: Lausanne, Switzerland, 2013. [Google Scholar]
- Rossi, P. Influence of fibre geometry and matrix maturity on the mechanical performance of ultra high-performance cement-based composites. Cem. Concr. Compos. 2013, 37, 246–248. [Google Scholar] [CrossRef]
- Park, S.H.; Kim, D.J.; Ryu, G.S.; Koh, K.T. Tensile behavior of ultra high performance hybrid fiber reinforced concrete. Cem. Concr. Compos. 2012, 34, 172–184. [Google Scholar] [CrossRef]
- Scrivener, K.; Ouzia, A.; Juilland, P.; Mohamed, A.K. Advances in understanding cement hydration mechanisms. Cem. Concr. Res. 2019, 124, 105823. [Google Scholar] [CrossRef]
- Bentz, D.P.; Sant, G.; Weiss, J. Early-age properties of cement-based materials. I: Influence of cement fineness. J. Mater. Civ. Eng. 2008, 20, 502–508. [Google Scholar] [CrossRef]
- Chen, X.; Zhou, J.; Yan, Y. Hydration of ultrafine and ordinary Portland cement at early ages. KSCE J. Civ. Eng. 2014, 18, 1720–1725. [Google Scholar] [CrossRef]
- Zheng, K.; Liu, Y.; Huang, W.; Zhou, J.; Cui, D. Reverse filling cementitious materials based on dense packing: The concept and application. Powder Technol. 2020, 359, 152–160. [Google Scholar] [CrossRef]
- De Larrard, F.; Sedran, T. Mixture-proportioning of high-performance concrete. Cem. Concr. Res. 2002, 32, 1699–1704. [Google Scholar] [CrossRef]
- Snellings, R.; Chwast, J.; Cizer, Ö.; De Belie, N.; Dhandapani, Y.; Durdzinski, P.; Elsen, J.; Haufe, J.; Hooton, D.; Patapy, C. RILEM TC-238 SCM recommendation on hydration stoppage by solvent exchange for the study of hydrate assemblages. Mater. Struct. 2018, 51, 172. [Google Scholar] [CrossRef]
- Yu, R.; Spiesz, P.; Brouwers, H. Effect of nano-silica on the hydration and microstructure development of Ultra-High Performance Concrete (UHPC) with a low binder amount. Constr. Build. Mater. 2014, 65, 140–150. [Google Scholar] [CrossRef]
- Damineli, B.L.; Kemeid, F.M.; Aguiar, P.S.; John, V.M. Measuring the eco-efficiency of cement use. Cem. Concr. Compos. 2010, 32, 555–562. [Google Scholar] [CrossRef]
- Wu, M.; Zhang, Y.; Ji, Y.; Liu, G.; Liu, C.; She, W.; Sun, W. Reducing environmental impacts and carbon emissions: Study of effects of superfine cement particles on blended cement containing high volume mineral admixtures. J. Clean. Prod. 2018, 196, 358–369. [Google Scholar] [CrossRef]
- British Cement Association. Factsheet 18 [Part 1] Embodied CO2 of UK Cement, Additions and Cementitious Material. 2009. Available online: https://minerals.usgs.gov/minerals/pubs/mcs/2018/mcs2018.pdf (accessed on 3 September 2018).
- Chiaia, B.; Fantilli, A.P.; Guerini, A.; Volpatti, G.; Zampini, D. Eco-mechanical index for structural concrete. Constr. Build. Mater. 2014, 67, 386–392. [Google Scholar] [CrossRef]
- Zheng, H. Concrete for sustainability. In SCCT Annual Concrete Seminars-Standing Committee on Concrete Technology; ETWB TC(W) No. 21/2004; SCCT: Hong Kong, 2004. [Google Scholar]
- De Larrard, F. Concrete Mixture Proportioning: A Scientific Approach; CRC Press: Boca Raton, FL, USA, 2014. [Google Scholar]
- Yunsheng, Z.; Wei, S.; Sifeng, L.; Chujie, J.; Jianzhong, L. Preparation of C200 green reactive powder concrete and its static–dynamic behaviors. Cem. Concr. Compos. 2008, 30, 831–838. [Google Scholar] [CrossRef]
- Brouwers, H. The work of Powers and Brownyard revisited: Part 1. Cem. Concr. Res. 2004, 34, 1697–1716. [Google Scholar] [CrossRef]
- Moon, G.D.; Oh, S.; Jung, S.H.; Choi, Y.C. Effects of the fineness of limestone powder and cement on the hydration and strength development of PLC concrete. Constr. Build. Mater. 2017, 135, 129–136. [Google Scholar] [CrossRef]
- Scrivener, K.L.; Juilland, P.; Monteiro, P.J. Advances in understanding hydration of Portland cement. Cem. Concr. Res. 2015. [Google Scholar] [CrossRef]
- Li, L.G.; Kwan, A.K. Effects of superplasticizer type on packing density, water film thickness and flowability of cementitious paste. Constr. Build. Mater. 2015, 86, 113–119. [Google Scholar] [CrossRef]
- Yu, R.; Spiesz, P.; Brouwers, H. Development of an eco-friendly Ultra-High Performance Concrete (UHPC) with efficient cement and mineral admixtures uses. Cem. Concr. Compos. 2015, 55, 383–394. [Google Scholar] [CrossRef]
- Wang, X.-Y. Properties prediction of ultra high performance concrete using blended cement hydration model. Constr. Build. Mater. 2014, 64, 1–10. [Google Scholar] [CrossRef]
- Mo, Z.; Wang, R.; Gao, X. Hydration and mechanical properties of UHPC matrix containing limestone and different levels of metakaolin. Constr. Build. Mater. 2020, 256, 119454. [Google Scholar] [CrossRef]


| SiO2 | Al2O3 | Fe2O3 | CaO | MgO | SO3 | P2O5 | Others + LOI | D50 (μm) | Density (g/cm3) | ||
|---|---|---|---|---|---|---|---|---|---|---|---|
| Cement | 19.9 | 5.1 | 2.8 | 59.5 | 2.6 | 3.0 | 0.0 | 6.8 | 3.9 | 2.96 | |
| Limestone 1 | 1000 mesh | 0.07 | 0.05 | 0.04 | 55.41 | 0.40 | 0.12 | - | 44.0 | 14.4 | 2.71 |
| Limestone 2 | 100 mesh | 38.8 | 2.73 | ||||||||
| Silica fume | 95.2 | 0.30 | 0.07 | 0.28 | 1.68 | 1.01 | 0.32 | 1.14 | 0.15 | 2.21 | |
| C3S | C2S | C3A | C4AF | Calcite | Gypsum | Bassanite | Quartz | Lime | actual packing * density | ||
| Cement | 58.8 | 14.0 | 6.6 | 8.6 | 6.6 | 4.3 | 6.6 | - | 0.4 | 0.656 | |
| Limestone 1 | 1000 mesh | - | - | - | 97.4 | - | - | - | 2.6 | - | 0.696 |
| Limestone 2 | 100 mesh | 0.705 | |||||||||
| Material | Embodied CO2 (kg/kg) | Embodied Energy (MJ/kg) | Reference |
|---|---|---|---|
| Ordinary Portland cement | 0.83 | 4.6 | [2] |
| Superfine Portland cement | 1.15 | 6.6 | [25] |
| Limestone powder | 0.017 | 0.3 | [2] |
| Calcined clay (metakaolin) | 0.33 | 1.44 | [26] |
| Silica fume | 0 | 0.036 | [27] |
| Quartz sand | 0.02 | 0.85 | [2] |
| Normal sand | 0.005 | 0.1 | [2] |
| Steel fiber | 1.50 | 20.56 | [27] |
| Water | 0 | 0.2 | [2] |
| Polycarboxylic-based superplasticizer | 0.6 | 11.47 | [28] |
| Sample Code | Ultrafine Portland Cement | Limestone 1 | Limestone 2 | Silica Fume | Sand | Steel Fiber | Water | SP | w/c | w/p |
|---|---|---|---|---|---|---|---|---|---|---|
| (kg/m3) | ||||||||||
| RFCM-25 | 491.4 | 0.0 | 1474.2 | 0.0 | 0.0 | 0.0 | 235.9 | 59.0 | 0.48 | 0.12 |
| RFCM-30 | 591.5 | 0.0 | 1380.2 | 0.0 | 0.0 | 0.0 | 236.6 | 59.2 | 0.40 | 0.12 |
| ORFCM-25 | 502.9 | 1207.0 | 301.7 | 0.0 | 0.0 | 0.0 | 221.3 | 60.3 | 0.44 | 0.11 |
| ORFCM-30 | 605.2 | 1129.8 | 282.4 | 0.0 | 0.0 | 0.0 | 221.9 | 60.5 | 0.37 | 0.11 |
| CM22SF3 | 429.5 | 0.0 | 1464.3 | 58.6 | 0.0 | 0.0 | 234.3 | 58.6 | 0.55 | 0.12 |
| CM25SF3 | 489.0 | 0.0 | 1408.3 | 58.7 | 0.0 | 0.0 | 234.7 | 58.7 | 0.48 | 0.12 |
| CM27SF3 | 528.8 | 0.0 | 1370.9 | 58.8 | 0.0 | 0.0 | 235.0 | 58.8 | 0.44 | 0.12 |
| CM30SF3 | 588.6 | 0.0 | 1314.5 | 58.9 | 0.0 | 0.0 | 235.4 | 58.9 | 0.40 | 0.12 |
| CM25SF3M | 321.4 | 0.0 | 925.6 | 38.6 | 514.2 | 0.0 | 154.3 | 38.6 | 0.48 | 0.12 |
| CM25SF3_FRM | 315.8 | 0.0 | 909.5 | 37.9 | 505.3 | 135.2 | 151.6 | 37.9 | 0.48 | 0.12 |
| CM30SF3M | 386.4 | 0.0 | 863.0 | 38.6 | 515.2 | 0.0 | 154.6 | 38.6 | 0.40 | 0.12 |
| CM30SF3_FRM | 379.7 | 0.0 | 848.0 | 38.0 | 506.3 | 135.4 | 151.9 | 38.0 | 0.40 | 0.12 |
Publisher’s Note: MDPI stays neutral with regard to jurisdictional claims in published maps and institutional affiliations. |
© 2021 by the authors. Licensee MDPI, Basel, Switzerland. This article is an open access article distributed under the terms and conditions of the Creative Commons Attribution (CC BY) license (http://creativecommons.org/licenses/by/4.0/).
Share and Cite
Liu, Y.; Chen, L.; Zheng, K.; Yuan, Q. Improving Environmental Efficiency of Reverse Filling Cementitious Materials through Packing Optimization and Fiber Incorporation. Molecules 2021, 26, 647. https://doi.org/10.3390/molecules26030647
Liu Y, Chen L, Zheng K, Yuan Q. Improving Environmental Efficiency of Reverse Filling Cementitious Materials through Packing Optimization and Fiber Incorporation. Molecules. 2021; 26(3):647. https://doi.org/10.3390/molecules26030647
Chicago/Turabian StyleLiu, Yang, Lou Chen, Keren Zheng, and Qiang Yuan. 2021. "Improving Environmental Efficiency of Reverse Filling Cementitious Materials through Packing Optimization and Fiber Incorporation" Molecules 26, no. 3: 647. https://doi.org/10.3390/molecules26030647
APA StyleLiu, Y., Chen, L., Zheng, K., & Yuan, Q. (2021). Improving Environmental Efficiency of Reverse Filling Cementitious Materials through Packing Optimization and Fiber Incorporation. Molecules, 26(3), 647. https://doi.org/10.3390/molecules26030647