
The Structures, Molecular Orbital Properties and Vibrational Spectra of the Homo- and Heterodimers of Sulphur Dioxide and Ozone. An Ab Initio Study


Abstract
1. Introduction
2. Results and Discussion
2.1. Molecular Structures
2.2. Interaction Energies
2.3. Molecular Orbital Properties
2.4. Vibrational Spectra
3. Computational Methodology
4. Conclusions
Supplementary Materials
Funding
Data Availability Statement
Acknowledgments
Conflicts of Interest
Sample Availability
References
- Hobza, P.; Müller-Dethlefs, K. Non-Covalent Interactions. Theory and Experiment; RSC Publishing: Cambridge, UK, 2010. [Google Scholar]
- Aakeroy, C.B.; Bryce, D.L.; Desiraju, G.R.; Frontera, A.; Legon, A.C.; Nicotra, F.; Rissanen, K.; Terraneo, S.S.G.; Metrangolo, P.; Resnati, G. Definition of the chalcogen bond (IUPAC recommendations 2019). Pure Appl. Chem. 2019, 91, 1889–1892. [Google Scholar] [CrossRef]
- Nxumalo, L.M.; Ford, T.A. Ab initio calculations of the structural, energetic and vibrational properties of some hydrogen-bonded and van der Waals dimers. Part 2. Sulphur dioxide. Spectrochim. Acta Part A 1995, 51, 1847–1860. [Google Scholar] [CrossRef]
- Bone, R.G.A.; le Sueur, C.R.; Amos, R.D.; Stone, A.J. Stationary points on the potential energy surfaces of (SO2)2 and (SO2)3. J. Chem. Phys. 1992, 96, 8390–8410. [Google Scholar] [CrossRef]
- Plummer, P.L.M. Quantum mechanical studies of weakly-bound molecular clusters. J. Mol. Struct. (Theochem) 1994, 307, 119–133. [Google Scholar] [CrossRef]
- Bone, R.G.A.; Bader, R.F.W. Identifying and analyzing intermolecular bonding interactions in van der Waals molecules. J. Phys. Chem. 1996, 100, 10892–10911. [Google Scholar] [CrossRef]
- McKee, M.L. Computational study of the mono- and dianions of SO2, SO3, SO4, S2O3, S2O4, S2O6 and S2O8. J. Phys. Chem. 1996, 100, 3473–3481. [Google Scholar] [CrossRef]
- Groves, C.; Lewars, E. Dimers, trimers and oligomers of sulfur oxides: An ab initio and density functional study. J. Mol. Struct. (Theochem) 2000, 530, 265–279. [Google Scholar] [CrossRef]
- Ito, F. Gas phase infrared spectra of SO2 clusters and quantum chemical calculations of some stable isomers. Chem. Phys. Letters 2007, 436, 335–340. [Google Scholar] [CrossRef]
- Nelson, D.D.; Fraser, G.T.; Klemperer, W. The microwave and radiofrequency rotation-inversion spectrum of (SO2)2. J. Chem. Phys. 1985, 83, 945–949. [Google Scholar] [CrossRef]
- Matsumura, K.; Lovas, F.J.; Suenram, R.D. The microwave spectrum and structure of the H2O-SO2 complex. J. Chem. Phys. 1989, 91, 5887–5894. [Google Scholar] [CrossRef]
- Taleb-Bendiab, A.; Hillig, K.W., II; Kuczkowski, R.L. The microwave spectrum, structure and tunneling motion of the sulfur dioxide dimer. J. Chem. Phys. 1991, 94, 6956–6963. [Google Scholar] [CrossRef][Green Version]
- Hastie, J.W.; Hauge, R.; Margrave, J.L. Infrared spectra and geometry of SO2 and SeO2 in rare gas matrices. J. Inorg. Nucl. Chem. 1969, 31, 281–289. [Google Scholar] [CrossRef]
- Allavena, M.; Rysnik, R.; White, D.; Calder, V.; Mann, D.E. Infrared spectra and geometry of SO2 isotopes in solid krypton matrices. J. Chem. Phys. 1969, 50, 3399–3409. [Google Scholar] [CrossRef]
- Fredin, L. An exploratory study of weak molecular complexes in low temperature matrices. Chem. Scripta 1973, 4, 97–102. [Google Scholar]
- Spoliti, M.; Grosso, V.; Nunziante-Cesaro, S. Infrared matrix isolation of, and bonding in, the oxides of group VIB elements: O3, SO2, SeO2 and TeO2. J. Mol. Struct. 1974, 21, 7–15. [Google Scholar] [CrossRef]
- Maillard, D.; Allavena, M.; Perchard, J.P. Spectres vibrationnels du dioxide de soufre dans une matrice d’argon, d’azote et de neon. Spectrochim. Acta Part A 1975, 31, 1523–1531. [Google Scholar] [CrossRef]
- Sodeau, J.R.; Lee, E.K.C. Photo-oxidation of sulfur dioxide in low temperature matrices. J. Phys. Chem. 1980, 84, 3358–3362. [Google Scholar] [CrossRef]
- Nord, L. On the sulphur dioxide dimer in solid nitrogen. J. Mol. Struct. 1982, 96, 19–25. [Google Scholar] [CrossRef]
- Wierzejewka-Hnat, M.; Schriver, A.; Schriver-Mazzuoli, L. FT infrared study of sulfur dioxide dimer. I. Nitrogen matrix. Chem. Phys. 1994, 183, 117–126. [Google Scholar] [CrossRef]
- Schriver-Mazzuoli, L.; Schriver, A.; Wierzejewka-Hnat, M. Fourier transform infrared study of sulfur dioxide dimer. II. Argon matrix. Chem. Phys. 1995, 199, 227–243. [Google Scholar] [CrossRef]
- Nxumalo, L.M.; Ford, T.A. The sulphur dioxide dimer. A matrix isolation infrared spectroscopic study. J. Mol. Struct. 1995, 347, 495–508. [Google Scholar] [CrossRef]
- Ito, F.; Hirabayashi, S. Infrared spectroscopy of SO2 clusters in rare gas matrices revisited. Assignment of species in Ar matrices. Chem. Phys. 2009, 358, 209–218. [Google Scholar] [CrossRef]
- Peebles, S.A.; Sun, L.; Kuczkowski, R.L.; Nxumalo, L.M.; Ford, T.A. The structure of the boron trifluoride-sulphur dioxide complex. J. Mol. Struct. 1998, 471, 235–242. [Google Scholar] [CrossRef]
- Rayon, V.M.; Sordo, J.A. Acetylene-sulfur dioxide van der Waals complexes. A theoretical study. Chem. Phys. Lett. 2001, 341, 575–584. [Google Scholar] [CrossRef]
- Hippler, M. Quantum chemical study of CHCl3-SO2 association. J. Chem. Phys. 2005, 123, 204311. [Google Scholar] [CrossRef]
- Steudel, R.; Steudel, Y. Charge-transfer complexes between the sulfur molecules SO2, S2O, S3, SONH and SOCl2 and the amine donors NH3 and NMe3—A theoretical study. Eur. J. Inorg. Chem. 2007, 2007, 4385–4392. [Google Scholar] [CrossRef]
- Venayagamoorthy, M.; Ford, T.A. Ab initio molecular orbital studies of the vibrational spectra of some van der Waals complexes. Part 4. Complexes of sulphur dioxide with carbon dioxide, carbonyl sulphide, carbon disulphide and nitrous oxide. S. Afr. J. Chem. 2009, 62, 149–155. [Google Scholar]
- Ford, T.A. Ab initio molecular orbital calculations of the structures and vibrational spectra of some molecular complexes containing sulphur dioxide. J. Mol. Struct. 2009, 924–926, 466–472. [Google Scholar] [CrossRef]
- Eigner, A.A.; Wrass, J.P.; Smith, E.L.; Knutson, C.C.; Phillips, J.A. Structural properties of CH3CN-SO2 in the gas phase and condensed-phase media via density functional theory and infrared spectroscopy. J. Mol. Struct. 2009, 919, 312–320. [Google Scholar] [CrossRef]
- Dayton, D.C.; Miller, R.E. Infrared spectroscopy of the sulfur dioxide-hydrogen fluoride and hydrogen cyanide-sulfur dioxide binary complexes. J. Phys. Chem. 1990, 94, 6641–6646. [Google Scholar] [CrossRef]
- Andrews, A.M.; Hillig, K.W., II; Kuczkowski, R.L.; Legon, A.C.; Howard, N.W. Microwave spectrum, structure, dipole moment and deuterium nuclear quadrupole coupling constants of the acetylene-sulfur dioxide van der Waals complex. J. Chem. Phys. 1991, 94, 6947–6955. [Google Scholar] [CrossRef]
- Oh, J.J.; Hillig, K.W.; Kuczkowski, R.L. Microwave spectrum and structure of the pyridine-sulfur dioxide complex. J. Am. Chem. Soc. 1991, 113, 7480–7484. [Google Scholar] [CrossRef]
- Oh, J.J.; Hillig, K.W.; Kuczkowski, R.L. Structure of the dimethyl ether-sulfur dioxide complex. Inorg. Chem. 1991, 30, 4583–4588. [Google Scholar] [CrossRef]
- Sun, L.; Ioannou, I.I.; Kuczkowski, R.L. The microwave spectrum and structure of the carbon dioxide-sulphur dioxide complex. Mol. Phys. 1996, 88, 255–268. [Google Scholar] [CrossRef]
- Peebles, S.A.; Sun, L.H.; Ioannou, I.I.; Kuczkowski, R.L. Rotational spectrum, structure and modeling of the SO2-OCS complex. J. Mol. Struct. 1999, 485–486, 211–223. [Google Scholar] [CrossRef]
- Peebles, S.A.; Sun, L.; Kuczkowski, R.L. Rotational spectrum, structure and modeling of the SO2-CS2 complex. J. Chem. Phys. 1999, 110, 6804–6811. [Google Scholar] [CrossRef]
- Peebles, R.A.; Kuczkowski, R.L. Microwave spectrum of the N2O-SO2 dimer: Evidence for tunneling and an asymmetric structure. J. Phys. Chem. A 2000, 104, 4968–4975. [Google Scholar] [CrossRef]
- Chung, S.; Hippler, M. Infrared spectroscopy of hydrogen-bonded CHCl3-SO2 in the gas phase. J. Chem. Phys. 2006, 124, 214316–214322. [Google Scholar] [CrossRef]
- Nord, L. Some sulphur dioxide complexes in solid nitrogen. J. Mol. Struct. 1982, 96, 27–35. [Google Scholar] [CrossRef]
- Sass, C.S.; Ault, B.S. Matrix isolation infrared spectroscopic study of sulfur dioxide-amine complexes. J. Phys. Chem. 1984, 88, 432–440. [Google Scholar] [CrossRef]
- Andrews, L.; Withnall, R.; Hunt, R.D. Infrared spectra of the ozone…hydrogen fluoride and sulfur dioxide…hydrogen fluoride complexes in solid argon. J. Phys. Chem. 1988, 92, 78–81. [Google Scholar] [CrossRef]
- Schriver, A.; Schriver, L.; Perchard, J.P. Infrared matrix isolation studies of complexes between water and sulfur dioxide: Identification and structures of the 1:1, 1:2 and 2:1 species. J. Mol. Spectrosc. 1988, 127, 125–142. [Google Scholar] [CrossRef]
- Ault, B.S. Infrared spectroscopic characterization of 1:1 molecular complexes of SO2 with benzene and related conjugated π electron donors in argon matrices. J. Mol. Struct. 1990, 238, 111–117. [Google Scholar] [CrossRef]
- Nxumalo, L.M.; Ford, T.A. The Fourier transform infrared spectrum of the boron trifluoride-sulphur dioxide van der Waals complex. J. Mol. Struct. 2003, 661–662, 153–159. [Google Scholar] [CrossRef]
- Slanina, Z.; Adamowicz, L. A computational study of the ozone dimer. J. Atmos. Chem. 1993, 16, 41–46. [Google Scholar] [CrossRef]
- Andrews, L.; Spiker, R.C. Argon matrix Raman and infrared spectrum and vibrational analysis of ozone and the oxygen-18 substituted ozone molecules. J. Phys. Chem. 1972, 76, 3208–3213. [Google Scholar] [CrossRef]
- Brewer, L.; Wang, J.L. Infrared absorption spectra of isotopic ozone isolated in rare-gas matrices. J. Chem. Phys. 1972, 56, 759–761. [Google Scholar] [CrossRef]
- Hopkins, A.G.; Brown, D.W. Raman spectrum of matrix isolated ozone. J. Chem. Phys. 1973, 58, 1776–1777. [Google Scholar] [CrossRef]
- Spoliti, M.; Nunziante-Cesaro, S.; Mariti, B. Infrared spectrum and geometry of ozone isolated in inert gas matrices at 20.4 K. J. Chem. Phys. 1973, 59, 985–986. [Google Scholar] [CrossRef]
- Brosset, P.; Dahoo, R.; Gauthier-Roy, B.; Abouaf-Marguin, L. Analysis of IR absorption spectrum of O3 in inert matrices: Spectroscopic evidence for two trapping sites. Chem. Phys. 1993, 172, 315–324. [Google Scholar] [CrossRef]
- Lakhlifi, A.; Girardet, C.; Dahoo, R.; Brosset, P.; Gauthier-Roy, B.; Abouaf-Marguin, L. Interpretation of the infrared spectrum of ozone trapped in inert matrices. Chem. Phys. 1993, 177, 31–44. [Google Scholar] [CrossRef]
- Jasmin, D.; Brosset, P.; Dahoo, R.; Raducu, V.; Gauthier-Roy, B.; Abouaf-Marguin, L. Laser-induced infrared fluorescence of O3 trapped in xenon matrices. J. Chem. Phys. 1994, 101, 7337–7341. [Google Scholar] [CrossRef]
- Schriver-Mazzuoli, L.; Schriver, A.; Lugez, C.; Perrin, A.; Camy-Peyret, C.; Flaud, J.M. Vibrational spectra of the 16O/17O/18O substituted ozone molecule isolated in matrices. J. Mol. Spectrosc. 1996, 176, 85–94. [Google Scholar] [CrossRef]
- Bahou, M.; Schriver-Mazzuoli, L.; Camy-Peyret, C.; Schriver, A. Photolysis of ozone at 693 nm in solid oxygen. Isotope effects in ozone reformation. Chem. Phys. Lett. 1997, 273, 31–36. [Google Scholar] [CrossRef]
- Bahou, M.; Schriver-Mazzuoli, L.; Camy-Peyretm, C.; Schriver, A. New information on the ozone monomer photochemistry at 266 nm in nitrogen matrices. J. Chem. Phys. 1998, 108, 6884–6891. [Google Scholar] [CrossRef]
- Flaud, J.M.; Bacis, R. The ozone molecule: Infrared and microwave spectroscopy. Spectrochim. Acta Part A 1998, 54, 3–16. [Google Scholar] [CrossRef]
- Bahou, M.; Schriver-Mazzuoli, L.; Schriver, A. Photolysis at 266 nm of argon matrix isolated ozone monomer. J. Chem. Phys. 1999, 110, 8636–8642. [Google Scholar] [CrossRef]
- Bahou, M.; Schriver-Mazzuoli, L.; Schriver, A. Infrared spectroscopy and photochemistry at 266 nm of the ozone dimer trapped in an argon matrix. J. Chem. Phys. 2001, 114, 4045–4052. [Google Scholar] [CrossRef]
- Nelander, B.; Nord, L. Do ozone-olefin complexes really exist? J. Am. Chem. Soc. 1979, 101, 3769–3770. [Google Scholar] [CrossRef]
- Nord, L. Ozone complexes in solid nitrogen. J. Mol. Struct. 1983, 96, 37–44. [Google Scholar] [CrossRef]
- Withnall, R.; Hawkins, M.; Andrews, L. Infrared spectrum of a symmetrical phosphine-ozone complex in solid argon. J. Phys. Chem. 1986, 90, 575–579. [Google Scholar] [CrossRef]
- Withnall, R.; Andrews, L. FTIR spectra of the photolysis products of the phosphine ozone complex in solid argon. J. Phys. Chem. 1987, 91, 784–797. [Google Scholar] [CrossRef]
- Andrews, L. FTIR spectra of base-HF complexes in noble gas matrices. J. Mol. Struct. 1988, 173, 103–110. [Google Scholar] [CrossRef]
- Schriver, L.; Barreau, C.; Schriver, A. Infrared spectroscopic and photochemical study of water-ozone complexes in solid argon. Chem. Phys. 1990, 140, 429–438. [Google Scholar] [CrossRef]
- Schriver, L.; Carrere, D.; Schriver, A.; Jaeger, K. Matrix isolation photolysis of SO2, O3 and H2O: Evidence for the H2O:SO3 complex. Chem. Phys. Lett. 1991, 181, 505–511. [Google Scholar] [CrossRef]
- Davis, S.R.; Liu, L. Matrix isolation IR spectroscopy, photochemistry and ab initio calculations of the difluoromethane-ozone complex. J. Phys. Chem. 1993, 97, 3690–3696. [Google Scholar] [CrossRef]
- Raducu, V.; Jasmin, D.; Dahoo, R.; Brosset, P.; Gauthier-Roy, B.; Abouaf-Marguin, L. Experimental study of the CO:O3 complex in argon matrices: Irradiation at 266 nm. J. Chem. Phys. 1994, 101, 1878–1884. [Google Scholar] [CrossRef]
- Schriver-Mazzuoli, L.; de Saxce, A.; Lugez, C.; Camy-Peyret, C.; Schriver, A. Ozone generation through photolysis of an oxygen matrix at 11 K: Fourier transform infrared spectroscopy identification of the O…O3 complex and isotopic studies. J. Chem. Phys. 1995, 102, 690–701. [Google Scholar] [CrossRef]
- Jones, P.R.; Taube, H. Photochemical studies on ozone with carbon disulfide and with carbonyl sulfide in low-temperature matrixes. J. Phys. Chem. 1973, 77, 1007–1011. [Google Scholar] [CrossRef]
- Nelander, B.; Nord, L. The reaction between ethylene and ozone. A matrix study. Tetrahedron Lett. 1977, 18, 2821–2822. [Google Scholar] [CrossRef]
- Lucas, D.; Pimentel, G.C. Reaction between nitric oxide and ozone in solid nitrogen. J. Phys. Chem. 1979, 83, 2311–2316. [Google Scholar] [CrossRef]
- Bhatia, S.C.; Hall, J.H., Jr. A matrix isolation infrared spectroscopic study of the reactions of nitric oxide with oxygen and ozone. J. Phys. Chem. 1980, 84, 3255–3259. [Google Scholar] [CrossRef]
- Frei, H.; Pimentel, G.C. Reaction of nitric oxide and ozone in cryogenic matrices: Quantum-mechanical tunneling and vibrational enhancement. J. Phys. Chem. 1981, 85, 3355–3360. [Google Scholar] [CrossRef]
- Morris, V.R.; Bhatia, S.C.; Hall, J.H. A study of the gas-phase reaction of nitrogen dioxide with ozone by matrix isolation infrared spectroscopy. J. Phys. Chem. 1987, 91, 3359–3361. [Google Scholar] [CrossRef]
- Lascola, R.; Withnall, R.; Andrews, L. Infrared spectra of hydrazine and products of its reactions with HF, F2 and O3 in solid argon. Inorg. Chem. 1988, 27, 642–648. [Google Scholar] [CrossRef]
- Andrews, L.; Withnall, R.; Moores, B.W. Infrared spectra of arsine-ozone complexes, reaction products and photolysis products in solid argon. J. Phys. Chem. 1989, 93, 1279–1285. [Google Scholar] [CrossRef]
- Andrews, L.; Moores, B.W.; Fonda, K.K. Matrix infrared spectra of reaction and photolysis products of stibine and ozone. Inorg. Chem. 1989, 28, 290–297. [Google Scholar] [CrossRef]
- Andrews, L.; McCluskey, M.; Mielke, Z.; Withnall, R. Matrix reactions of P4 and P2 with O3 molecules. J. Mol. Struct. 1990, 222, 95–108. [Google Scholar] [CrossRef]
- Mielke, Z.; McCluskey, M.; Andrews, L. Matrix reactions of P2 and O3 molecules. Chem. Phys. Lett. 1990, 165, 146–154. [Google Scholar] [CrossRef]
- Mielke, Z.; Andrews, L. Matrix infrared spectra of the products from photochemical reactions of P4 with O3 and decomposition of P4O6. Inorg. Chem. 1990, 29, 2773–2779. [Google Scholar] [CrossRef]
- Mielke, Z.; Andrews, L. Matrix infrared studies of the hydrogen cyanide + ozone and hydrogen cyanide + oxygen atom systems. J. Phys. Chem. 1990, 94, 3519–3525. [Google Scholar] [CrossRef]
- Schriver-Mazzuoli, L.; Abdeloui, O.; Lugez, C.; Schriver, A. Matrix reaction of ozone with Cl2 and Br2. FTIR identification of BrClO and ClBrO species. Chem. Phys. Lett. 1993, 214, 519–526. [Google Scholar] [CrossRef]
- Bhatia, S.C.; Hall, J.H., Jr. Matrix isolation infrared and laser Raman spectroscopic study of the gas-phase reactions of chlorine atoms and ozone. J. Phys. Chem. 1981, 85, 2055–2060. [Google Scholar] [CrossRef]
- Carter, R.O., III; Andrews, L. Matrix spectroscopic studies of chlorine atom-ozone reaction products. J. Phys. Chem. 1981, 85, 2351–2354. [Google Scholar] [CrossRef]
- Lugez, C.L.; Thompson, W.E.; Jacox, M.E. Matrix-isolated study of the interaction of excited neon atoms with O3: Infrared spectrum of O3- and evidence for the stabilization of O2…O4+. J. Chem. Phys. 1996, 105, 2153–2160. [Google Scholar] [CrossRef]
- Hargittai, M. Molecular structure of metal halides. Chem. Rev. 2000, 100, 2233–2302. [Google Scholar] [CrossRef]
- Lee, T.J.; Allen, W.D.; Schaefer, H.F., III. The analytical evaluation of energy first derivatives for two-configuration self-consistent-field configuration interaction (TCSCF-CI) wave functions. Application to ozone and ethylene. J. Chem. Phys. 1987, 87, 7062–7075. [Google Scholar] [CrossRef]
- Lee, T.J.; Scuseria, G.E. The vibrational frequencies of ozone. J. Chem. Phys. 1990, 93, 489–494. [Google Scholar] [CrossRef]
- Liu, B.; McLean, A.D. Accurate calculations of the attractive interactions of two ground state helium atoms. J. Chem. Phys. 1973, 59, 4557–4558. [Google Scholar] [CrossRef]
- Barbe, A.; Secroun, C.; Jouve, P. Infrared spectra of 16O3 and 18O3; Darling and Dennison resonance and anharmonic potential function of ozone. J. Mol. Spectrosc. 1974, 49, 171–182. [Google Scholar] [CrossRef]
- Miliordos, E.; Xantheas, S.S. On the bonding nature of ozone (O3) and its sulphur-substituted analogues SO2, OS2 and S3: Correlation between their diradical character and molecular properties. J. Am. Chem. Soc. 2014, 136, 2808–2817. [Google Scholar] [CrossRef]
- Takeshita, T.Y.; Lindquist, B.A.; Dunning, T.H., Jr. Insights into the electronic structure of ozone and sulphur dioxide from generalized valence bond theory: Bonding in O3 and SO2. J. Phys. Chem. A 2015, 119, 7683–7694. [Google Scholar] [CrossRef]
- Tanaka, T.; Morino, Y. Coriolis interaction and anharmonic potential function of ozone from the microwave spectra in the excited vibrational states. J. Mol. Spectrosc. 1970, 33, 538–551. [Google Scholar] [CrossRef]
- Frisch, M.J.; Trucks, G.W.; Schlegel, H.B.; Scuseria, G.E.; Robb, M.A.; Cheeseman, J.R.; Scalmani, G.; Barone, V.; Petersson, G.A.; Nakatsuji, H.; et al. Gaussian 16, Revision A.03; Gaussian, Inc.: Wallingford, CT, USA, 2016. [Google Scholar]
- Møller, C.; Plesset, M.S. Notes on an approximation treatment for many-elextron systems. Phys. Rev. 1934, 46, 618–622. [Google Scholar] [CrossRef]
- Dunning, T.H., Jr. Gaussian basis sets for use in correlated molecular calculations. I. The atoms boron through neon and hydrogen. J. Chem. Phys. 1989, 90, 1007–1023. [Google Scholar] [CrossRef]
- Kendall, R.A.; Dunning, T.H., Jr.; Harrison, R.J. Electron affinities of the first-row atoms revisited. Systematic basis sets and wavefunctions. J. Chem. Phys. 1992, 96, 6796–6806. [Google Scholar] [CrossRef]
- Boys, S.F.; Bernardi, F. The calculation of small molecular interactions by the differences of separate total energies. Some procedures with reduced errors. Mol. Phys. 1970, 19, 553–556. [Google Scholar] [CrossRef]


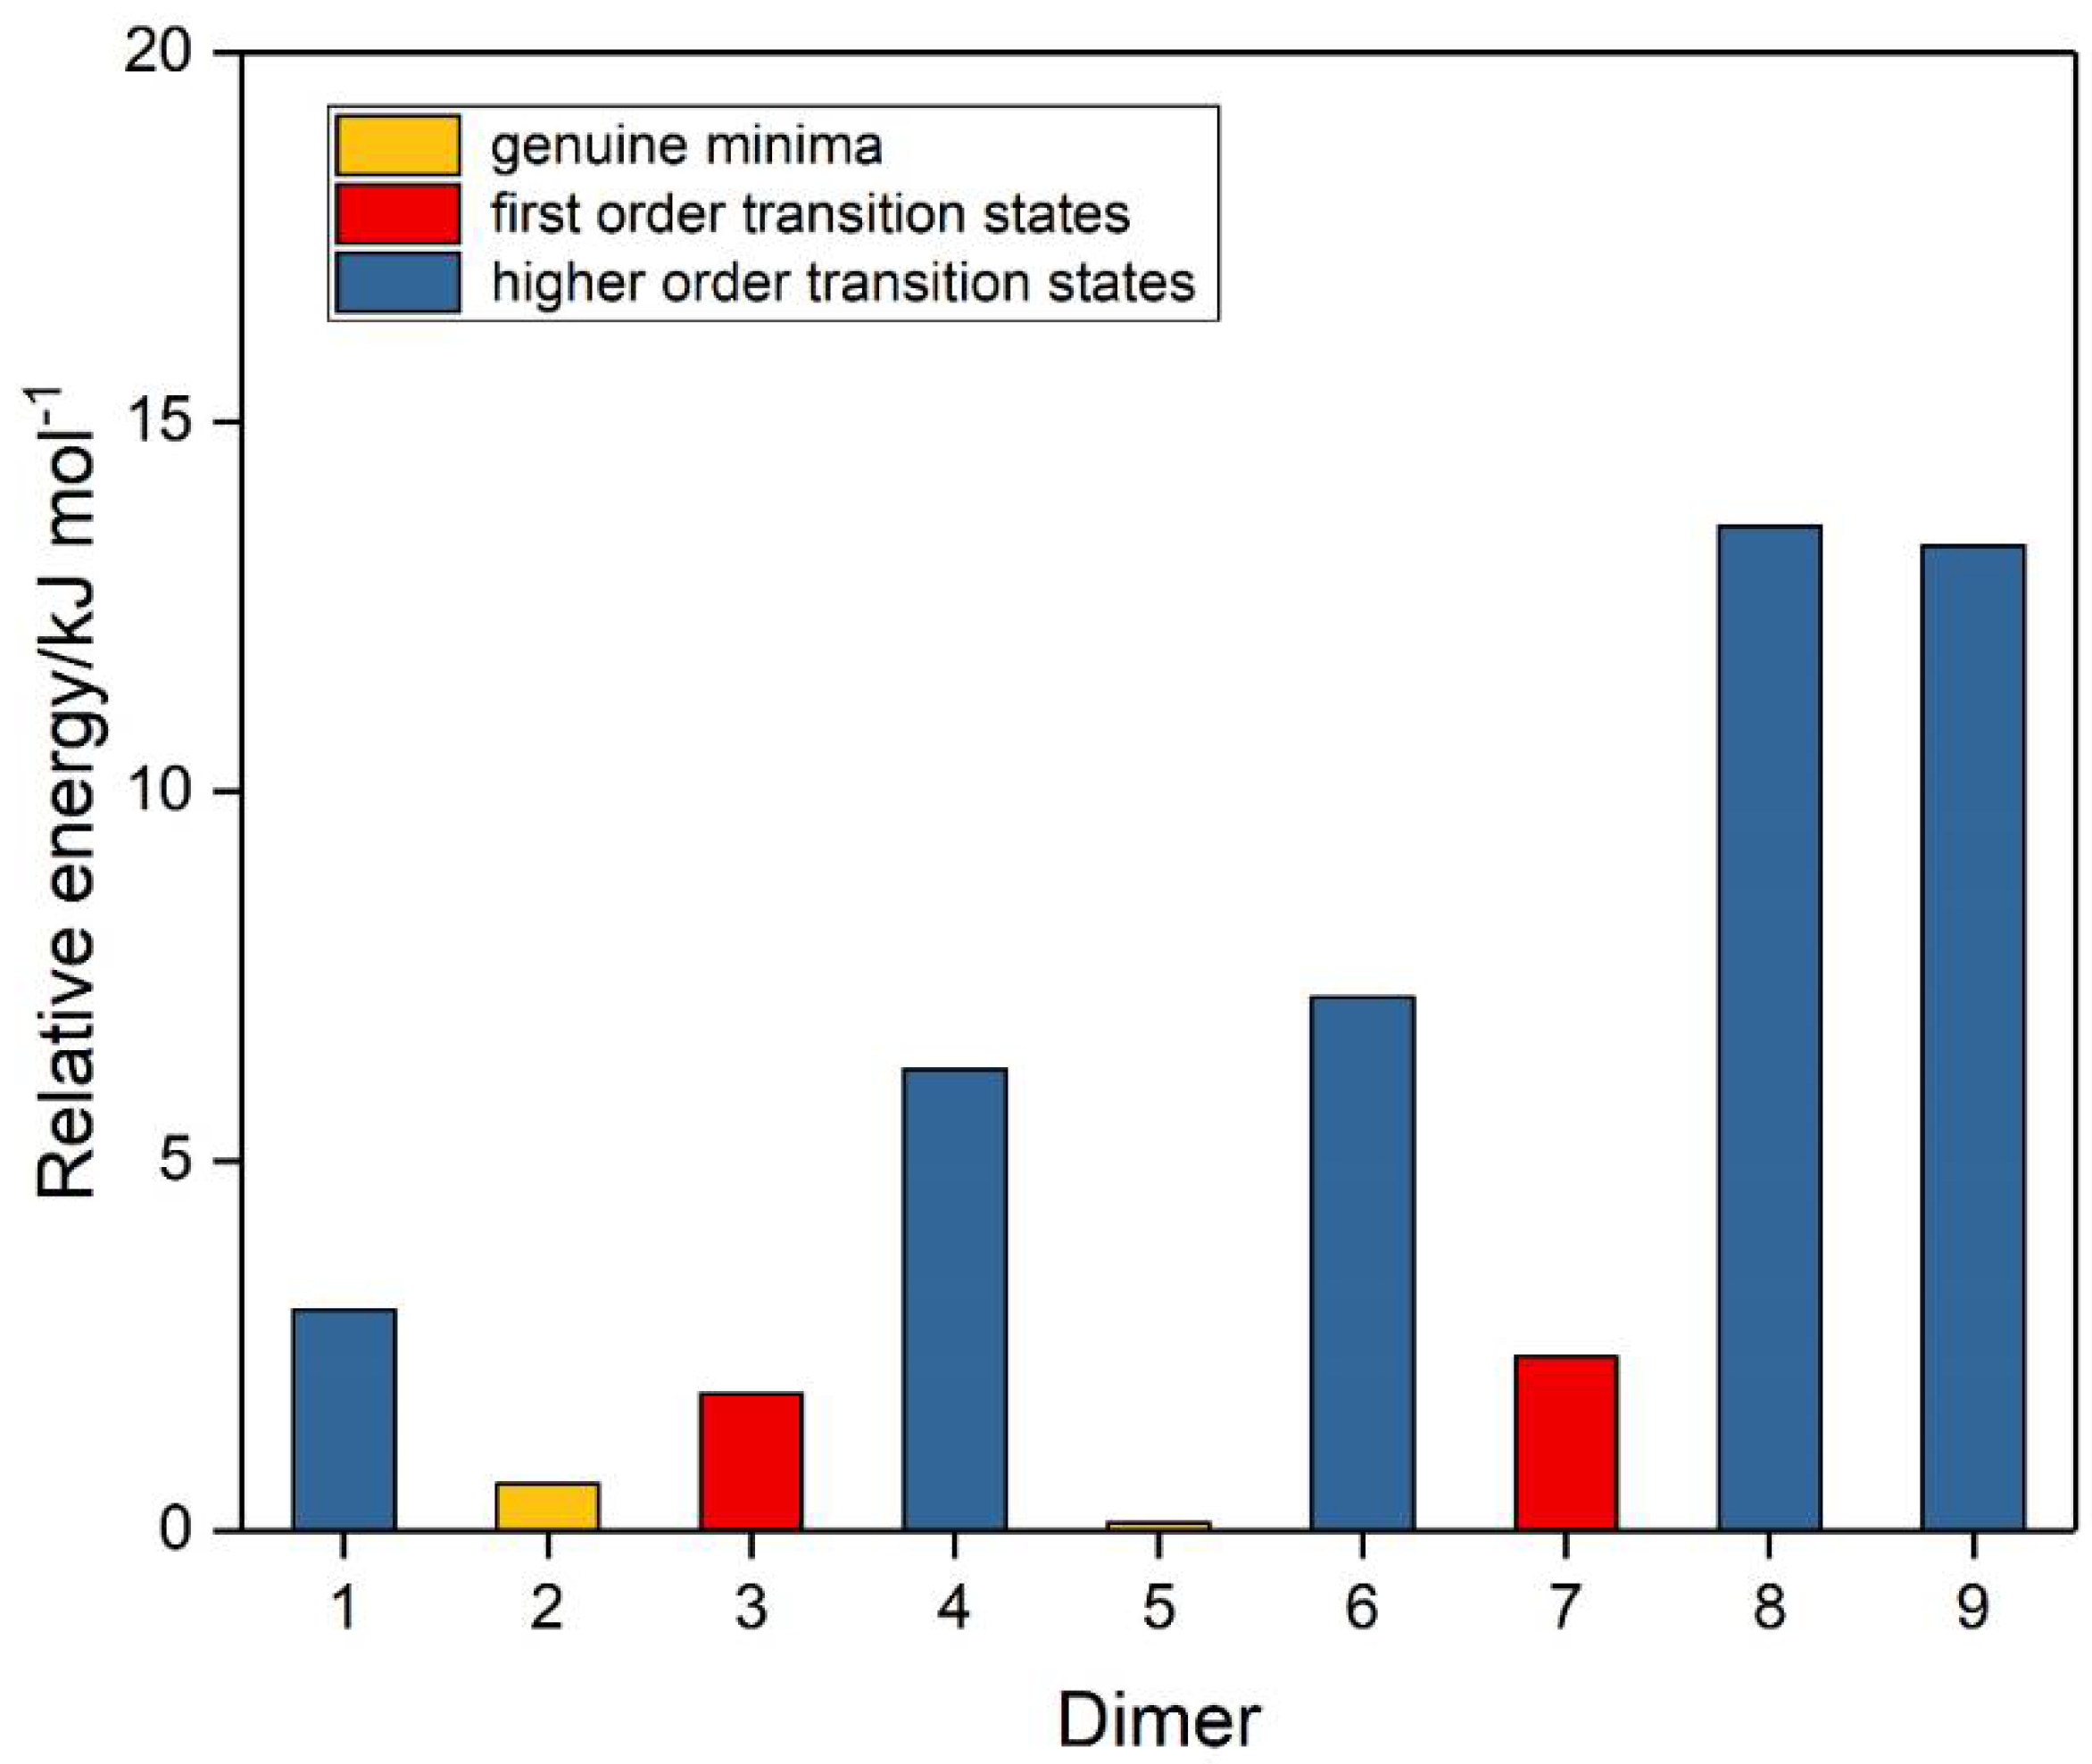
| Dimer | Symmetry | E/H | Hessian Index | Relative Energy/ kJ mol−1 |
|---|---|---|---|---|
| 5 | Cs | −1095.9350 3678 41 | 0 | 0 |
| 2 | Ci | −1095.9347 9649 54 | 0 | 0.63 |
| 3 | C2 | −1095.9343 3272 07 | 1 | 1.85 |
| 7 | Cs | −1095.9341 4356 32 | 1 | 2.35 |
| 1 | C2h | −1095.9339 0229 81 | 2 | 2.98 |
| 4 | C2v | −1095.9326 6035 55 | 2 | 6.24 |
| 6 | C2v | −1095.9322 8723 09 | 2 | 7.22 |
| 9 | D2d | −1095.9300 0351 25 | 2 | 13.32 |
| 8 | D2h | −1095.9298 6160 93 | 4 | 13.59 |
| Dimer 5 | Dimer 2 | ||||
|---|---|---|---|---|---|
| Parameter | Dimer Value | Difference from Monomer Value | Parameter | Dimer Value | Difference from Monomer Value |
| r(S1O2)/pm | 146.57 | 0.21 | r(S1O3,S2O4)/pm | 146.51 | 0.15 |
| r(S1O3)/pm | 146.32 | −0.03 | r(S1O5,S2O6)/pm | 146.30 | −0.05 |
| r(S4O5,S4O6)/pm | 146.41 | 0.06 | ∠O3S1O5,O4S2O6/deg | 118.40 | −0.39 |
| ∠O2S1O3/deg | 118.21 | −0.58 | r(S1…O4,S2…O3)/pm | 322.37 | - |
| ∠O5S4O6/deg | 118.21 | −0.58 | ∠O5S1…O4,O6S2…O3/deg | 83.85 | - |
| r(O2…S4)/pm | 318.79 | - | ∠S1O3…S2,S2O4…S1/deg | 106.60 | - |
| ∠S1O2…S4/deg | 100.27 | - | ∠O5S1O3…S2/deg a | 73.23 | - |
| ∠O2…S4O5,O2…S4O6/deg | 79.37 | - | ∠O6S2O4…S1/deg a | −73.23 | - |
| ∠O5S4…O2S1/deg a | −60.82 | - | |||
| ∠O6S4…O2S1/deg a | 60.82 | - | |||
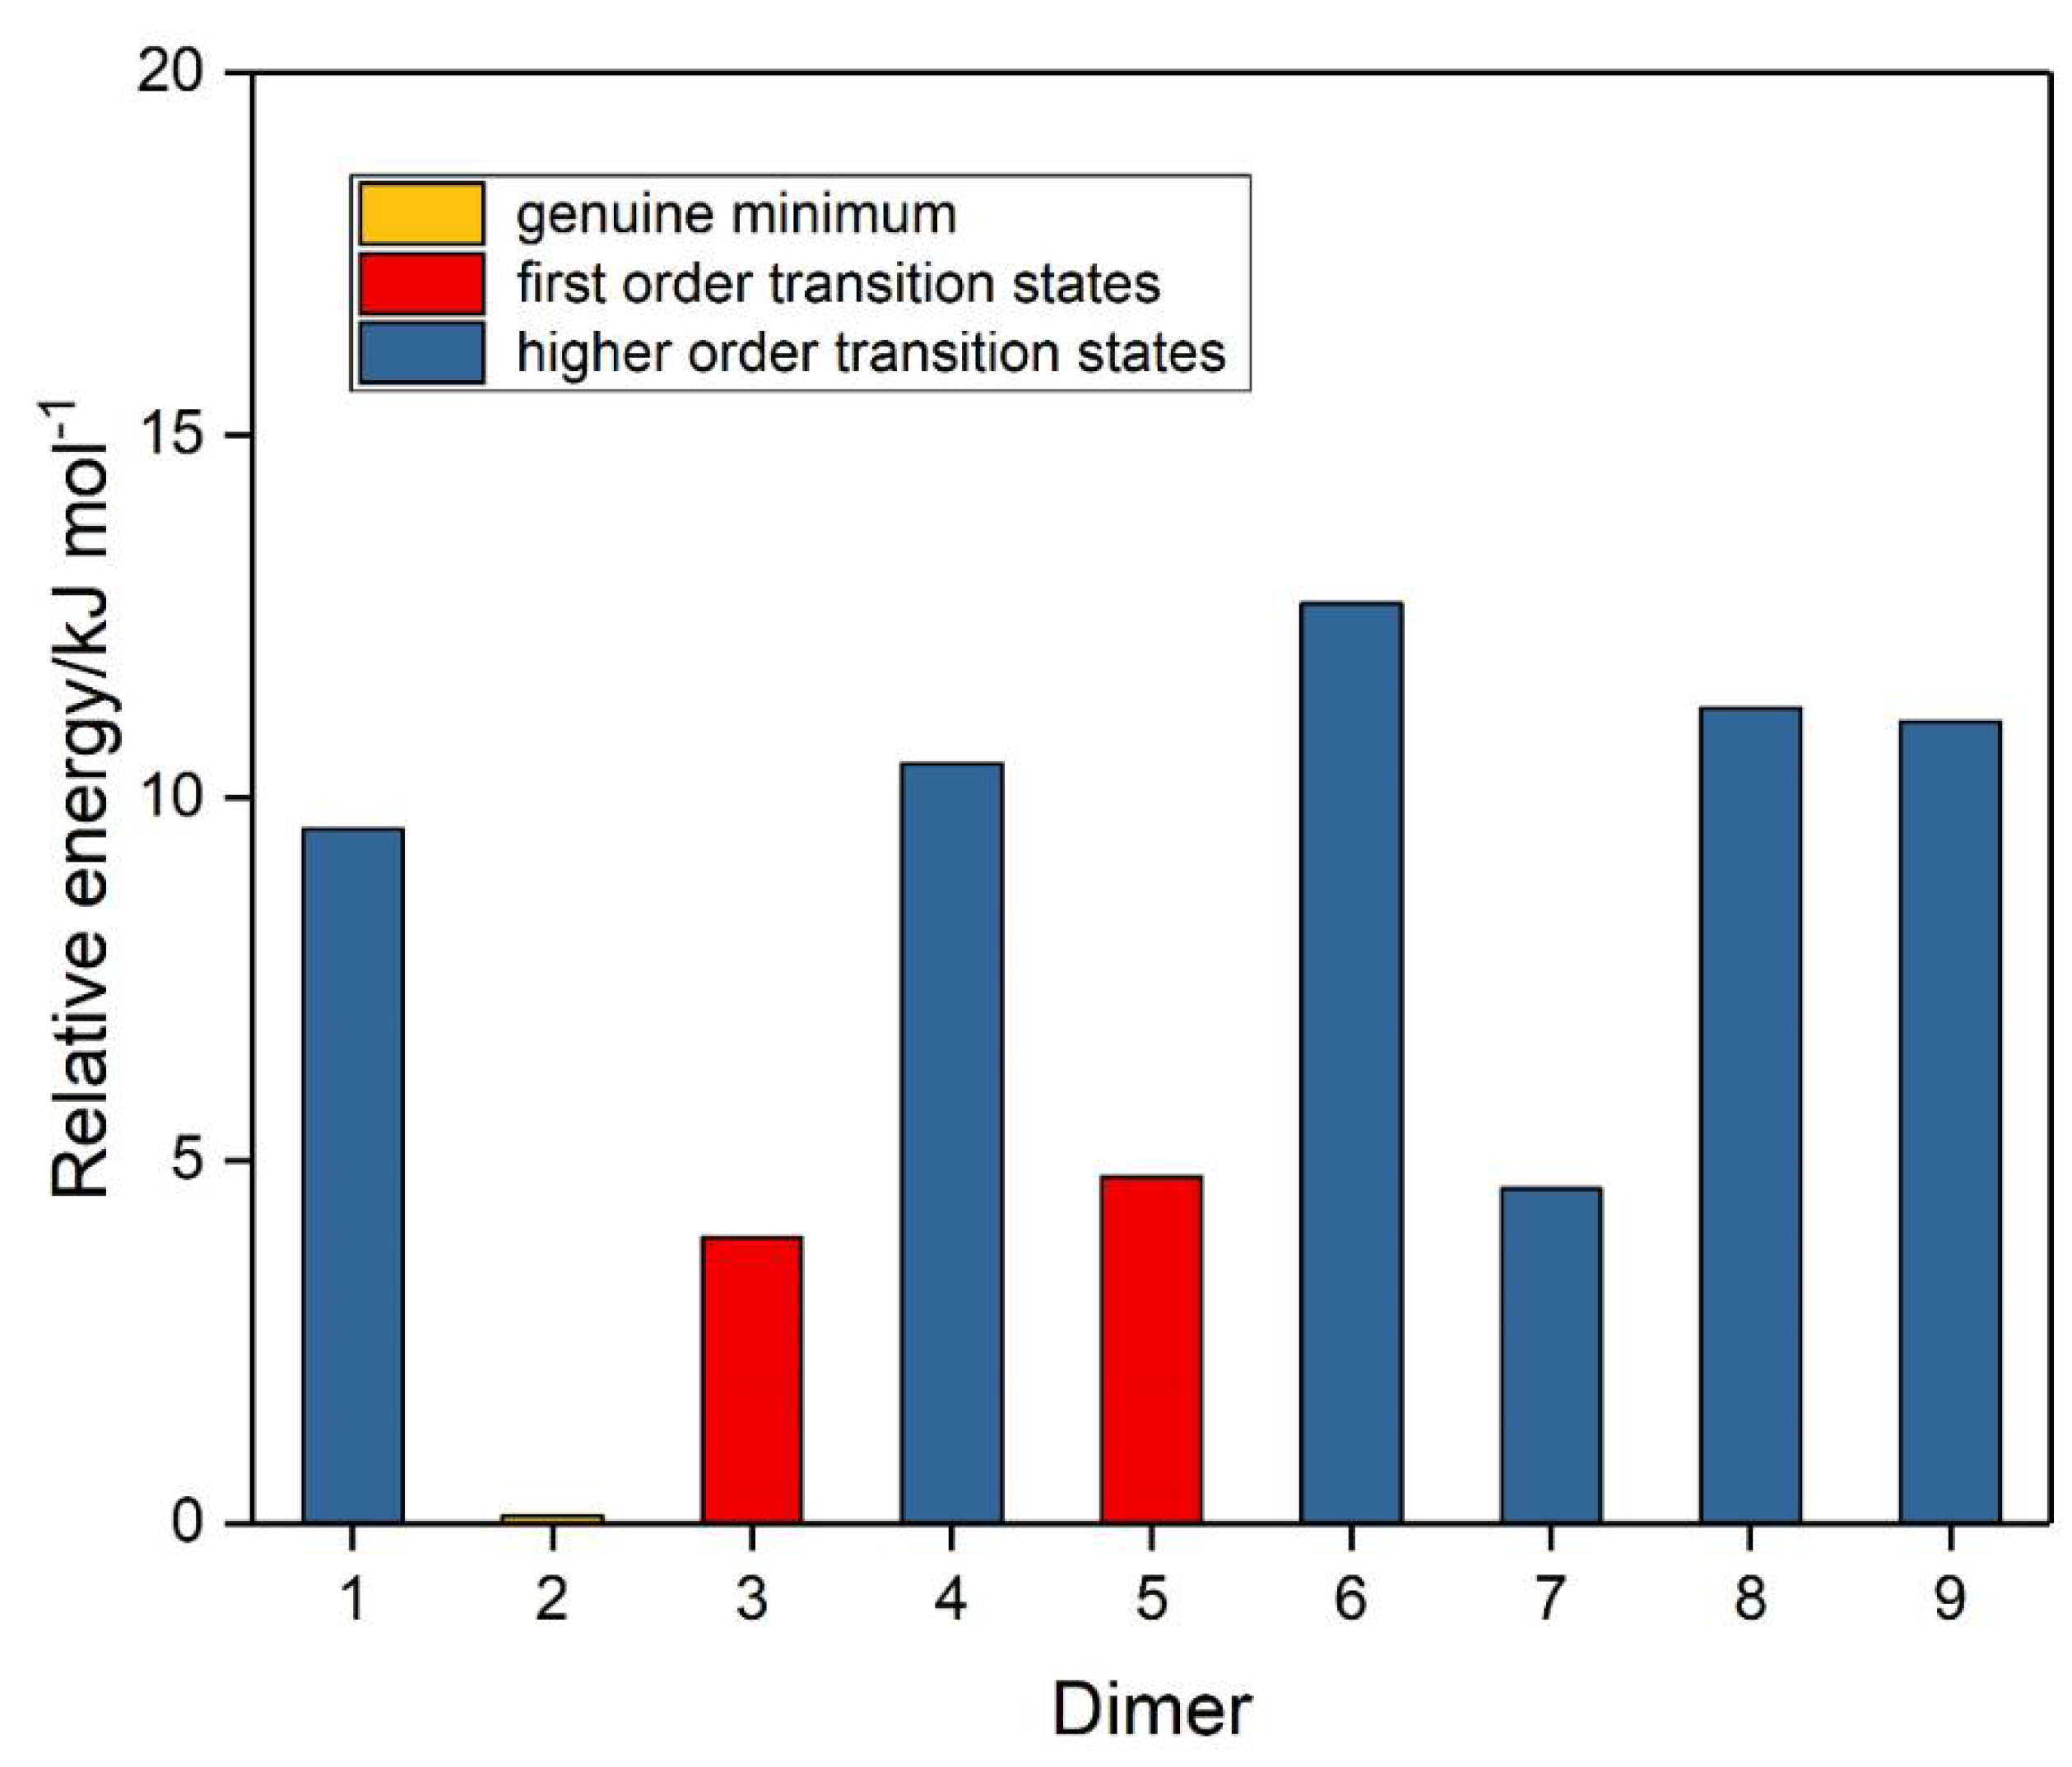
| Dimer | Symmetry | E/H | Hessian Index | Relative Energy/ kJ mol−1 |
|---|---|---|---|---|
| 2 | Ci | −450.2841 9179 490 | 0 | 0 |
| 3 | C2 | −450.2826 9146 051 | 1 | 3.94 |
| 7 | Cs | −450.2824 3399 654 | 2 | 4.61 |
| 5 | Cs | −450.2823 7307 965 | 1 | 4.77 |
| 1 | C2h | −450.2805 4781 872 | 2 | 9.57 |
| 4 | C2v | −450.2802 0490 636 | 4 | 10.47 |
| 9 | D2d | −450.2799 8305 709 | 4 | 11.05 |
| 8 | D2h | −450.2799 1140 084 | 5 | 11.24 |
| 6 | C2v | −450.2793 6382 300 | 2 | 12.68 |
| Parameter | Dimer Value | Difference from Monomer Value |
|---|---|---|
| r(O1O3,O2O4)/pm | 128.58 | 0.20 |
| r(O1O5,O2O6)/pm | 128.53 | 0.15 |
| ∠O3O1O5,O4O2O6/deg | 116.49 | −0.17 |
| r(O1…O4,O2…O3)/pm | 299.07 | - |
| ∠O5O1…O4,O6…O2O3/deg | 65.08 | - |
| ∠O1O3…O2,O2O4…O1/deg | 108.32 | - |
| ∠O5O1…O4O2/deg a | −43.17 | - |
| ∠O6O2…O3O1/deg a | 43.17 | - |
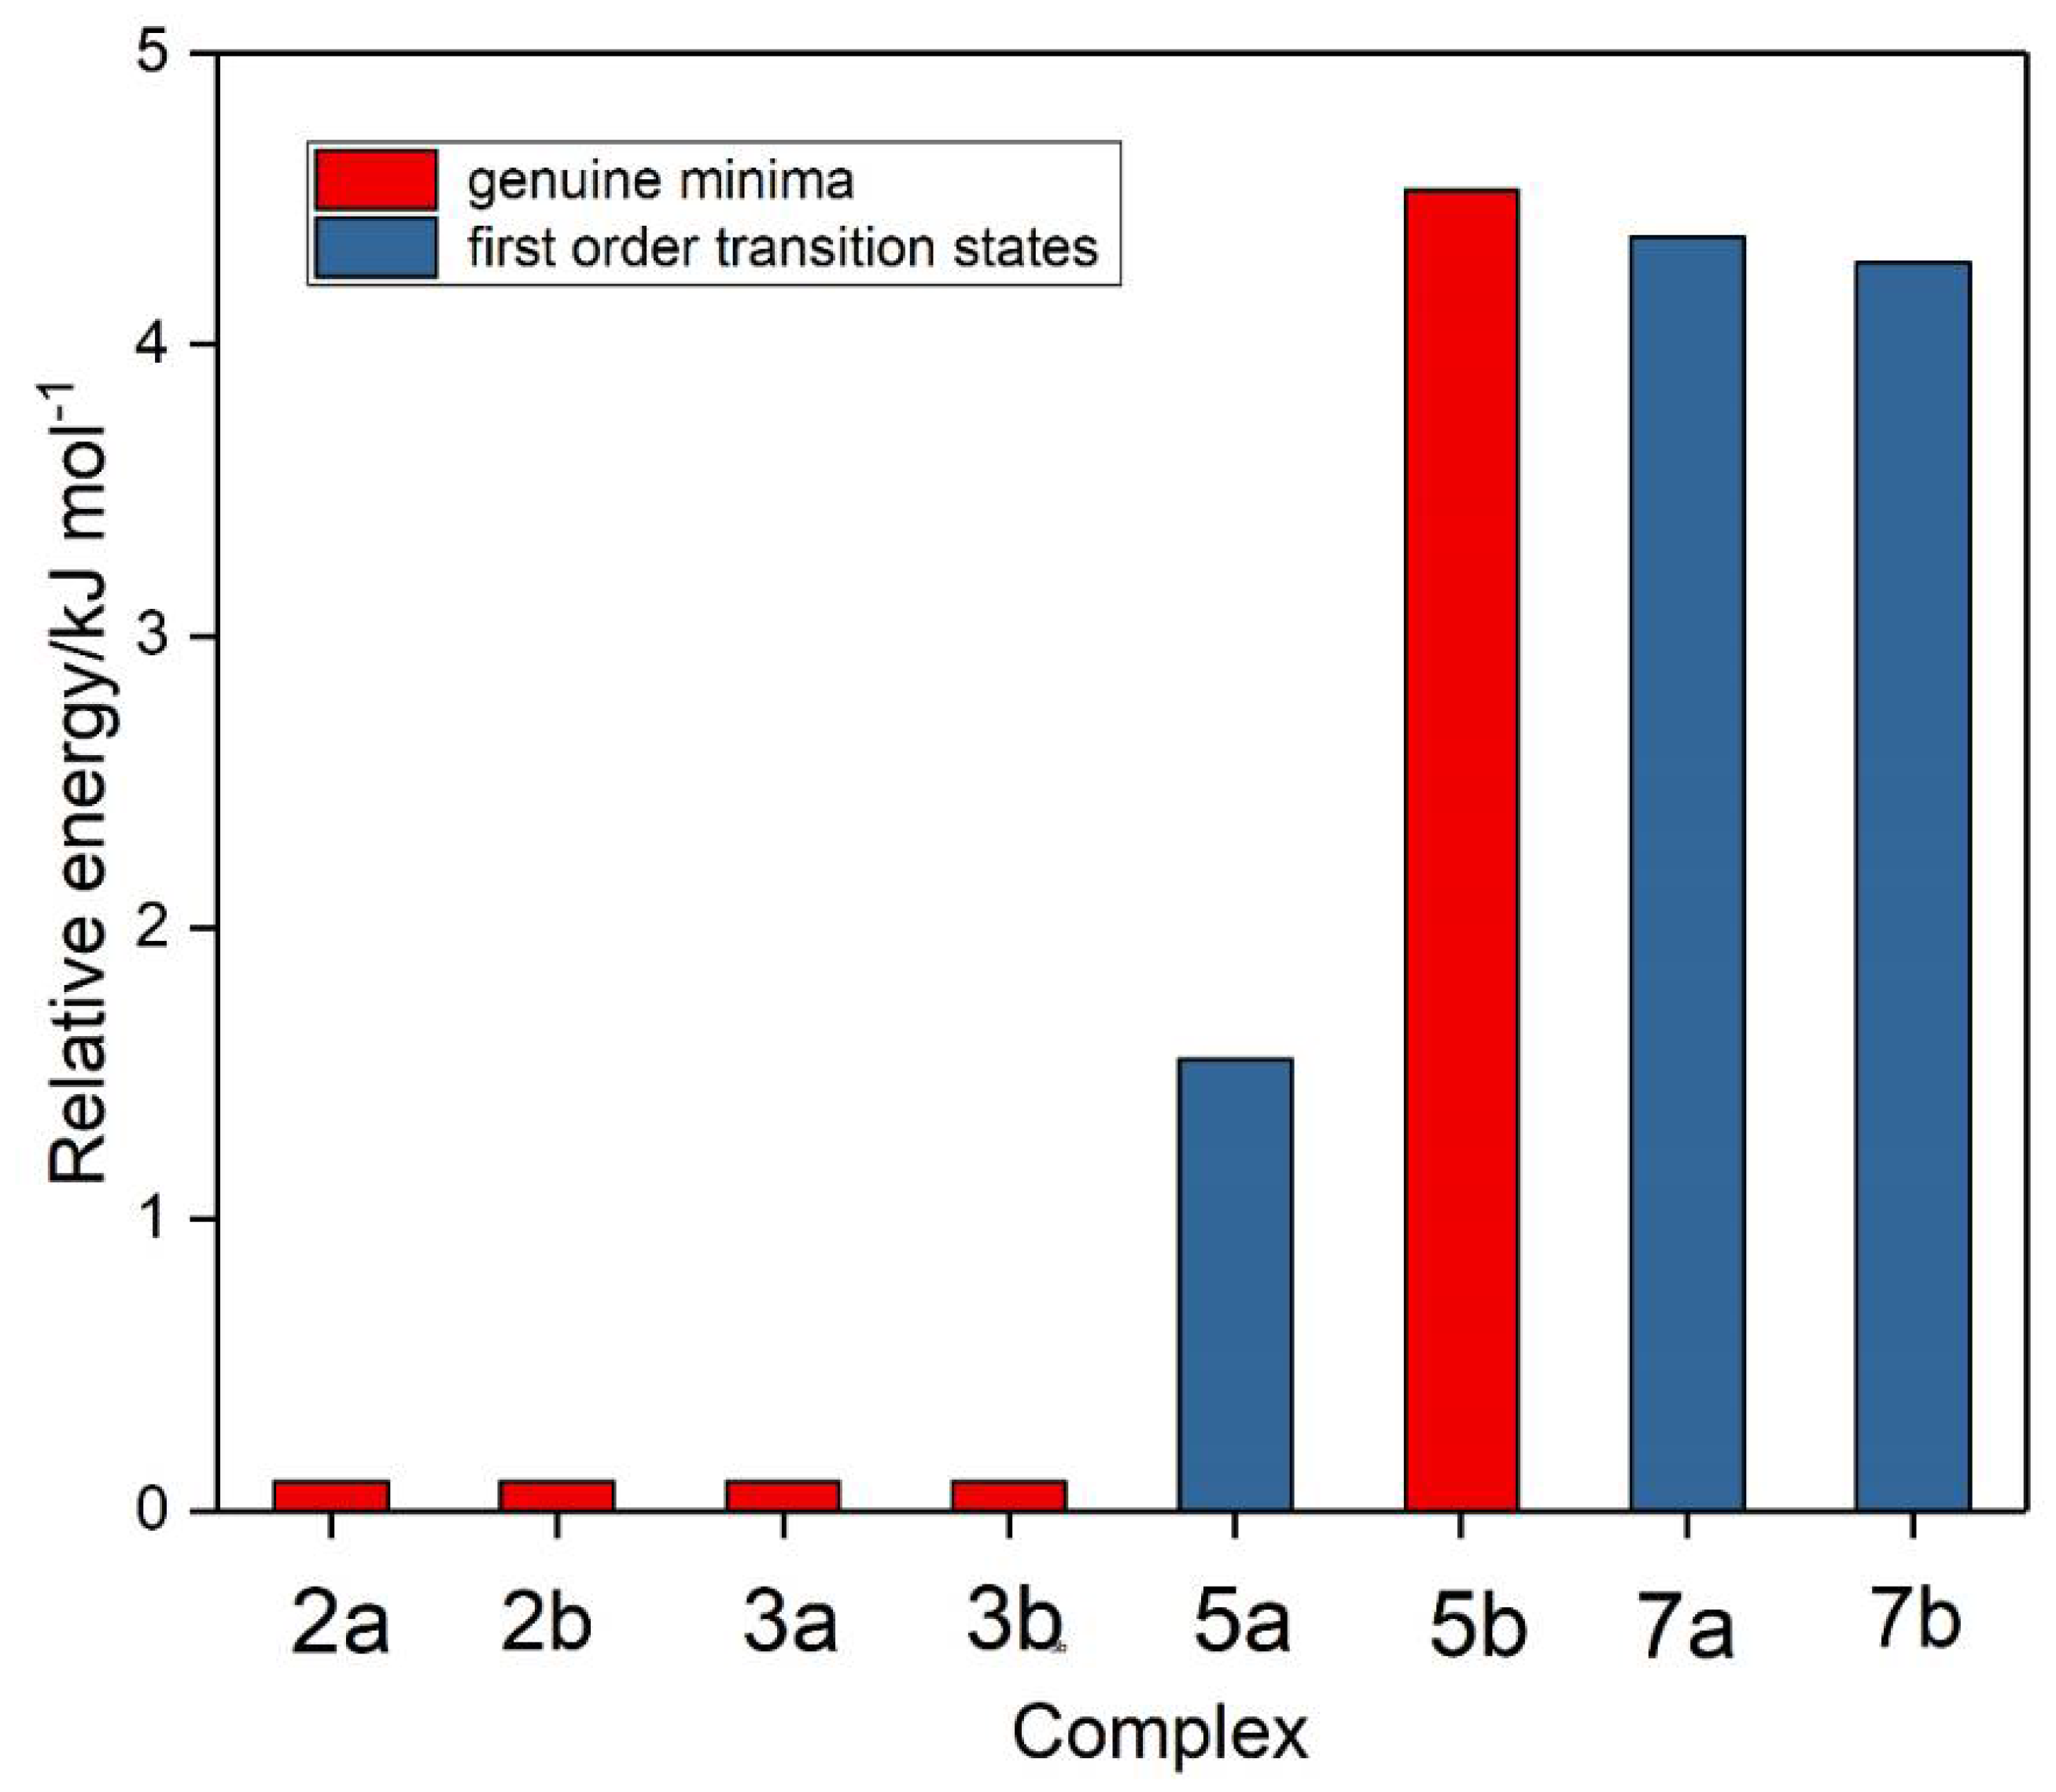
| Complex | Symmetry | E/H | Hessian Index | Relative Energy/ kJ mol−1 |
|---|---|---|---|---|
| 2a | C1 | −773.1098 0096 467 | 0 | 0 |
| 3a | C1 | −773.1098 0095 885 | 0 | 0 |
| 2b | C1 | −773.1098 0095 755 | 0 | 0 |
| 3b | C1 | −773.1098 0095 165 | 0 | 0 |
| 5a | Cs | −773.1092 1061 632 | 1 | 1.55 |
| 7b | Cs | −773.1081 7161 056 | 1 | 4.28 |
| 7a | Cs | −773.1081 3721 831 | 1 | 4.37 |
| 5b | Cs | −773.1080 7683 409 | 0 | 4.53 |
| Complex 2a | Complex 5b | ||||
|---|---|---|---|---|---|
| Parameter | Dimer Value | Difference from Monomer Value | Parameter | Dimer Value | Difference from Monomer Value |
| r(S1O3)/pm | 146.72 | 0.36 | r(O1O2)/pm | 128.03 | −0.35 |
| r(S1O5)/pm | 146.21 | −0.15 | r(O1O3)/pm | 128.69 | 0.31 |
| r(O2O4)/pm | 127.85 | −0.53 | r(S4O5,S4O6)/pm | 146.37 | 0.02 |
| r(O2O6)/pm | 129.76 | 1.39 | ∠O2O1O3/deg | 116.50 | −0.16 |
| ∠O3S1O5/deg | 118.50 | −0.29 | ∠O5S4O6/deg | 118.51 | −0.28 |
| ∠O4O2O6/deg | 116.08 | −0.58 | r(O2…S4)/pm | 313.42 | - |
| r(S1…O4)/pm | 291.71 | - | ∠O1O2…S4/deg | 90.03 | - |
| r(O2…O3)/pm | 291.42 | - | ∠O2…S4O5,O2…S4O6/deg | 83.45 | - |
| ∠O5S1…O4/deg | 113.06 | - | ∠O5S4…O2O1/deg a | 59.89 | - |
| ∠O6O2…O3/deg | 66.12 | - | ∠O6S4…O2O1/deg a | −59.89 | - |
| ∠O5S1O3…O2/deg a | 107.94 | - | |||
| ∠O6O2O4…S1/deg a | 55.56 | - | |||
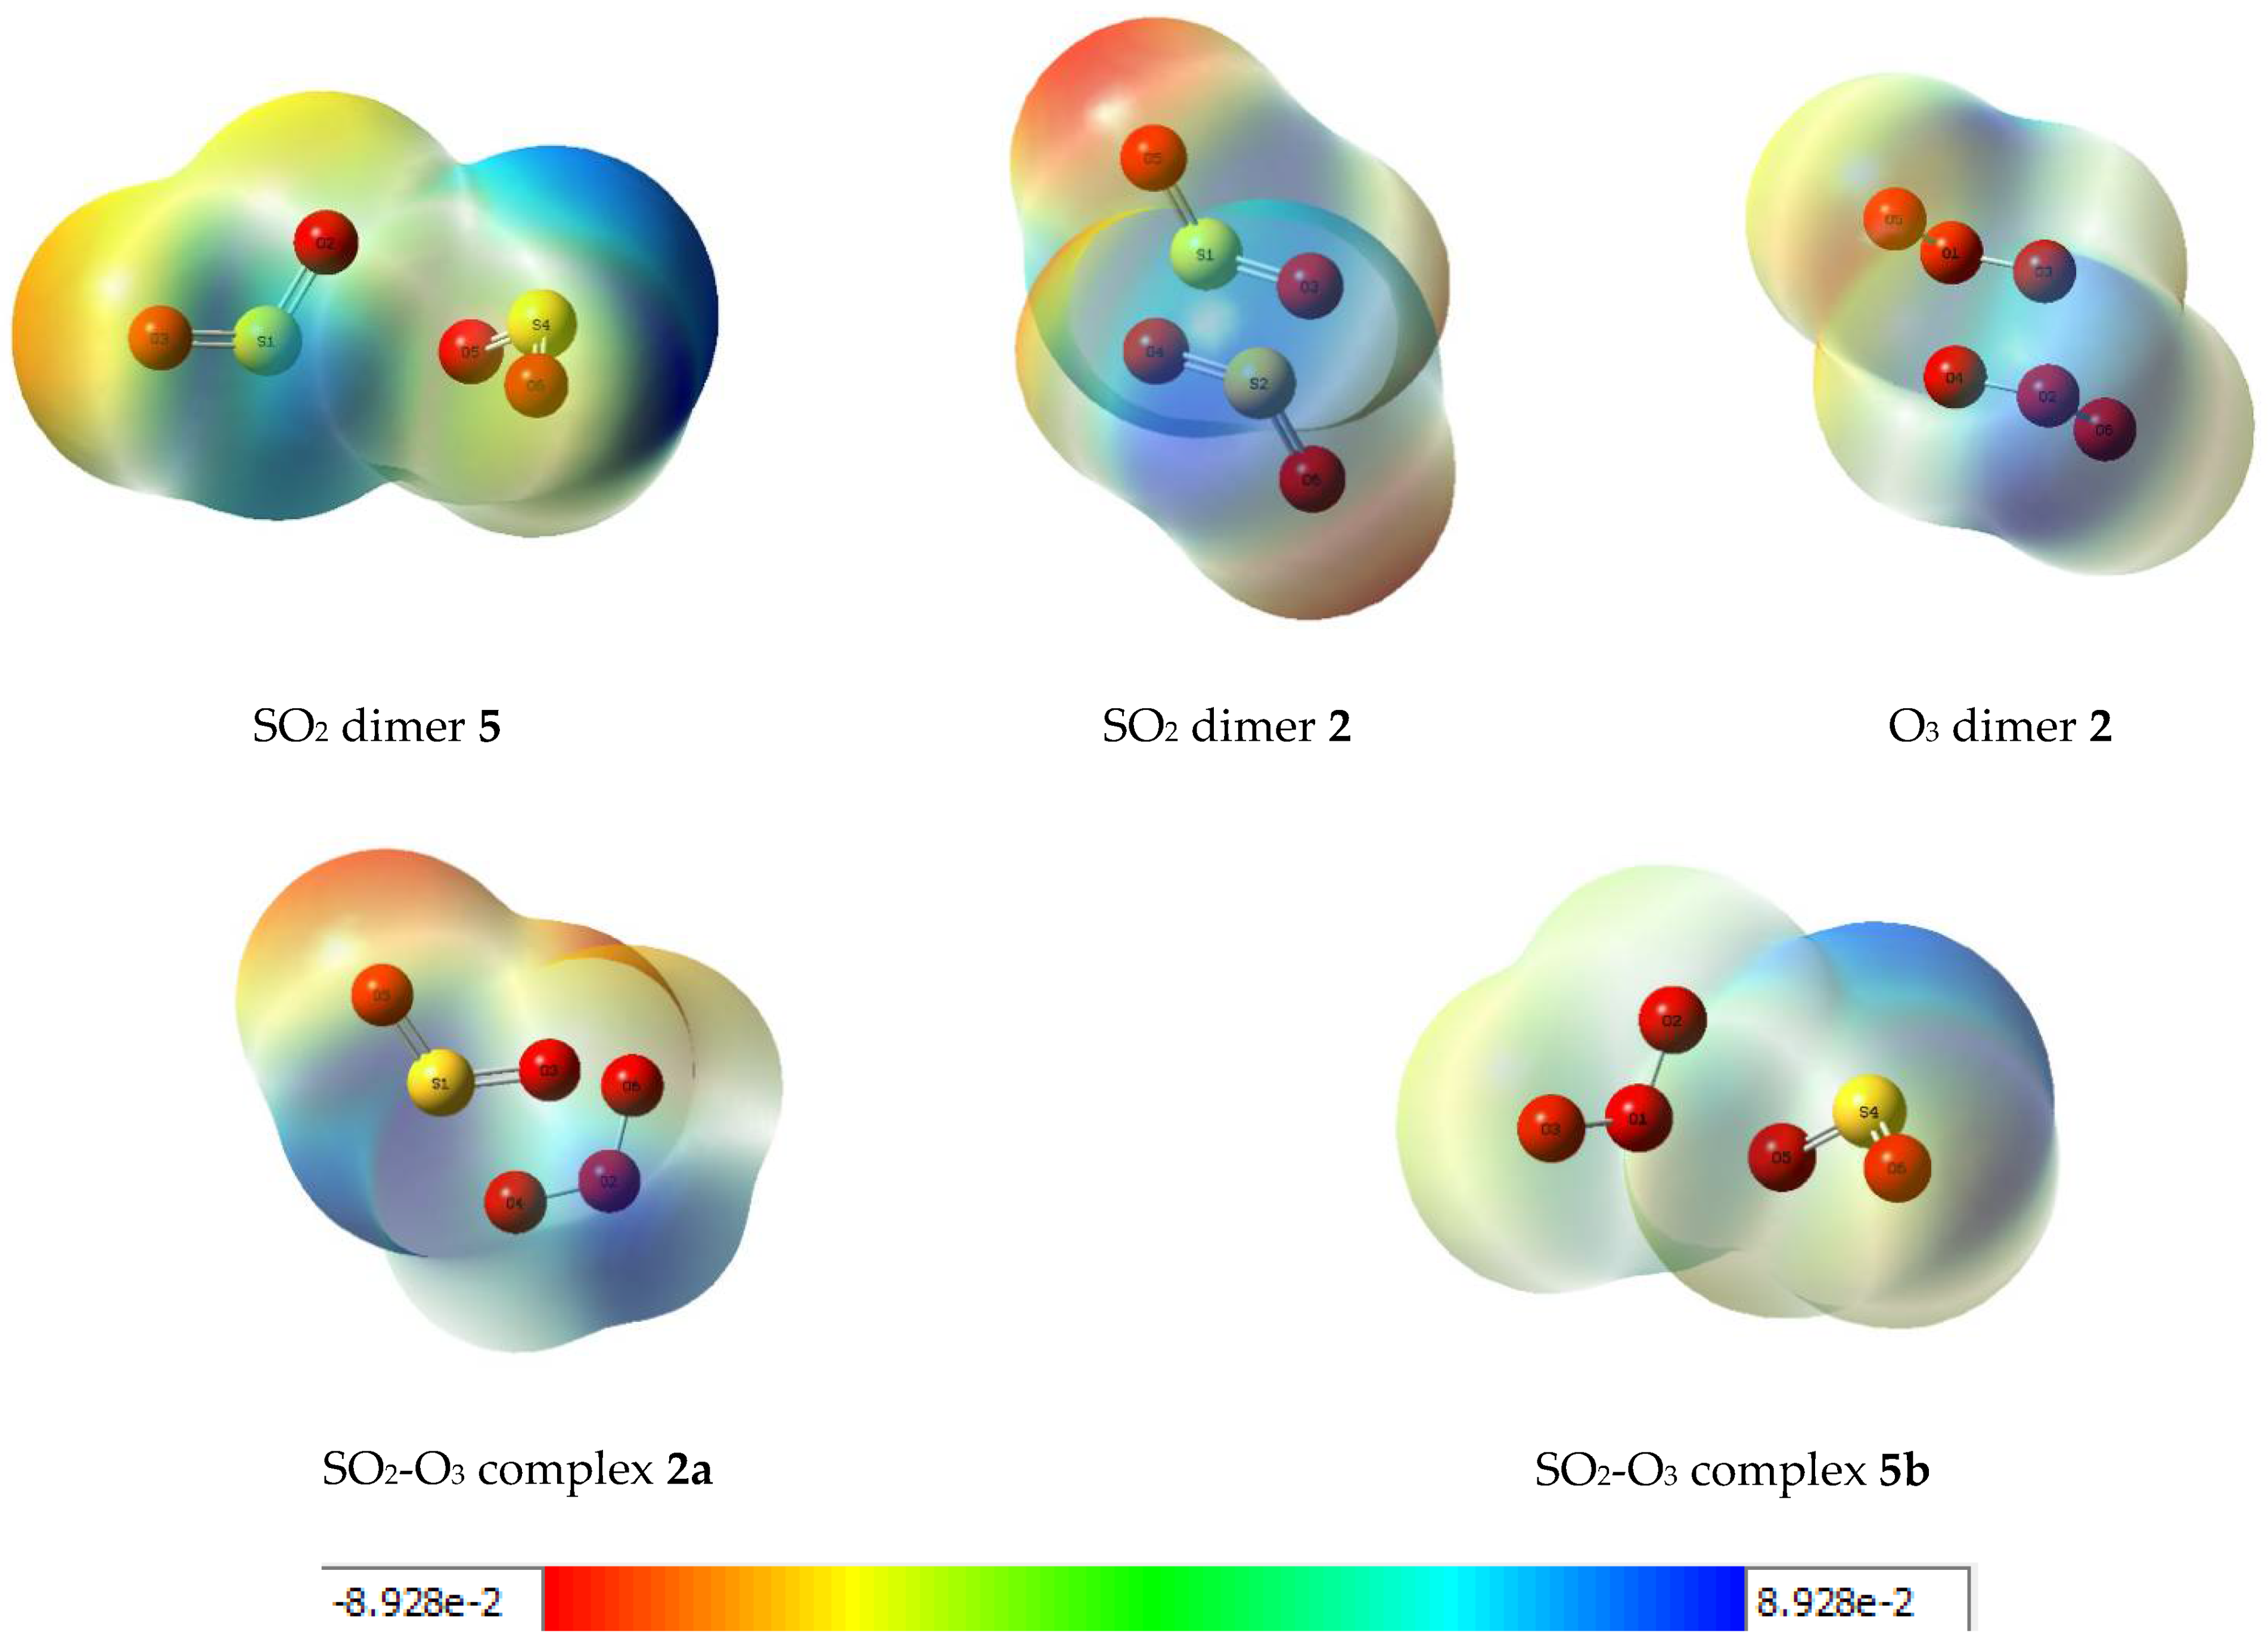
| Species | Interaction Energy/kJ mol−1 | ||||
|---|---|---|---|---|---|
| Raw | BSSE | Corrected | ΔEo | Net | |
| SO2 dimer 5 | 13.26 | 2.38 | 10.88 | 1.93 | 8.95 |
| SO2 dimer 2 | 12.59 | 2.26 | 10.33 | 1.86 | 8.47 |
| O3 dimer 2 | 14.39 | 3.18 | 11.21 | 4.21 | 7.00 |
| SO2-O3 complex 2a | 15.52 | 3.34 | 12.18 | 3.67 | 8.51 |
| SO2-O3 complex 5b | 9.87 | 2.17 | 7.70 | 1.91 | 5.79 |
| No. | Symmetry | Energy/H | Approximate Description a |
|---|---|---|---|
| 1–7 | core | ||
| 8 | a1 | −1.48513 | σ(OSO) |
| 9 | b2 | −1.38753 | σ(OSO) |
| 10 | a1 | −0.88026 | lp(S) |
| 11 | b2 | −0.69488 | lp(O) |
| 12 | a1 | −0.68513 | lp(O) |
| 13 | b1 | −0.65353 | π(OSO) |
| 14 | b2 | −0.54142 | lp(O) |
| 15 | a2 | −0.51405 | π(nb)(OSO) |
| 16 (HOMO) | a1 | −0.49779 | lp(O) |
| 17 (LUMO) | b1 | −0.00680 | π*(OSO) |
| 18 | a1 | 0.06607 | σ*(OSO) |
| 19 | a1 | 0.07129 | σ*(OSO) |
| No. | Symmetry | Energy/H | Approximate Description a,b |
|---|---|---|---|
| 1–3 | core | ||
| 4 | a1 | −1.74257 | σ(OOO) |
| 5 | b2 | −1.42739 | σ(OOO) |
| 6 | a1 | −1.09905 | lp(O2) |
| 7 | a1 | −0.82911 | lp(O1) + lp(O3) |
| 8 | b2 | −0.79824 | lp(O1) − lp(O3) |
| 9 | b1 | −0.77653 | π(OOO) |
| 10 | b2 | −0.56576 | lp(O1) − lp(O3) |
| 11 | a1 | −0.55546 | lp(O1) + lp(O3) |
| 12 (HOMO) | a2 | −0.48829 | π(nb)(O1 − O3) |
| 13 (LUMO) | b1 | −0.05229 | π*(OOO) |
| 14 | b2 | 0.10144 | σ*(OOO) |
| 15 | a1 | 0.10566 | σ*(OOO) |
| Species | SO2 | O3 | ||||||
|---|---|---|---|---|---|---|---|---|
| Symmetry | Mode a | Wavenumber /cm−1 | Shift /cm−1 | Symmetry | Mode | Wavenumber /cm−1 | Shift /cm−1 | |
| SO2 dimer 5 | a′ | ν1 (ED) | 1300.5 | −5.0 | ||||
| ν2 (EA) | 1102.5 | 3.3 | ||||||
| ν3 (ED) | 1099.1 | −0.1 | ||||||
| ν4 (OP) | 500.0 | 6.7 | ||||||
| ν5 (IP) | 494.6 | 1.3 | ||||||
| a″ | ν9 (EA) | 1303.9 | −1.6 | |||||
| SO2 dimer 2 | ag | ν1 (OP) | 1303.2 | −2.3 | ||||
| ν2 (IP) | 1101.4 | 2.2 | ||||||
| ν3 (IP) | 494.9 | 1.6 | ||||||
| au | ν7 (IP) | 1304.9 | −0.6 | |||||
| ν8 (OP) | 1101.5 | 2.3 | ||||||
| ν9 (OP) | 495.8 | 2.5 | ||||||
| O3 dimer 2 | ag | ν1 (OP) | 2419.3 | 175.0 | ||||
| ν2 (IP) | 1150.2 | −7.7 | ||||||
| ν3 (IP) | 743.1 | 1.6 | ||||||
| au | ν7 (IP) | 2172.0 | −72.3 | |||||
| ν8 (OP) | 1151.6 | −6.3 | ||||||
| ν9 (OP) | 742.8 | 1.3 | ||||||
| SO2-O3 complex 2a | a | ν2 | 1301.3 | −4.2 | a | ν1 | 2270.1 | 25.8 |
| ν4 | 1096.5 | −2.7 | ν3 | 1132.1 | −25.8 | |||
| ν6 | 494.2 | 0.9 | ν5 | 740.4 | −1.1 | |||
| SO2-O3 complex 5b | a′ | ν3 | 1102.4 | 3.2 | a′ | ν1 | 2243.8 | −0.5 |
| ν5 | 495.3 | 2.0 | ν2 | 1159.2 | 1.3 | |||
| a″ | ν9 | 1306.2 | 0.7 | ν4 | 744.7 | 3.2 | ||
| Reference | Wavenumber/cm−1 a | |||||
|---|---|---|---|---|---|---|
| ν1(a′) νa(SO2)(ED) | ν2(a′) νs(SO2)(EA) | ν3(a′) νs(SO2)(ED) | ν4(a′) δ(SO2)(OP) | ν5(a′) δ(SO2)(IP) | ν9(a″) νa(SO2)(EA) | |
| This work b | 1300.5 | 1102.5 | 1099.1 | 500.0 | 494.6 | 1303.9 |
| Ref. [13] c | 1343.1, 1345.2 | - | - | - | - | 1341.1 |
| Ref. [15] d | 1348.2 | 1155.8 | 1153.7 | 524.0 | 521.7 | 1345.6 |
| Ref. [19] d | 1349.2 | 1155.2 | 1153.9 | 526.1 | 524.0 | 1346.6 |
| Ref. [20] d | 1346.6 | 1151.8 | 1154.2 | 524.3 | 522.4 | 1349.1 |
| Ref. [21] c | 1341.3 | 1146.6 | - | 519.5 | - | - |
| Ref. [22] c | 1345.1 | 1155.4 | 1153.3 | 527.2 | 521.8 | 1341.1 |
| Ref. [22] d | 1349.4 | 1156.1 | 1154.3 | 526.5 | 524.3 | 1346.5 |
| Ref. [23] c | 1345.8, 1346.5 | 1154.8, 1155.5 | 1152.1, 1152.8 | - | - | 1348.2, 1348.9 |
| Ref. [23] e | 1344.4, 1345.2 | 1152.9, 1153.6 | 1149.9, 1150.5 | - | - | 1346.3, 1347.0 |
| Ref. [23] f | 1338.8, 1339.6 | 1149.0, 1149.8 | 1145.7, 1146.3 | - | - | 1341.1, 1342.0 |
Publisher’s Note: MDPI stays neutral with regard to jurisdictional claims in published maps and institutional affiliations. |
© 2021 by the author. Licensee MDPI, Basel, Switzerland. This article is an open access article distributed under the terms and conditions of the Creative Commons Attribution (CC BY) license (http://creativecommons.org/licenses/by/4.0/).
Share and Cite
Ford, T.A. The Structures, Molecular Orbital Properties and Vibrational Spectra of the Homo- and Heterodimers of Sulphur Dioxide and Ozone. An Ab Initio Study. Molecules 2021, 26, 626. https://doi.org/10.3390/molecules26030626
Ford TA. The Structures, Molecular Orbital Properties and Vibrational Spectra of the Homo- and Heterodimers of Sulphur Dioxide and Ozone. An Ab Initio Study. Molecules. 2021; 26(3):626. https://doi.org/10.3390/molecules26030626
Chicago/Turabian StyleFord, Thomas A. 2021. "The Structures, Molecular Orbital Properties and Vibrational Spectra of the Homo- and Heterodimers of Sulphur Dioxide and Ozone. An Ab Initio Study" Molecules 26, no. 3: 626. https://doi.org/10.3390/molecules26030626
APA StyleFord, T. A. (2021). The Structures, Molecular Orbital Properties and Vibrational Spectra of the Homo- and Heterodimers of Sulphur Dioxide and Ozone. An Ab Initio Study. Molecules, 26(3), 626. https://doi.org/10.3390/molecules26030626