1. Introduction
Cancer remains a global burden despite the medical advances made every day, with an estimated 9.6 million deaths worldwide in 2018. Colorectal cancer specifically accounts for 1.8 million cases annually, with approximately 70% of deaths occurring in low- and middle-income countries [
1]. Colon cancer is often only detected when symptoms appear during advanced stages, and standard treatment includes surgery, chemotherapy, radiation therapy, immunotherapy, and nutritional support therapy [
2]. Although surgical resection is the primary treatment option for colorectal cancer, more than half of the patients present with metastasis. Improving survival rates of patients with advanced colorectal cancer while providing symptomatic treatment are attempted with chemotherapy [
3]. However, the risk for chemotherapeutic toxicity increases in older patients, with side effects of varying severity [
4,
5].
Patients suffering from this disease are usually desperate for a cure, or simply to reduce the severe side effects of conventional treatment. To this end, they frequently turn to alternative treatments, which typically include plant-based medicines or phytomedicines [
6]. Although these treatments may be curative or beneficial, they may also have adverse effects and remain unproven. However, plants have been the source of new, clinically significant anticancer compounds, and 60% of anticancer agents currently used were derived from natural sources [
7].
Two South African medicinal plants were identified as potential sources to improve treatment of colorectal cancer.
Sutherlandia frutescens, commonly known as cancer bush, have been claimed to have anticancer properties by traditional healers, and these claims have been partially validated [
8,
9]. Several studies have also confirmed that no physiological toxicity is associated with the use of
S. frutescens [
10,
11].
Xysmalobium undulatum, also known as Uzara, is one of the most widely used phytomedicines in South Africa [
12], and is known to contain plant cardenolides which have emerged as promising new cancer treating agents [
13]. Although a few studies have shown some potential anticancer effects of
X. undulatum in vitro, it is not clear if the effects were cancer-specific or if the extracts are cytotoxic in general at high concentrations [
14,
15,
16]. These two plants were selected as one has been studied extensively and the other only very limited.
The standard drug development pipeline must still be followed when studying phytomedicines. However, only an estimated 3.4% of new cancer drug candidates are successful in clinical trials [
17]. This is probably due to the lack of physiological relevance of the current models used in this pipeline. The use of animal models in research is also expensive and ethically challenging [
18]. Clearly, better in vitro models with high throughput capacity is crucial for cancer treatment screening [
19]. It has been suggested that three-dimensional (3D) cell culture models are ideal to bridge the gap between in vitro and in vivo preclinical studies, due to their better correlation to human physiology and ability to mimic the microenvironment of cells and organs in vivo [
20,
21].
We recently developed and validated a sodium alginate encapsulated 3D colorectal cancer cell culture model, by culturing LS180 cells using the dynamic clinostat bioreactor technique [
22]. We demonstrated the reactivity of the model to anticancer treatments, and its suitability as an in vitro screening tool to evaluate potential treatments for colorectal cancer. In the previous publication, we demonstrated that we bioengineered the cell constructs in such a way that the in vitro model presents in vivo-like behavior, therefore referred to as functional spheroids or mini-tumors [
22].
The aim of this study was to use this new LS180 functional spheroid model to evaluate the potential of crude aqueous extracts of S. frutescens and X. undulatum as anticancer treatments for colorectal cancer. This was attempted by establishing the 50% inhibitory concentrations (IC50) of the selected phytomedicines in LS180 cells cultured as two-dimensional (2D) monolayers, using the 3-(4,5-dimethylthiazol-2-yl)-2,5-diphenyltetrazolium bromide (MTT) cell viability assay. Then, 50 12-day-old sodium alginate encapsulated spheroids per biological replicate were treated for 96 h with these IC50 concentrations and either half that dose ([IC50]/2 for S. frutescens), or two times the IC50 concentration (2[IC50] for X. undulatum). This was dependent on the maximal solubility achievable for each extract. During the treatment, various parameters were measured as indicators of cell viability. These parameters included intracellular adenosine triphosphate (ATP) content, extracellular adenylate kinase (AK) release, glucose consumption, and cell growth in terms of soluble protein content were also measured. Relative gene expression of some cytochrome P450 (CYP450) metabolic enzymes was measured using a real-time reverse transcription polymerase chain reaction-based (qRT-PCR) assay. These enzymes can directly affect bioavailability and drug resistance.
We established that the S. frutescens and X. undulatum crude aqueous extracts both showed notable cytotoxic effects and potential anticancer activity relative to the known chemotherapeutic drug paclitaxel, with decreased growth, cell viability, and glucose consumption following treatment.
3. Discussion
In this study, sodium alginate encapsulated LS180 spheroids were treated for 96 h with 0.6 × 10⁻² µg·mL−1·µg−1 protein for paclitaxel [IC50], 20.1 × 10⁻² mg·mL−1·µg−1 protein for S. frutescens [IC50]/2, 40.3 × 10⁻² mg·mL−1·µg−1 protein for S. frutescens [IC50], 0.8 × 10⁻² mg·mL−1·µg−1 protein for X. undulatum [IC50] and 1.5 × 10⁻² mg·mL−1·µg−1 protein for X. undulatum 2[IC50], relative to an untreated control.
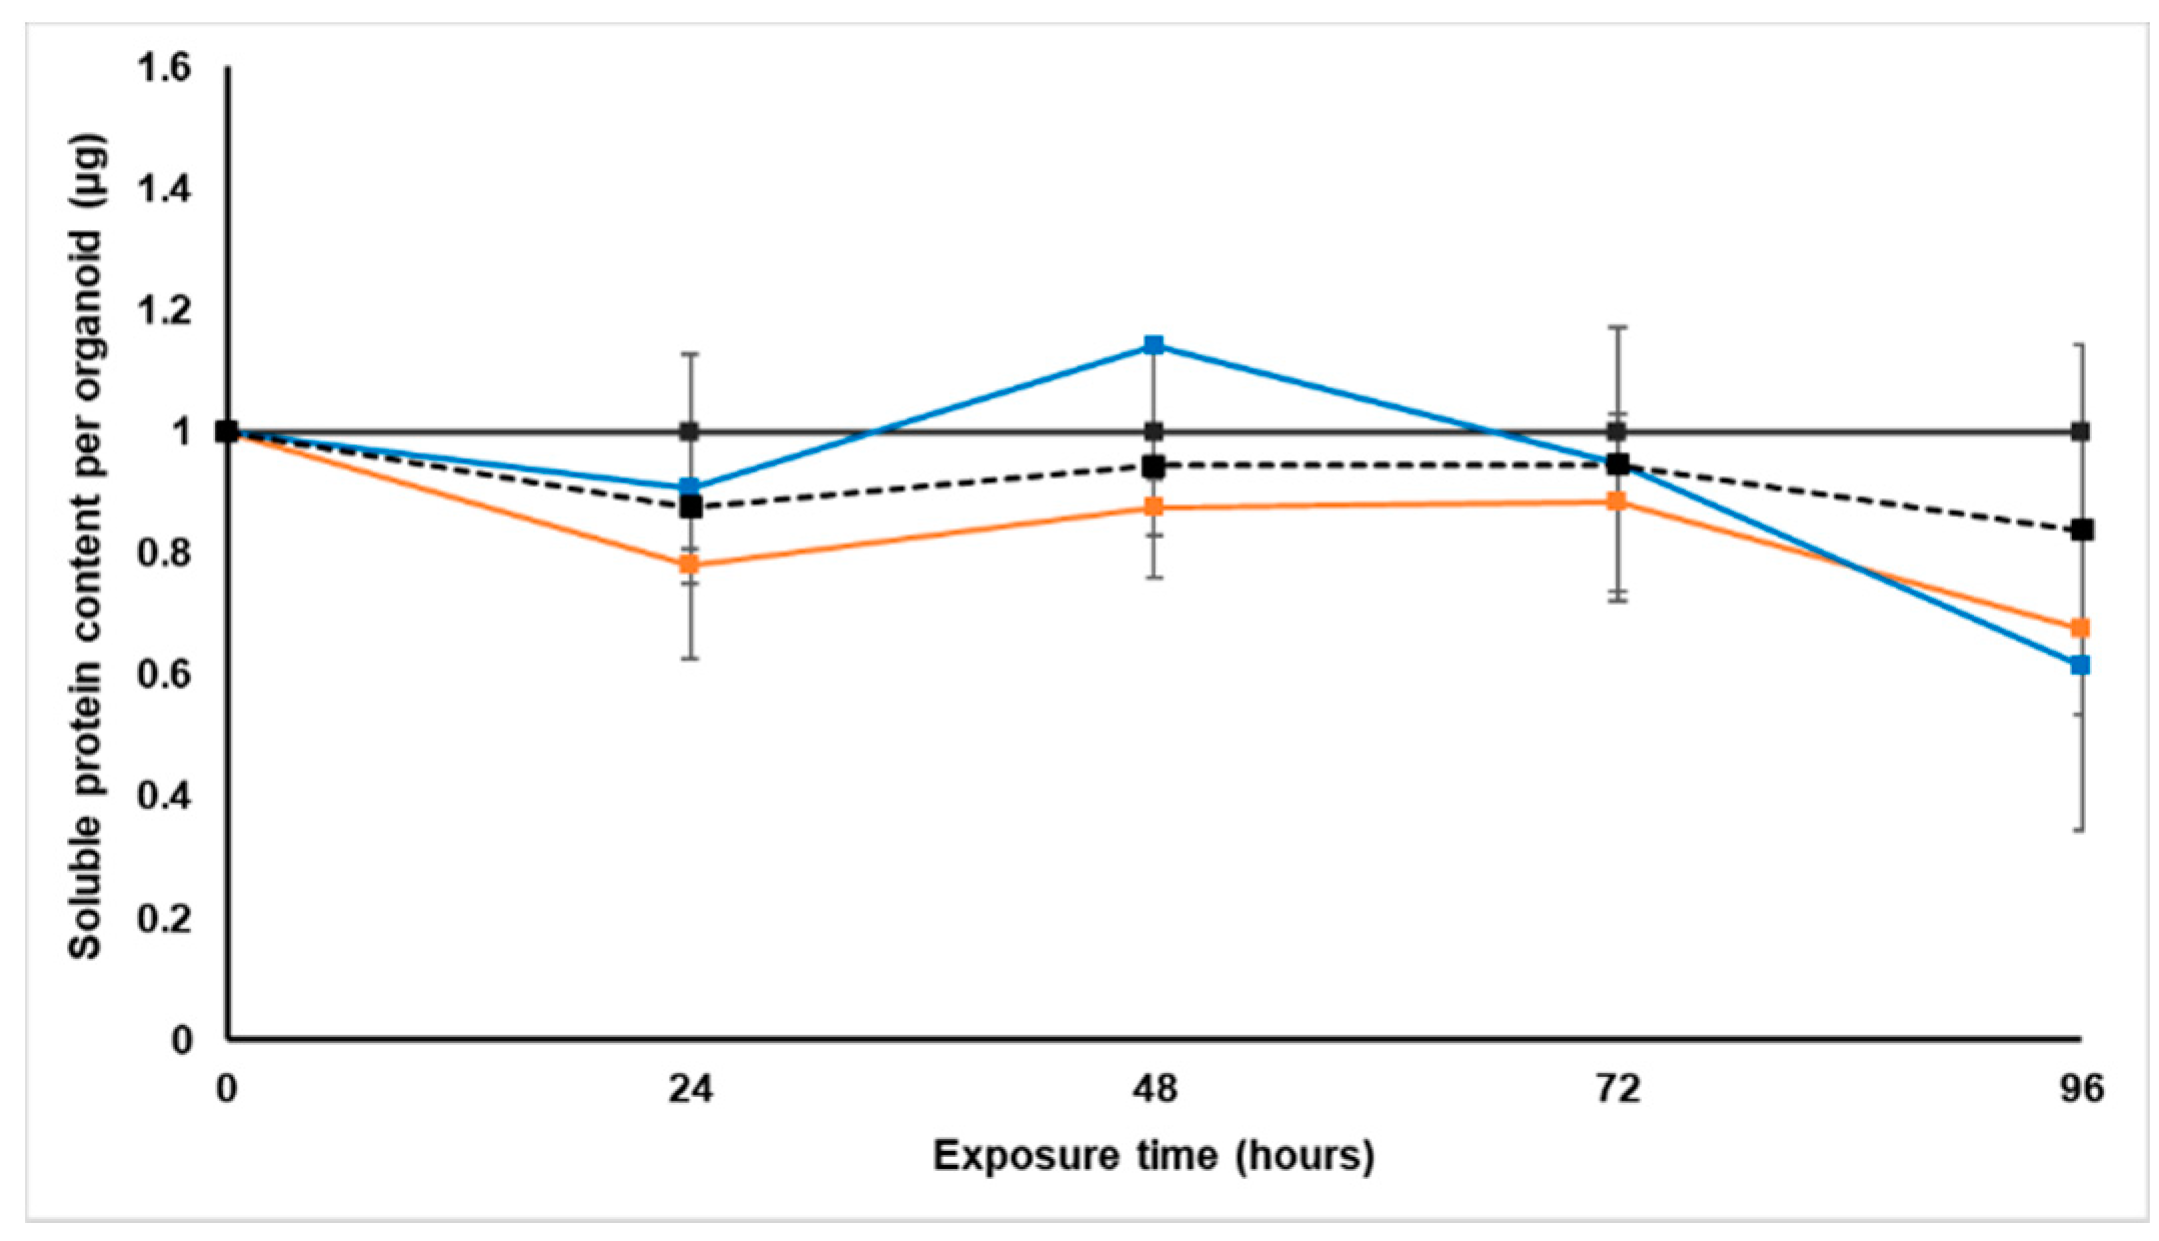
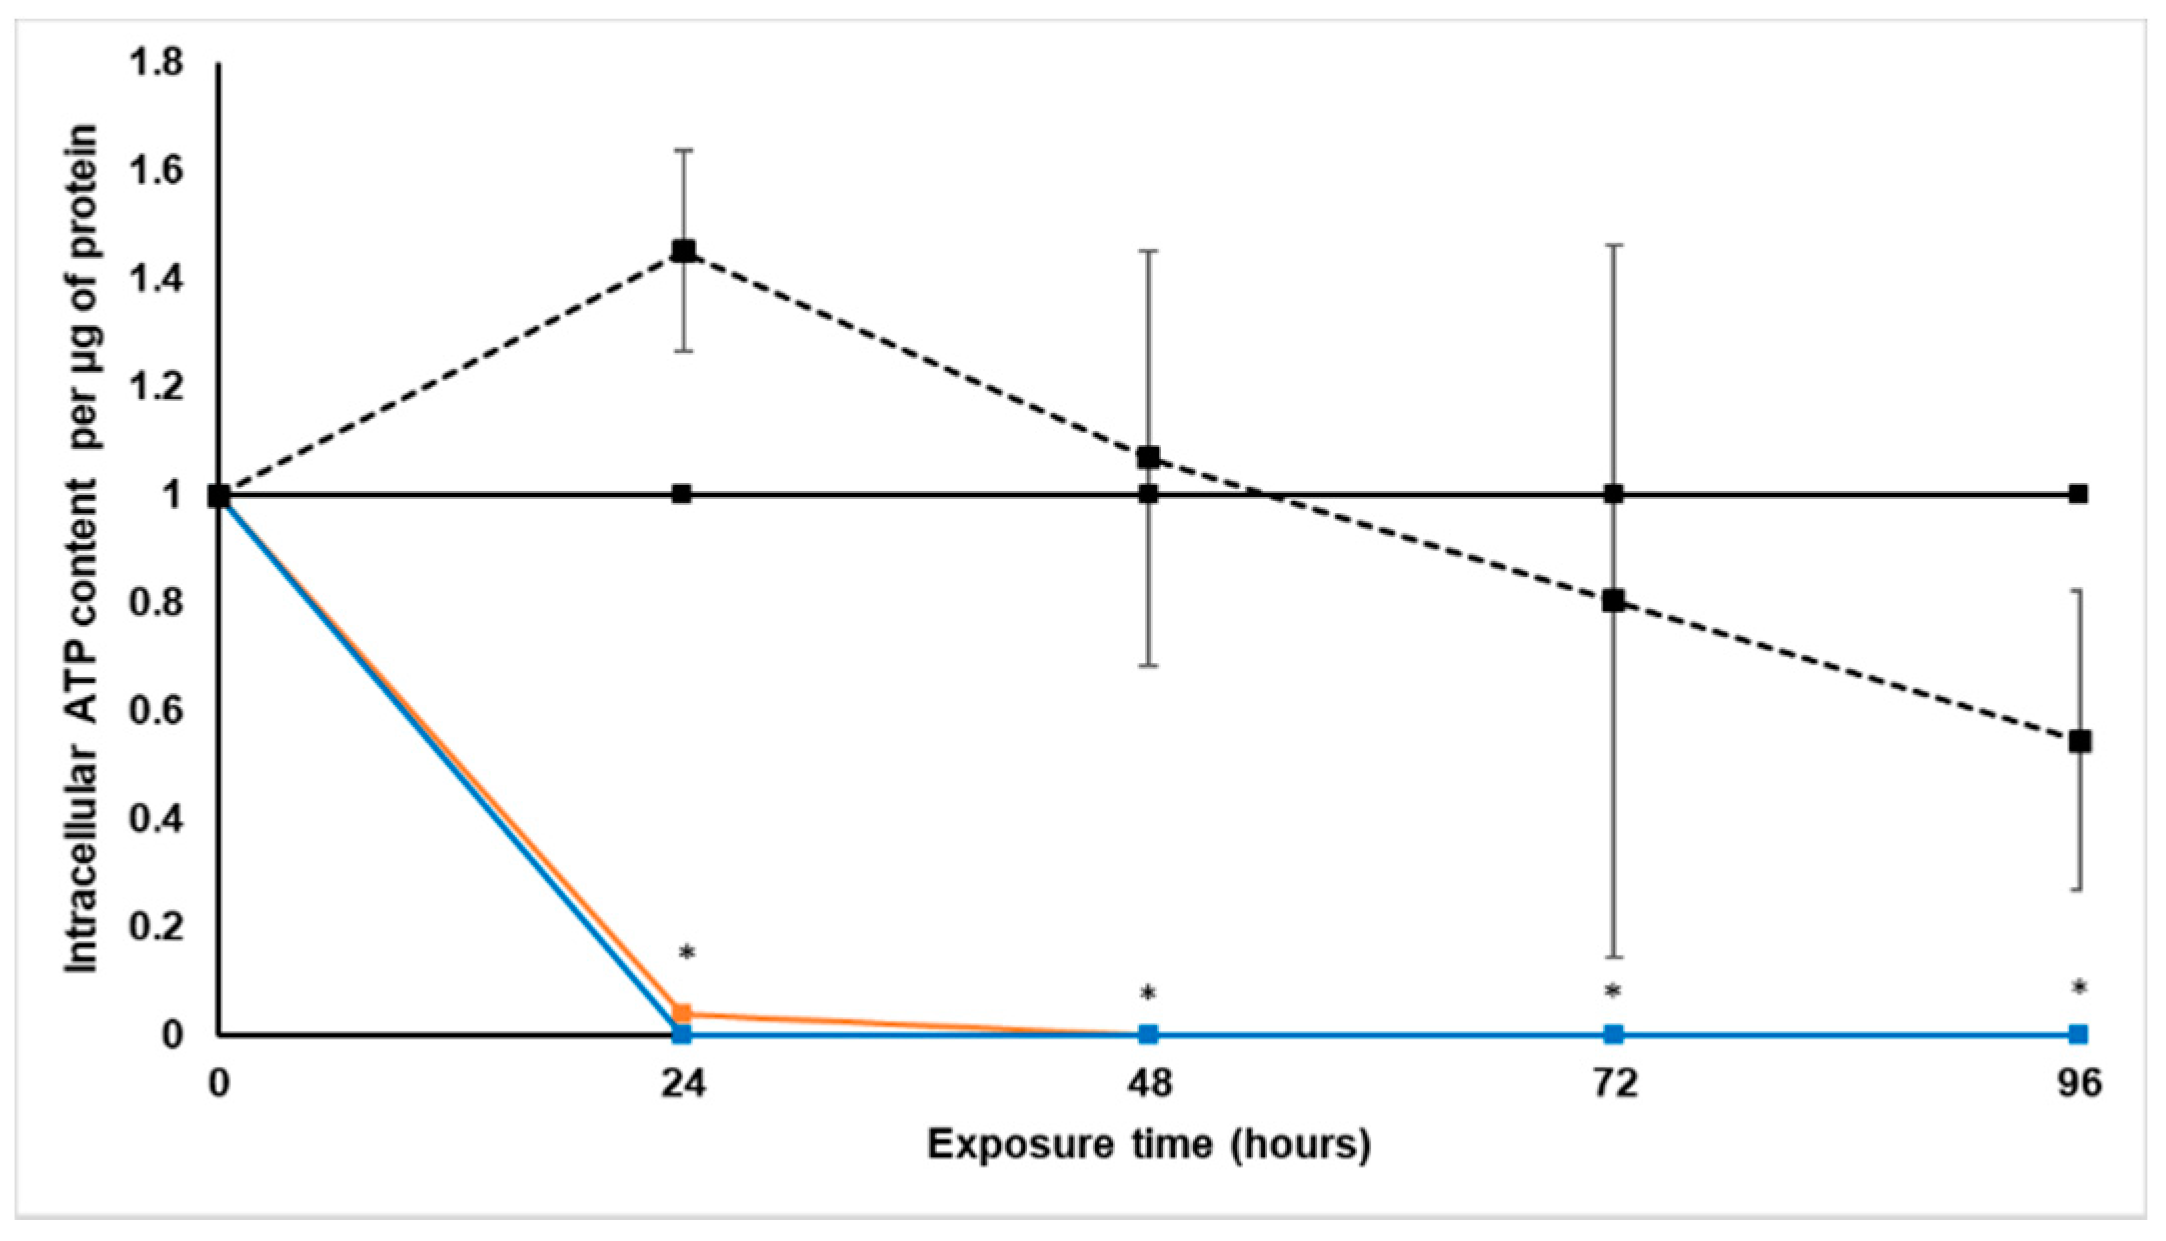
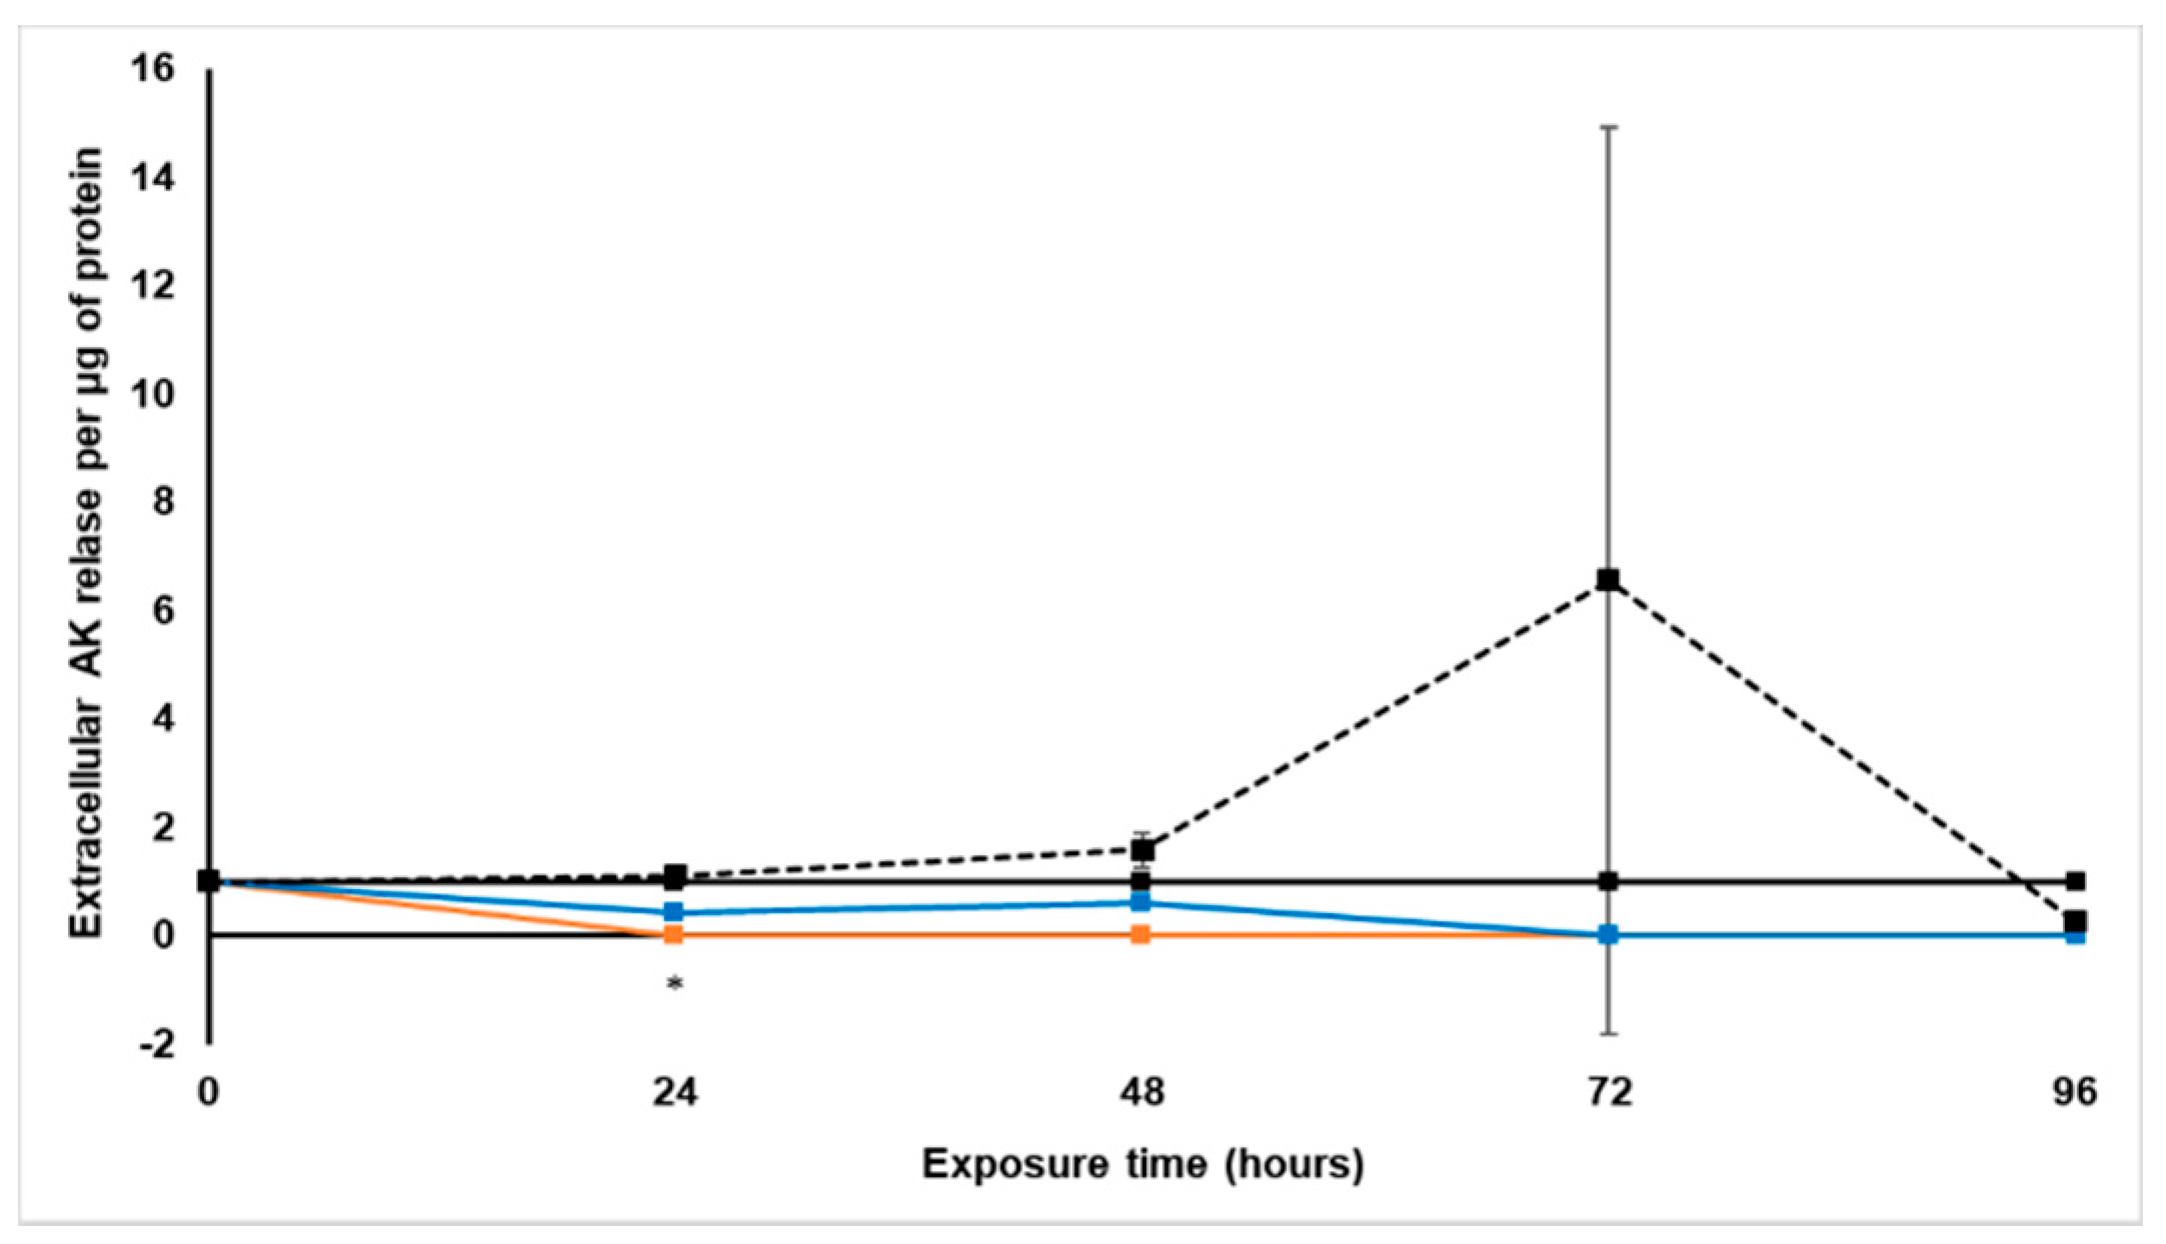
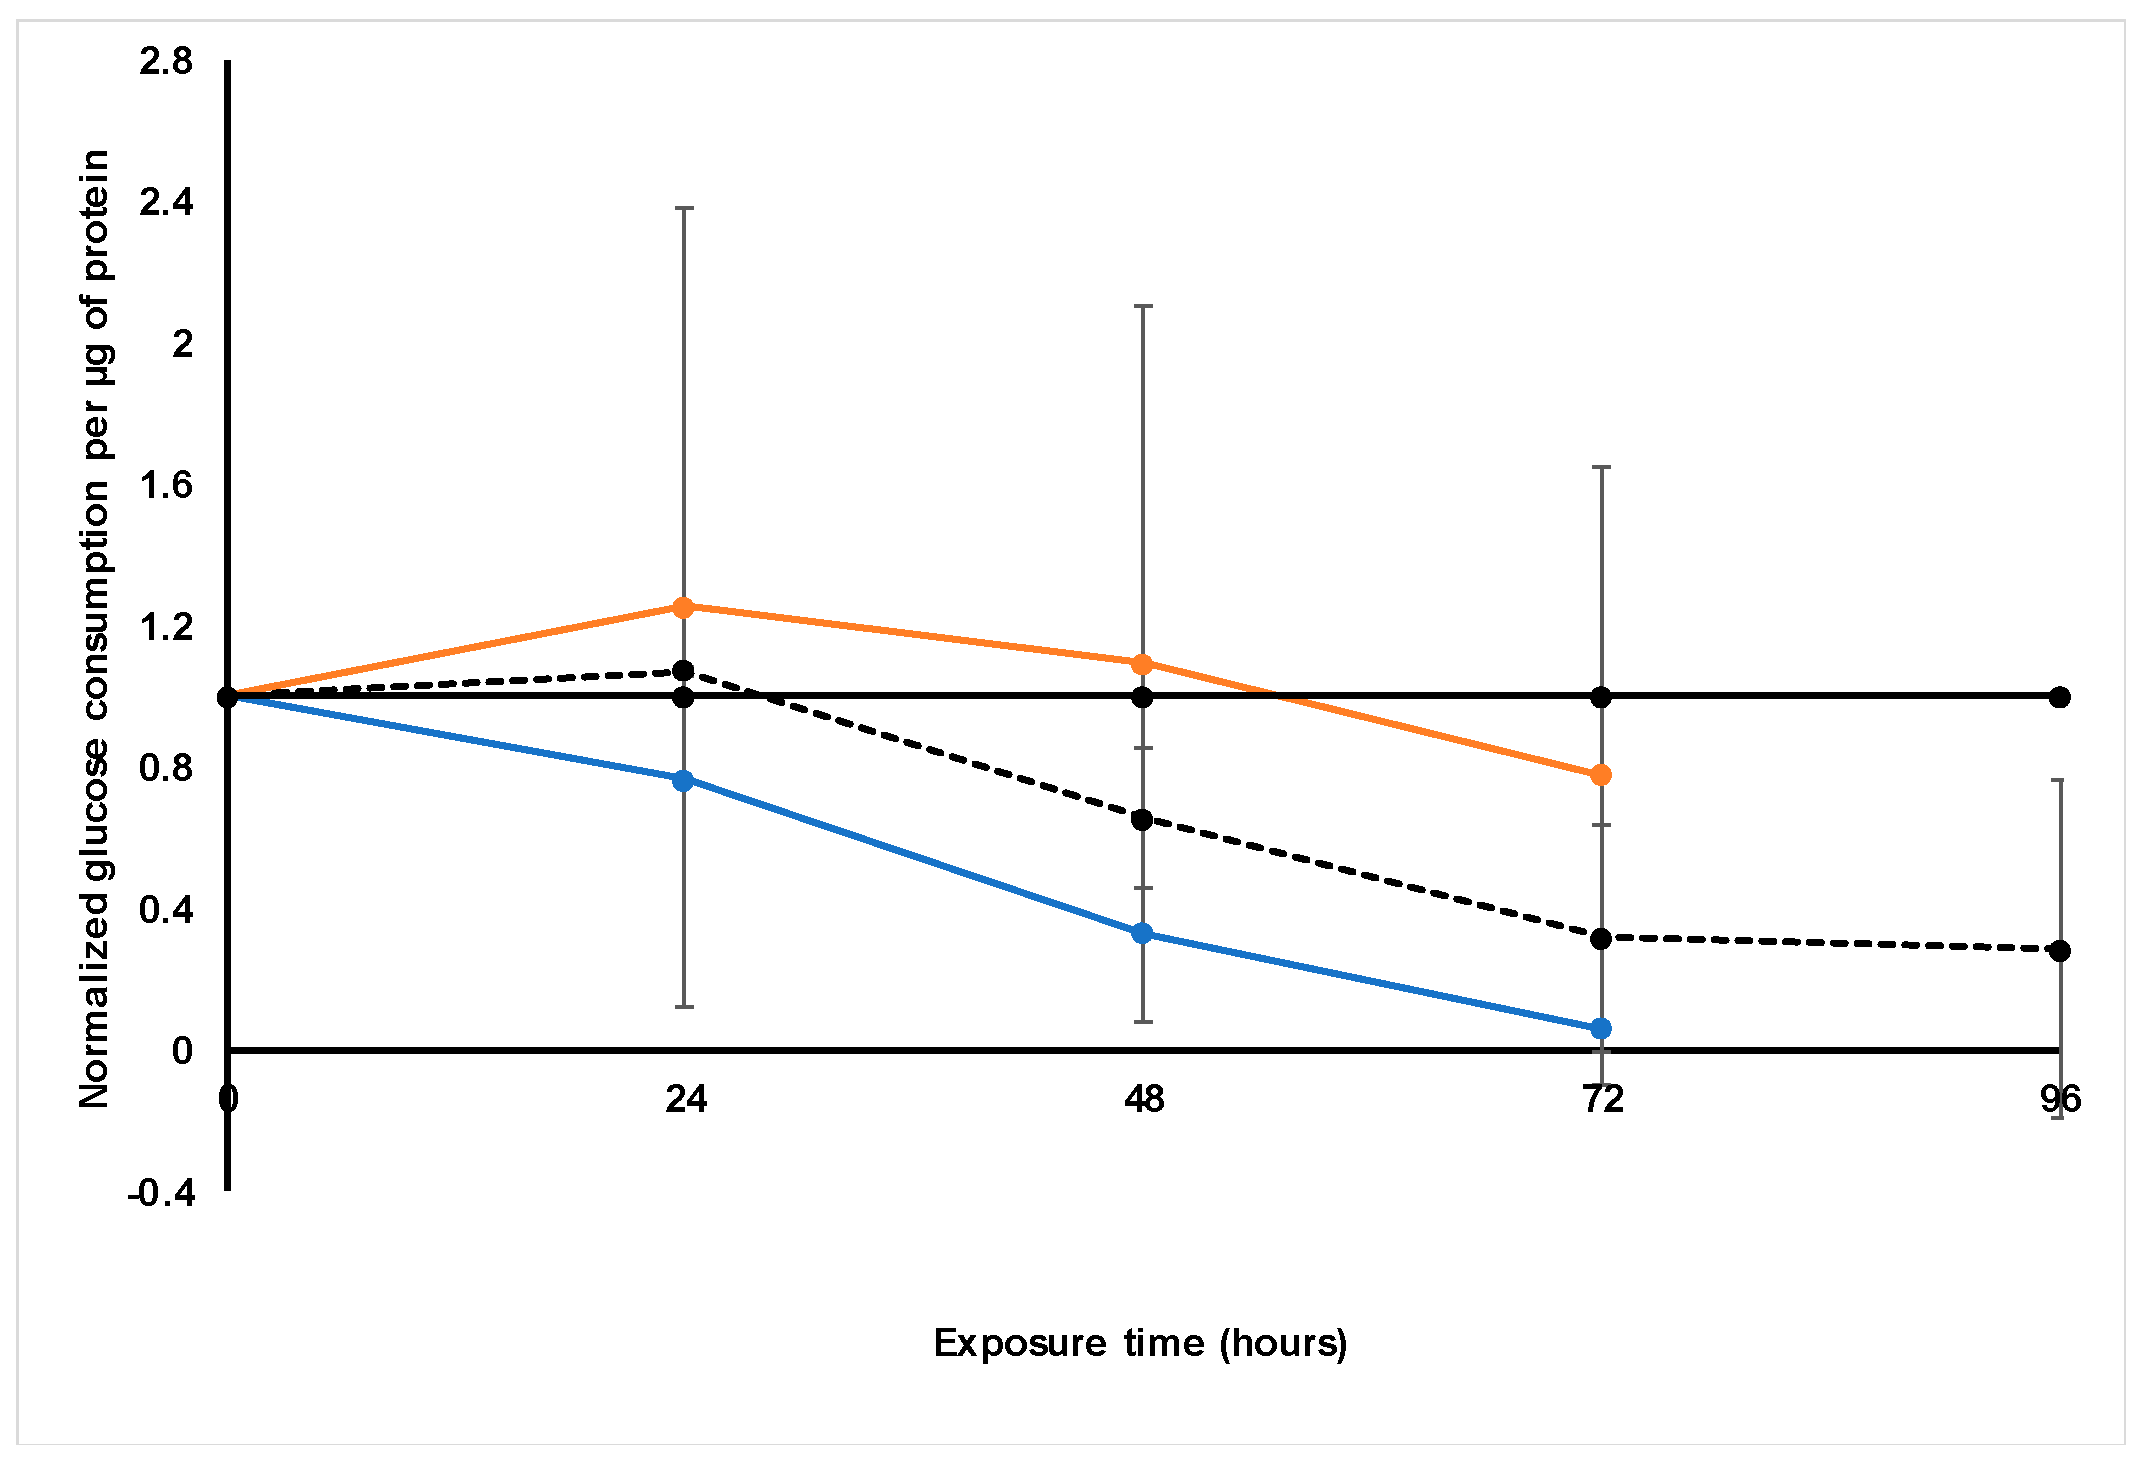
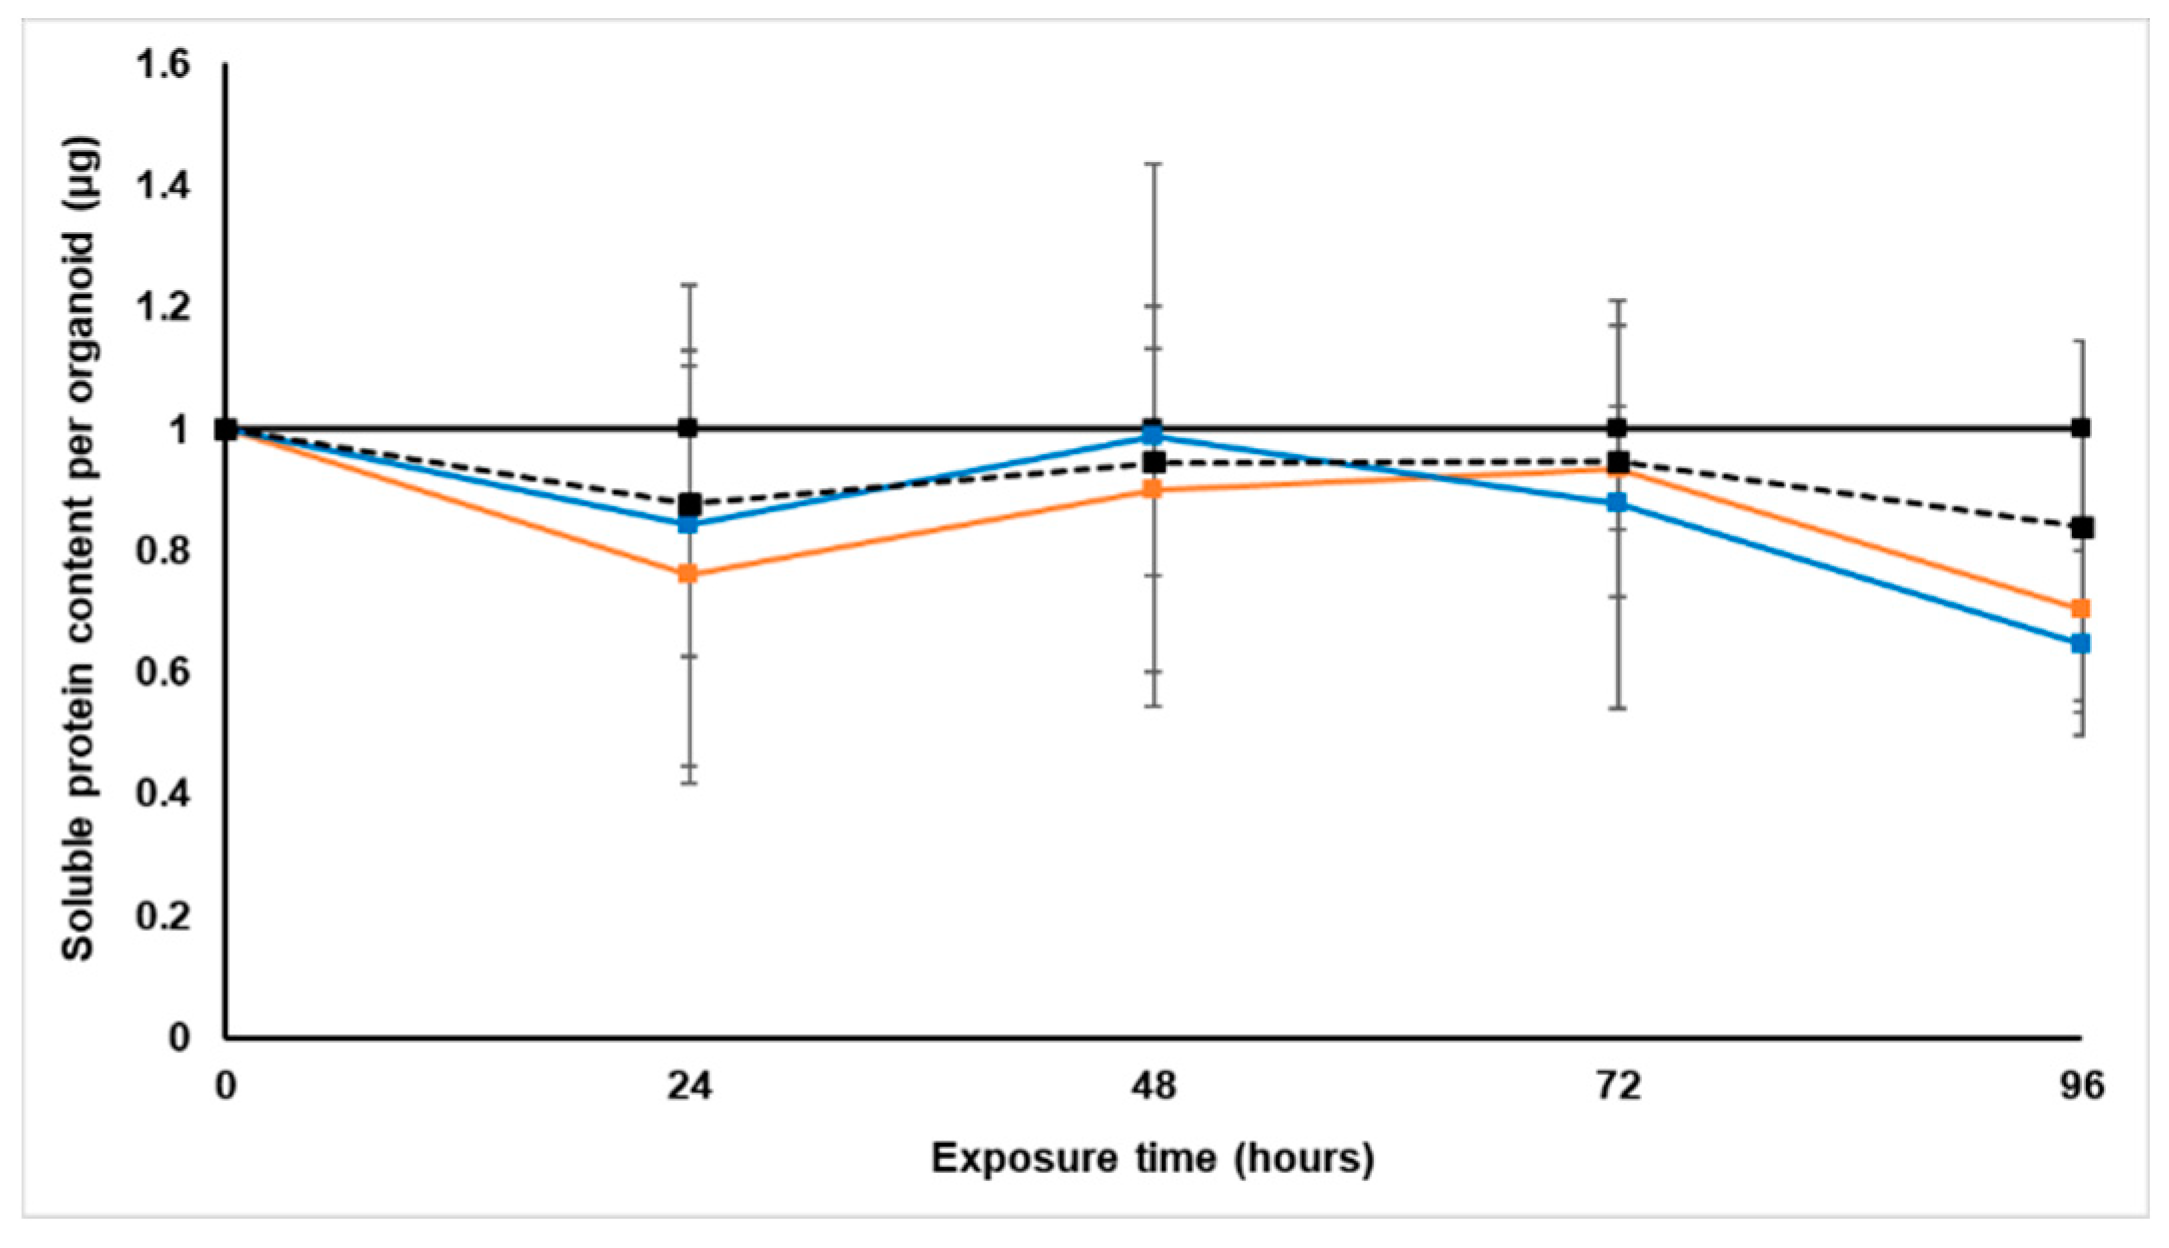
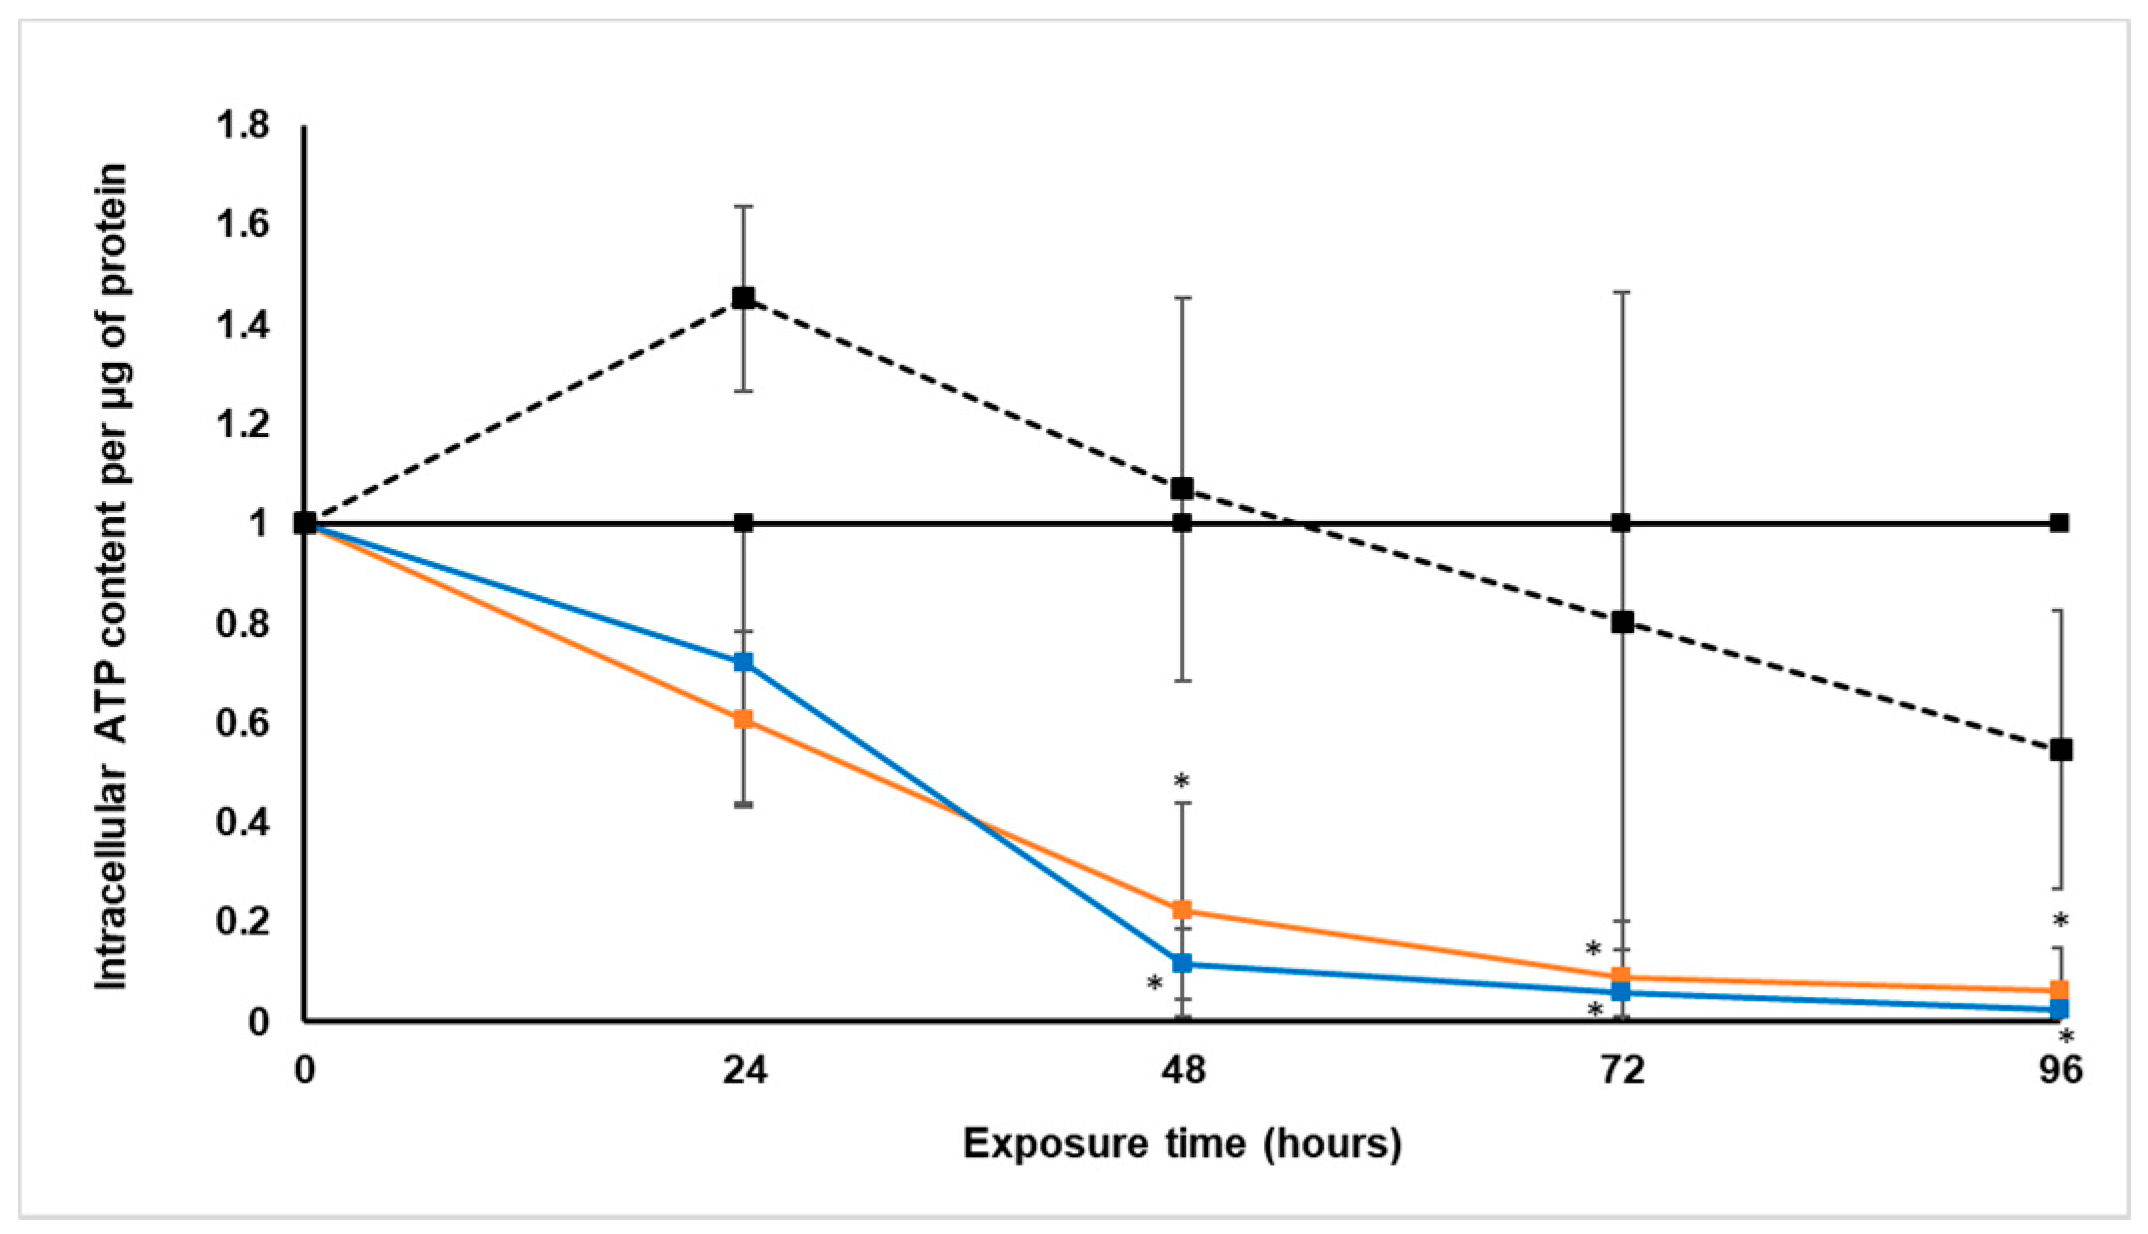
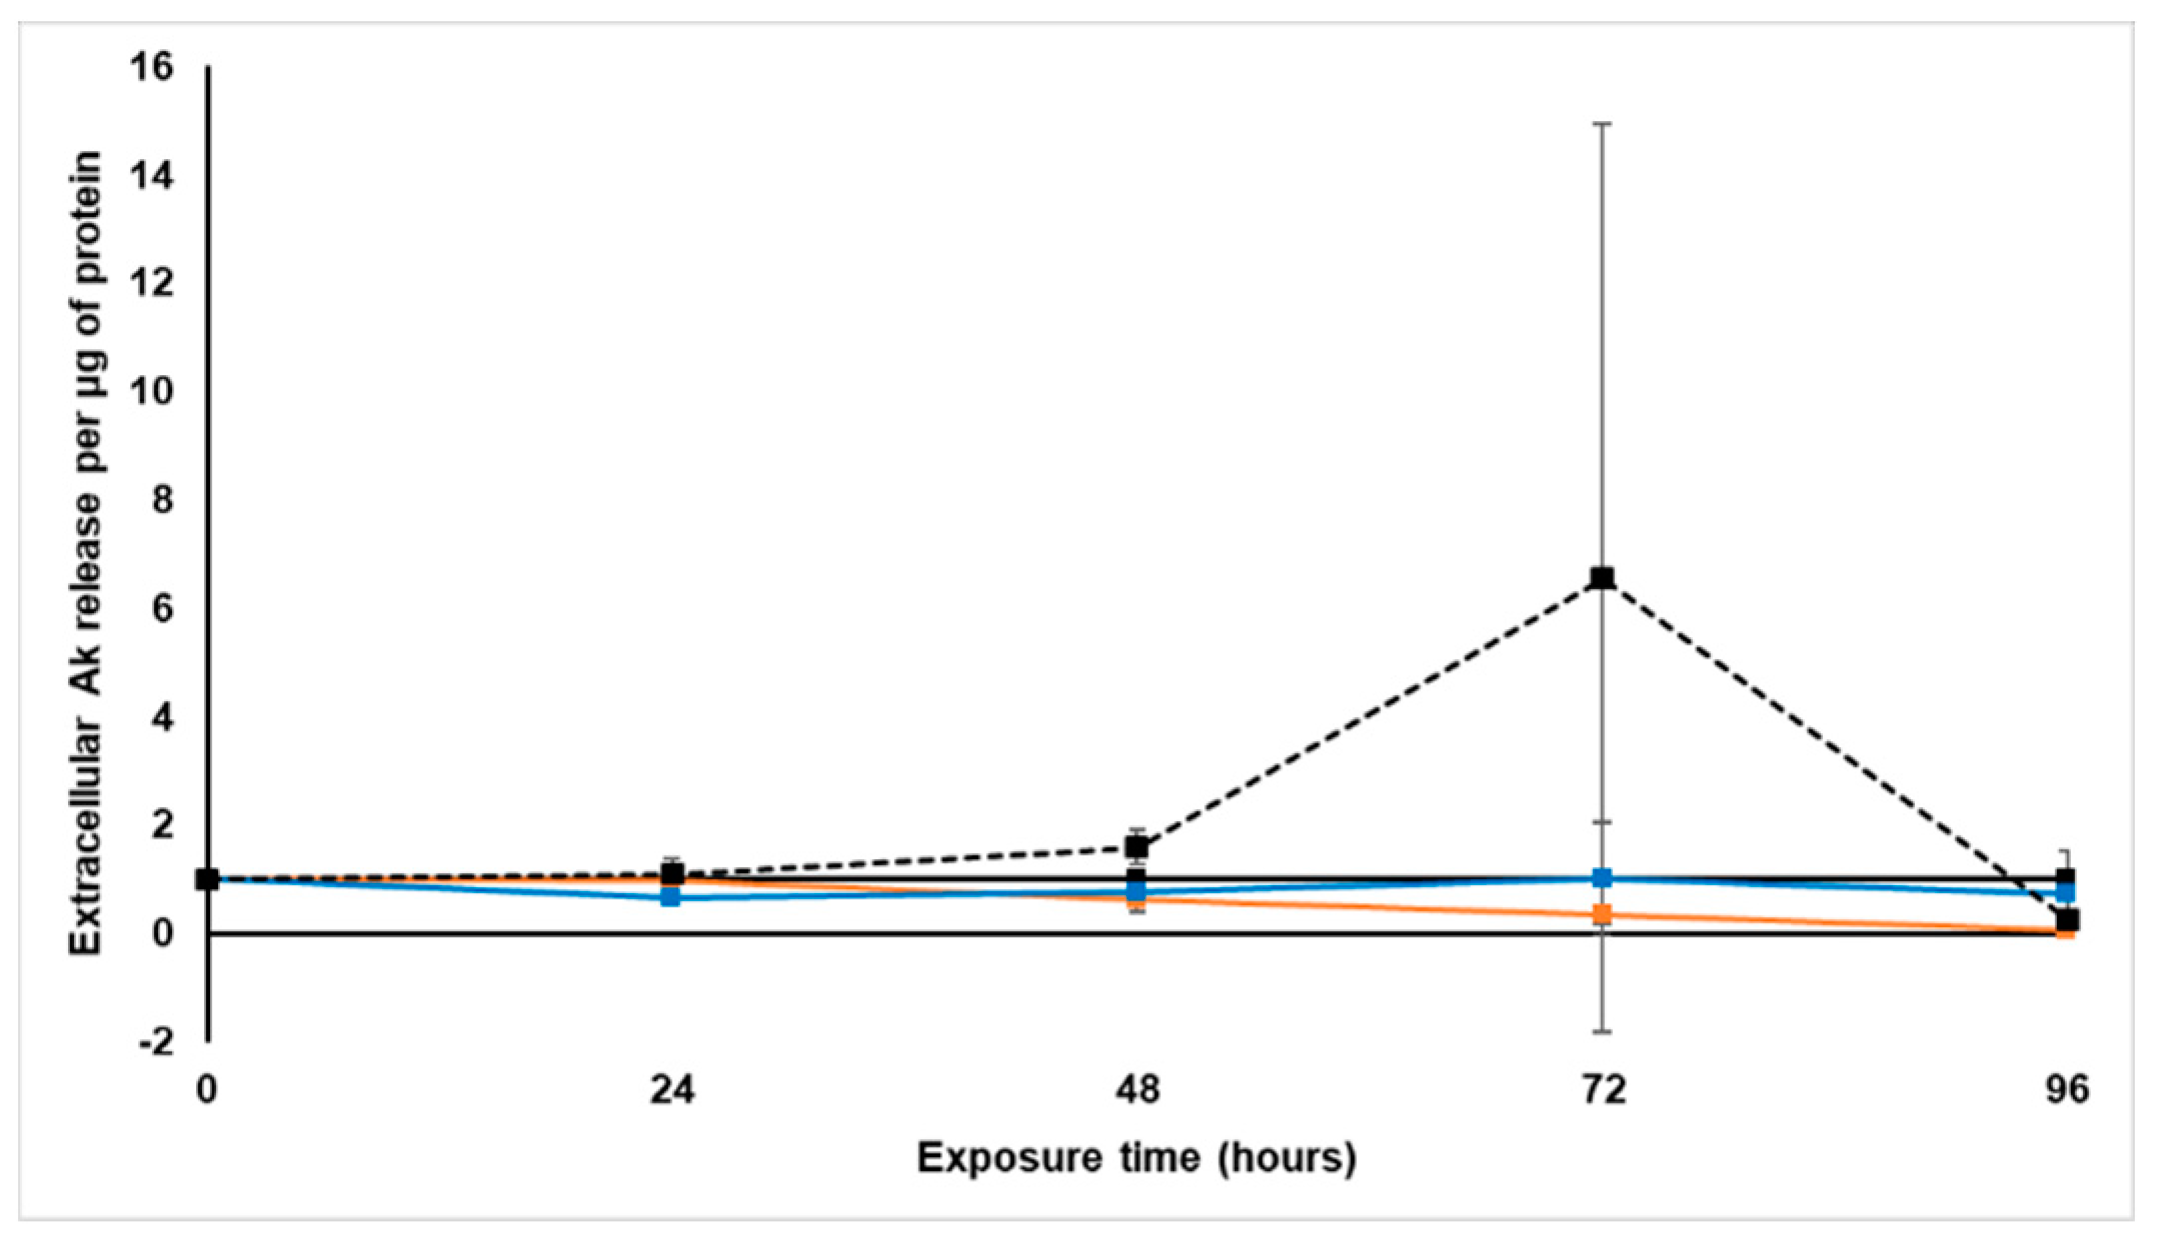
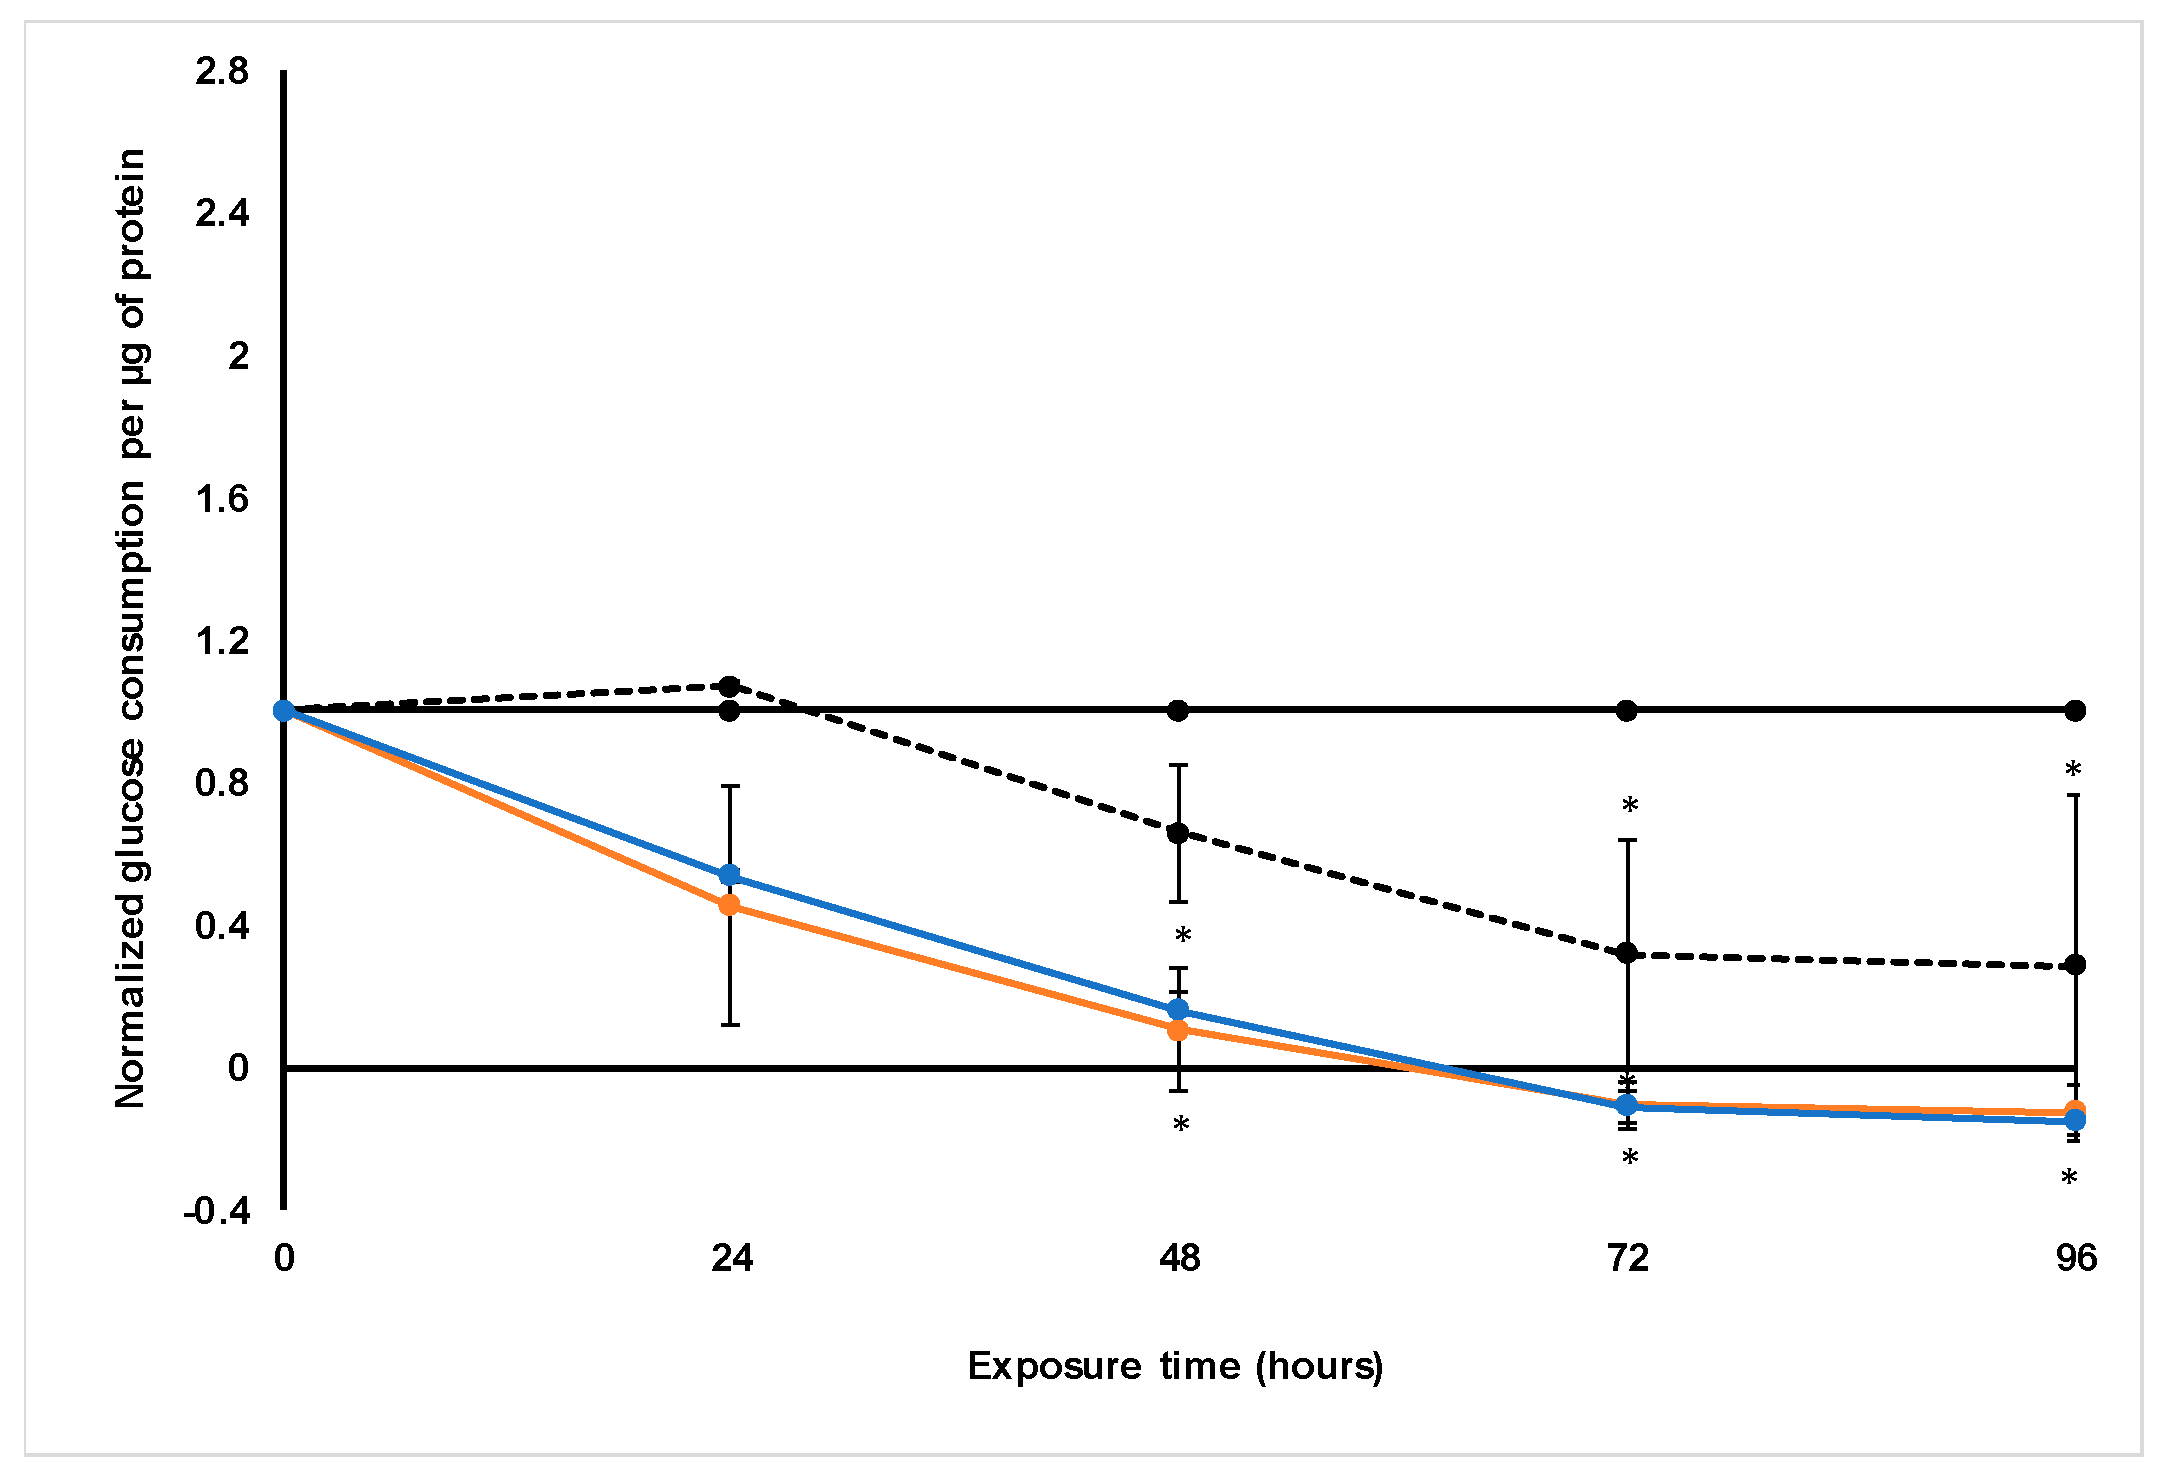
Treatment with S. frutescens [IC50]/2 decreased the soluble protein content relative to the untreated control, and the ATP content per µg soluble protein decreased below detectable limits. Except for a slight increase between 24 h and 72 h, the same decrease was observed for AK release per µg soluble protein. S. frutescens [IC50]/2 treatment also reduced glucose consumption to far less than that of the untreated group. These results were also found for the S. frutescens [IC50] treated group.
The observed decrease in cell growth and viability following treatment with
S. frutescens aqueous extract suggests that this extract has cytotoxic effects on LS180 cells, and could have cancer treatment potential against colorectal cancer. The almost undetectable levels of ATP suggest cell death, since ATP levels fall as a cell dies [
28]. ATP depletion probably occurred, and when combined with the lack of AK release, the presence of necrosis is very likely [
29]. Although a previous study in Caco-2 cells cultured in 2D demonstrated induction of apoptosis following treatment for 48 h, but the study used an ethanolic extract [
30]. Cytotoxicity of
S. frutescence was also confirmed in DLD-1 colon cancer cells cultured in 2D, with IC
50 values between 150 and 180 µg·mL
−1 [
31]. Furthermore, unlike paclitaxel, treatment with
S. frutescens does not appear to induce gene expression of the CYP3A4 and CYP2D6 enzymes but rather maybe inhibits expression. Similar to a previous study in breast cancer cells [
32], the results of this study suggest that the anticancer activity of the
S. frutescens crude aqueous extract, specifically in colon cancer, may even surpass that of the model chemotherapeutic drug, paclitaxel. However, further studies are needed to understand the full extent of this activity, and the minimum concentration needed for activity.
X. undulatum [IC50] treatment for 96 h decreased soluble protein content relative to the untreated control, as well as the ATP content per µg soluble protein. Although the AK release per µg soluble protein was similar to that of the untreated group for the first 48 h of exposure, it then decreased and was nearly undetectable after 96 h. The glucose consumption also rapidly decreased after exposure, and this group consumed much less glucose relative to the untreated control. Treatment with X. undulatum 2[IC50] also resulted in decreased soluble protein content, ATP content per µg soluble protein, AK release per µg soluble protein and glucose consumption. Although a slightly higher AK release was observed for this treatment group.
X. undulatum crude aqueous extract could, therefore, also have anticancer potential, when considering the observed decrease in cell growth and viability. Calitz et al. [
14] also previously suggested crude aqueous extracts of
X. undulatum to have anti-proliferating effects, which was confirmed in the current study, although it must be confirmed if the effects are specific to cancer cells. The activity observed also surpassed that of the chemotherapeutic drug, paclitaxel when comparing the effects of the IC
50 concentrations as determined in traditional culture, but the activity seemed to be less pronounced than that of
S. frutescens.
Although both plant extracts show great promise, further comparative studies are needed to identify potential single active compounds from the plant extracts, which will better enable direct activity comparison with current treatment and will increase the potential for a marketable drug.
Lastly, the sodium alginate encapsulated LS180 mini-tumor model was successfully implemented to evaluate the anticancer potential of plant extracts against colorectal cancer. The potential use of African phytomedicines to address the burden of cancer on the continent requires thorough study in suitable models, and this study indicated that this model could be used for such evaluations.
4. Materials and Methods
4.1. Preparation and Characterization of the Plant Material Aqueous Extracts
X. undulatum (XU174) and
S. frutescens (SFFW) plant material (dried and milled) were purchased from Afrinatural holdings (Prestige Laboratory Supplies CC, KwaZulu-Natal, South Africa). Crude aqueous extracts of
S. frutescens and
X. undulatum were previously prepared and characterized [
15]. Briefly, both extracts were prepared at a 1:10 ratio in water (plant: liquid) followed by 45 min sonication at 45 °C. The plant material suspension was centrifuged at 5000×
g for 10 min, and the supernatant collected. The process was repeated with the subsequent pellet, and the two supernatants combined. The supernatant was once again centrifuged at 1218×
g for 5 min, before filtration through Whatman
™ filtration paper with a pore diameter of 125 mm (Whatman
™, Sigma-Aldrich, Johannesburg, South Africa). The collected filtrate was frozen at −80 °C before lyophilization in a Virtis freeze dryer (SP Scientific, Gardiner, NY, USA). The lyophilized material was powdered with a mortar and pestle.
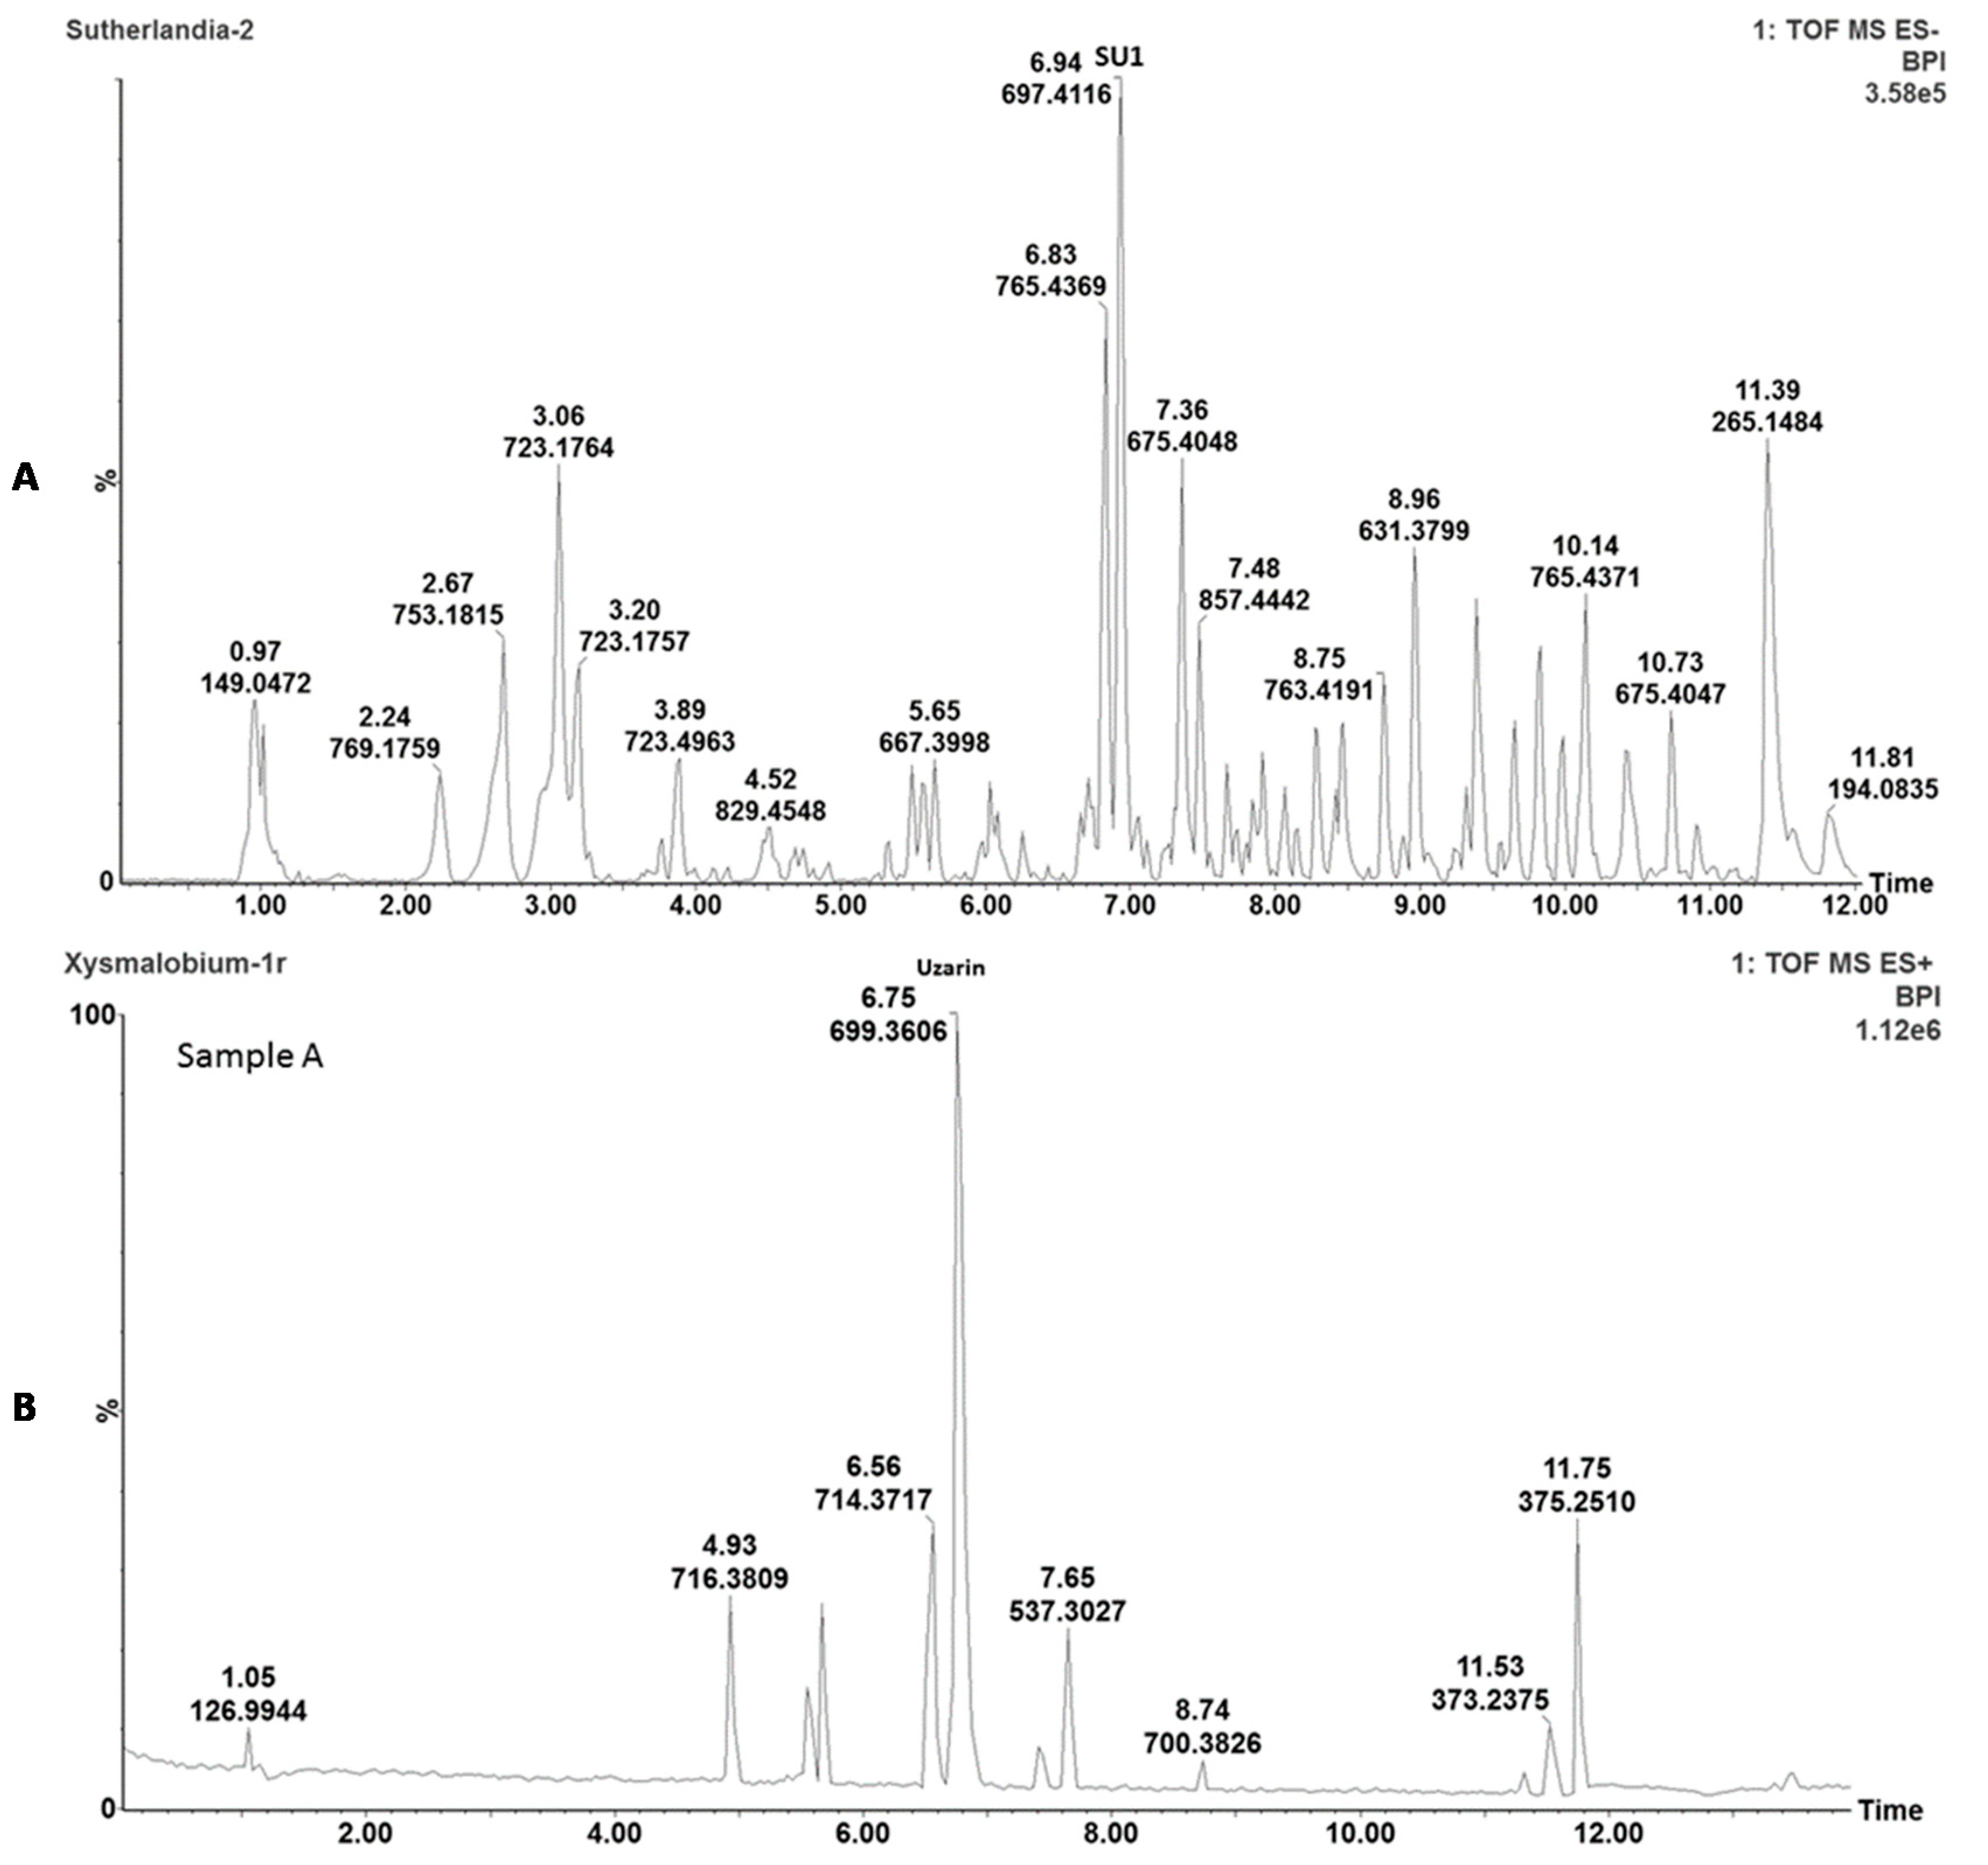
The plant extracts were chemically characterized with ultra-performance liquid chromatography-mass spectrometry (UPLC-MS) analyses to enable the identification, comparison, and detection of the main active phytochemicals. Briefly, 2 mg of freeze-dried powder of
S. frutescens and
X. undulatum, respectively, was added to 2 mL of methanol; followed by 10 min sonication and filtration using a 0.2 μm syringe filter. Analysis was performed on a Waters Acquity UPLC system, with a photodiode array (PDA) detector coupled to a Xevo G2QToF mass spectrometer (Waters, Milford, MA, USA) and an Acquity UPLC BEH C18 column (150 mm × 2.1 mm i.d., 1.7 μm particle size, Waters), maintained at 40 °C as previously described [
14,
15].
The S. frutescens and X. undulatum extracts were prepared daily in pre-heated culture medium. The pH of the extracts was adjusted to the physiological range of normal pH (±7). The stock solutions were vortexed and sterilized using a 0.22 µm syringe filter. S. frutescens dilutions were prepared in culture medium in the range of 1 to 8 mg·mL−1, and X. undulatum from 0.05 to 0.5 mg·mL−1.
4.2. LS180 Cell Culturing
The LS180 cell line (cat. no. #CL-187™) was purchased from the American Tissue Culture Collection (ATCC, Manassas, VA, USA). Cells were cultured in low-glucose Dulbecco’s Modified Eagle’s medium (DMEM) (Gibco; Thermo Fisher Scientific, Johannesburg, South Africa), supplemented with 10% foetal bovine serum (FBS) (Gibco; Thermo Fisher Scientific, Johannesburg, South Africa), 2 mM L-glutamine (200 mM; Lonza; Whitehead Scientific (Pty) Ltd., Cape Town, South Africa), 1% non-essential amino acids (NEAA) (100 X; Sigma-Aldrich, Johannesburg, South Africa) and 1% penicillin/streptomycin (10,000 penicillin U·mL−1/10,000 streptomycin U·mL−1; Lonza, Whitehead Scientific, Cape Town, South Africa). Cells were cultured under standard conditions of 37 °C, 5% CO2 and 95% humidified air, and culture medium was replaced every second day. Cells were sub-cultured by means of scraping in culture medium.
4.3. The 3-(4,5-Dimethylthiazol-2-yl)-2,5-diphenyltetrazolium Bromide Cytotoxicity Assay
Prior to the MTT assay, LS180 cells were trypsinized with trypsin-ethylenediaminetetraacetic acid (EDTA) (Lonza; Whitehead Scientific (Pty) Ltd., Cape Town, South Africa), and seeded in clear 96-well plates (Corning Inc., Ascendis Medical, Johannesburg, South Africa) at 8000 cells per well, and left for 24 h to attach. Culture medium was removed 24 h post-seeding, and cells were treated with the various compounds at various concentrations in 200 μL of culture medium (0 h). Treatment-containing culture medium was replaced every 24 h, and the MTT assay performed after 96 h exposure as previously described [
15,
22].
Untreated wells (to indicate 100% cell viability), dimethyl sulfoxide (DMSO; Sigma-Aldrich Johannesburg, South Africa) background control wells and dead cell control wells (cells treated with 0.2% Triton X-100 to represent 97–100% cell viability inhibition) received fresh supplemented medium during medium exchanges. To ensure the extract caused no interference with the assay, a highest plant concentration control (8 mg·mL−1 for S. frutescens and 0.5 mg·mL−1 for X. undulatum) was also included.
At 96 h, the medium was removed from all the wells and the cells were washed twice with 100 μL phosphate-buffered saline (PBS) (1 X; HyClone, Separations, Johannesburg, South Africa). All wells (excluding the DMSO background control) received 180 µL non-additive medium, and 20 µL of a 5 mg·mL
−1 thiazolyl blue tetrazolium bromide powder (Sigma-Aldrich, Johannesburg, South Africa) stock solution [
33]. The 96-well plate was covered and placed on a compact rocker for 5 min, followed by further incubation for 4 h at 37 °C. The medium was carefully removed (except that of the highest plant concentration wells) and replaced with 200 µL DMSO, followed by incubation on a compact rocker for 1 h. The absorbance was measured at 560 nm, with a reference wavelength of 630 nm [
34] using a SpectraMax
® plate reader (Paradigm
® Multi-Mode Detection Platform; Molecular Devices
®; Separations, Gauteng, South Africa).
The MTT assays were performed in six-fold, and SPSS statistical analysis software (IBM SPSS Statistics for Windows, Version 25.0. Armonk, NY, USA: IBM Corp.), in conjunction with the Probit Analysis Method, were used to calculate IC50 values and 95% confidence limit ranges for S. frutescens and X. undulatum, using the data from the MTT analyses.
4.4. Culturing of the LS180 Sodium Alginate Encapsulated Spheroid Model
The method was described in detail in Smit et al. [
22]. In brief, a 2.5%
w/v sodium alginate (Sigma-Aldrich) solution was prepared in PBS, and the 50 mM CaCl
2 and 150 mM NaCl cross-linker solution was prepared in distilled water.
Active clinostat bioreactors were purchased from Celvivo® ApS (Odense, Denmark), and were prepared by filling the chambers and placing the bioreactors onto a drive-unit (BAM v4.6; CelVivo® ApS, Odense, Denmark) in an incubator to rotate and equilibrate overnight at 37 °C and 5% CO2. LS180 cells were only trypsinized once before seeding, and the cell suspension was diluted to 2000 cells per µL. The cell suspension was centrifuged at 140× g for 5 min, and the cell pellet gently re-suspended in the prepared sodium alginate solution at 37 °C. The imbedded LS180 cells were pipetted as 1 µL droplets onto square Perspex blocks covered with hydrophobic paraffin film, and 0.5 µL of the cross-linker solution was added to each droplet. The petri dish was covered and incubated at room temperature for 5 min. Spheroids were transferred to the bioreactors in culture medium and the speed of each bioreactor was initially set at 16 rotations per minute (rpm). The culture medium was exchanged after three days of culturing during the first week, followed by medium exchange every second day thereafter. Rotation speed was adjusted daily to keep the spheroids suspended.
4.5. Anticancer Activity Screening in the LS180 Sodium Alginate Encapsulated Spheroid Model
The potential anticancer properties of
S. frutescens and
X. undulatum were investigated in the LS180 sodium alginate encapsulated spheroid model, relative to an untreated control and a standard chemotherapeutic drug, paclitaxel (Sigma-Aldrich) [
22]. The treatments consisted of two separate experiments (except for [IC
50]/2
S. frutescens) with three replicates per each biological treatment in each experiment. The treatment commenced when the spheroids were 12 days of age, and sampling took place following 0 h, 24 h, 48 h, 72 h and 96 h of exposure to the treatments. Experimental groups consisted of
S. frutescens [IC
50]/2 (half the concentration of
S. frutescens per µg protein, based on the IC
50 values obtained in the 2D cultures following the MTT assay),
S. frutescens [IC
50],
X. undulatum [IC
50] and
X. undulatum 2[IC
50] (two times the concentration of
X. undulatum per µg protein, based on the IC
50 values obtained in the 2D cultures following the MTT assay).
Culture medium containing the treatments were replaced every 24 h, after the measured soluble protein content was used to determine the dose per protein for the various treatment groups. The soluble protein content (µg) per spheroid was multiplied by the number of spheroids in each bioreactor per day to obtain a total protein mass (µg) for the bioreactor, and the doses were adapted accordingly. Since the spheroids are bioengineered with the sodium alginate base bio-design, size variation is minimal.
4.5.1. Soluble Protein Content
One spheroid was sampled every 24 h from each treatment group and biological repeat, before replacing the treatment containing culture medium, to determine the soluble protein content using the Quick Start™ Bradford Protein assay (Bio-Rad, Lasec SA (Pty) Ltd., Midrand, South Africa). Each sampled spheroid was lysed by adding 450 µL water, and divided into three technical replicates in clear 96-well plates. Subsequently, 10 µL lysis buffer was added to each well, followed by 40 µL protein assay dye reagent. Following centrifugation at 1218× g for 2 min, the absorbance was measured at 595 nm with a Spectramax® Paradigm plate reader. All samples were quantified relative to a bovine serum albumin (BSA) (Bio-Rad) standard.
4.5.2. Intracellular Adenosine Triphosphate Content
One spheroid was sampled per treatment group every 24 h for each biological replicate, and placed in microcentrifuge tubes. All culture medium was removed, 300 µL PBS added and mixed vigorously. The lysate was divided into three technical replicates and plated in black Costar® flat-bottom 96-well plates (Corning Inc., Ascendis Medical, Johannesburg, South Africa). CellTiter-Glo® luminescent lysis buffer (100 µL) (Promega, Anatech Instruments (Pty) Ltd., Johannesburg, South Africa) was added to sample wells and mixed. The plate was covered and shaken for 40 min, followed by centrifugation at 1218× g. Luminescence was measured with a Spectramax® Paradigm plate reader.
All samples were quantified relative to a known ATP standard (Sigma-Aldrich, Johannesburg, South Africa). The average intracellular ATP content was expressed as the normalized ATP content per soluble protein (µM·µg−1).
4.5.3. Extracellular Adenylate Kinase Content
An amount of 200 µL of spent culture medium was sampled in microcentrifuge tubes from each treatment group (3 biological replicates of 200 µL each), at each time point prior to replacing the treatment containing culture medium. The medium was centrifuged at 140× g for 15 min, and 160 µL of the supernatant was then transferred to a new microcentrifuge tube. The transferred culture medium was again centrifuged at 15,000× g for 15 min, where after 140 µL of the supernatant was transferred to a new tube and flash-frozen in liquid nitrogen and stored at −150 °C until further use.
After samples were equilibrated to room temperature, 20 µL was plated per well in black 96-well plates with three technical replicates. Then 100 µL of AK detection reagent (ToxiLight® BioAssay kit, Lonza, Whitehead Scientific (Pty) Ltd., Cape Town, South Africa) was added, and the covered plate placed on a compact rocker for 20 min. The plate was then centrifuged at 1218× g for 2 min, and the luminescence measured with a Spectramax® Paradigm plate reader.
All samples were quantified relative to a known dead cell standard (Cyto-Tox Glo® digitonin lysis buffer, Promega, Anatech Instruments (Pty) Ltd., Johannesburg, South Africa) to determine the number of dead cells per mL of culture medium.
4.5.4. Glucose Consumption
The amount of glucose (mmol·L−1) in the spent medium was measured for each of the treatment groups, at each time point, following the second centrifugation step of the AK samples and the removal of 140 µL of the spent medium. The glucose content of each treatment containing culture medium sample was also measured before dosing to establish the unspent medium glucose content.
The glucose content was measured three times with a OneTouch® Select™ blood glucose monitoring system and OneTouch® Select™ test strips. Following calibration with the OneTouch Ultra™ control solution (Lifescan), 3 µL of the spent medium was loaded on the test strips by means of a pipette. The glucose concentrations were read and noted, and the average calculated.
By deducting the remaining glucose content from the glucose content in the unspent medium, an approximation of glucose consumption (mmol·L−1) for the various treatment groups per time point was determined.
4.6. Relative Cytochrome P450 Gene Expression
A qRT-PCR was used to investigate potential changes in the relative expression of CYP3A4 and CYP2D6. Culture medium was removed from the sampled spheroids (3 to 5 per sample) and 200 µL RNAlater (Whitehead Scientific (Pty) Ltd., Cape Town, South Africa) solution was added to each sample. The samples were stored at −80 °C until further use.
Samples were thawed at room temperature and centrifuged at 400× g for 10 min. Total RNA was extracted using the PureLink™ RNA Mini Kit according to the manufacturer’s guidelines, followed by RNA quantification. Complementary deoxyribonucleic acid (cDNA) was synthesized with the High-Capacity cDNA reverse transcription kit (Applied Biosystems, Vilnius, Lithuania), using 2 µg of total RNA.
Real-time PCR was performed using TaqMan
™ Fast advanced Master Mix (Thermo Fisher Scientific, Johannesburg, South Africa), according to the manufacturer’s guidelines, on the C1000Touch
™ Thermal Cycler with 96-Well Fast Reaction Module (Bio-Rad, Singapore). Cycling conditions consisted of 2 min hold at 50 °C, 2 min hold at 95 °C, and then 40 cycles of 95 °C (1 s) and 60 °C (20 s) each. FAM-labelled TaqMan
™ Gene Expression primers were used for the following genes:
CYP3A4 (Hs00604506_m1),
CYP2D6 (Hs00164385_m1), Glyceraldehyde 3-phosphate dehydrogenase (
GAPDH) (Hs99999905_m1) and TATA-box binding protein (
TBP) (Hs00427620_m1).
GAPDH and
TBP were used as housekeeping genes to normalize the data, and to guarantee the comparability of the calculated mRNA (messenger RNA) expression in all samples analyzed. All PCR analyses were performed in biological triplicates. Threshold cycle (Ct) values and data were further analyzed with Bio-Rad CFX Maestro Software v1.1 (Bio-Rad CFX Maestro. Ink). Relative gene expression was calculated using the 2-ΔΔCt method [
35].
4.7. Statistical Data Analysis
Data collected were analyzed with Statistica
® (data analysis software system), version 13 (TIBCO Software Inc., 2018,
http://statistica.io.) to determine statistical significance. One-way analysis of variance (ANOVA) followed with a Dunnett post-hoc test was conducted for comparison of multiple groups with a control group (untreated). Real-time PCR data were analyzed by means of one-way ANOVA with Bonferroni post-hoc test using Bio-Rad CFX Maestro 1.1 (4.1.2433.1219) software. Differences were considered statistically significant when
p < 0.05.


 ,
, 


