
Janerin Induces Cell Cycle Arrest at the G2/M Phase and Promotes Apoptosis Involving the MAPK Pathway in THP-1, Leukemic Cell Line

 , , , and
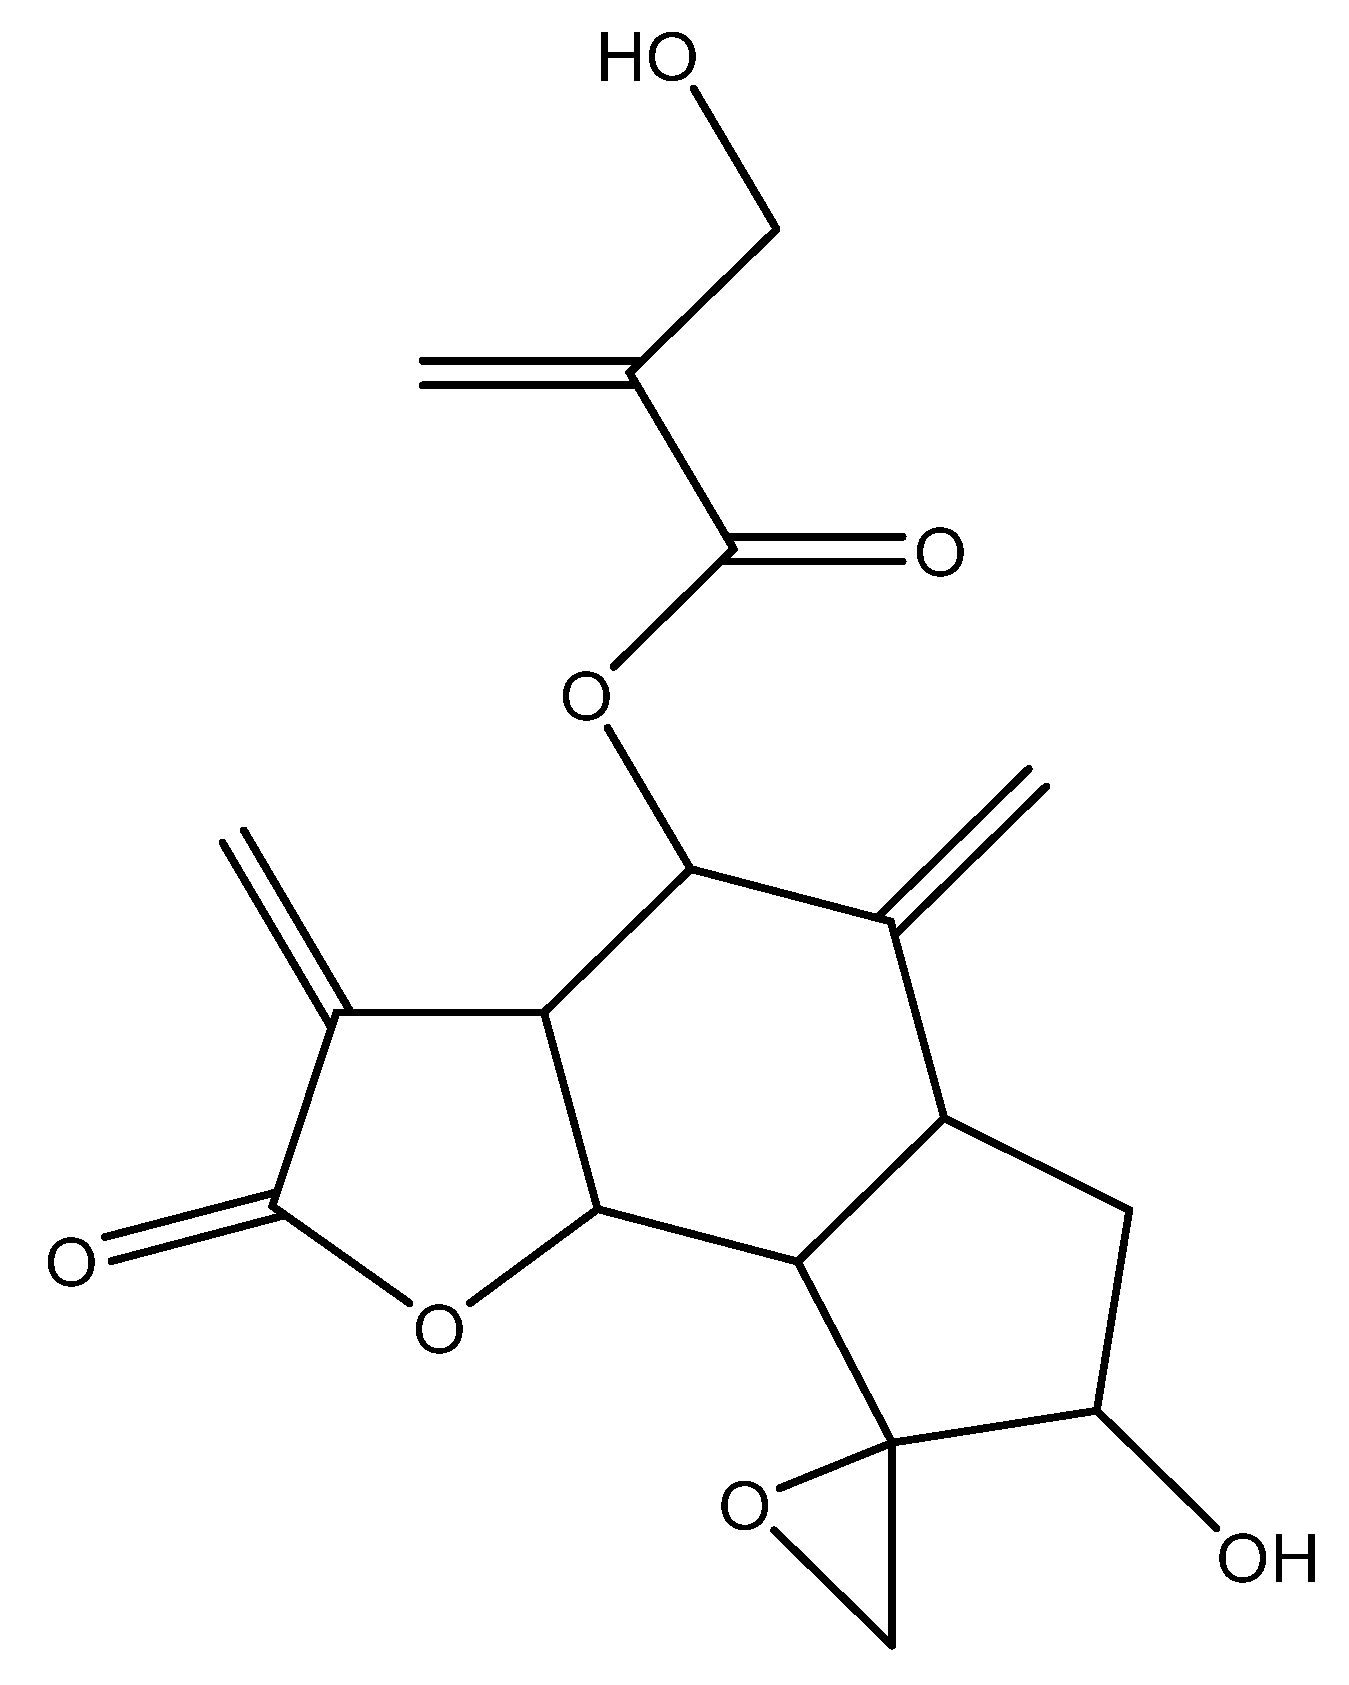
Abstract
1. Introduction
2. Results
2.1. Identification of the Components
2.2. Janerin Suppresses THP-1 Cell Growth In Vitro
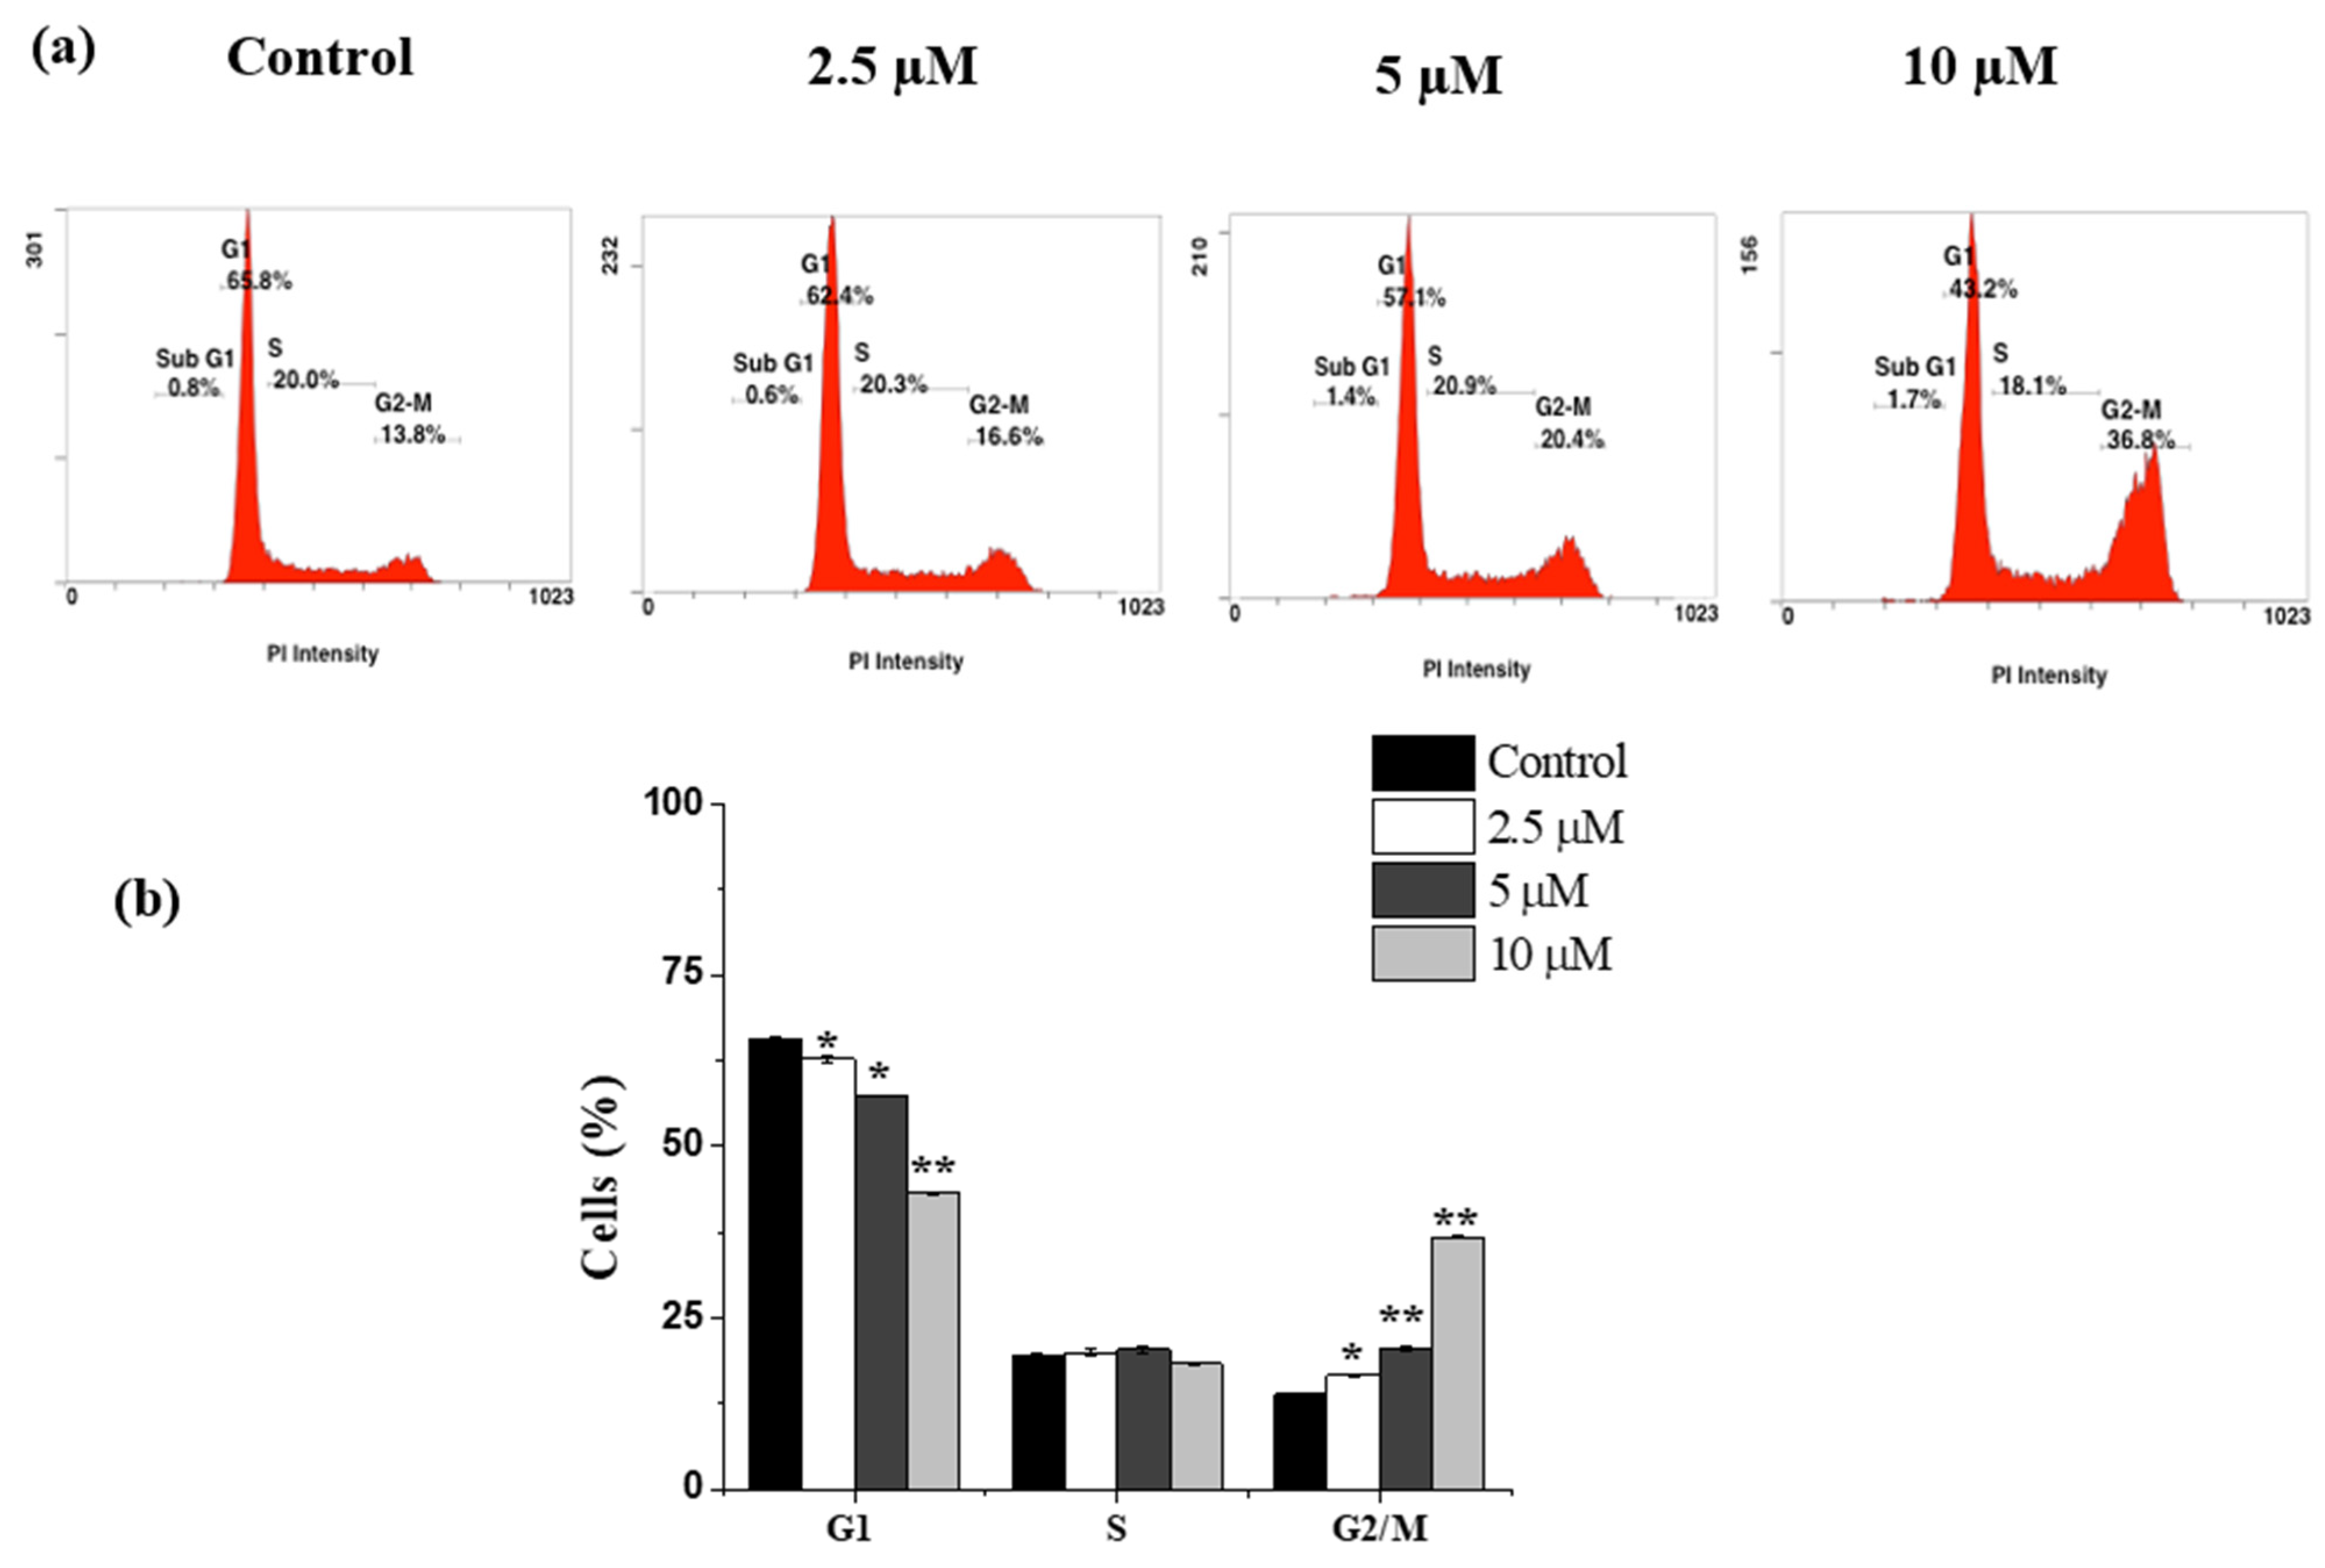
2.3. Janerin Causes Accumulation of Cells in the G2/M Phase
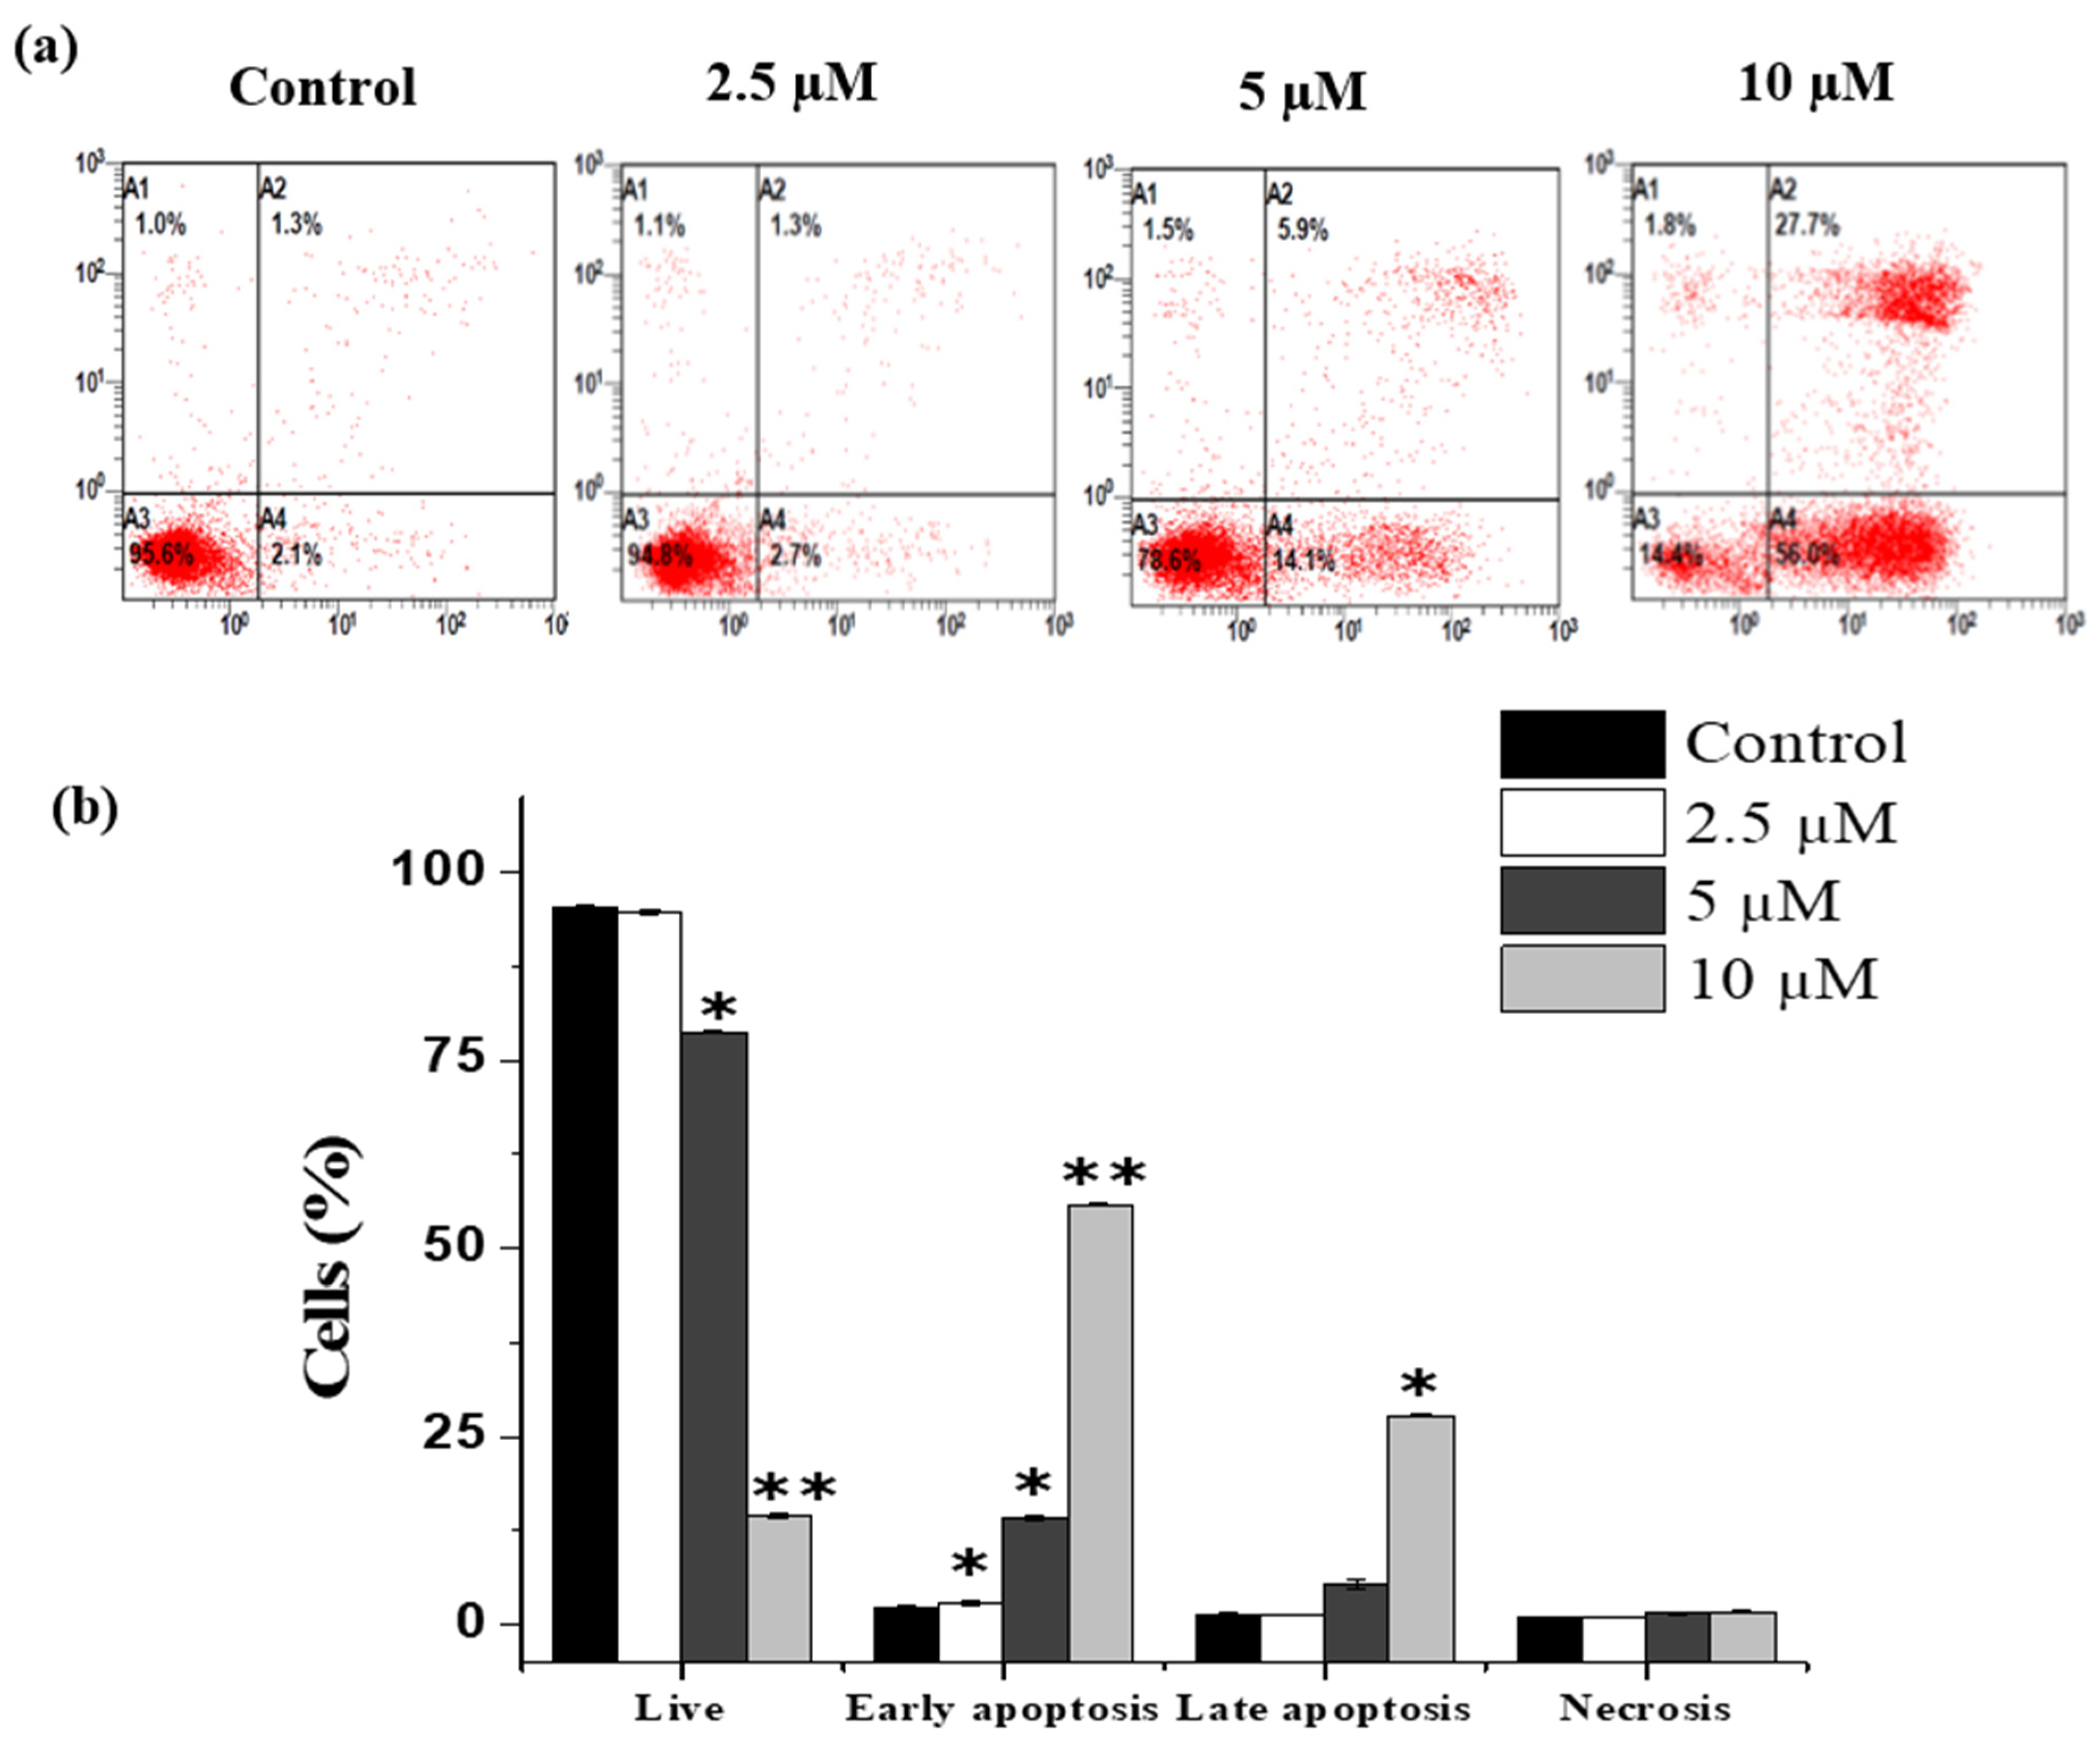
2.4. Janerin Causes Apoptosis in THP-1 Cells
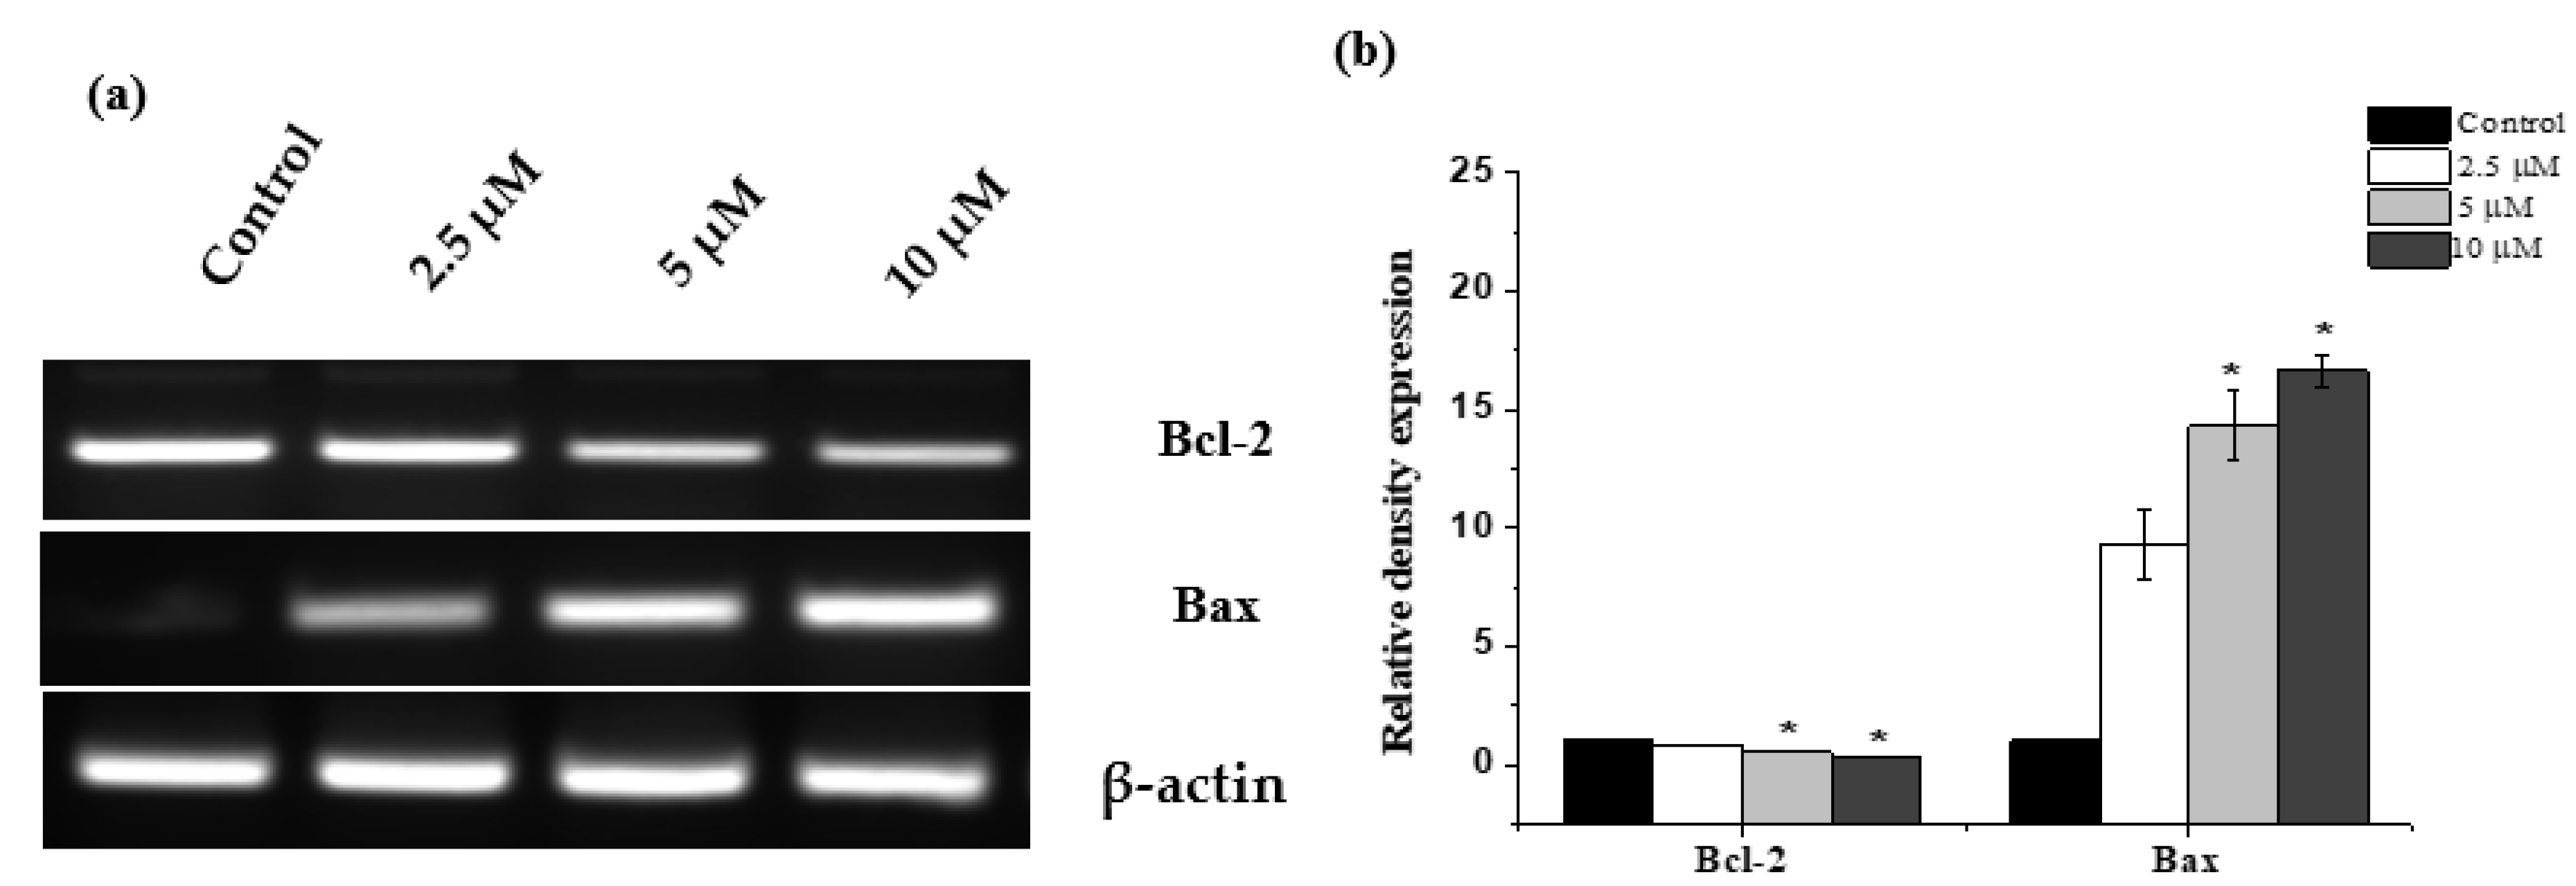
2.5. Janerin Modulates Bax and Bcl-2 Expression
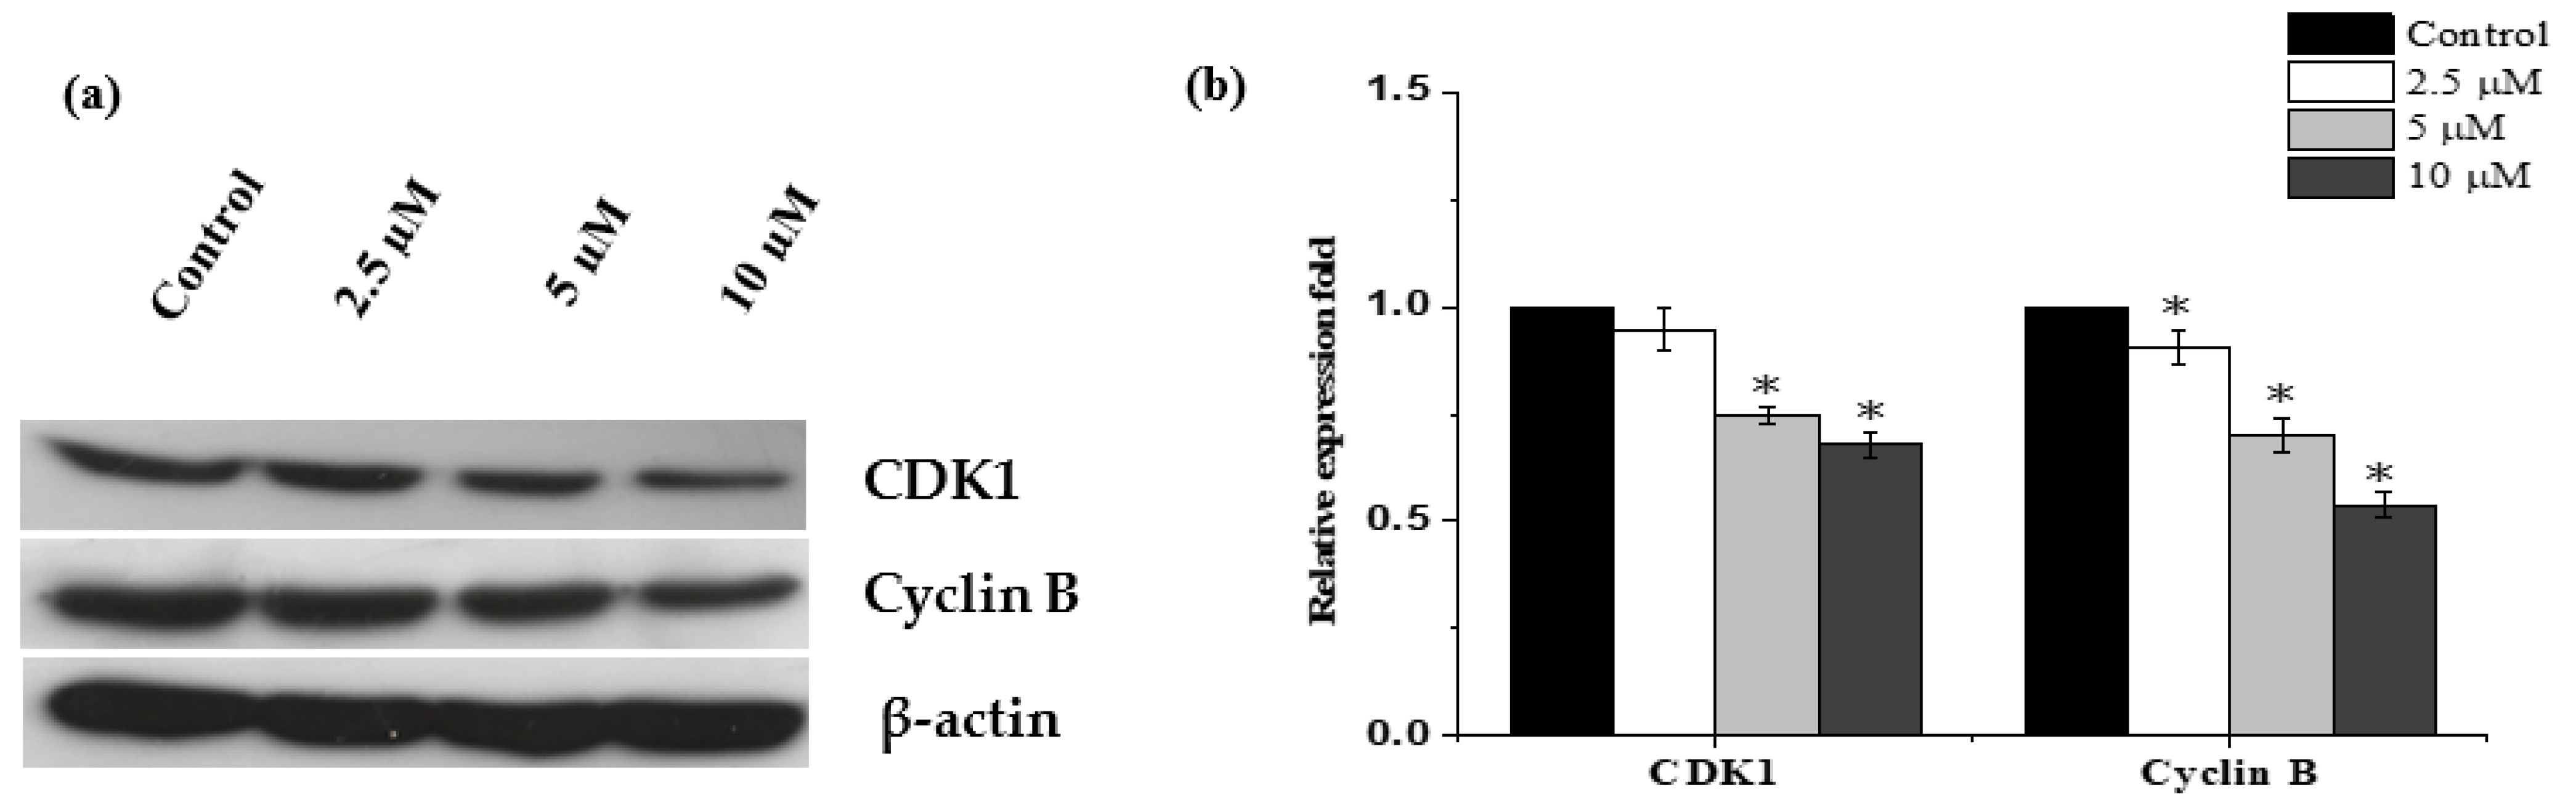
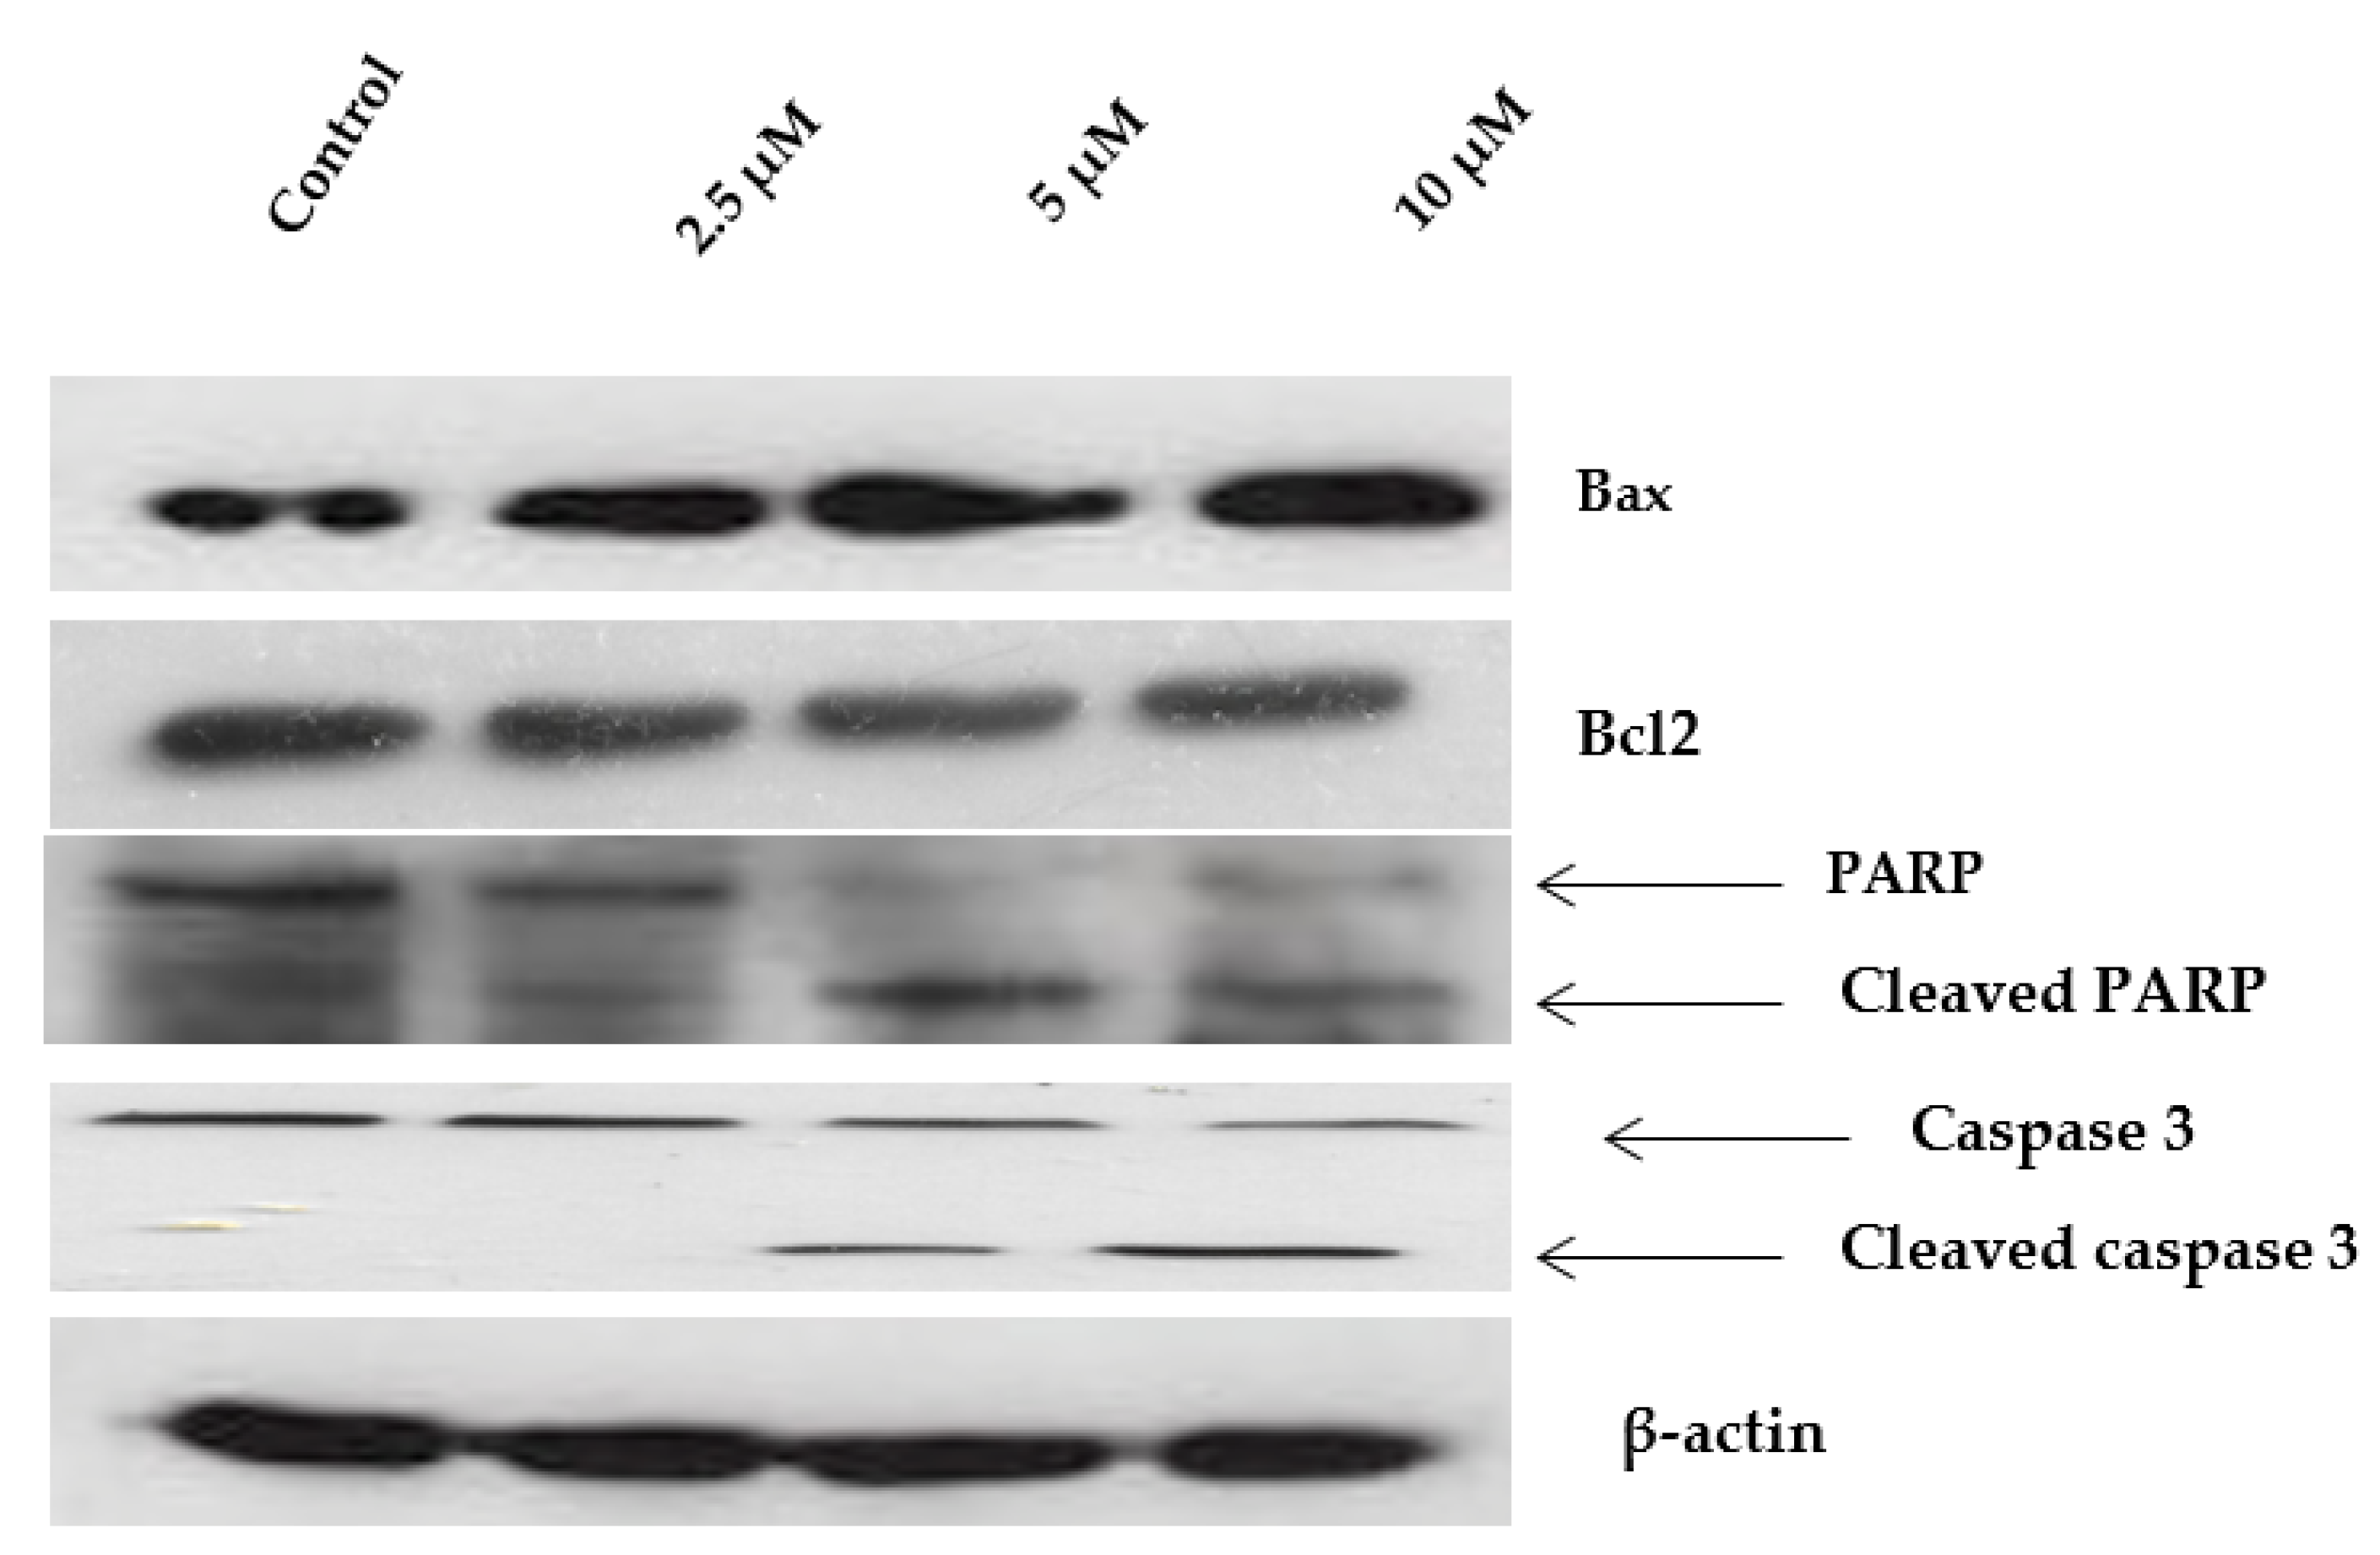
2.6. Western Blot Analysis of Apoptosis-Related Proteins Modulated by Janerin
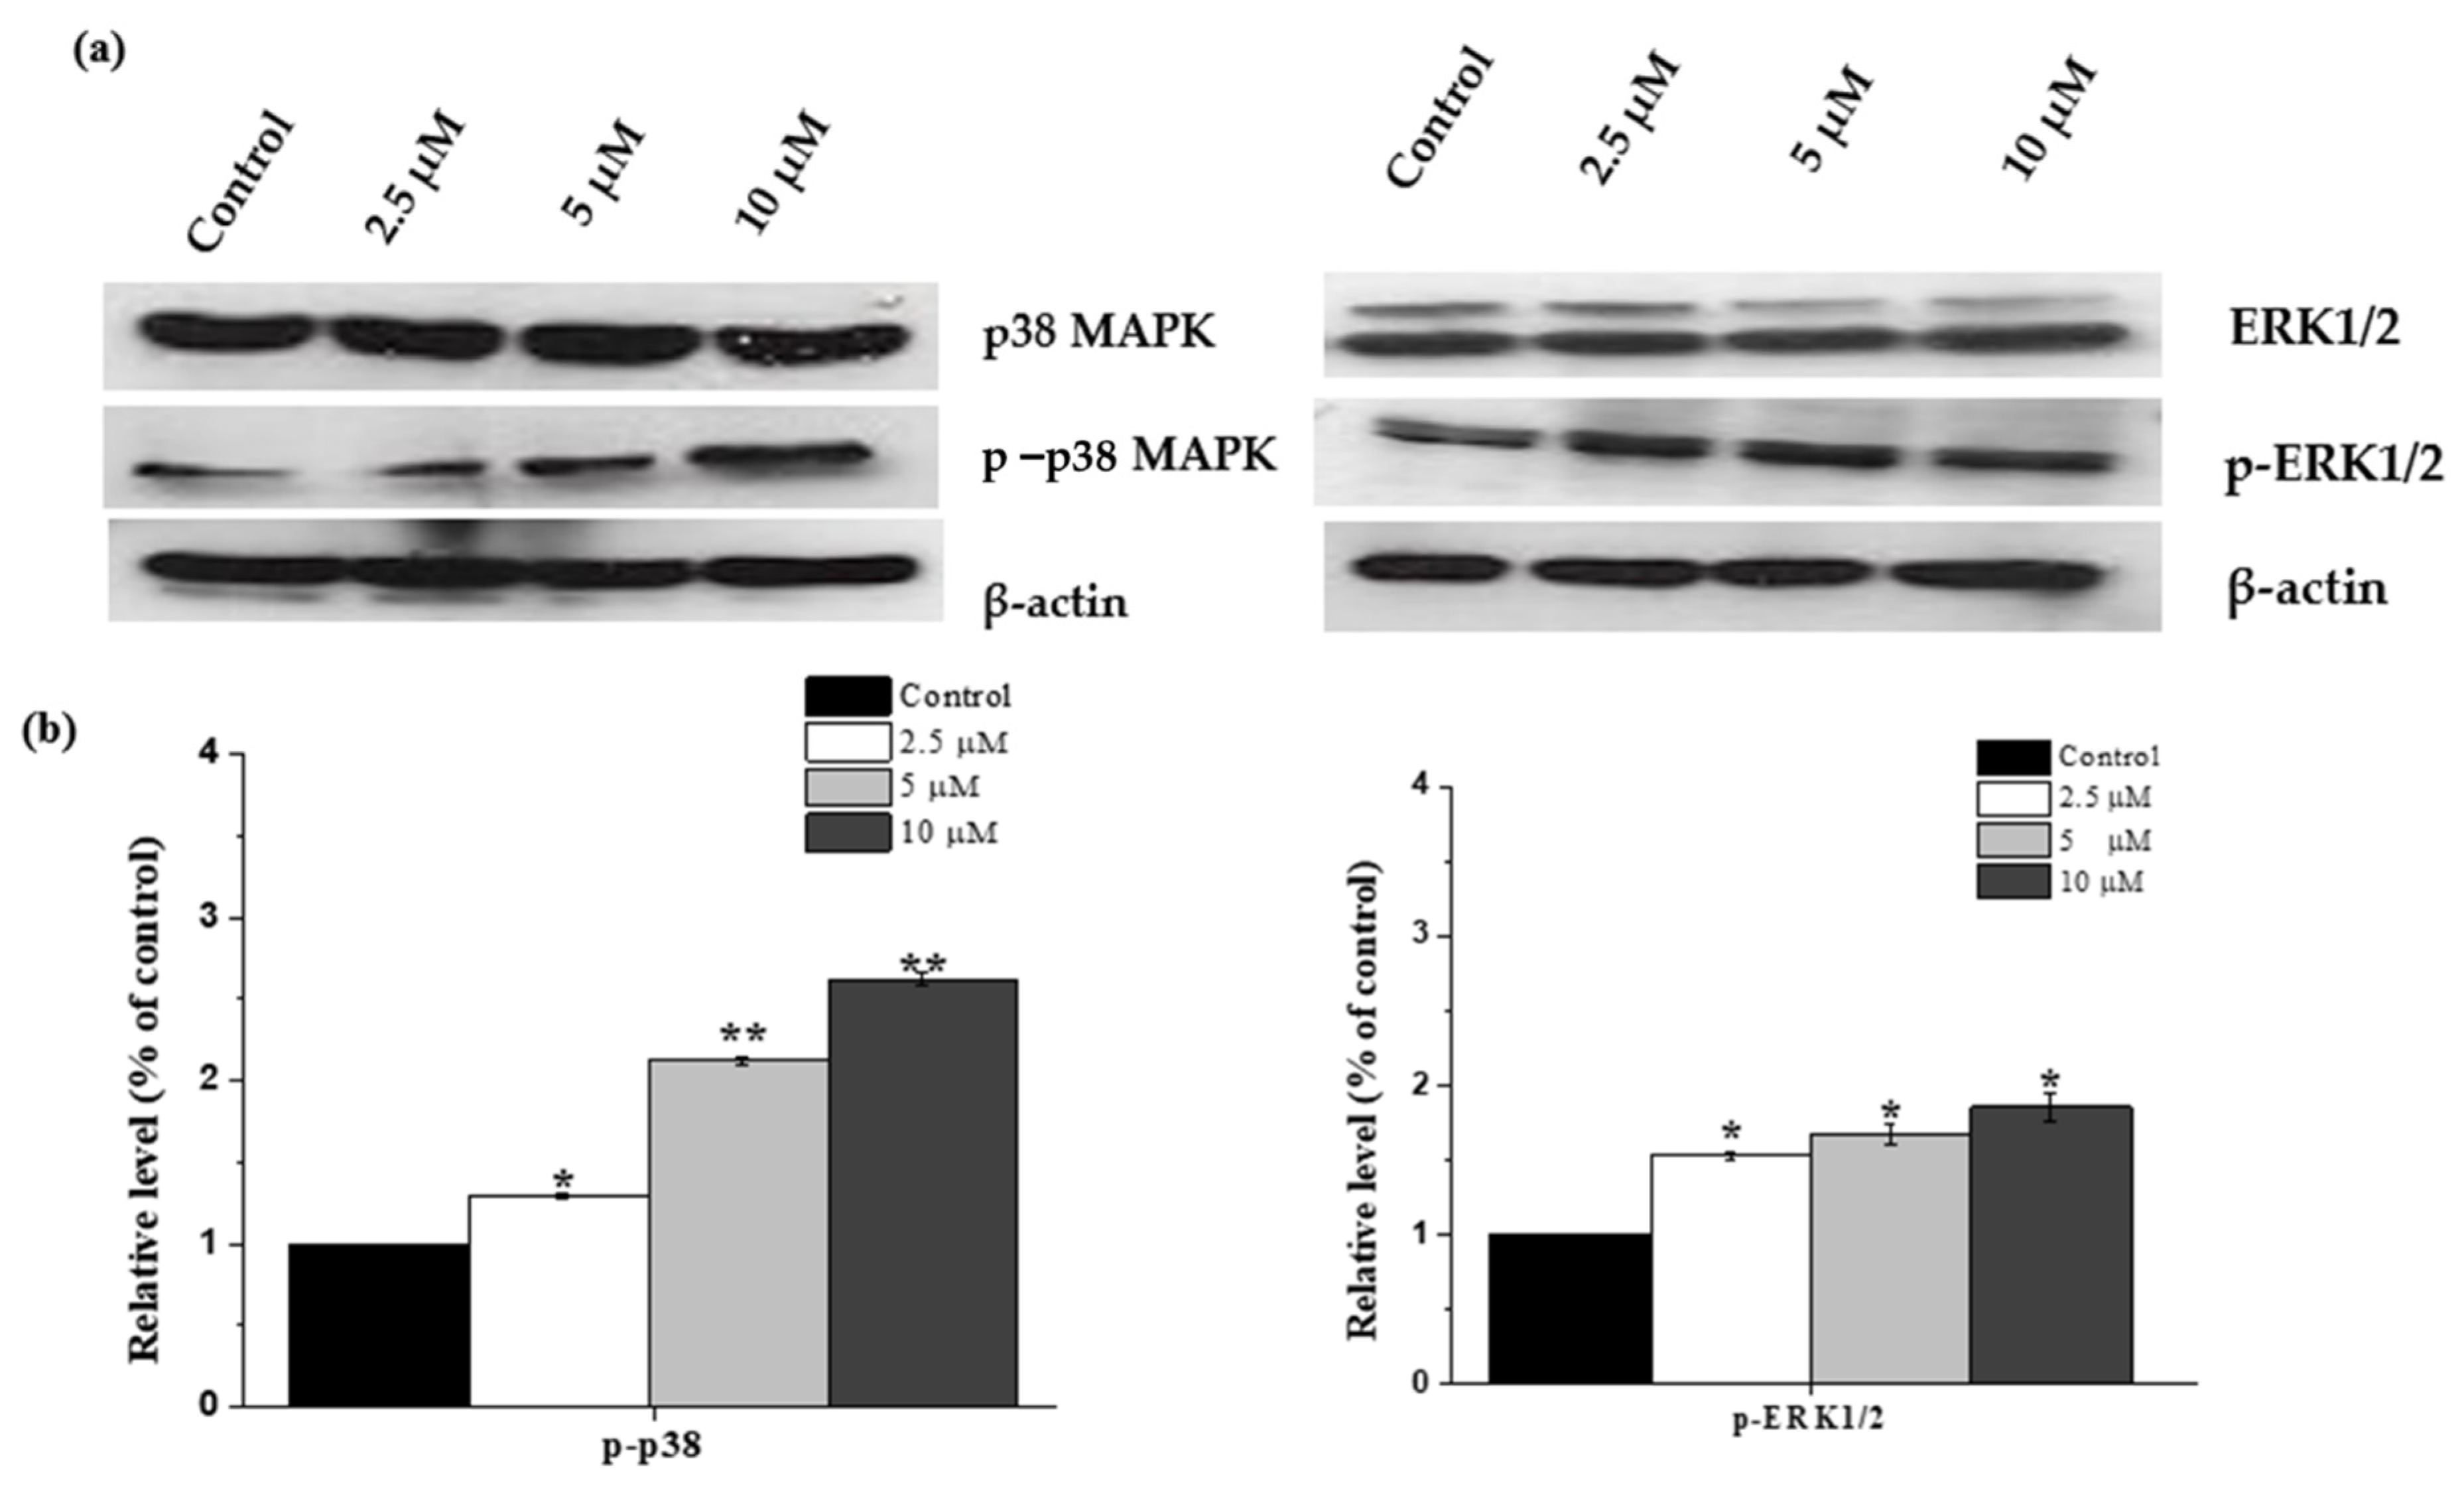
2.7. Janerin-Induced Apoptosis via Activation of p38MAPK
3. Discussion
4. Materials and Methods
4.1. Plant Collection, Extraction and Fractionation
4.2. Compound Isolation and Identification
4.3. MTT Assay
4.4. Cell Cycle Analysis
4.5. Determination of Apoptosis by Fluorescence-Activated Cell Sorting
4.6. RT-PCR Analysis
4.7. Western Blot Analysis
4.8. Statistical Analysis
5. Conclusions
Author Contributions
Funding
Institutional Review Board Statement
Informed Consent Statement
Data Availability Statement
Acknowledgments
Conflicts of Interest
Sample Availability
References
- De Kouchkovsky, I.; Abdul-Hay, M. Acute myeloid leukemia: A comprehensive review and 2016 update. Blood Cancer J. 2016, 6, e441. [Google Scholar] [CrossRef]
- Webster, J.A.; Pratz, K.W. Acute myeloid leukemia in the elderly: Therapeutic options and choice. Leuk. Lymphoma 2018, 59, 274–287. [Google Scholar] [CrossRef] [PubMed]
- Kantarjian, H.M.; Kadia, T.M.; DiNardo, C.D.; Welch, M.A.; Ravandi, F. Acute myeloid leukemia: Treatment and research outlook for 2021 and the MD Anderson approach. Cancer 2021, 127, 1186–1207. [Google Scholar] [CrossRef] [PubMed]
- Zhang, Q.-Y.; Wang, F.-X.; Jia, K.-K.; Kong, L.-D. Natural Product Interventions for Chemotherapy and Radiotherapy-Induced Side Effects. Front. Pharmacol. 2018, 9, 1253. [Google Scholar] [CrossRef] [PubMed]
- Huang, M.; Lu, J.-J.; Ding, J. Natural products in cancer therapy: Past, present and future. Nat. Prod. Bioprospect. 2021, 11, 5–13. [Google Scholar] [CrossRef]
- Cragg, G.M.; Pezzuto, J.M. Natural products as a vital source for the discovery of cancer chemotherapeutic and chemopreventive agents. Med. Princ. Pract. 2016, 25, 41–59. [Google Scholar] [CrossRef] [PubMed]
- Siddiqui, N.A.; Al Enezi, M.A.; Alam, P.; Haque, A.; Ali, M. A novel acyclic diterpenic alcohol isolated from antioxidant active ethanol extract of leaves of centaurothamnus maximus grown in Saudi Arabia. Afr. J. Tradit. Complementary Altern. Med. 2015, 12, 42–48. [Google Scholar] [CrossRef][Green Version]
- Hussien, T.A.; Mohamed, T.A.; Elshamy, A.I.; Moustafa, M.F.; El-Seedi, H.R.; Pare, P.W.; Hegazy, M.-E.F. Guaianolide Sesquiterpene Lactones from Centaurothamnus maximus. Molecules 2021, 26, 2055. [Google Scholar] [CrossRef]
- Alam, P.; Al-Anezi, M.; Siddiqui, N.A.; Alajmi, M.F.; Al-Rehaily, A.J.; Haque, A.; Ali, M. Isolation and characterization of a new oxygenated homoditerpenoid from leaves of Centaurothamnus maximus with antimicrobial potential. Pak. J. Pharm. Sci. 2015, 28, 1091–1095. [Google Scholar]
- Siddiqui, N.A.; Al Anezi, M.A.; Alam, P.; Haque, A.; Basodan, O.A.; Ali, M.J. Isolation of New Aliphatic Ester 8’[alpha]-Hydroxy-n-decanyl n-docosanoate from the Leaves of Centaurothamnus maximus Wagentz and Dittri. Asian J. Chem. 2015, 27, 2651. [Google Scholar] [CrossRef]
- Ren, Y.; Yu, J.; Kinghorn, A.D. Development of Anticancer Agents from Plant-Derived Sesquiterpene Lactones. Curr. Med. Chem. 2016, 23, 2397–2420. [Google Scholar] [CrossRef]
- Muhammad, I.; Takamatsu, S.; Mossa, J.S.; El-Feraly, F.S.; Walker, L.A.; Clark, A.M. Cytotoxic sesquiterpene lactones from Centaurothamnus maximus and Vicoa pentanema. Phytother. Res. 2003, 17, 168–173. [Google Scholar] [CrossRef]
- Shakeri, A.; Amini, E.; Asili, J.; Masullo, M.; Piacente, S.; Iranshahi, M. Screening of several biological activities induced by different sesquiterpene lactones isolated from Centaurea behen L. and Rhaponticum repens (L.) Hidalgo. Nat. Prod. Res. 2018, 32, 1436–1440. [Google Scholar] [CrossRef] [PubMed]
- Maher, T.; Ahmad Raus, R.; Daddiouaissa, D.; Ahmad, F.; Adzhar, N.S.; Latif, E.S.; Abdulhafiz, F.; Mohammed, A. Medicinal Plants with Anti-Leukemic Effects: A Review. Molecules 2021, 26, 2741. [Google Scholar] [CrossRef] [PubMed]
- Alimbetov, D.; Askarova, S.; Umbayev, B.; Davis, T.; Kipling, D. Pharmacological Targeting of Cell Cycle, Apoptotic and Cell Adhesion Signaling Pathways Implicated in Chemoresistance of Cancer Cells. Int. J. Mol. Sci. 2018, 19, 1690. [Google Scholar] [CrossRef] [PubMed]
- Sun, Y.; Liu, Y.; Ma, X.; Hu, H. The Influence of Cell Cycle Regulation on Chemotherapy. Int. J. Mol. Sci. 2021, 22, 6923. [Google Scholar] [CrossRef] [PubMed]
- Stark, G.R.; Taylor, W.R. Analyzing the G2/M checkpoint. Methods Mol. Biol. 2004, 280, 51–82. [Google Scholar]
- Castedo, M.; Perfettini, J.L.; Roumier, T.; Kroemer, G. Cyclin-dependent kinase-1: Linking apoptosis to cell cycle and mitotic catastrophe. Cell Death Differ. 2002, 9, 1287–1293. [Google Scholar] [CrossRef]
- Jang, S.H.; Kim, A.-R.; Park, N.-H.; Park, J.W.; Han, I.-S. DRG2 Regulates G2/M Progression via the Cyclin B1-Cdk1 Complex. Mol. Cells 2016, 39, 699–704. [Google Scholar] [CrossRef]
- Bailon-Moscoso, N.; Cevallos-Solorzano, G.; Romero-Benavides, J.C.; Orellana, M.I.R. Natural Compounds as Modulators of Cell Cycle Arrest: Application for Anticancer Chemotherapies. Curr. Genom. 2017, 18, 106–131. [Google Scholar] [CrossRef]
- Pan, Z.; Zhang, X.; Yu, P.; Chen, X.; Lu, P.; Li, M.; Liu, X.; Li, Z.; Wei, F.; Wang, K.; et al. Cinobufagin Induces Cell Cycle Arrest at the G2/M Phase and Promotes Apoptosis in Malignant Melanoma Cells. Front. Oncol. 2019, 9, 853. [Google Scholar] [CrossRef] [PubMed]
- Topham, C.H.; Taylor, S.S. Mitosis and apoptosis: How is the balance set? Curr. Opin. Cell Biol. 2013, 25, 780–785. [Google Scholar] [CrossRef] [PubMed]
- Millimouno, F.M.; Dong, J.; Yang, L.; Li, J.; Li, X. Targeting apoptosis pathways in cancer and perspectives with natural compounds from mother nature. Cancer Prev. Res. 2014, 7, 1081–1107. [Google Scholar] [CrossRef]
- Wang, Y.; Zhong, J.; Bai, J.; Tong, R.; An, F.; Jiao, P.; He, L.; Zeng, D.; Long, E.; Yan, J.; et al. The Application of Natural Products in Cancer Therapy by Targeting Apoptosis Pathways. Curr. Drug. Metab. 2018, 19, 739–749. [Google Scholar] [CrossRef] [PubMed]
- Wlodkowic, D.; Skommer, J.; Darzynkiewicz, Z. Flow cytometry-based apoptosis detection. Methods Mol. Biol. 2009, 559, 19–32. [Google Scholar] [CrossRef]
- Tang, S.; Hu, J.; Meng, Q.; Dong, X.; Wang, K.; Qi, Y.; Chu, C.; Zhang, X.; Hou, L. Daidzein induced apoptosis via down-regulation of Bcl-2/Bax and triggering of the mitochondrial pathway in BGC-823 cells. Cell Biochem. Biophys. 2013, 65, 197–202. [Google Scholar] [CrossRef]
- Zhu, L.; Han, M.B.; Gao, Y.; Wang, H.; Dai, L.; Wen, Y.; Na, L.X. Curcumin triggers apoptosis via upregulation of Bax/Bcl-2 ratio and caspase activation in SW872 human adipocytes. Mol. Med. Rep. 2015, 12, 1151–1156. [Google Scholar] [CrossRef] [PubMed]
- Kale, J.; Osterlund, E.J.; Andrews, D.W. BCL-2 family proteins: Changing partners in the dance towards death. Cell Death Differ. 2018, 25, 65–80. [Google Scholar] [CrossRef]
- Selim, K.A.; Abdelrasoul, H.; Aboelmagd, M.; Tawila, A.M. The role of the MAPK signaling, topoisomerase and dietary bioactives in controlling cancer incidence. Diseases 2017, 5, 13. [Google Scholar] [CrossRef]
- Yue, J.; López, J.M. Understanding MAPK Signaling Pathways in Apoptosis. Int. J. Mol. Sci. 2020, 21, 2346. [Google Scholar] [CrossRef]
- Jeong, H.; Park, S.; Kim, S.Y.; Cho, S.H.; Jeong, M.S.; Kim, S.R.; Seo, J.B.; Kim, S.H.; Kim, K.N. 1-Cinnamoyltrichilinin from Melia azedarach Causes Apoptosis through the p38 MAPK Pathway in HL-60 Human Leukemia Cells. Int. J. Mol. Sci. 2020, 21, 7506. [Google Scholar] [CrossRef] [PubMed]
- Surh, Y.J. Cancer chemoprevention with dietary phytochemicals. Nat. Rev. Cancer 2003, 3, 768–780. [Google Scholar] [CrossRef] [PubMed]
- Kaur, S.; Kumar, M.; Kaur, S. Role of Phytochemicals in MAPK Signaling Pathway-Mediated Apoptosis: A Possible Strategy in Cancer Chemoprevention. In Studies in Natural Products Chemistry; Attaur, R., Ed.; Elsevier: Amsterdam, The Netherlands, 2016; Volume 50, pp. 159–178. [Google Scholar]
- Al-Zharani, M.; Nasr, F.A.; Abutaha, N.; Alqahtani, A.S.; Noman, O.M.; Mubarak, M.; Wadaan, M.A. Apoptotic Induction and Anti-Migratory Effects of Rhazya Stricta Fruit Extracts on a Human Breast Cancer Cell Line. Molecules 2019, 24, 3968. [Google Scholar] [CrossRef] [PubMed]
- Nasr, F.A.; Noman, O.M.; Alqahtani, A.S.; Qamar, W.; Ahamad, S.R.; Al-Mishari, A.A.; Alyhya, N.; Farooq, M. Phytochemical constituents and anticancer activities of Tarchonanthus camphoratus essential oils grown in Saudi Arabia. Saudi Pharm. J. 2020, 28, 1474–1480. [Google Scholar] [CrossRef]
- Nasr, F.A.; Shahat, A.A.; Alqahtani, A.S.; Ahmed, M.Z.; Qamar, W.; Al-Mishari, A.A.; Almoqbil, A.N. Centaurea bruguierana inhibits cell proliferation, causes cell cycle arrest, and induces apoptosis in human MCF-7 breast carcinoma cells. Mol. Biol. Rep. 2020, 47, 6043–6051. [Google Scholar] [CrossRef]


Publisher’s Note: MDPI stays neutral with regard to jurisdictional claims in published maps and institutional affiliations. |
© 2021 by the authors. Licensee MDPI, Basel, Switzerland. This article is an open access article distributed under the terms and conditions of the Creative Commons Attribution (CC BY) license (https://creativecommons.org/licenses/by/4.0/).
Share and Cite
Ahmed, M.Z.; Nasr, F.A.; Qamar, W.; Noman, O.M.; Khan, J.M.; Al-Mishari, A.A.; Alqahtani, A.S. Janerin Induces Cell Cycle Arrest at the G2/M Phase and Promotes Apoptosis Involving the MAPK Pathway in THP-1, Leukemic Cell Line. Molecules 2021, 26, 7555. https://doi.org/10.3390/molecules26247555
Ahmed MZ, Nasr FA, Qamar W, Noman OM, Khan JM, Al-Mishari AA, Alqahtani AS. Janerin Induces Cell Cycle Arrest at the G2/M Phase and Promotes Apoptosis Involving the MAPK Pathway in THP-1, Leukemic Cell Line. Molecules. 2021; 26(24):7555. https://doi.org/10.3390/molecules26247555
Chicago/Turabian StyleAhmed, Mohammad Z., Fahd A. Nasr, Wajhul Qamar, Omar M. Noman, Javed Masood Khan, Abdullah A. Al-Mishari, and Ali S. Alqahtani. 2021. "Janerin Induces Cell Cycle Arrest at the G2/M Phase and Promotes Apoptosis Involving the MAPK Pathway in THP-1, Leukemic Cell Line" Molecules 26, no. 24: 7555. https://doi.org/10.3390/molecules26247555
APA StyleAhmed, M. Z., Nasr, F. A., Qamar, W., Noman, O. M., Khan, J. M., Al-Mishari, A. A., & Alqahtani, A. S. (2021). Janerin Induces Cell Cycle Arrest at the G2/M Phase and Promotes Apoptosis Involving the MAPK Pathway in THP-1, Leukemic Cell Line. Molecules, 26(24), 7555. https://doi.org/10.3390/molecules26247555