Article

Genome Mining of Pseudomonas Species: Diversity and Evolution of Metabolic and Biosynthetic Potential

1
Helmholtz International Lab for Anti-Infectives, Shandong University-Helmholtz Institute of Biotechnology, State Key Laboratory of Microbial Technology, Shandong University, Qingdao 266237, China
2
Department of Microbiology, Rajshahi Institute of Biosciences (RIB), University of Rajshahi, Rajshahi 6212, Bangladesh
3
Department of Microbiology, University of Chittagong, Chittagong 4331, Bangladesh
*
Authors to whom correspondence should be addressed.
Molecules 2021, 26(24), 7524; https://doi.org/10.3390/molecules26247524
Submission received: 10 November 2021 / Revised: 7 December 2021 / Accepted: 8 December 2021 / Published: 12 December 2021
(This article belongs to the Special Issue Bioactive Natural Products from Microorganisms)

Abstract

:
Microbial genome sequencing has uncovered a myriad of natural products (NPs) that have yet to be explored. Bacteria in the genus Pseudomonas serve as pathogens, plant growth promoters, and therapeutically, industrially, and environmentally important microorganisms. Though most species of Pseudomonas have a large number of NP biosynthetic gene clusters (BGCs) in their genomes, it is difficult to link many of these BGCs with products under current laboratory conditions. In order to gain new insights into the diversity, distribution, and evolution of these BGCs in Pseudomonas for the discovery of unexplored NPs, we applied several bioinformatic programming approaches to characterize BGCs from Pseudomonas reference genome sequences available in public databases along with phylogenetic and genomic comparison. Our research revealed that most BGCs in the genomes of Pseudomonas species have a high diversity for NPs at the species and subspecies levels and built the correlation of species with BGC taxonomic ranges. These data will pave the way for the algorithmic detection of species- and subspecies-specific pathways for NP development.

1. Introduction

Microorganisms can produce a wide range of secondary metabolite or natural products (NPs), such as non-ribosomal peptides (NRPs) [1,2,3], polyketides (PKs) [4,5], ribosomally synthesized and post-translationally modified peptides (RiPPs) [6,7,8,9], saccharides [10,11], alkaloids [12,13,14] and terpenoids [15,16,17], which offer diverse applications in the pharmaceutical and agricultural industries [18,19]. More than 50% of Food and Drug Administration (FDA) approved drugs and 65% of current clinical drugs are inspired from NPs. The biosynthesis of microbial NPs is controlled by a group of genes clustered together on the microbial chromosomes to form the biosynthetic gene clusters (BGCs) [20] allowing for the co-expression of the biosynthetic enzymes, regulators, and transporters responsible for NP production and secretion.
To combat the emerging worldwide challenge of antibiotic resistance, new antimicrobial agents are desperately needed. Antimicrobial resistance takes the lives of at least 700,000 people every year and it is expected that this number will reach 10 million by 2050 if the problem is not addressed [21,22]. Indeed, less than 25% of clinical drugs represent limited novel classes or act via novel mechanisms. Drugs active against Gram-negative Enterococcus faecium, Staphylococcus aureus, Klebsiella pneumoniae, Acinetobacter baumannii, Pseudomonas aeruginosa, and Enterobacter spp. (ESKAPE) or World Health Organization (WHO) critical threat pathogens are still far from being available.
Bioactivity-guided traditional screening used to directly extract these chemicals from microorganisms is no longer sufficient to meet the continual demand for new chemical entities due to the low production, prolonged duration, high expense, and high rediscovery rates in finding, isolating, and characterizing compounds [23]. In fact, tens of thousands of NPs known so far constitute only a small part of NPs’ potential chemical space, which has yet to be discovered [24,25,26]. These limitations could be solved by looking for BGCs in the genomes which show cryptic metabolic potential. Identification of a varied spectrum of formerly undiscovered new NPs has been made possible by the advent of powerful data mining technologies, as well as genetic and analytical instruments [27].
The availability of sophisticated computational methods and genome sequence data due to fast and low-cost next generation sequencing technologies opens up previously unexplored avenues for studying NP biosynthesis, and expands our understanding of the diversity in the producers, activities, and structures of NPs [24,27,28,29].
The molecular genetics of NP production has advanced significantly in recent years. Microbial BGCs have a lot of genetic variation, which leads to a lot of chemical variability in coding NPs [20,28]. Genome sequence analysis shows that the metabolic capacity of bacteria is substantially greater than what can be demonstrated in the lab, due to the severe silence of biosynthetic genes or poor synthesis yields, which prevent the substances from being detected by analytical methods.
New insights into the diversity and distributions of NP BGCs and evolutionary mechanisms to generate these BGCs can be gained with the access to genome sequence data. The considerable structural variety in NPs is likely caused by the more rapid evolution of BGCs in comparison to other genetic components [28]. While the selective factors to drive NP diversification are still unknown, vast numbers of genome sequences have allowed scientists to begin to disclose the evolutionary mechanisms that govern structural novelty during the biosynthesis of NPs [29]. However, more than 50% of discovered BGCs are not expressed under current laboratory circumstances, and thus are characterized as “silent”, “cryptic”, or “orphan” gene clusters.
Pseudomonas represents one of the most widespread and metabolically diverse bacterial genera. It includes more than 200 species [30] used for biotechnology, medicine, and environmental protection. Some members of this genus can act as opportunistic pathogens of humans, animals, and plants or show intrinsic antimicrobial resistance while some species are featured with successful colonization in many different environments, metabolic versatility, and genetic plasticity [31,32]. In addition, many members are biocontrol agents to promote plant growth and improve phytoremediation potential [33].
Genome mining has been used for the discovery and characterization of many new NPs from Pseudomonas, such as gacamide A, a lipodepsipeptide in Pseudomonas fluorescens Pf01, which has a moderate antibiotic activity and promotes bacterial surface motility [34]. Three structurally diverse lipopeptides (thanapeptin and thanamycin as well as cyclocarbamate brabantamide A–C) were isolated from Pseudomonas sp. SH-C52—closely linked to P. fluorescens DSM 11579—and showed a different antimicrobial activity spectrum [35]. Thanafactin A, a linear, proline-containing octalipopeptide, was characterized from Pseudomonas sp. SH-C52 [36]. Chimeric natural products pyonitrins A–D were produced by P. protegens [36]. Many genes involved in the biocontrol process discovered using genome mining from P. fluorescens BRZ63 encoded transporters, siderophores, and other active secondary metabolites [37]. Recently, P. putida has been widely used as a heterologous host for the biosynthesis of various NPs [38,39]. All these examples demonstrate the potential of genome mining in the discovery of NPs.
NCBI datasets have a large collection of Pseudomonas genome sequences, as an important source for the study of these bacteria’s biosynthetic potentialities. We utilized various bioinformatics tools to scan all publicly available complete reference genome sequences of species in the Pseudomonas genus and the subspecies of P. fluorescence to elucidate the phylogenetic diversity, distributions of known and uncharacterized BGCs, and the NP-coding potential of these genomes.

2. Results

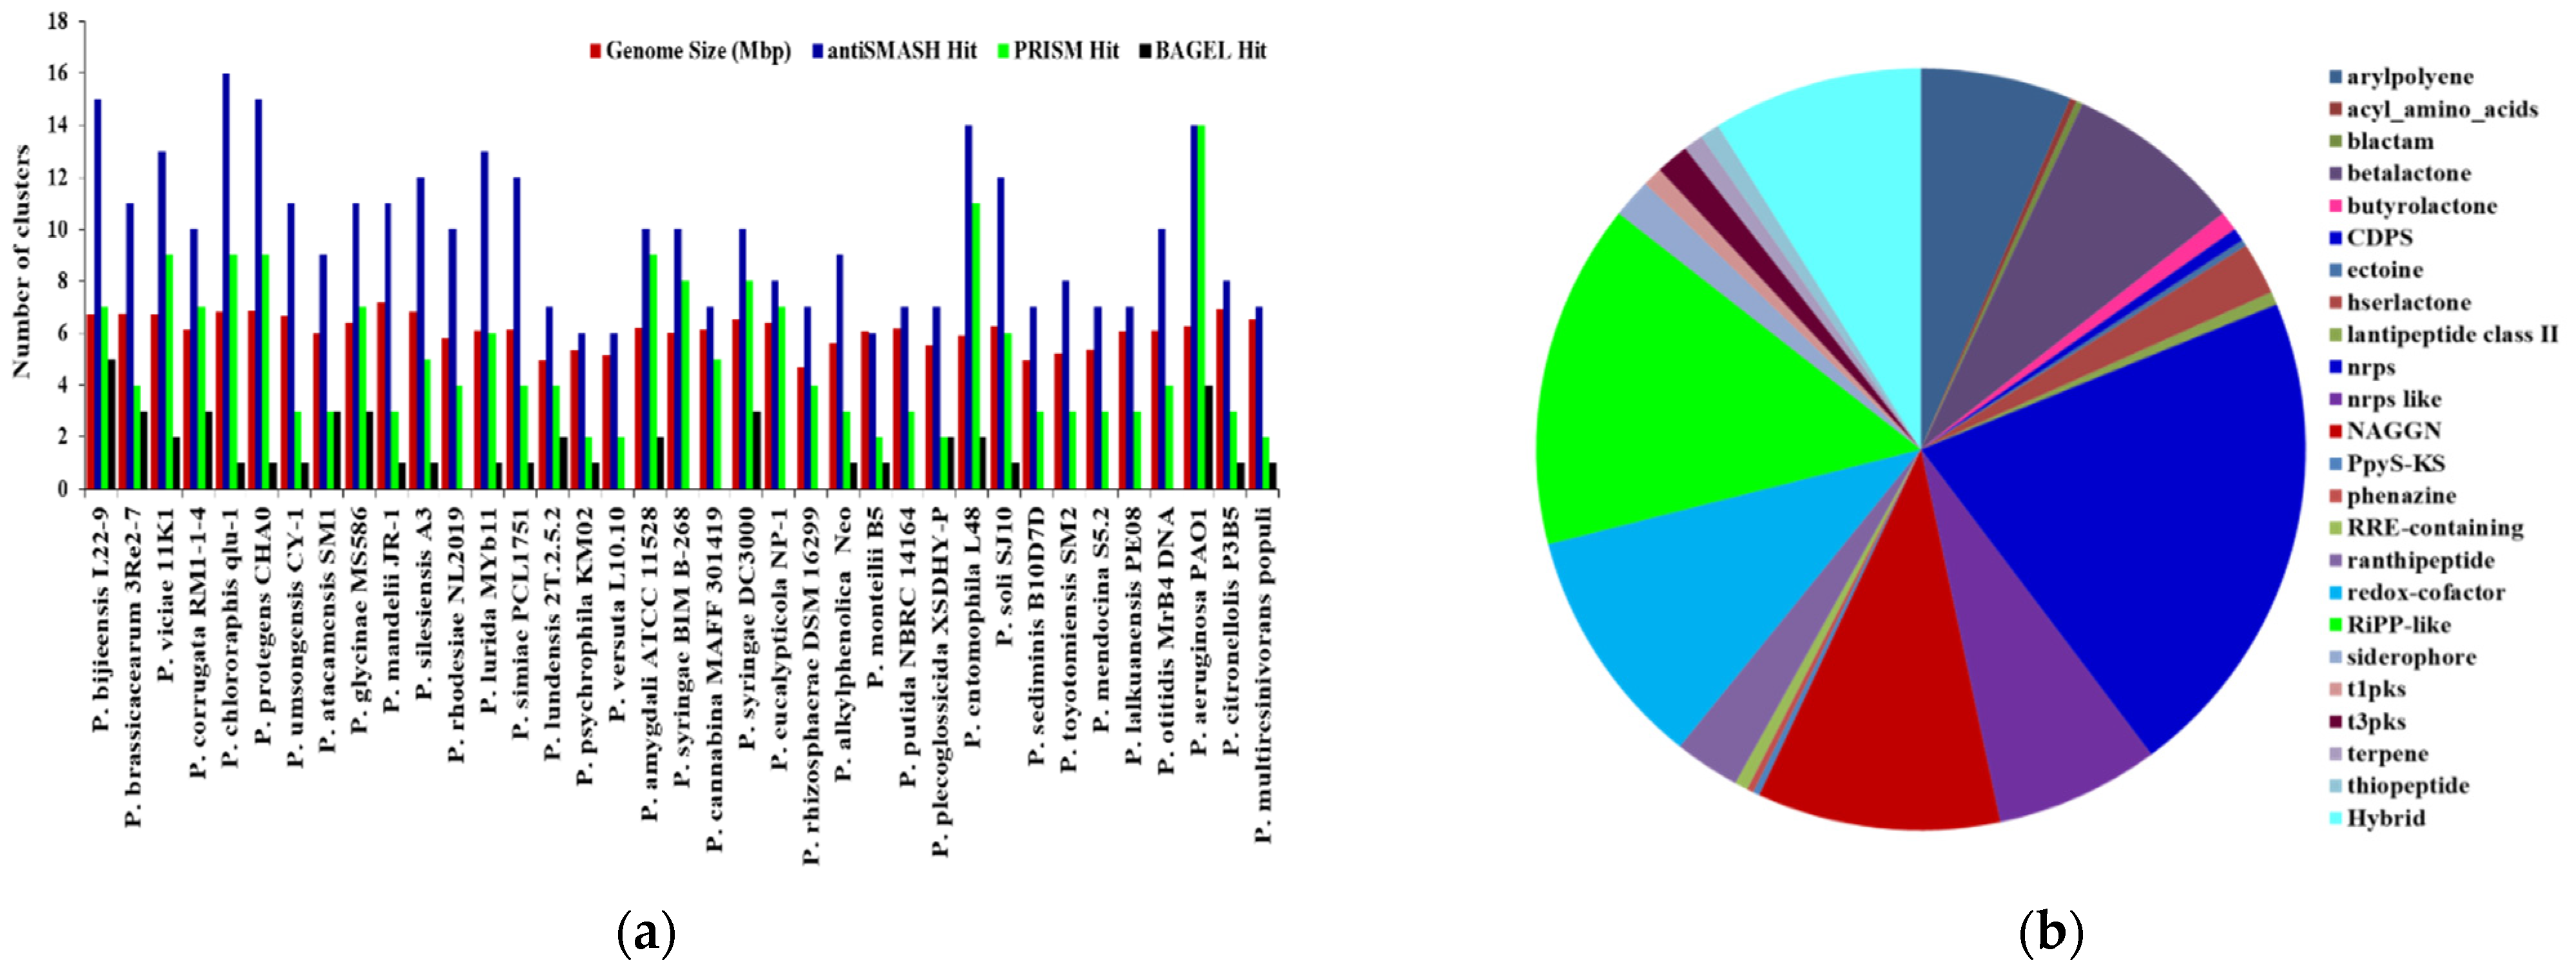
2.1. Distribution and Diversity of Biosynthetic Potential in Pseudomonas at Species Level

A total of 50 annotated reference genomic sequences of different Pseudomonas species and 31 subspecies of P. fluorescence are available in NCBI genome datasets. Among them, we analyzed 37 complete genomes of Pseudomonas species and 23 P. fluorescence subspecies genomes for their biosynthetic potential with different genome mining tools. The rest of the genomes were avoided due to the lack of the rpoB gene and were not included in the phylogenetic tree (Supplementary Files 1 and 2).

2.1.1. Putative BGC Prediction by antiSMASH in Pseudomonas Species Genomes

All Pseudomonas reference genomes were scanned with antiSMASH for the exploration of known and putative secondary metabolite biosynthetic potential in their genome sequences. The diversity of these species influences the phylogenetic diversity and heterogeneity (Figure 1).
In total, the scanning of the 37 Pseudomonas species references genome data revealed 363 BGCs coding for small molecule classes, including nonribosomal peptides (NRPs), polyketides (PKs), ribosomally synthesized and post-translationally modified peptides (RiPPs), terpene, saccharides, and PKS/NRPS hybrids. We identified a total of 24 major BGC classes, such as aryl polyene, acyl_amino_acids, beta-lactam, beta-lactone, butyrolactone, tRNA-dependent cyclodipeptide synthases (CDPS), ectoine, hserlactone, lantipeptide class II, nonribosomal peptides (NRPs), NRPS-like, N-acetylglutamine amide (NAGGN), PpyS-KS, phenazine, RRE-containing, ranthipeptide, redox-cofactor, RiPP-like, siderophore, t1pks, t3pks, terpene, thiopeptide, and hybrid BGCs (Figure 1) (Supplementary File 3).
The most typical BGCs in Pseduomonas were detected to encode the multidomain enzyme nonribosomal peptide synthetase (NRPS) and polyketide synthases (PKS). Their products, nonribosomal peptides (NRPs) and polyketides (PKs), are two varied groups of secondary metabolites that have been identified as toxins, medicines, siderophores, and pigmentation agents. The analysis of the Pseudomonas species’ genomic sequences demonstrated their potential to produce a variety of NRPs through biosynthesis. The NRPS modules encoded in typical modular NRPS gene clusters had at least adjacent condensation (C) and adenylation (A) domains. We included NRPS-like clusters lacking the C domain in the NRPS clusters because they could actively produce secondary metabolite even without a proper C domain. A PKS type had at least a ketosynthase (KS) domain. The hybrid kind was made up of NRPS and PKS modules together. So far, three kinds of PKS have been identified in bacterium species. The polyketide chain elongation and synthesis are catalyzed non-iteratively by most type I PKS. The biosynthetic domains of type II PKSs encode iteratively active aromatic polyketides. The acyl carrier protein (ACP) is used by type I and II PKS to trigger acyl CoA precursors for the development of polyketide molecules. Enzymes iteratively active for aromatic polyketide biosynthesis independent of ACP are also found in type III PKSs.
RiPPs’ post-translational modifications increase the structural diversity of short peptides which are generally stabilized as a result of these changes, making them more resistant to heat and proteases.
Hybrid BGCs encode more than one type of scaffold-synthesizing enzymes for different types of secondary metabolites which were joined in a variety of combinations [25,40], including hybrid hserlactone–NRPS, NRPS-like–T1PKS, other–NRPS, NRPS–ranthipeptide, NRPS-like–LAP, NRPS–terpene, siderophore–NRPS, NRPS-like–NRPS–T1PKS, T1PKS–NRPS, hserlactone–NRPS, NRPS–NRPS-like, aryl polyene–resorcinol, resorcinol–aryl polyene, redox-cofactor–RiPP-like, T3PKS–CDPS, NRPS-like–beta-lactone, hserlactone–NRPS–NRPS-like, NRPS–resorcinol–ranthipeptide, NRPS-like–NRPS, NRPS–ranthipeptide, NAPAA–redox-cofactor, siderophore–NRPS–terpene, T1PKS–NRPS–NRPS-like, beta-lactone–ranthipeptide, phenazine–NRPS, hserlactone, phenazine, and RiPP-like–NRPS-like–NRPS. The origins and precise roles of these hybrid BGCs are unknown, but they facilitate significant structural and chemical alterations in the main classes of BGCs, as well as the potential to develop medically useful derivatives of a molecule [41,42]. We found a total of 32 hybrid clusters among the 37 Pseudomonas species. Sixteen species do not have any hybrid cluster. P. chlororaphis qlu-1 and P. entomophila L48 have the largest number of three hybrid clusters. Nine Pseudomonas species contain double hybrid clusters. We acquired a total of 15 unique BGCs when we separated the 25 BGCs into their hybrid forms (Supplementary File 3).
In total, Pseudomonas bacteria carry between 6–16 BGCs per genome (mean = 9.81, s.d. = 2.85). Among the 37 genomes, the smallest genome size was found to be 4.689 Mbp in P. rhizosphaerae DSM 16299, which has 7 BGCs. The largest genome size, 7.189 mb, found in P. mandelii JR-1 had 11 BGCs, whereas the most BGCs (16) were found in P. chlororaphis qlu-1, whose genome size is 6.828 Mbp. Three genomes (P. monteilii B5, P. versuta L10.10 and P. psychrophila KM02) contain at least 6 BGCs. P. bijieensis L22-9 and P. protegens CHA0 have the second most BGCs (15) (Figure 2a). The most prevalent classes of BGCs were those encoding NRPSs, RiPPS, redox-cofactor, and NAGGN (Table 1, Figure 2b). The number of BGCs per genome has a moderate but statistically significant positive connection with genome size and total genes (R2 = 0.3556, p-value = 0.0).
The most common BGCs were for NAGGN (present in 37 genomes), non-ribosomal peptide synthetases (NRPS; 35 genomes), redox-cofactor (34 genomes), RiPP-like (31 genomes), aryl polyene, beta-lactone and NRPS-like (23 genomes), and ranthipeptide (10 genomes) (Supplementary File 3). These seven types of BGCs accounted for more than two-thirds of all the BGCs detected in a genome.
According to our findings, a BGC class can be found in numerous copies in a strain. Taking NRPS clusters as an example, 21 Pseudomonas species contain multiple NRPS BGCs, including P. entomophila L48 with the most NRPS clusters (6); P. soli SJ10, P. syringae BIM B-268, P. viciae 11K1; and P. bijieensis L22-9 with the second most clusters (4); P. aeruginosa PAO1, P. syringae pv. tomato str. DC3000, P. amygdali pv. tabaci str. ATCC 11528, P. simiae PCL1751, P. lurida MYb11, P. glycinae MS586, P. protegens CHA0, and P. brassicacearum 3Re2-7 with 3 NRPS clusters; and P. otitidis MrB4 DNA, P. lalkuanensis PE08, P. putida NBRC 14164, P. alkylphenolica Neo, P. eucalypticola NP-1, P. lundensis 2T.2.5.2, P. rhodesiae NL2019, and P. chlororaphis qlu-1 with 2 NRPS clusters. Additionally, P. mendocina S5.2, P. toyotomiensis SM2, P. silesiensis A3, and P. umsongensis CY-1 each have double beta-lactone BGCs. Seventeen Pseudomonas sp. have multiple RIPPS-like cluster. P. mandelii JR-1 has the highest number of RIPPS-like clusters, i.e., 4 (Supplementary File 3).
A few BGCs were rare, appearing in only a few genomes. They include BGCs predicated for acyl_amino_acids, beta-lactam, ectoine, PpyS-KS, phenazine (1 genome), CDPS, lantipeptide class II, RRE-containing (2 genomes), butyrolactone, t1pks, terpene, thiopeptide (3 genomes), t3pks (5 genomes), and siderophore (6 genomes) (Figure 1).
Based on our analysis in silico for the categorization of potential compounds by the BGCs in Pseudomonas genomes, most NRPS BGCs encrypted compounds predicted structurally to be new NRPs similar to cichopeptin, pyoverdine, TP-1161, pyochelin, putisolvin, entolysin, lokisin, rimosamide, coelibactin, ambactin, tolaasin I/F, anikasin, rimosamide, lokisin, caryoynencin, crochelin A, viscosin, and syringomycin. Some BGCs are predicted to form NRP-like compounds similar to fragin, chejuenolide A/B, ambactin, fragin, coronatine, and L-2 amino-4 methoxy-trans 3-butonoic acid.
Most of the hybrid BGCs in the genomes of Pseudomonas encrypted compounds predicted to have similar structures to yersiniabactin, syringomycin, pyoverdine, thuggacin, pseudomonine, pseudopyronine A/B, endophenazine A/B, pyocyanine, pseudomonic A, 1-nonadecene, rimosamide, methanobactin, and banamide 1/2/3.

2.1.2. Putative BGC Prediction by PRISM in Pseudomonas Species Genomes

The PRISM 4 analyses for the Pseudomonas genome datasets revealed a total of 191 different types of BGCs (Supplementary File 3). We found a total of 97 NRPS and 41 PKS BGCs. Some hybrids clusters were also seen for melanin, NRPS-independent siderophore, ectoine, isonitrile, tabtoxin, cyclodipeptide (XYP family), acyl homoserine lactone, pantocin, aminoglycoside, class II/III confident bacteriocin, resorcinol, and class II lantipeptide, infrequently found in different genomes of Pseudomonas.

2.1.3. Putative BGC Prediction by BAGEL in Pseudomonas Species Genomes

From the BAGEL4 data analysis, we identified 49 bacteriocins coding clusters for the whole genome datasets of Pseudomonas species (Supplementary File 3). Bacteriocins are categorized into four subgroups based on their chemical structures and modes of action. Class I bacteriocins are post-translationally modified peptides having antibacterial action. Bacteriocins of class II are antimicrobial peptides that have not undergone post-translational modification and are split into four subclasses. Bacteriocins of class III, commonly known as bacteriolysins, are heat-labile proteins having a molecular weight of >10 kDa. The C-terminal domains of these bacteriocins demonstrate similarity to endopeptidases and selectivity for target cells. Bacteriocins of class IV are cyclic bacteriocins that have undergone post-translational modification.
Most of the bacteriocins found here are annotated as class III bacteriocins with molecular weight > 10 kDa showing similarity with colicin_E6, carocin_D, colicin_E9, putidacin_L1, colicin, lin_M18, pyocin_S2, and colicin-10. Some Pseudomonas species are shown to produce class II bacteriocins exhibiting a similar hit to microcin, Pep5, bottromycin, class II lanthipeptide, and class III bacteriocins.

2.1.4. KS and C Domain Determination in the Pseudomonas Genus Using NaPDoS

KS and C domains represent, respectively, the presence of BGCs for PKs and NRPs. We found a total 274 KS domains and 810 C domains from the 37 Pseudomonas reference genomic sequences (Supplementary File 3). The most KS domains (11) were found in P. glycinae MS586 and the least KS domains (2) were seen in the P. plecoglossicida XSDHY-P genome while the average number of KS domains was found to be 7.406. On the other hand, the highest number of C domains (70) were found in the P. syringae BIM B-268, and no C domain existed in the P. psychrophila KM02. The average C domain number was 42.63.

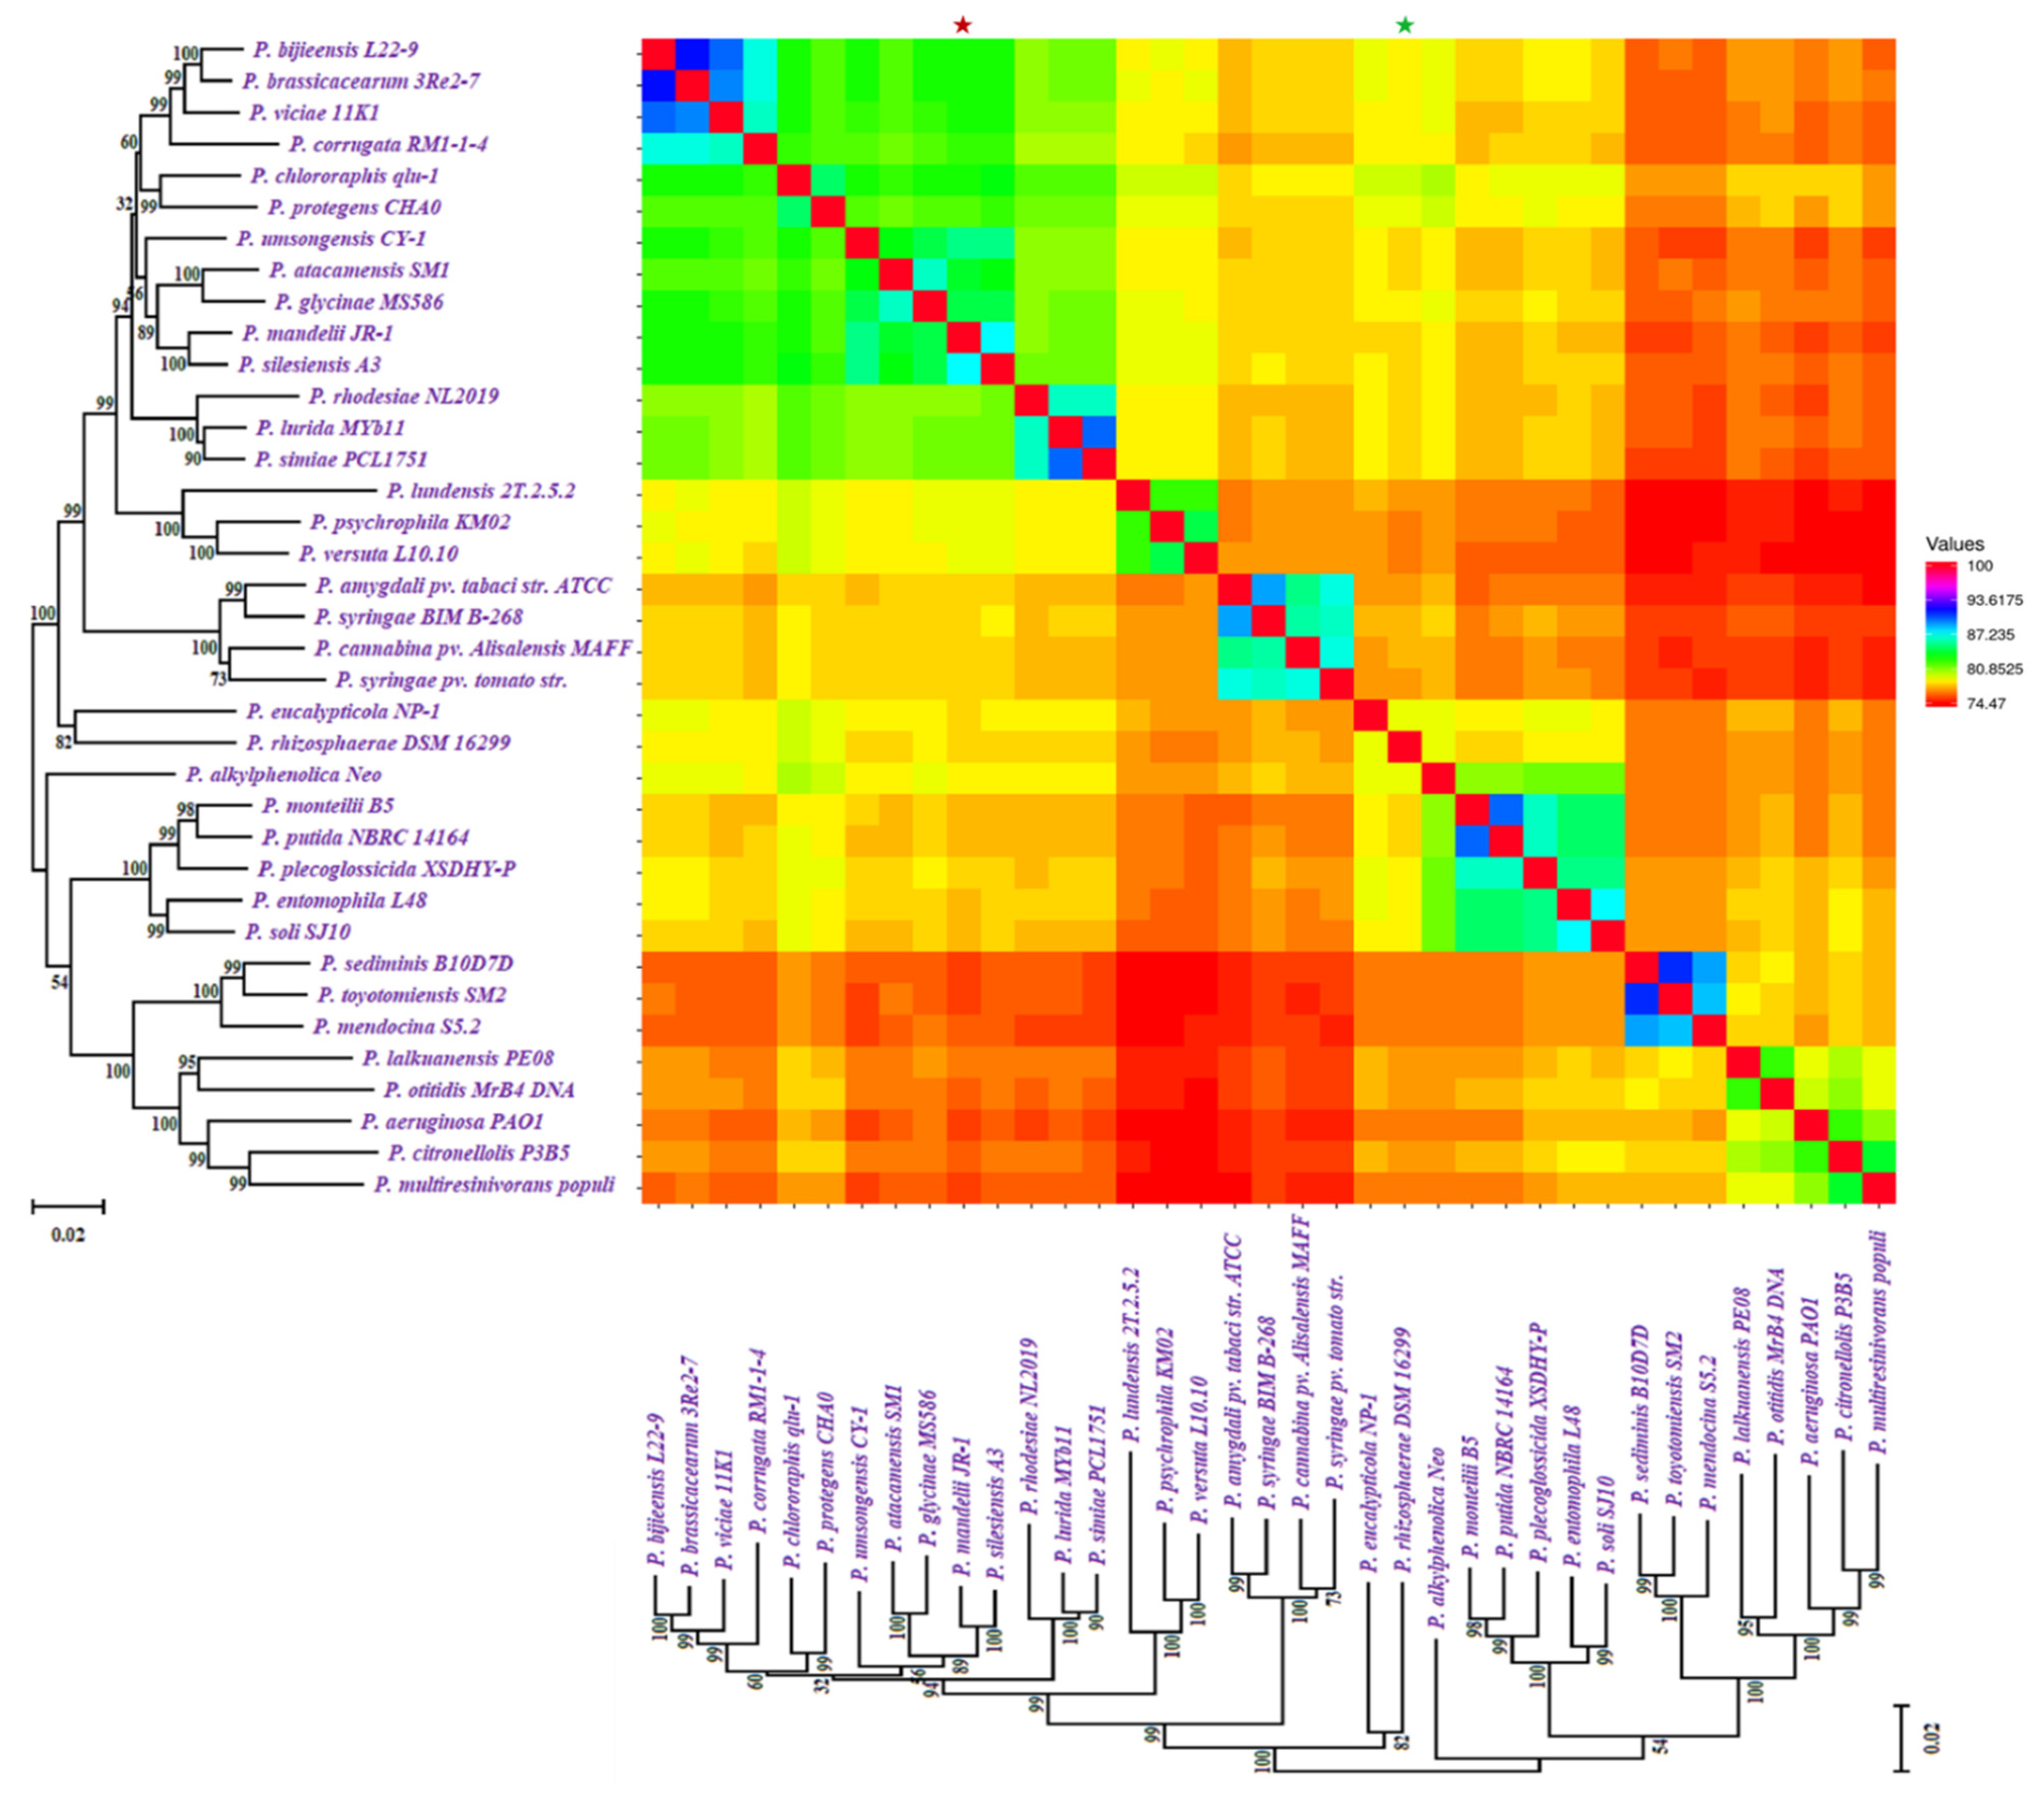
2.2. Whole-Genome Comparisons in Pseudomonas Species

Based on ANI (average nucleotide identity) analyses and the 95 percent threshold for species delimitation, the majority of input strain clusters were grouped into six core species identification groupings. ANI is computed using different algorithms: ANIb (ANI algorithm using BLAST), ANIm (ANI using MUMmer), OrthoANIb (OrthoANI using BLAST), and OrthoANIu (OrthoANI using USEARCH). The distribution of the six clades found in previous phylogenetic analyses is the same as in this one. Figure 3 showed the similarity across the whole genomes of our studied Pseudomonas species. Two strains were considered co-specific when they shared more than 95% nucleotide identity on at least 70% of their whole genome sequence.

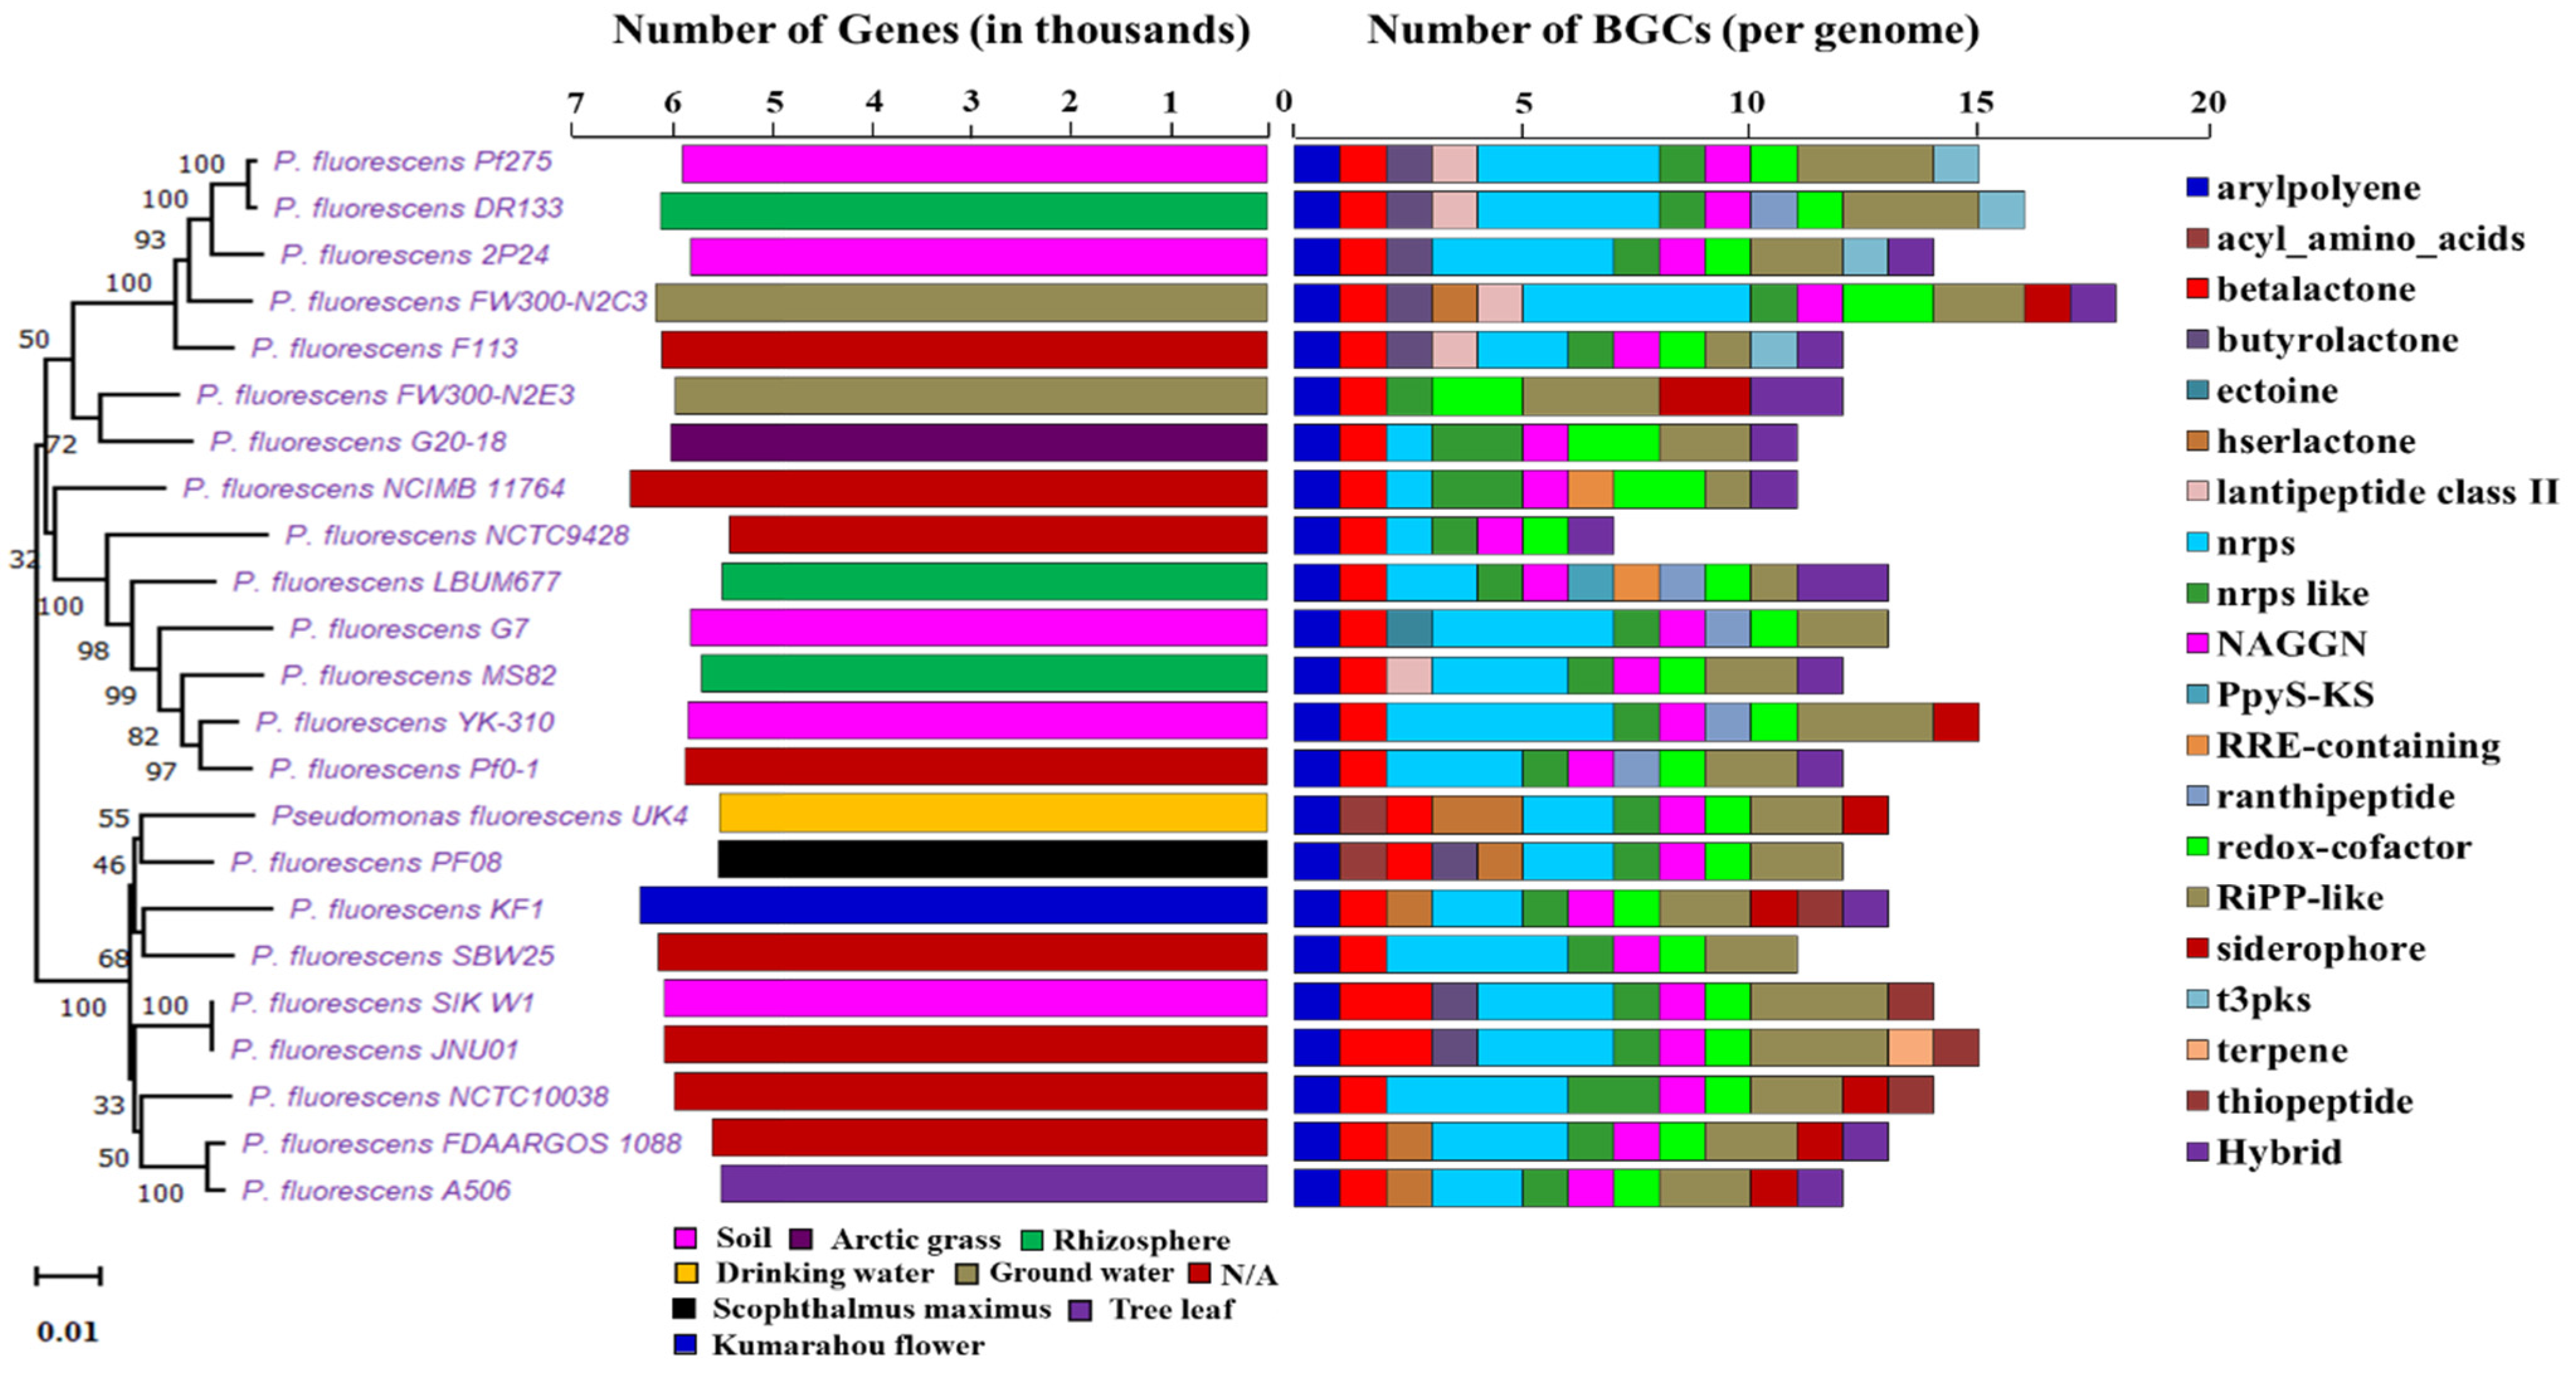
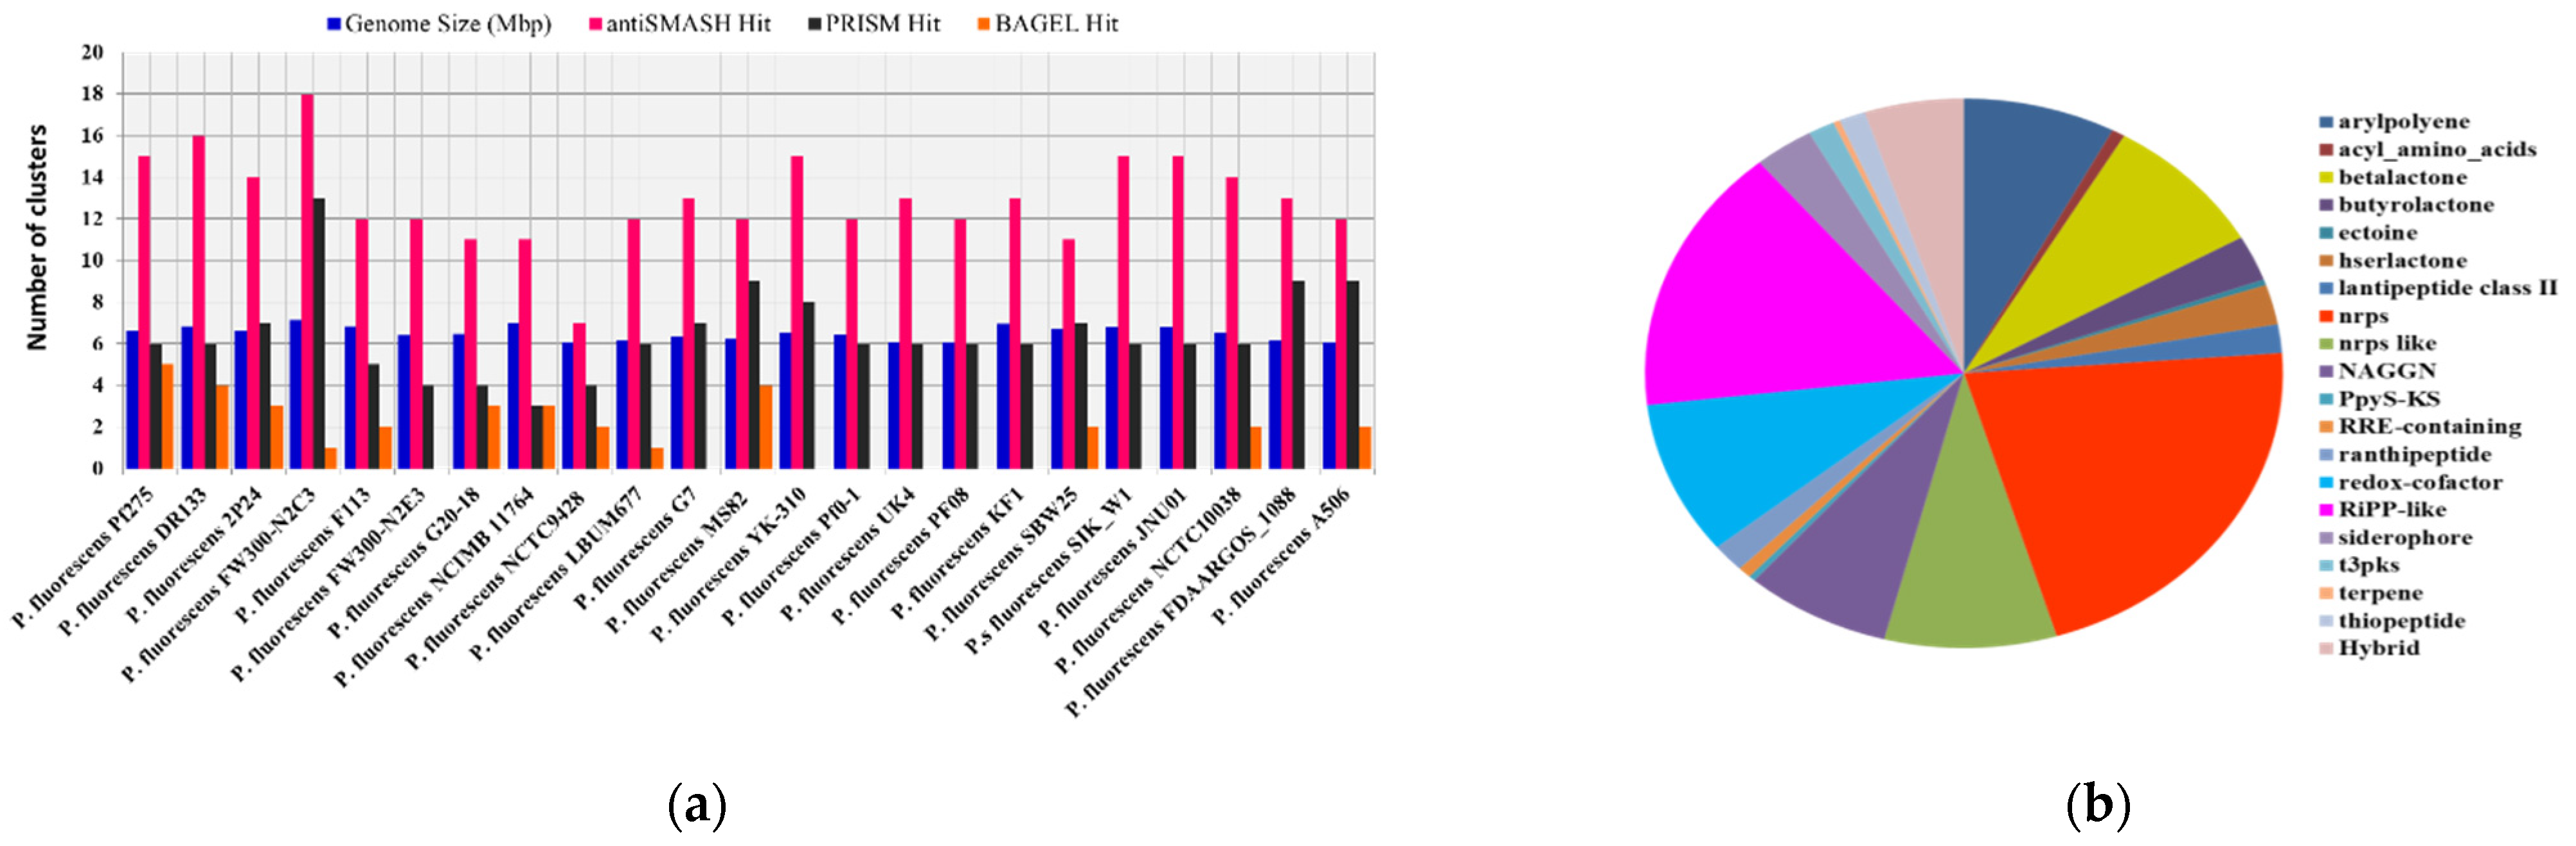
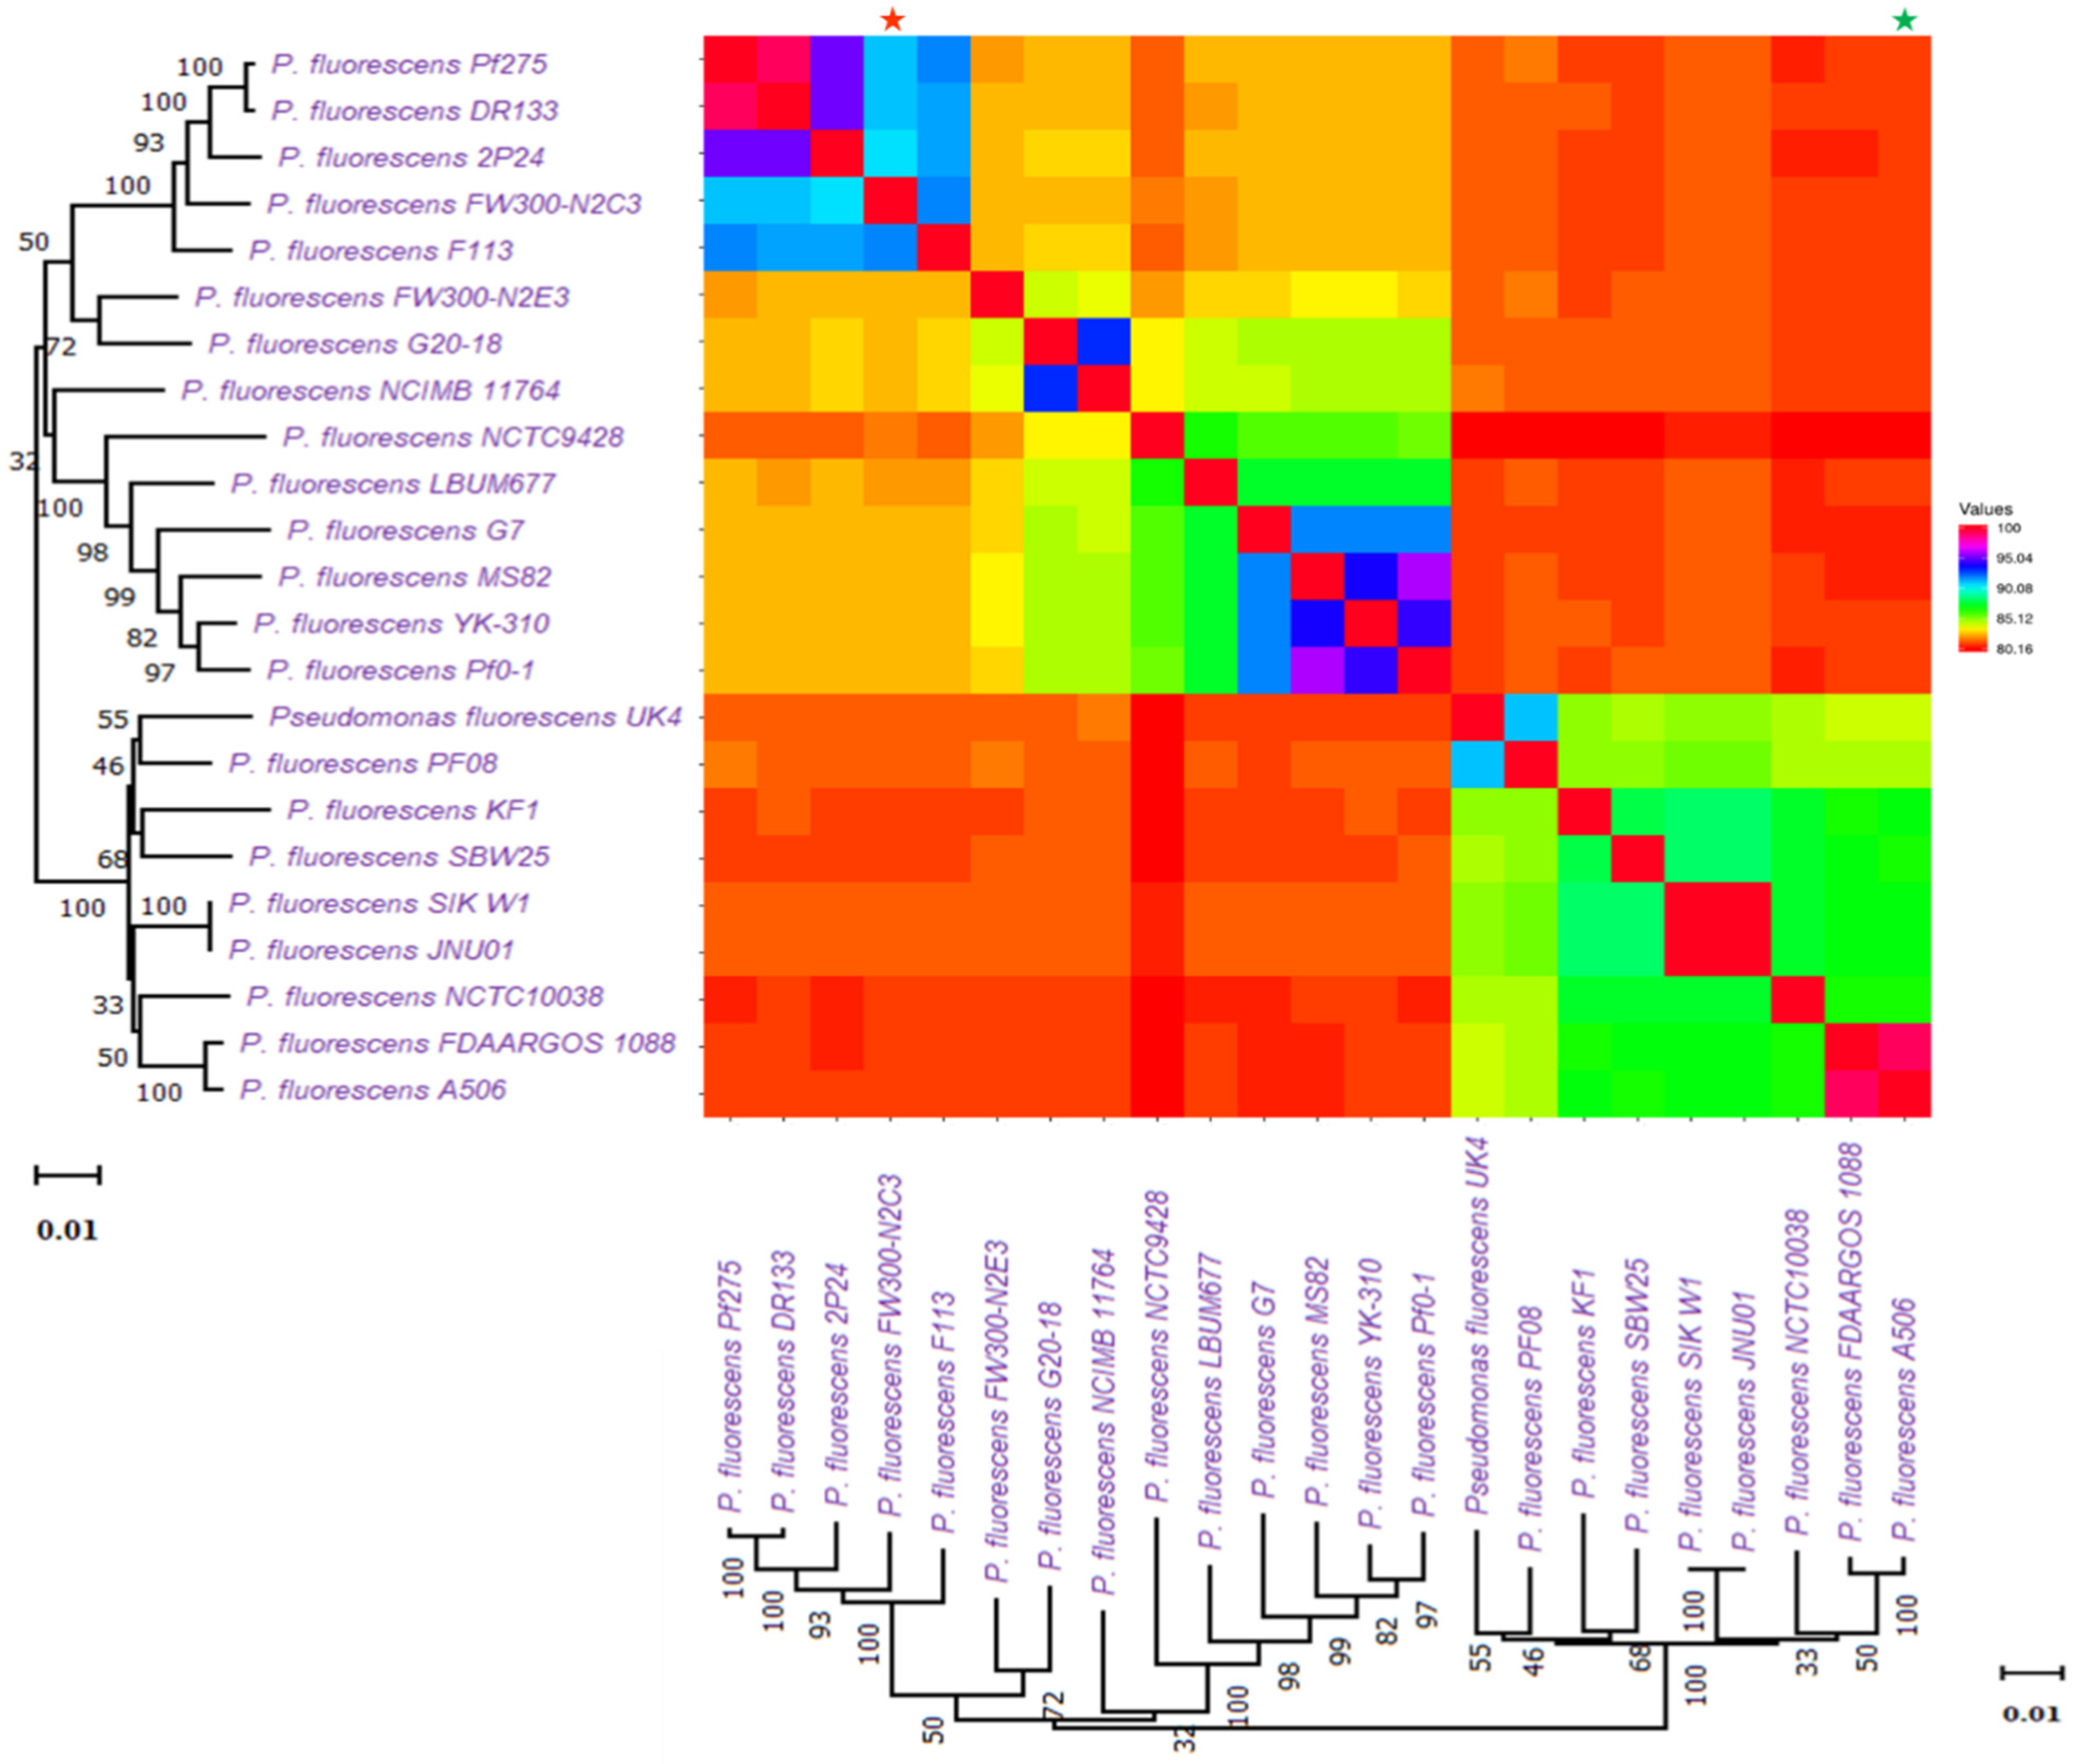
2.3. Distribution and Evolution of Secondary Metabolites in Pseudomonas fluorescence at Subspecies Level

In order to understand the metabolic and biosynthetic potential in subspecies level of Pseudomonas, we chose the P. fluorescence reference genomes for our study. We found obvious variation in the genome size, genes number, G+C content, and biosynthetic capability among strains of P. fluorescence (Supplementary File 4). Figure 4 exhibits the phylogenetic relationship with the diversity of biosynthetic potential among the P. fluorescence subspecies with their gene numbers and habitats.
Though strains of P. fluorescence share similarly sized genomes, due to belonging to a common species, the BGC number shows obvious differences between different strains. P. fluorescens FW300-N2C3 has the largest genome size (7.119 Mbp) with the most BGCs (18) and P. fluorescens NCTC9428 has least 7 BGCs with a size of 6.034 Mbp. P. fluorescens A506 has the smallest genome size with 12 BGCs (Table 2). The antiSMASH tool detected a total of 298 different BGCs in P. fluorescence reference genomes (Supplementary File 4, Figure 5b). We found a total of 20 different types of major classes of BGCs in P. fluorescence, predicted to be similar to arylpolyene-23, acyl_amino_acids-2, betalactone-25, butyrolactone-8, ectoine-1, hserlactone-7, lantipeptide class II-5, NRPS-64, NRPS-like-26, NAGGN-22, PpyS-KS-1, RRE-containing-2, ranthipeptide-5, redox-cofactor-27, RiPP-like-47, siderophore-9, t3pks-4, terpene-1, thiopeptide-4, and hybrid-15 (Supplementary File 4, Figure 5b).
We found a total of 149 BGCs cluster detected by PRISM 4. Among them, there were 76 clusters for NRPS and 23 for PKS (Supplementary File 4). We found a total of 34 bacteriocins detected by BAGEL4 (Supplementary File 4). Most of them are colicin bacteriocins (type I). A few microcin, PaeM, putidacin, and class II lanthipeptide were also seen. On the contrary, antiSMASH hit a total of clusters for 90 RiPPs, including 47 RiPP-like compounds, 27 redox-cofactors, 5 class II lantipeptides and ranthipeptides, 4 thiopeptides, and 2 RRE-containing compounds. Whole genome similarity across genomes of P. fluorescence subspecies was also investigated (Figure 6). The comparison followed the same sequences as the phylogenetic tree in Figure 4.

3. Discussion

Projects to sequence the genomes of microorganisms at the early stages of their development discovered dozens of cryptic biosynthetic areas inside the industrially important, well-studied bacterial genomes and sparked hopes that genome mining would lead to a new “golden era” of novel NPs.
The main goal of this study was to identify probable drug-like metabolites using publicly available data for Pseudomonas species and P. fluorescens sub-species reference genomes from NCBI. Despite earlier thorough research, our findings demonstrated that both Pseudomonas species and P. fluorescence sub-species have a large and distinct natural product metabolic potential with high diversity, indicating that they are still a good source of novel metabolites.
Comparative genomic analysis is an effective approach for revealing microorganisms’ capacity for the production of novel specialized compounds. Comparative genomics investigations in NP fields have revealed that there is a plethora of new compounds embedded in both culturable and non-culturable microorganism genomes waiting to be revealed. The findings that follow add to our knowledge of their genetics and behaviors.
The research presented here is the first step in establishing a comprehensive methodology for analyzing natural compounds from the Pseudomonas genus. The BGC patterns indicated that certain species and sub-species of Pseudomonas and P. fluorescence had a higher incidence of metabolic potentials in NPs than others. We grouped every gene cluster in each genus well-represented by whole genomes using different comparisons. Such gene cluster families are necessary for cluster determination.
Comparative genomics revealed the similarity and difference between the species despite their differences in geography, morphology, and secondary metabolite profiles. Gene cluster networking highlights that this genus is distinctive in the number of secondary metabolite pathways, distinct from all other bacterial gene clusters to date. These findings portend that future genome-guided secondary metabolite discovery and isolation efforts should be highly productive.
Besides most of the BGC NRPSs common in Pseudomonas predicted for new NRPs, Pseudomonas genomes carry some BGCs for arylpolyene type compounds, similar to APE Vf, syringolin A, beta-lactone type compounds, similar to fengycin, burkholderic acid, tetarimycin A/B, redox-cofactor type compounds, similar to lankacidin C, ranthipeptide type compounds, similar to pyoverdine, NAGGN type compounds, similar to O-antigen, hserolactone type compounds, similar to toxoflavin/frevenulin, cepacin A, resorcinol type compounds, similar to pyoverdine, T3 PKS type compounds, similar to Fischer indole, siderophore type compounds, similar to xanthoferrin, vibrioferrin, terpene type compounds, similar to sodorifen, bacillomycin D, carotenoid, 2-methylisoborneol, thiopeptide type compounds, and similar to lipopolysaccharide. There are also some unspecified BGCs found for LAP, beta-lactone, RiPP-like, NAGGN, hserolactone, acyl_amino_acids, NAGGN, butyrolactone, T3 pks, siderophore, aryl polyene, and RRE-containing compounds.
Hence, the data here will help us in future BGC prioritization. For example, we found that all the Pseudomonas species and P. fluorescence subspecies contain the pyoverdine gene cluster, where most of them encoded more than one pyoverdine BGC. All the redox-cofactor BGC type encoded lankacidin C, which showed a considerable antitumor activity [43]. Interestingly, all the redox-factor encoded lankacidin BGC showed only a 13% similarity with most known BGCs of lankacidin C, implying a high possibility to isolate lankacidin-analogues with new structures.
However, beta-lactam, CDPS, phenazine, and terpene BGCs are not seen in P. fluorescence reference genomes. The findings show that the genus has a high level of route diversity, with the majority having been gained very recently in its history. The patterns and phylogenetic trajectories of these routes reveal the processes that create novel compound variety, as well as the tactics bacteria adopt to enhance their population-level ability to manufacture various molecules.
The high diversity of NP BGCs at the subspecies level demonstrated that the secondary metabolite production pathways are among the fastest-evolving genomic elements yet found [44]. Gene duplication, loss, HGT, NRPS, and PKS genes alteration, domain reorganization, and module redundancy [44,45,46] probably contribute to the emergence of novel small-molecule diversity.
The phylogenetic trajectories of individual PKS and NRPS domains have been noted, especially as pertains to the use of the KS and C domains to reveal information on enzyme design and function [47,48]. These studies have also contributed to the understanding of how widespread HGT is among biosynthetic genes for NP production [49,50], and the variation among PKS and NRPS gene phylogenies [51]. Although establishing the evolutionary histories of complete pathways is more difficult than resolving the evolutionary histories of individual genes or domains, comparative investigations of BGCs have been beneficial in identifying route boundaries [52].
In all, Pseudomonas species have demonstrated significant variation within the genus, and among species, and even strains within the same species, according to comparative genomics studies. Many of these BGCs were strain-specific, supporting the theory that they perform specialized metabolic tasks unique to certain ecological niches.

4. Materials and Methods

4.1. Collection of Genome Sequences

We used the NCBI Datasets’ genome browser (NCBI: https://www.ncbi.nlm.nih.gov/datasets/genomes/, accessed on 31 August 2021) to search for and collect the Pseudomonas complete genome sequences. We found a total of 27,125 different types of Pseudomonas genomes, including contigs, scaffold, chromosome, and complete genome. We filtered, as reference genome, an annotated and complete assembly level to obtain Pseudomonas genome sequences and retrieved 50 complete reference genome sequences in FASTA format of different Pseudomonas species and 31 complete reference genome sequences of Pseudomonas fluorescens from NCBI datasets on 31 August 2021. We discarded the 13 Pseudomonas and 7 P. fluorescence reference genomes from our study due to the lack of rpoB gene in these sequences (Supplementary Files 1 and 2). Supplementary Files 3 and 4 show genome assembly, accession numbers, and genome information (genome size, genes number, and genes of protein coding).

4.2. Phylogeny and Whole Genome Comparisons

The rpoB sequences were extracted from the genomic assemblies and aligned using MEGA X. [53]. The phylogenetic tree was constructed using rpoB sequences in these genomes (Supplementary Files 1 and File 2). Some genome sequences lacked rpoB genes, and others were in poor conditions; therefore they were removed from the phylogenetic tree. Using the program MEGA X [53] and a general time reversible (GTR) nucleotide substitution model [54], four gamma categories for rate heterogeneity, and 100 bootstrap replicates, the rpoB sequences were utilized to construct a maximum likelihood phylogeny (Supplementary Files 1 and 2).
Comparative genomics analyses were obtained using the pairwise average nucleotide identity (ANI) with an improved ANI algorithm, called OrthoANI [55] to check the genetic diversity among genomes, or clear species boundaries (Supplementary Files 3 and 4). Typically, the ANI values between genomes of the same species are above 95%.

4.3. Computational Approaches for the Identification of Gene Clusters Potentially Encoding Secondary Metabolites

We calculated the number of BGCs for each genome based on the three methodologies. The genome mining prediction platforms, namely, antiSMASH 6 [56], PRISM 4 [57] and BAGEL4 [58], using a combination of computational programs with default settings were implemented for the possible discovery of BGCs involved in the production of secondary metabolites. The antiSMASH tool makes it easy to find, annotate, and research secondary metabolite biosynthesis gene clusters all throughout the genome. Similarly, BAGEL4 is meant to comprehensively mine RiPPs and bacteriocin [58], whereas PRISM 4 is developed to analyze secondary metabolite structure and biological activity in a complete manner [57]. These sophisticated computer model services give accurate predictions of the encoding potential of microbial secondary metabolites [59]. These programs use several database systems for BGC annotation from genomic sequences, such as the principles of the hidden Markov model (HMM) [60], BLAST algorithm [61], PFAM [62], GenBank [63], UniProtKB [64], BACTIBASE [65] CAMPR3 [66], and the MIBig data repository [67]. Furthermore, we used NaPDoS [68] to detect KS and C domains in these genomic sequences.

4.3.1. antiSMASH 6.0

The antiSMASH 6.0 tool is an advanced and rigorous bioinformatics platform that uses a predictive method to identify and annotate existing and suspected undiscovered BGCs. The public version of antiSMASH 6.0 can be found online (antiSMASH: https://antismash.secondarymetabolites.org/#!/start, accessed on 31 August 2021) while R&D versions can be found online (R&D versions: https://bitbucket.org/antismash/, accessed on 31 August 2021) [56]. Profile hidden Markov models (pHMMs), as published by Medema et al., and the tool HMMER were used to find signature enzymes for the main categories of bioactive molecules [69]. The antiSMASH tool can create a database of presently existing BGCs across the tree of life “Minimum Information about a Biosynthetic Gene cluster” (MIBiG) community project (MIBiG: http://mibig.secondarymetabolites.org, accessed on 31 August 2021). The current antiSMASH version, which includes the ClusterFinder and ClusterBlast packages, may now detect potential unexplored forms of BGCs based on comparisons to existing BGCs and final chemical product information [56].

4.3.2. PRISM 4

PRISM 4 analyzes open reading frames with a library of hundreds of hidden Markov models and curated BLAST databases to annotate bacterial genomes for BGCs, and allows for genome-guided chemical structure prediction for every class of bacterial natural antibiotics now in use in clinical trials. Furthermore, PRISM 4 dramatically improves the coverage of enzymatic tailoring processes encoded inside conventional thiotemplated pathways. In order to predict the chemical structures of 16 different classes of secondary metabolites, PRISM 4 includes 1772 hidden Markov models (HMMs) and 618 in silico tailoring reactions. PRISM 4 as a freely accessible web server is available at (PRISM: https://prism.adapsyn.com/, accessed on 31 August 2021).

4.3.3. BAGEL4

BAGEL4, a user-friendly web server, allows researchers to mine bacterial (meta-) genomic DNA for ribosomally synthesized and post-translationally modified peptides (RiPPs) and (unmodified) bacteriocin. BAGEL4 is the most recent edition of the BAGEL package. Due to the need for new antibiotics and their crucial function in preserving food, microbial ecology, and plant biocontrol, demand in these families of compounds is growing. BAGEL4 is available for free online (BAGEL4: http://bagel4.molgenrug.nl, accessed on 31 August 2021). It also includes directories as well as a BLAST against the core peptide databases. The mining databases have been updated and expanded to include literature references as well as connections to UniProt and NCBI. It also contains an automatic promoter and terminator prediction, as well as the ability to submit RNA expression data to be presented alongside the clusters found. Additional enhancements include the annotation of context genes, which is now based on a quick blast against the UniRef 90 database’s prokaryote component, and the enhanced web-BLAST function, which dynamically imports structural data from UniProt such as internal cross-linking.

4.3.4. NaPDoS-Analysis of C and KS Domains from NRPS and PKS Clusters

NaPDoS [68], which is accessible online ( NaPDoS: https://npdomainseeker.sdsc.edu/, accessed on 31 August 2021) as a fast way to extract and categorize ketosynthase (KS) and condensation (C) domains from PCR products, genomes, and metagenomic datasets. Condensation (C) domains are functionally active protein sequences found in NRPS clusters that catalyze the creation of amide bonds, a key step in peptide elongation [70]. Likewise, in PKS clusters, ketosynthase (KS) domains catalyze the condensation process. These domains are good candidates for genomic study since they are highly conserved and may be utilized to differentiate between distinct NRPS/PKS natural product pathways. To uncover probable natural product pathways from NRPS and PKS gene clusters, the NaPDoS pipeline was utilized to compare C and KS domain sequences to a domain library of previously found natural products. Close database matches may be used to anticipate secondary metabolite generalized structures, whereas unique phylogenetic lineages can be utilized to discover new enzyme designs or secondary metabolite assembly processes. The findings provide a rapid method for analyzing secondary metabolite biosynthesis gene diversity and abundance in species or habitats, as well as a method for identifying genes associated with unknown biochemistry. The output from antiSMASH was used to extract the C and KS domains from NRPS and PKS found in the 37 Pseudomonas species and P. fluorescence genomes, which were then examined using the NaPDoS web server with default parameters.

5. Conclusions

Less than 10 percent of microorganisms’ biosynthetic capabilities are utilized in searching for bioactive NPs. Genome mining has tremendously benefited natural product developments. Currently, the genome sequences’ availability of diverse species of Pseudomonas and sub-species of P. fluorescence provides an excellent opportunity for comprehensive comparisons of their biosynthetic potential.
Here, by combining different computational tools, the species and sub-species genomic sequences of Pseudomonas were analyzed in silico and revealed a wide range of biosynthetic capabilities to produce diverse sets of secondary metabolites. These putative secondary metabolite coding clusters (BGCs) are promising targets for further research to uncover additional resources.
Large amounts of genomic data are now public, and significant progress has been made in data mining, chemical monitoring, single-cell techniques, and genetic approaches to pathway activation, making the cryptic metabolome accessible. New culturing methods, effective genome editing, and appropriate expression systems will eventually overcome key impediments to obtain hidden chemical diversity.
It is notable that additional methodologies are required to decipher these biosynthetic genome motifs into corresponding compounds to open a new era in the discovery of secondary metabolism. Specific triggers or stimuli are required to activate quiet or downregulated gene clusters and enhance compound production rates, allowing access to these cryptic compounds [71].

Supplementary Materials

The following are available online. Supplementary File 1: rpoB sequences from genomes of Pseudomonas species; Supplementary File 2: rpoB sequences from genomes of P. fluorescence subspecies; Supplementary File 3 & 4: different genome mining data from Pseudomonas species and P. fluorescence subspecies.

Author Contributions

Conceptualization, supervision, funding acquisition, project administration, R.L. and A.L.; methodology, K.A. and M.M.I.; software, K.A., C.L. and S.S.; validation, Q.S., L.Z. and G.Y.; formal analysis, K.A. and Q.S; investigation, K.A.; visualization, Y.Z.; resources, M.M.I.; data curation, J.H.; writing—original draft preparation, K.A.; writing—review and editing, Y.Z., R.L. and A.L. All authors have read and agreed to the published version of the manuscript.

Funding

This study was supported by the National Key R&D Program of China (2019YFA0905700, 2018YFA0900400), National Natural Science Foundation of China (32170038, 31170050), Shandong Provincial Natural Science Foundation of China (ZR2020MC015, ZR2017MC031), the Open Project Program of the State Key Laboratory of Bio-based Material and Green Papermaking (KF201825), the 111 Project (B16030), and The Fundamental Research Funds of Shandong University (2018GN021).

Institutional Review Board Statement

Not applicable.

Informed Consent Statement

Not applicable.

Data Availability Statement

Not applicable.

Conflicts of Interest

The authors declare no conflict of interests.

References

  1. Condurso, H.L.; Bruner, S.D. Structure and noncanonical chemistry of nonribosomal peptide biosynthetic machinery. Nat. Prod. Rep. 2012, 29, 1099–1110. [Google Scholar] [CrossRef] [Green Version]
  2. Hur, G.H.; Vickery, C.R.; Burkart, M.D. Explorations of catalytic domains in non-ribosomal peptide synthetase enzymology. Nat. Prod. Rep. 2012, 29, 1074–1098. [Google Scholar] [CrossRef] [PubMed] [Green Version]
  3. Walsh, C.T. Insights into the chemical logic and enzymatic machinery of NRPS assembly lines. Nat. Prod. Rep. 2016, 33, 127–135. [Google Scholar] [CrossRef] [PubMed]
  4. Hertweck, C. The biosynthetic logic of polyketide diversity. Angew. Chem. Int. Ed. 2009, 48, 4688–4716. [Google Scholar] [CrossRef]
  5. Piel, J. Biosynthesis of polyketides by trans-AT polyketide synthases. Nat. Prod. Rep. 2010, 27, 996–1047. [Google Scholar] [CrossRef] [PubMed]
  6. Dunbar, K.L.; Mitchell, D.A. Revealing nature’s synthetic potential through the study of ribosomal natural product biosynthesis. ACS Chem. Biol. 2013, 8, 473–487. [Google Scholar] [CrossRef] [PubMed] [Green Version]
  7. Arnison, P.G.; Bibb, M.J.; Bierbaum, G.; Bowers, A.A.; Bugni, T.S.; Bulaj, G.; Camarero, J.A.; Campopiano, D.J.; Challis, G.L.; Clardy, J. Ribosomally synthesized and post-translationally modified peptide natural products: Overview and recommendations for a universal nomenclature. Nat. Prod. Rep. 2013, 30, 108–160. [Google Scholar] [CrossRef] [PubMed]
  8. Letzel, A.-C.; Pidot, S.J.; Hertweck, C. Genome mining for ribosomally synthesized and post-translationally modified peptides (RiPPs) in anaerobic bacteria. BMC Genom. 2014, 15, 983. [Google Scholar] [CrossRef] [Green Version]
  9. Hudson, G.A.; Mitchell, D.A. RiPP antibiotics: Biosynthesis and engineering potential. Curr. Opin. Microbiol. 2018, 45, 61–69. [Google Scholar] [CrossRef] [PubMed]
  10. McCranie, E.K.; Bachmann, B.O. Bioactive oligosaccharide natural products. Nat. Prod. Rep. 2014, 31, 1026–1042. [Google Scholar] [CrossRef] [PubMed] [Green Version]
  11. Flatt, P.M.; Mahmud, T. Biosynthesis of aminocyclitol-aminoglycoside antibiotics and related compounds. Nat. Prod. Rep. 2007, 24, 358–392. [Google Scholar] [CrossRef]
  12. Massingill, J.L., Jr.; Hodgkins, J.E. Alkaloids of bacteria. Phytochemistry 1967, 6, 977–982. [Google Scholar] [CrossRef]
  13. Zotchev, S.B. Alkaloids from marine bacteria. Adv. Bot. Res. 2013, 68, 301–333. [Google Scholar]
  14. Mullowney, M.W.; McClure, R.A.; Robey, M.T.; Kelleher, N.L.; Thomson, R.J. Natural products from thioester reductase containing biosynthetic pathways. Nat. Prod. Rep. 2018, 35, 847–878. [Google Scholar] [CrossRef] [PubMed]
  15. Cane, D.E.; Ikeda, H. Exploration and mining of the bacterial terpenome. Acc. Chem. Res. 2012, 45, 463–472. [Google Scholar] [CrossRef] [PubMed] [Green Version]
  16. Christianson, D.W. Structural biology and chemistry of the terpenoid cyclases. Chem. Rev. 2006, 106, 3412–3442. [Google Scholar] [CrossRef] [PubMed]
  17. Baunach, M.; Franke, J.; Hertweck, C. Terpenoid biosynthesis off the beaten track: Unconventional cyclases and their impact on biomimetic synthesis. Angew. Chem. Int. Ed. 2015, 54, 2604–2626. [Google Scholar] [CrossRef]
  18. Pham, J.V.; Yilma, M.A.; Feliz, A.; Majid, M.T.; Maffetone, N.; Walker, J.R.; Kim, E.; Cho, H.J.; Reynolds, J.M.; Song, M.C. A review of the microbial production of bioactive natural products and biologics. Front. Microbiol. 2019, 10, 1404. [Google Scholar] [CrossRef] [PubMed] [Green Version]
  19. Newman, D.J.; Cragg, G.M. Natural products as sources of new drugs over the nearly four decades from 01/1981 to 09/2019. J. Nat. Prod. 2020, 83, 770–803. [Google Scholar] [CrossRef] [PubMed]
  20. Osbourn, A. Secondary metabolic gene clusters: Evolutionary toolkits for chemical innovation. Trends Genet. 2010, 26, 449–457. [Google Scholar] [CrossRef]
  21. O’Neill, J. Tackling Drug-Resistant Infections Globally: Final Report and Recommendations. 2016. Available online: https://lordslibrary.parliament (accessed on 31 August 2021).
  22. Miethke, M.; Pieroni, M.; Weber, T.; Brönstrup, M.; Hammann, P.; Halby, L.; Arimondo, P.B.; Glaser, P.; Aigle, B.; Bode, H.B. Towards the sustainable discovery and development of new antibiotics. Nat. Rev. Chem. 2021, 5, 726–749. [Google Scholar] [CrossRef]
  23. Katz, L.; Baltz, R.H. Natural product discovery: Past, present, and future. J. Ind. Microbiol. Biotechnol. 2016, 43, 155–176. [Google Scholar] [CrossRef]
  24. Doroghazi, J.R.; Albright, J.C.; Goering, A.W.; Ju, K.-S.; Haines, R.R.; Tchalukov, K.A.; Labeda, D.P.; Kelleher, N.L.; Metcalf, W.W. A roadmap for natural product discovery based on large-scale genomics and metabolomics. Nat. Chem. Biol. 2014, 10, 963–968. [Google Scholar] [CrossRef] [PubMed]
  25. Cimermancic, P.; Medema, M.H.; Claesen, J.; Kurita, K.; Brown, L.C.W.; Mavrommatis, K.; Pati, A.; Godfrey, P.A.; Koehrsen, M.; Clardy, J.; et al. Insights into Secondary Metabolism from a Global Analysis of Prokaryotic Biosynthetic Gene Clusters. Cell 2010, 158, 412–421. [Google Scholar] [CrossRef] [Green Version]
  26. Medema, M.H.; Fischbach, M.A. Computational approaches to natural product discovery. Nat. Chem. Biol. 2015, 11, 639–648. [Google Scholar] [CrossRef] [PubMed]
  27. Ziemert, N.; Alanjary, M.; Weber, T. The evolution of genome mining in microbes—A review. Nat. Prod. Rep. 2016, 33, 988–1005. [Google Scholar] [CrossRef] [Green Version]
  28. Medema, M.H.; Cimermancic, P.; Sali, A.; Takano, E.; Fischbach, M.A. A systematic computational analysis of biosynthetic gene cluster evolution: Lessons for engineering biosynthesis. PLoS Comput. Biol. 2014, 10, e1004016. [Google Scholar] [CrossRef] [Green Version]
  29. Ziemert, N.; Lechner, A.; Wietz, M.; Millán-Aguiñaga, N.; Chavarria, K.L.; Jensen, P.R. Diversity and evolution of secondary metabolism in the marine actinomycete genus Salinispora. Proc. Natl. Acad. Sci. USA 2014, 111, E1130–E1139. [Google Scholar] [CrossRef] [PubMed] [Green Version]
  30. Jun, S.-R.; Wassenaar, T.M.; Nookaew, I.; Hauser, L.; Wanchai, V.; Land, M.; Timm, C.M.; Lu, T.-Y.S.; Schadt, C.W.; Doktycz, M.J. Diversity of Pseudomonas genomes, including Populus-associated isolates, as revealed by comparative genome analysis. Appl. Environ. Microbiol. 2016, 82, 375–383. [Google Scholar] [CrossRef] [PubMed] [Green Version]
  31. Tartor, Y.H.; Gharieb, R.; El-Aziz, A.; Norhan, K.; El Damaty, H.M.; Enany, S.; Khalifa, E.; Attia, A.S.A.; Abdellatif, S.S.; Ramadan, H. Virulence Determinants and Plasmid-Mediated Colistin Resistance mcr Genes in Gram-Negative Bacteria Isolated from Bovine Milk. Front. Cell. Infect. Microbiol. 2021, 11, 761417. [Google Scholar] [CrossRef]
  32. Moore, E.B.; Tindall, B.; Martins Dos Santos, V.A.P.; Pieper, D.; Ramos, J.-L.; Palleroni, N. Nonmedical: Pseudomonas. Prokaryotes 2006, 6, 646–703. [Google Scholar]
  33. Weston, D.J.; Pelletier, D.A.; Morrell-Falvey, J.L.; Tschaplinski, T.J.; Jawdy, S.S.; Lu, T.-Y.; Allen, S.M.; Melton, S.J.; Martin, M.Z.; Schadt, C.W. Pseudomonas fluorescens induces strain-dependent and strain-independent host plant responses in defense networks, primary metabolism, photosynthesis, and fitness. Mol. Plant-Microbe Interact. 2012, 25, 765–778. [Google Scholar] [CrossRef] [Green Version]
  34. Jahanshah, G.; Yan, Q.; Gerhardt, H.; Pataj, Z.; Lämmerhofer, M.; Pianet, I.; Josten, M.; Sahl, H.-G.; Silby, M.W.; Loper, J.E. Discovery of the cyclic lipopeptide gacamide A by genome mining and repair of the defective GacA regulator in Pseudomonas fluorescens Pf0-1. J. Nat. Prod. 2019, 82, 301–308. [Google Scholar] [CrossRef] [PubMed]
  35. Van Der Voort, M.; Meijer, H.; Schmidt, Y.; Watrous, J.; Dekkers, E.; Mendes, R.; Dorrestein, P.C.; Gross, H.; Raaijmakers, J.M. Genome mining and metabolic profiling of the rhizosphere bacterium Pseudomonas sp. SH-C52 for antimicrobial compounds. Front. Microbiol. 2015, 6, 693. [Google Scholar] [CrossRef] [Green Version]
  36. Kirchner, N.; Cano-Prieto, C.; Schulz-Fincke, A.-C.; Gütschow, M.; Ortlieb, N.; Moschny, J.; Niedermeyer, T.H.J.; Horak, J.; Lämmerhofer, M.; Van Der Voort, M. Discovery of Thanafactin A, a Linear, Proline-Containing Octalipopeptide from Pseudomonas sp. SH-C52, Motivated by Genome Mining. J. Nat. Prod. 2020, 84, 101–109. [Google Scholar] [CrossRef] [PubMed]
  37. Chlebek, D.; Pinski, A.; Żur, J.; Michalska, J.; Hupert-Kocurek, K. Genome Mining and Evaluation of the Biocontrol Potential of Pseudomonas fluorescens BRZ63, a New Endophyte of Oilseed Rape (Brassica napus L.) against Fungal Pathogens. Int. J. Mol. Sci. 2020, 21, 8740. [Google Scholar] [CrossRef] [PubMed]
  38. Loeschcke, A.; Thies, S. Pseudomonas putida—A versatile host for the production of natural products. Appl. Microbiol. Biotechnol. 2015, 99, 6197–6214. [Google Scholar] [CrossRef] [Green Version]
  39. Aiman, S.; Shehroz, M.; Munir, M.; Gul, S.; Shah, M.; Khan, A. Species-wide genome mining of Pseudomonas putida for potential secondary metabolites and drug-like natural products characterization. J. Proteom. Bioinform 2018, 11, 1–7. [Google Scholar] [CrossRef]
  40. Zotchev, S.B. Genomics-based insights into the evolution of secondary metabolite biosynthesis in actinomycete bacteria. In Evolutionary Biology: Genome Evolution, Speciation, Coevolution and Origin of Life; Springer: Berlin/Heidelberg, Germany, 2014; pp. 35–45. [Google Scholar]
  41. Gallagher, K.A.; Jensen, P.R. Genomic insights into the evolution of hybrid isoprenoid biosynthetic gene clusters in the MAR4 marine streptomycete clade. BMC Genom. 2015, 16, 960. [Google Scholar] [CrossRef] [PubMed] [Green Version]
  42. Khaldi, N.; Collemare, J.; Lebrun, M.-H.; Wolfe, K.H. Evidence for horizontal transfer of a secondary metabolite gene cluster between fungi. Genome Biol. 2008, 9, R18. [Google Scholar] [CrossRef] [PubMed] [Green Version]
  43. Ayoub, A.T.; Elrefaiy, M.A.; Arakawa, K. Computational prediction of the mode of binding of antitumor lankacidin C to tubulin. ACS Omega 2019, 4, 4461–4471. [Google Scholar] [CrossRef] [PubMed] [Green Version]
  44. Fischbach, M.A.; Walsh, C.T.; Clardy, J. The evolution of gene collectives: How natural selection drives chemical innovation. Proc. Natl. Acad. Sci. USA 2008, 105, 4601–4608. [Google Scholar] [CrossRef] [PubMed] [Green Version]
  45. Jenke-Kodama, H.; Sandmann, A.; Müller, R.; Dittmann, E. Evolutionary implications of bacterial polyketide synthases. Mol. Biol. Evol. 2005, 22, 2027–2039. [Google Scholar] [CrossRef] [Green Version]
  46. Kroken, S.; Glass, N.L.; Taylor, J.W.; Yoder, O.C.; Turgeon, B.G. Phylogenomic analysis of type I polyketide synthase genes in pathogenic and saprobic ascomycetes. Proc. Natl. Acad. Sci. USA 2003, 100, 15670–15675. [Google Scholar] [CrossRef] [Green Version]
  47. Ziemert, N.; Jensen, P.R. Phylogenetic approaches to natural product structure prediction. Methods Enzymol. 2012, 517, 161–182. [Google Scholar] [PubMed] [Green Version]
  48. Rausch, C.; Hoof, I.; Weber, T.; Wohlleben, W.; Huson, D.H. Phylogenetic analysis of condensation domains in NRPS sheds light on their functional evolution. BMC Evol. Biol. 2007, 7, 78. [Google Scholar] [CrossRef] [PubMed] [Green Version]
  49. Ginolhac, A.; Jarrin, C.; Robe, P.; Perrière, G.; Vogel, T.M.; Simonet, P.; Nalin, R. Type I polyketide synthases may have evolved through horizontal gene transfer. J. Mol. Evol. 2005, 60, 716–725. [Google Scholar] [CrossRef] [PubMed]
  50. Jenke-Kodama, H.; Dittmann, E. Evolution of metabolic diversity: Insights from microbial polyketide synthases. Phytochemistry 2009, 70, 1858–1866. [Google Scholar] [CrossRef] [PubMed]
  51. Metsä-Ketelä, M.; Halo, L.; Munukka, E.; Hakala, J.; Mäntsälä, P.; Ylihonko, K. Molecular evolution of aromatic polyketides and comparative sequence analysis of polyketide ketosynthase and 16S ribosomal DNA genes from various Streptomyces species. Appl. Environ. Microbiol. 2002, 68, 4472–4479. [Google Scholar] [CrossRef] [Green Version]
  52. Doroghazi, J.R.; Metcalf, W.W. Comparative genomics of actinomycetes with a focus on natural product biosynthetic genes. BMC Genom. 2013, 14, 611. [Google Scholar] [CrossRef] [Green Version]
  53. Kumar, S.; Stecher, G.; Li, M.; Knyaz, C.; Tamura, K. MEGA X: Molecular evolutionary genetics analysis across computing platforms. Mol. Biol. Evol. 2018, 35, 1547. [Google Scholar] [CrossRef]
  54. Tavaré, S. Some probabilistic and statistical problems in the analysis of DNA sequences. Lect. Math. Life Sci. 1986, 17, 57–86. [Google Scholar]
  55. Yoon, S.-H.; Ha, S.-M.; Lim, J.; Kwon, S.; Chun, J. A large-scale evaluation of algorithms to calculate average nucleotide identity. Antonie Van Leeuwenhoek 2017, 110, 1281–1286. [Google Scholar] [CrossRef] [PubMed]
  56. Blin, K.; Shaw, S.; Kloosterman, A.M.; Charlop-Powers, Z.; van Wezel, G.P.; Medema, M.H.; Weber, T. antiSMASH 6.0: Improving cluster detection and comparison capabilities. Nucleic Acids Res. 2021, 49, W29–W35. [Google Scholar] [CrossRef] [PubMed]
  57. Skinnider, M.A.; Johnston, C.W.; Gunabalasingam, M.; Merwin, N.J.; Kieliszek, A.M.; MacLellan, R.J.; Li, H.; Ranieri, M.R.M.; Webster, A.L.H.; Cao, M.P.T.; et al. Comprehensive prediction of secondary metabolite structure and biological activity from microbial genome sequences. Nat. Commun. 2020, 11, 6058. [Google Scholar] [CrossRef]
  58. Van Heel, A.J.; de Jong, A.; Song, C.; Viel, J.H.; Kok, J.; Kuipers, O.P. BAGEL4: A user-friendly web server to thoroughly mine RiPPs and bacteriocins. Nucleic Acids Res. 2018, 46, W278–W281. [Google Scholar] [CrossRef]
  59. Machado, H.; Sonnenschein, E.C.; Melchiorsen, J.; Gram, L. Genome mining reveals unlocked bioactive potential of marine Gram-negative bacteria. BMC Genom. 2015, 16, 158. [Google Scholar] [CrossRef] [PubMed] [Green Version]
  60. Churchill, G.A. Stochastic models for heterogeneous DNA sequences. Bull. Math. Biol. 1989, 51, 79–94. [Google Scholar] [CrossRef]
  61. Altschul, S.F.; Gish, W.; Miller, W.; Myers, E.W.; Lipman, D.J. Basic local alignment search tool. J. Mol. Biol. 1990, 215, 403–410. [Google Scholar] [CrossRef]
  62. Finn, R.D.; Bateman, A.; Clements, J.; Coggill, P.; Eberhardt, R.Y.; Eddy, S.R.; Heger, A.; Hetherington, K.; Holm, L.; Mistry, J. Pfam: The protein families database. Nucleic Acids Res. 2014, 42, D222–D230. [Google Scholar] [CrossRef] [Green Version]
  63. Benson, D.A.; Cavanaugh, M.; Clark, K.; Karsch-Mizrachi, I.; Lipman, D.J.; Ostell, J.; Sayers, E.W. GenBank. Nucleic Acids Res. 2013, 41, D36–D42. [Google Scholar] [CrossRef] [PubMed] [Green Version]
  64. Consortium, U. UniProt: A hub for protein information. Nucleic Acids Res. 2015, 43, D204–D212. [Google Scholar] [CrossRef]
  65. Hammami, R.; Zouhir, A.; Le Lay, C.; Hamida, J.B.; Fliss, I. BACTIBASE second release: A database and tool platform for bacteriocin characterization. BMC Microbiol. 2010, 10, 22. [Google Scholar] [CrossRef] [Green Version]
  66. Waghu, F.H.; Barai, R.S.; Gurung, P.; Idicula-Thomas, S. CAMPR3: A database on sequences, structures and signatures of antimicrobial peptides. Nucleic Acids Res. 2016, 44, D1094–D1097. [Google Scholar] [CrossRef] [PubMed] [Green Version]
  67. Medema, M.H.; Kottmann, R.; Yilmaz, P.; Cummings, M.; Biggins, J.B.; Blin, K.; De Bruijn, I.; Chooi, Y.H.; Claesen, J.; Coates, R.C. Minimum information about a biosynthetic gene cluster. Nat. Chem. Biol. 2015, 11, 625–631. [Google Scholar] [CrossRef]
  68. Ziemert, N.; Podell, S.; Penn, K.; Badger, J.H.; Allen, E.; Jensen, P.R. The natural product domain seeker NaPDoS: A phylogeny based bioinformatic tool to classify secondary metabolite gene diversity. PLoS ONE 2012, 7, e34064. [Google Scholar] [CrossRef] [PubMed] [Green Version]
  69. Eddy, S.R. Profile hidden Markov models. Bioinformatics 1998, 14, 755–763. [Google Scholar] [CrossRef] [PubMed]
  70. Bloudoff, K.; Schmeing, T.M. Structural and functional aspects of the nonribosomal peptide synthetase condensation domain superfamily: Discovery, dissection and diversity. Biochim. Biophys. Acta (BBA)—Proteins Proteom. 2017, 1865, 1587–1604. [Google Scholar] [CrossRef] [PubMed]
  71. Scherlach, K.; Hertweck, C. Triggering cryptic natural product biosynthesis in microorganisms. Org. Biomol. Chem. 2009, 7, 1753–1760. [Google Scholar] [CrossRef]
Figure 1. Phylogenetic tree of Pseduomonas along with the gene numbers, isolation sources, and NP BGCs number determined by antiSMASH. The phylogenetic tree is built using rpoB sequences extracted from the genomes based on the maximum likelihood method. Two bar-plots show genome size in thousands of genes on the left, colored by habitats, and the number of BGCs on the right. Species in these two bar-plots keep the same order as the phylogenetic tree. Hybrid clusters are shown separately. The colors matching to habitat types and 24 major NP classes are displayed below the bar-plots. N/A: Not Available.
Molecules 26 07524 g001
Figure 2. The correlation between genome size and quantity of BGCs on each genome and distributions of major classes of BGCs in Pseudomonas species. (a) The number of BGCs per genome mined by different genome mining tools is compared to the size of the genome. (b) Distribution of antiSMASH hits of major classes of BGCs.
Molecules 26 07524 g002
Figure 3. Similarity across the whole genomes of Pseudomonas species. Comparison follows the same sequence as the phylogenetic tree in Figure 1. All comparisons between a genome and itself take place on a line that runs from the top left to the bottom right corners of the genome. The numerator for each comparison is the number of comparable genes between two genomes, whereas the denominator is the genome represented by each column. The smallest genome is marked with a * (green), and the biggest genome is marked with a * (red).
Molecules 26 07524 g003
Figure 4. Phylogenetic tree of P. fluorescence sub-species along with the gene number, isolation source, and NP BGCs number determined by antiSMASH. The phylogenetic tree is built using rpoB sequences extracted from the genome based on the maximum likelihood method. Two bar-plots show genome size in thousands of genes on the left, colored by habitats, and the number of BGCs on the right. Species in these two bar-plots keep the same order as the phylogenetic tree. Hybrid clusters are shown separately. The colors matching to habitat types and 20 major NP classes are displayed below the bar-plots. N/A: Not available.
Molecules 26 07524 g004
Figure 5. The correlation between genome size and the number of BGCs. (a) Comparative study of different genome mining hits with genome size (Mbp) in P. fluorescence subspecies and (b) distribution of major classes of BGCs in different P. fluorescence genomes.
Molecules 26 07524 g005
Figure 6. Whole genome similarity across the genomes of P. fluorescence sub-species. Comparison follows the same sequences as the phylogenetic tree in Figure 4. The smallest genome is marked with a * (green), and the biggest genome is marked with a * (red).
Molecules 26 07524 g006
Table 1. Reference genomes of Pseudomonas species studied with different hits from different genome mining tools for BGCS.
SpeciesIsolation
Source
Size (mb)GenesantiSMASHPRISMBAGELKS
Domains
C
Domain
HitHitHit
P. bijieensis L22-9N/A6.73059841575837
P. brassicacearum 3Re2-7Endorhiza of potato6.73960141143827
P. viciae 11K1Rhizosphere6.70558681392766
P. corrugata RM1-1-4Rhizosphere6.12453941073845
P. chlororaphis qlu-1Rhizosphere6.828609316911126
P. protegens CHA0N/A6.868625215911028
P. umsongensis CY-1Soil6.69060601131812
P. atacamensis SM1Rhizospheric soil5.9915436933713
P. glycinae MS586Cotton field6.397581811731126
P. mandelii JR-1N/A7.189660411311012
P. silesiensis A3Wastewater6.82461661251912
P. rhodesiae NL2019Soil5.77952621040717
P. lurida MYb11Rotting apple6.10155491361724
P. simiae PCL1751Soil6.14456431241716
P. lundensis 2T.2.5.2Meltwater pond4.9344563742712
P. psychrophila KM02Food5.314481362170
P. versuta L10.10Soil5.154671620610
P. amygdali pv. tabaci str. ATCC 11528N/A6.20254891092626
P. syringae BIM B-268Ribes nigrum leaves6.01951651080670
P. cannabina pv. alisalensis MAFF 301419Radish6.1455486750627
P. syringae pv. tomato str. DC3000Tomato6.53858911083932
P. eucalypticola NP-1Plant leaf6.4025782870429
P. rhizosphaerae DSM 16299Rhizospheric soil4.689421474063
P. alkylphenolica NeoSoil5.6125092931423
P. monteilii B5Soil6.0795661621517
P. putida NBRC 14164N/A6.1575539730517
P. plecoglossicida XSDHY-PFish spleen5.5265067722211
P. entomophila L48N/A5.8895199141121044
P. soli SJ10N/A6.24857981261732
P. sediminis B10D7DN/A4.934461273099
P. toyotomiensis SM2Rhizospheric soil5.2354857830811
P. mendocina S5.2N/A5.3725081730109
P. lalkuanensis PE08Soil6.0575558730712
P. otitidis MrB4 DNAWater6.08956151040913
P. aeruginosa PAO1N/A6.264569714144621
P. citronellolis P3B5Basil6.9516219831814
P. multiresinivorans populiRhizosphere soil6.518597472197
N/A: Not Available.
Table 2. List of different P. fluorescence reference genomes with different hits.
Species NameSourceSizeGenesAntiSMASHBAGELPRISMKS
Domain
C
Domain
(Mbp)HitHitHit
P. fluorescens Pf275Soil6.6158841556837
P. fluorescens DR133Rhizosphere6.84861021646833
P. fluorescens 2P24Soil6.611580314371934
P. fluorescens FW300-N2C3Ground water7.1196149181131080
P. fluorescens F113N/A6.846609312251317
P. fluorescens FW300-N2E3Ground water6.39259511204102
P. fluorescens G20-18Arctic grass6.48160011134813
P. fluorescens NCIMB 11764N/A6.99864041133813
P. fluorescens NCTC9428N/A6.0345413724616
P. fluorescens LBUM677Rhizosphere6.1454871216625
P. fluorescens G7Soil6.33658041307826
P. fluorescens MS82Rhizosphere6.208569012491126
P. fluorescens YK-310Soil6.49958251508941
P. fluorescens Pf0-1N/A6.43858521206933
P. fluorescens UK4Drinking water6.06455131306619
P. fluorescens PF08Scophthalmus maximus6.0315518120670
P. fluorescens KF1Kumarahou flower6.95763061306815
P. fluorescens SBW25N/A6.72361231127833
P. fluorescens SIK_W1Soil6.79160581506724
P. fluorescens JNU01N/A6.7960581506724
P. fluorescens NCTC10038N/A6.51559651426622
P. fluorescens FDAARGOS_1088N/A6.13555851309716
P. fluorescens A506Tree leaf6.0254931229715
N/A: Not Available.
Publisher’s Note: MDPI stays neutral with regard to jurisdictional claims in published maps and institutional affiliations.

