Article

Residues R1075, D1090, R1095, and C1130 Are Critical in ADAMTS13 TSP8-Spacer Interaction Predicted by Molecular Dynamics Simulation

1
Institute of Biomechanics/School of Biology and Biological Engineering, South China University of Technology, Guangzhou 510006, China
2
Research Department of Medical Sciences, Guangdong Provincial People’s Hospital, Guangdong Academy of Medical Sciences, Guangzhou 510080, China
3
Department of Emergency Medicine, Guangdong Provincial People’s Hospital, Guangdong Academy of Medical Sciences, Guangzhou 510080, China
*
Author to whom correspondence should be addressed.
Molecules 2021, 26(24), 7525; https://doi.org/10.3390/molecules26247525
Submission received: 17 November 2021 / Revised: 7 December 2021 / Accepted: 8 December 2021 / Published: 12 December 2021

Abstract

:
ADAMTS13 (A Disintegrin and Metalloprotease with Thrombospondin type 1 repeats, member 13) cleaves von Willebrand Factor (VWF) multimers to limit the prothrombotic function of VWF. The deficiency of ADAMTS13 causes a lethal thrombotic microvascular disease, thrombotic thrombocytopenic purpura (TTP). ADAMTS13 circulates in a “closed” conformation with the distal domain associating the Spacer domain to avoid off-target proteolysis or recognition by auto-antibodies. However, the interactions of the distal TSP8 domain and the Spacer domain remain elusive. Here, we constructed the TSP8-Spacer complex by a combination of homology modelling and flexible docking. Molecular dynamics simulation was applied to map the binding sites on the TSP8 or Spacer domain. The results predicted that R1075, D1090, R1095, and C1130 on the TSP8 domain were key residues that interacted with the Spacer domain. R1075 and R1095 bound exosite-4 tightly, D1090 formed multiple hydrogen bonds and salt bridges with exosite-3, and C1130 interacted with both exosite-3 and exosite-4. Specific mutations of exosite-3 (R568K/F592Y/R660K/Y661F/Y665F) or the four key residues (R1075A/D1090A/R1095A/C1130A) impaired the binding of the TSP8 domain to the Spacer domain. These results shed new light on the understanding of the auto-inhibition of ADAMTS13.

1. Introduction

ADAMTS13 is a metalloprotease that comprises a metalloproteinase (MP), a disintegrin-like (Dis), a thrombospondin-1 type 1 repeat (TSP1), a cysteine-rich region (Cys), a Spacer, seven additional type 1 repeats (TSP2–TSP8), and two CUB (complement components C1r/C1s, Uegf and bone morphogenic protein 1) domains [1]. This protease cleaves at the Tyr1605-Met1606 scissile bond on the VWF A2 domain to prevent microvascular thrombosis [2,3]. The deficiency of ADAMTS13, induced by mutations of ADAMTS13 or auto-antibodies against ADAMTS13, impairs its proteolytic activity and eventually leads to TTP [4].
It is believed that wild-type (WT) ADAMTS13 circulates in a “closed” conformation in which the distal TSP8-CUB2 domains interact with the Spacer domain, resulting in impaired proteolytic activity [5,6,7]. This auto-inhibition of ADAMTS13 could be relieved by the binding of the VWF D4-CK region to the C-terminal regions of ADAMTS13, which also is the first step in the interactions of ADAMTS13 with VWF [8]. This engagement facilitates the exosites on the Spacer, Cys, and Dis domains to interact with the discrete binding sites on the unfolded VWF A2 domain. The MP domain is then allosterically activated and cleaves the VWF scissile bond [9,10]. This substrate-mediated allosteric activation prevents ADAMT13 from off-target proteolysis [11] or recognition by auto-antibodies [12].
The Spacer domain is a key player in mediating the auto-inhibition of ADAMTS13. Exosite-3 (R568/F592/R660/Y661/Y665, [RFRYY]), the key epitope recognized by the auto-antibodies produced by TTP patients, is located on the Spacer domain [12,13,14] and pivotal in maintaining the “closed” conformation [5,8]. When exosite-3 undergoes a particular mutation (KYKFF), the conformation of ADAMTS13 shifts to an “open” state with increased cleavage activity of ~2.5-fold compared to WT ADAMTS13. In addition, unlike WT ADAMTS13, this gain-of-function (GoF) variant is resistant to ADAMTS13 auto-antibodies.
In 2017, Kieron South and co-workers demonstrated that although both CUB1 and CUB2 domains bound to exosite-3, only the former was capable of inhibiting the proteolytic activity of MDTCS, a proximal truncated construct of ADAMTS13 with high activity [6]. Recently, the crystal structure of the CUB1–2 domains has been resolved [15]. Arg1326, Glu1387, Glu1389, Trp1245, Trp1250, Lys1252, and Arg1272 in CUB1–2 could bind to the Spacer domain, mediating the “closed” conformation of ADAMTS13. We previously illustrated that the CUB1 domain simultaneously bound to three distinct regions of the Spacer domain by molecular dynamics (MD) simulation [16]. Increasing evidence indicates that the TSP8 domain is involved in the auto-inhibition of ADAMTS13 as well [17]. The removal of the TSP8 domain partially relieves the auto-inhibition of ADAMTS13 [7]. In addition, monoclonal antibodies, which are produced by patients with acquired TTP and recognize the TSP8 domain, increase the enzymatic cleavage activity of ADAMTS13 by ~2-fold [8]. However, the crystal structure of the TSP8 domain is still lacking. The molecular structure basis of the interaction of TSP8-Spacer remains elusive.
To characterize the interaction of TSP8-Spacer and predict the key residues on the TSP8 domain, we used computational approaches to construct the TSP8-Spacer complex and analyzed the interaction of the TSP8 domain and the Spacer domain at the atomic level with MD simulation. Arg1075, Asp1090, Arg1095, and Cys1130 on the TSP8 domain were predicted to be critical in stabilizing the TSP8-Spacer complex. GoF mutation on exosite-3 weakened the interactions of Asp1090 with exosite-3, but enhanced the bindings of Arg1075, Arg1095, and Cys1130 to exosite-4. Mutation of these four predicted residues on the TSP8 domain to Ala impaired the binding of the TSP8 domain to the Spacer domain.

2. Results

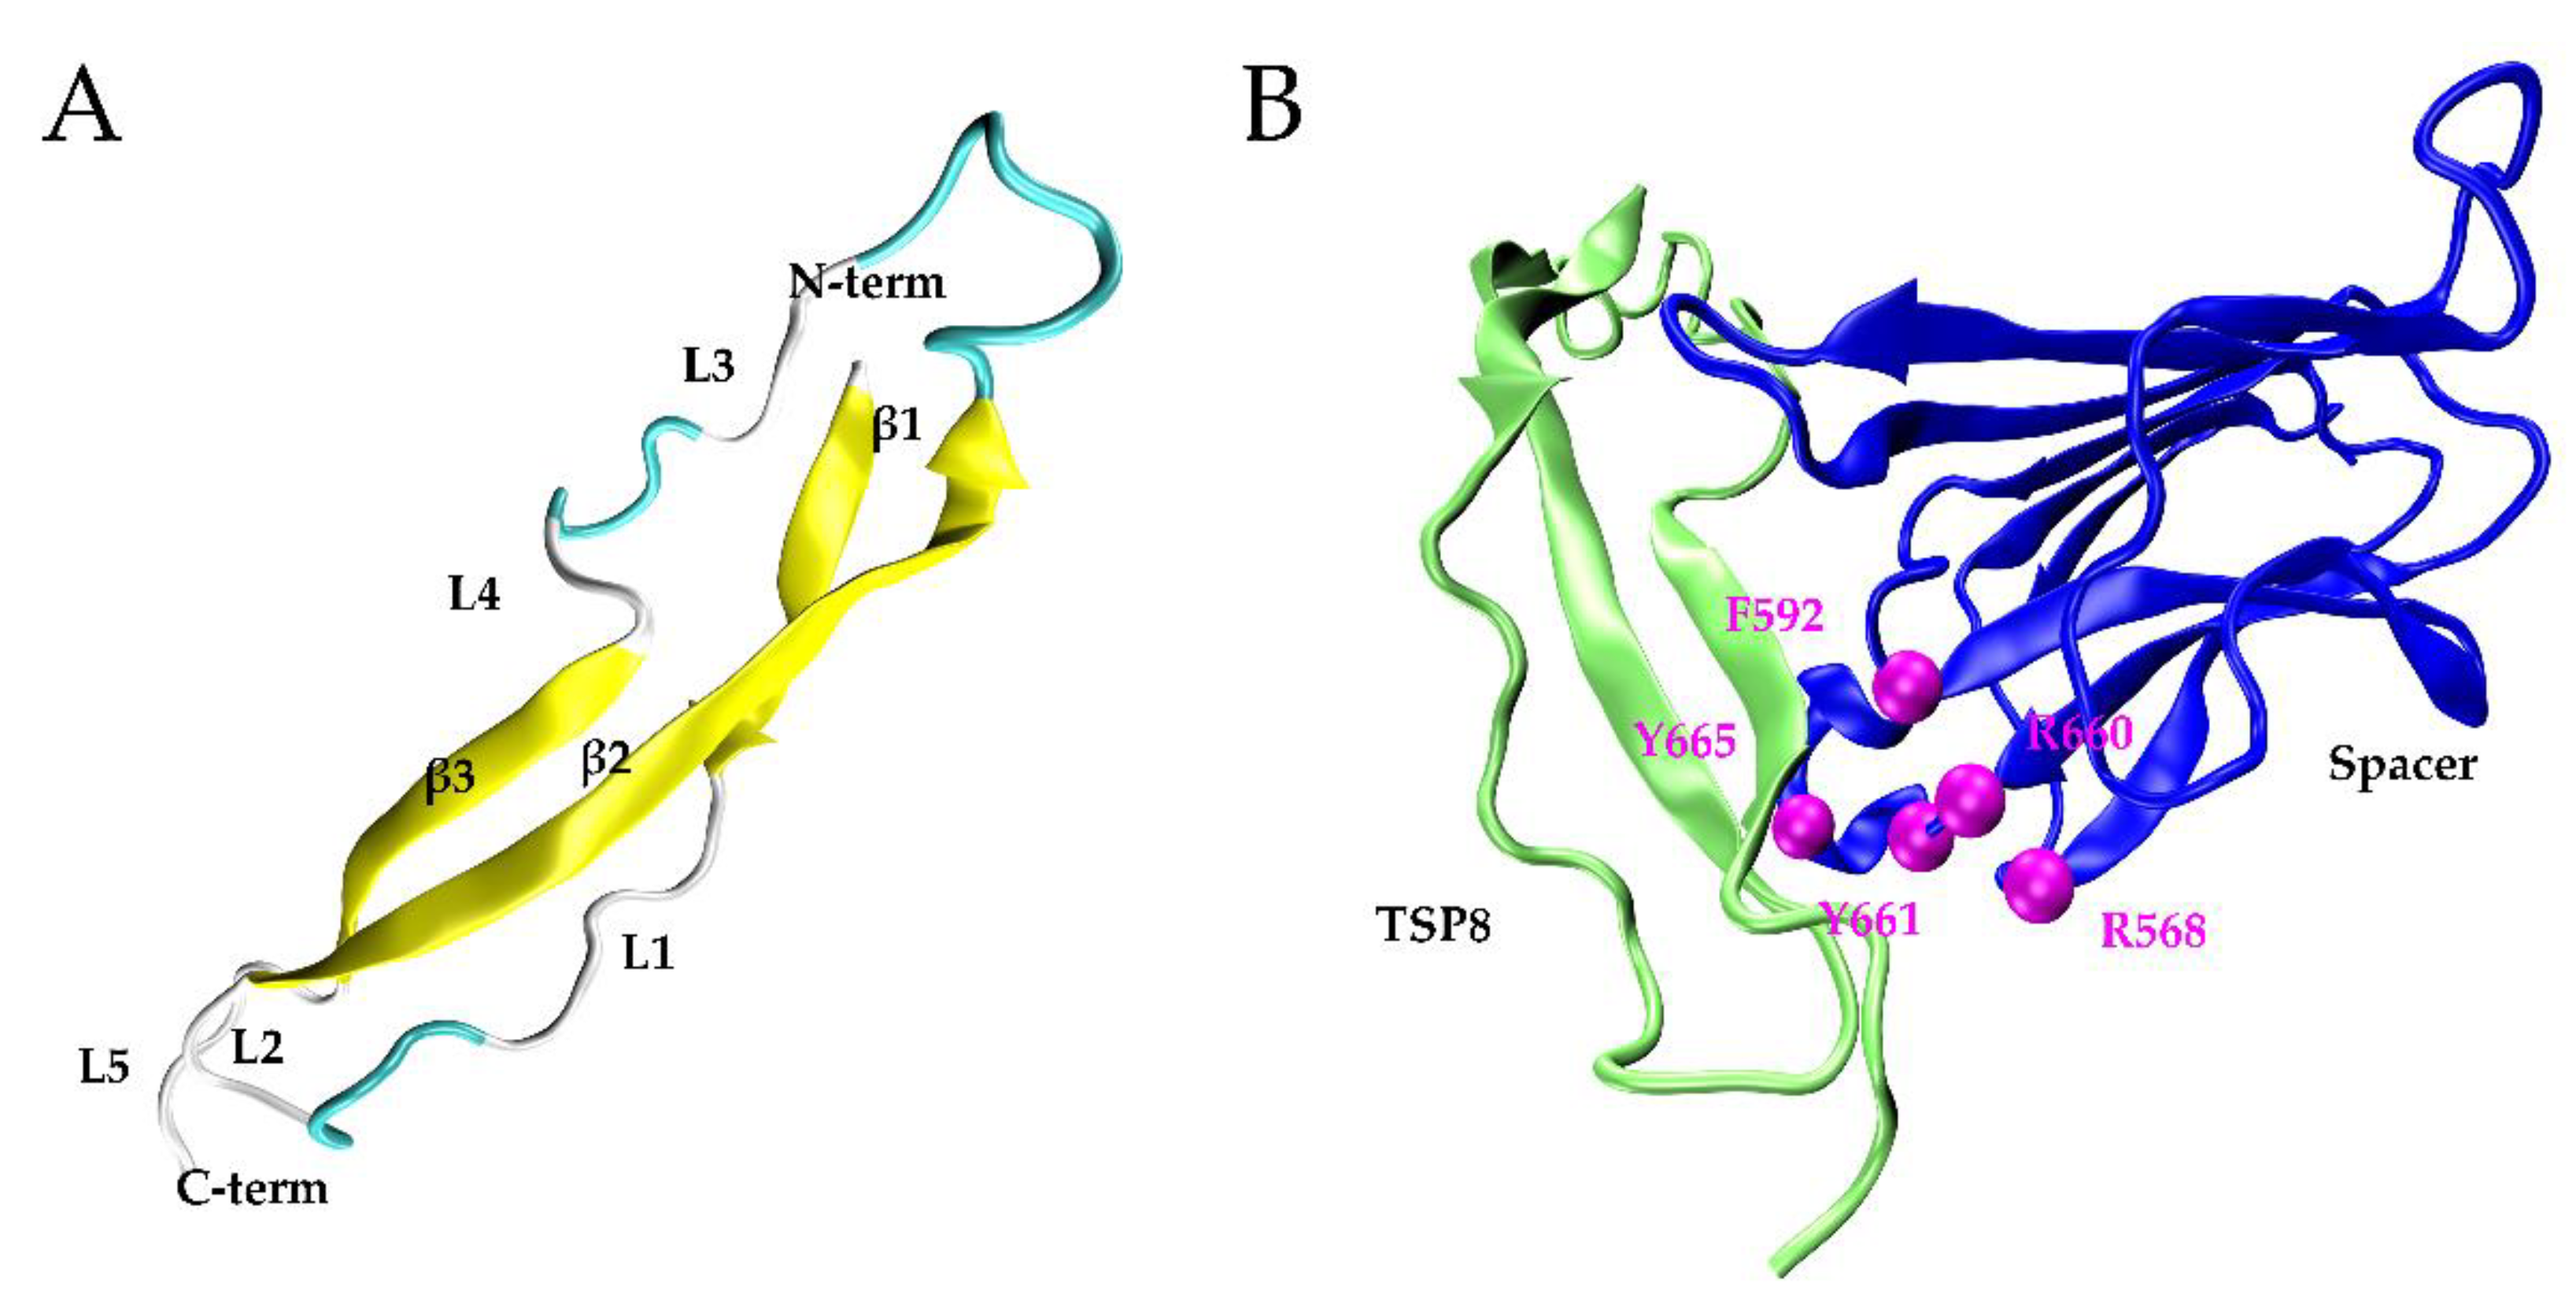
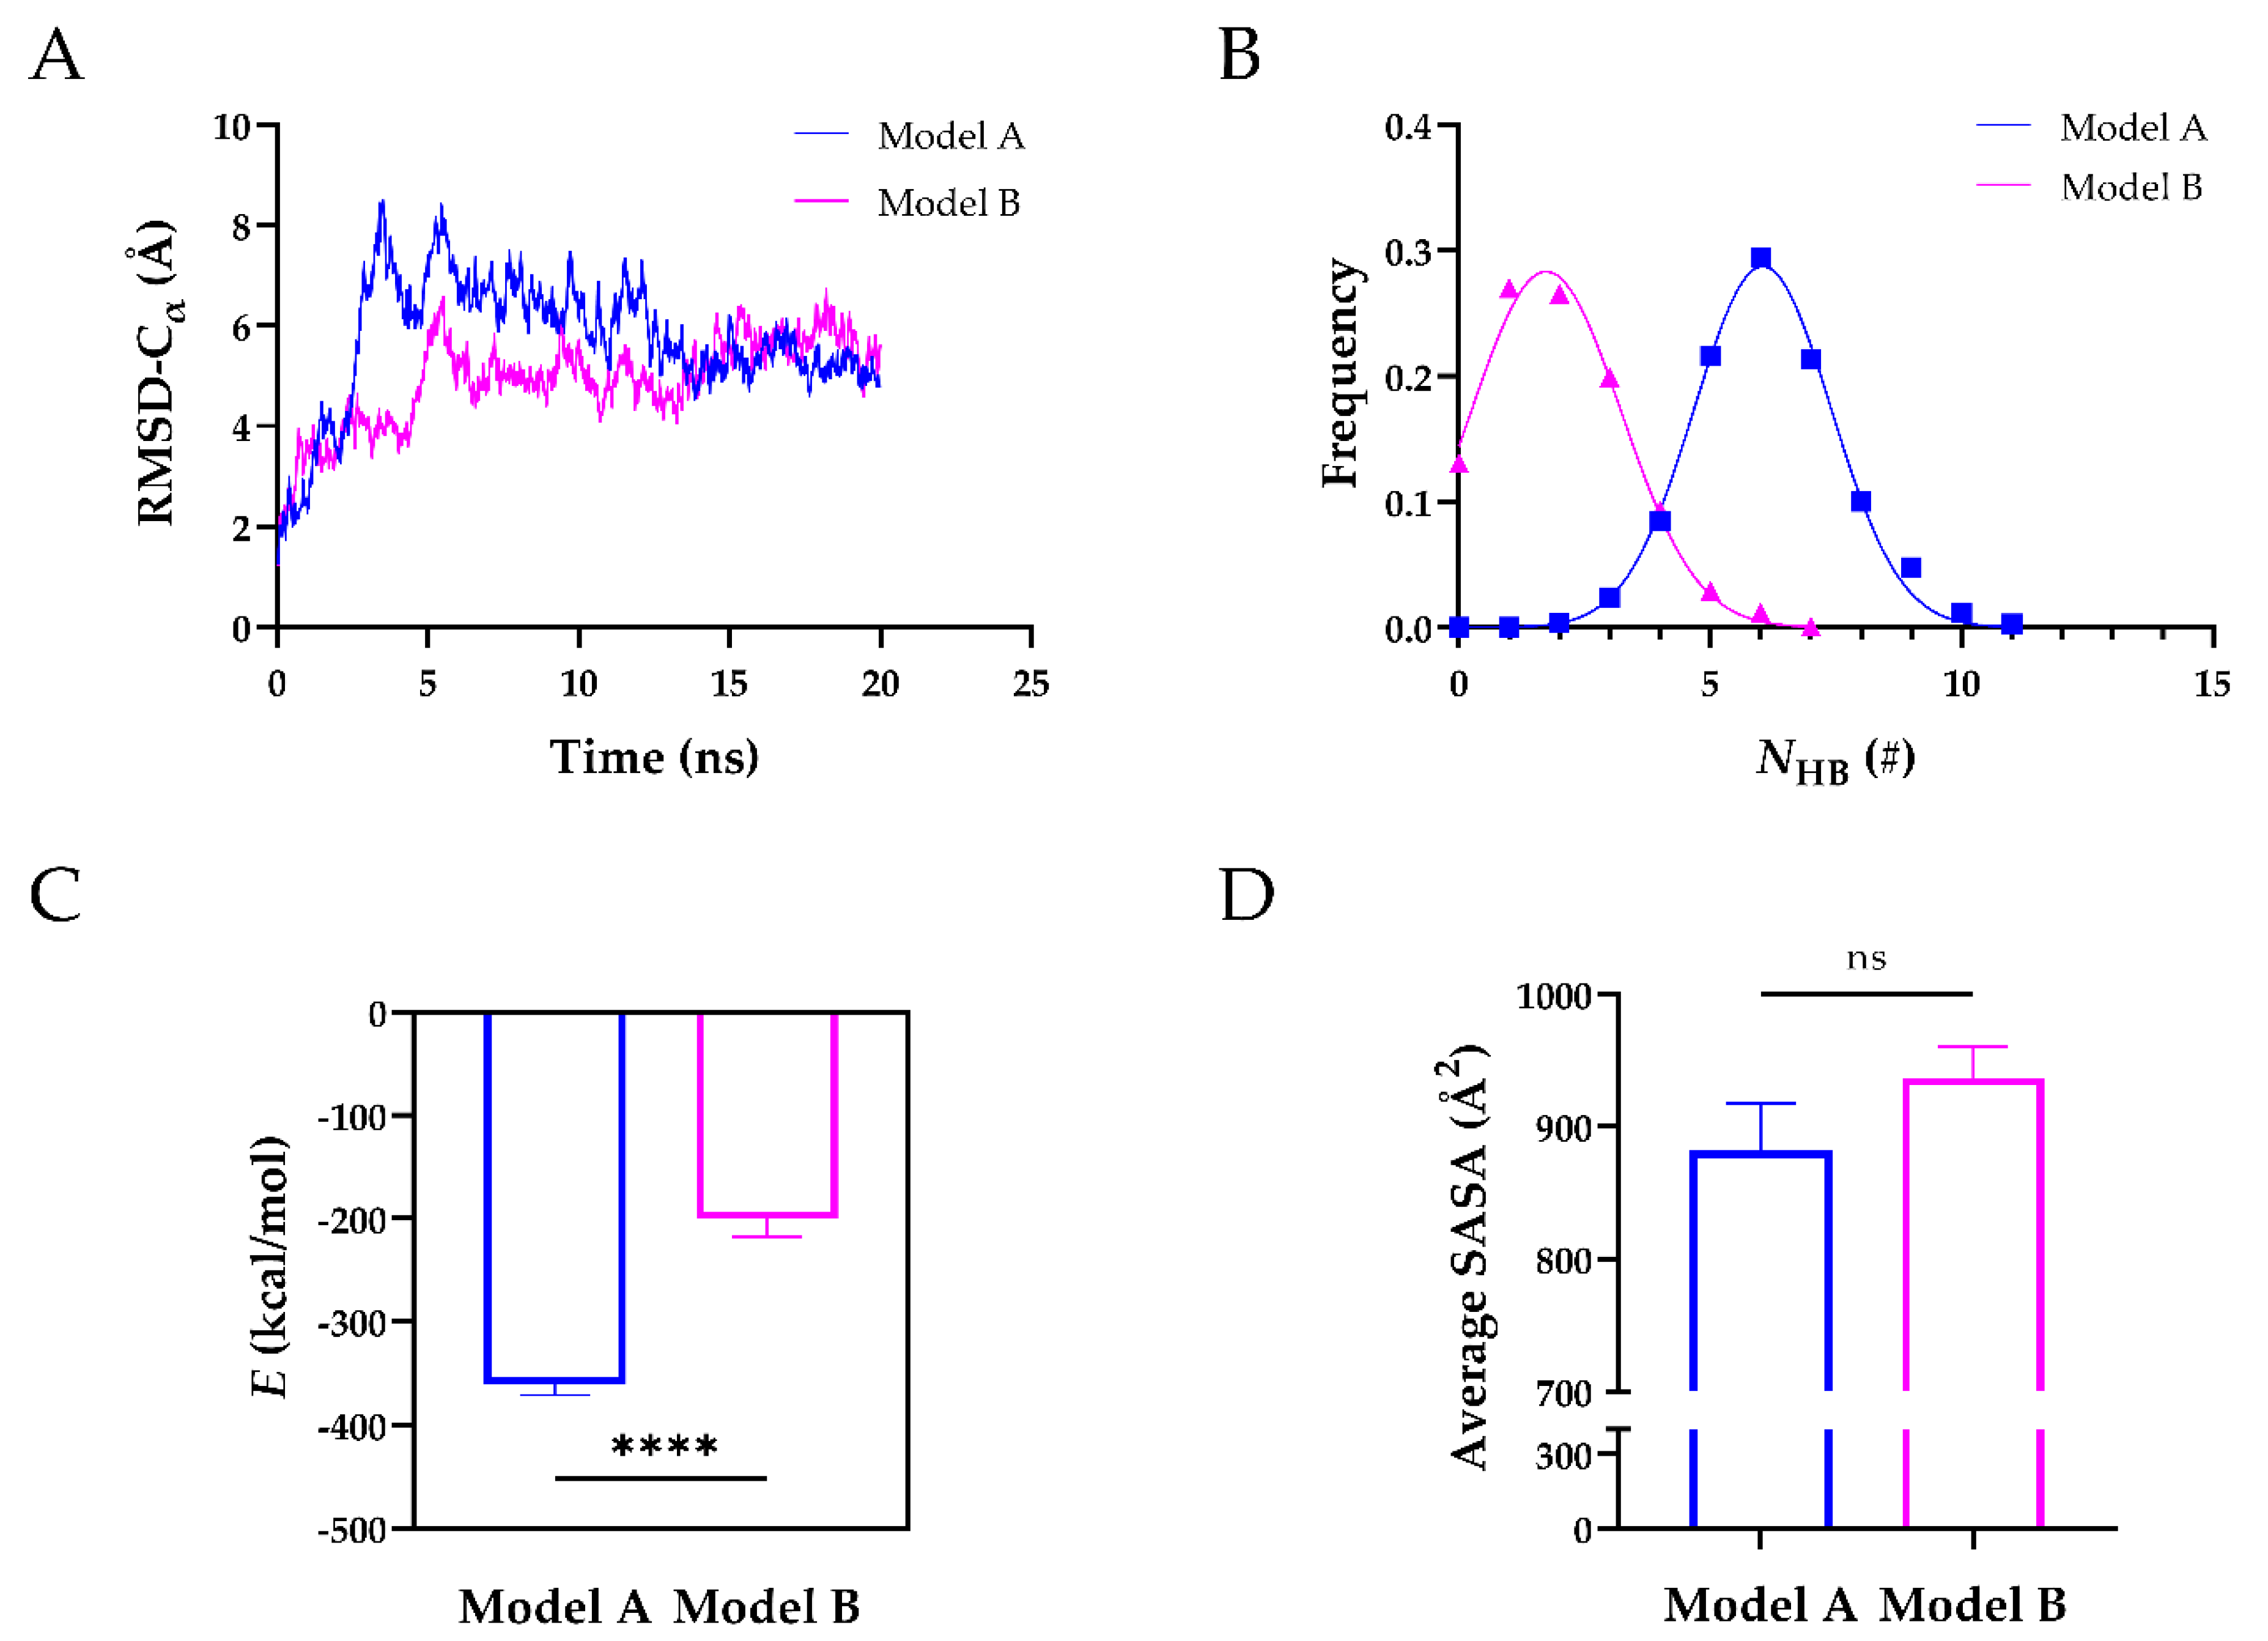
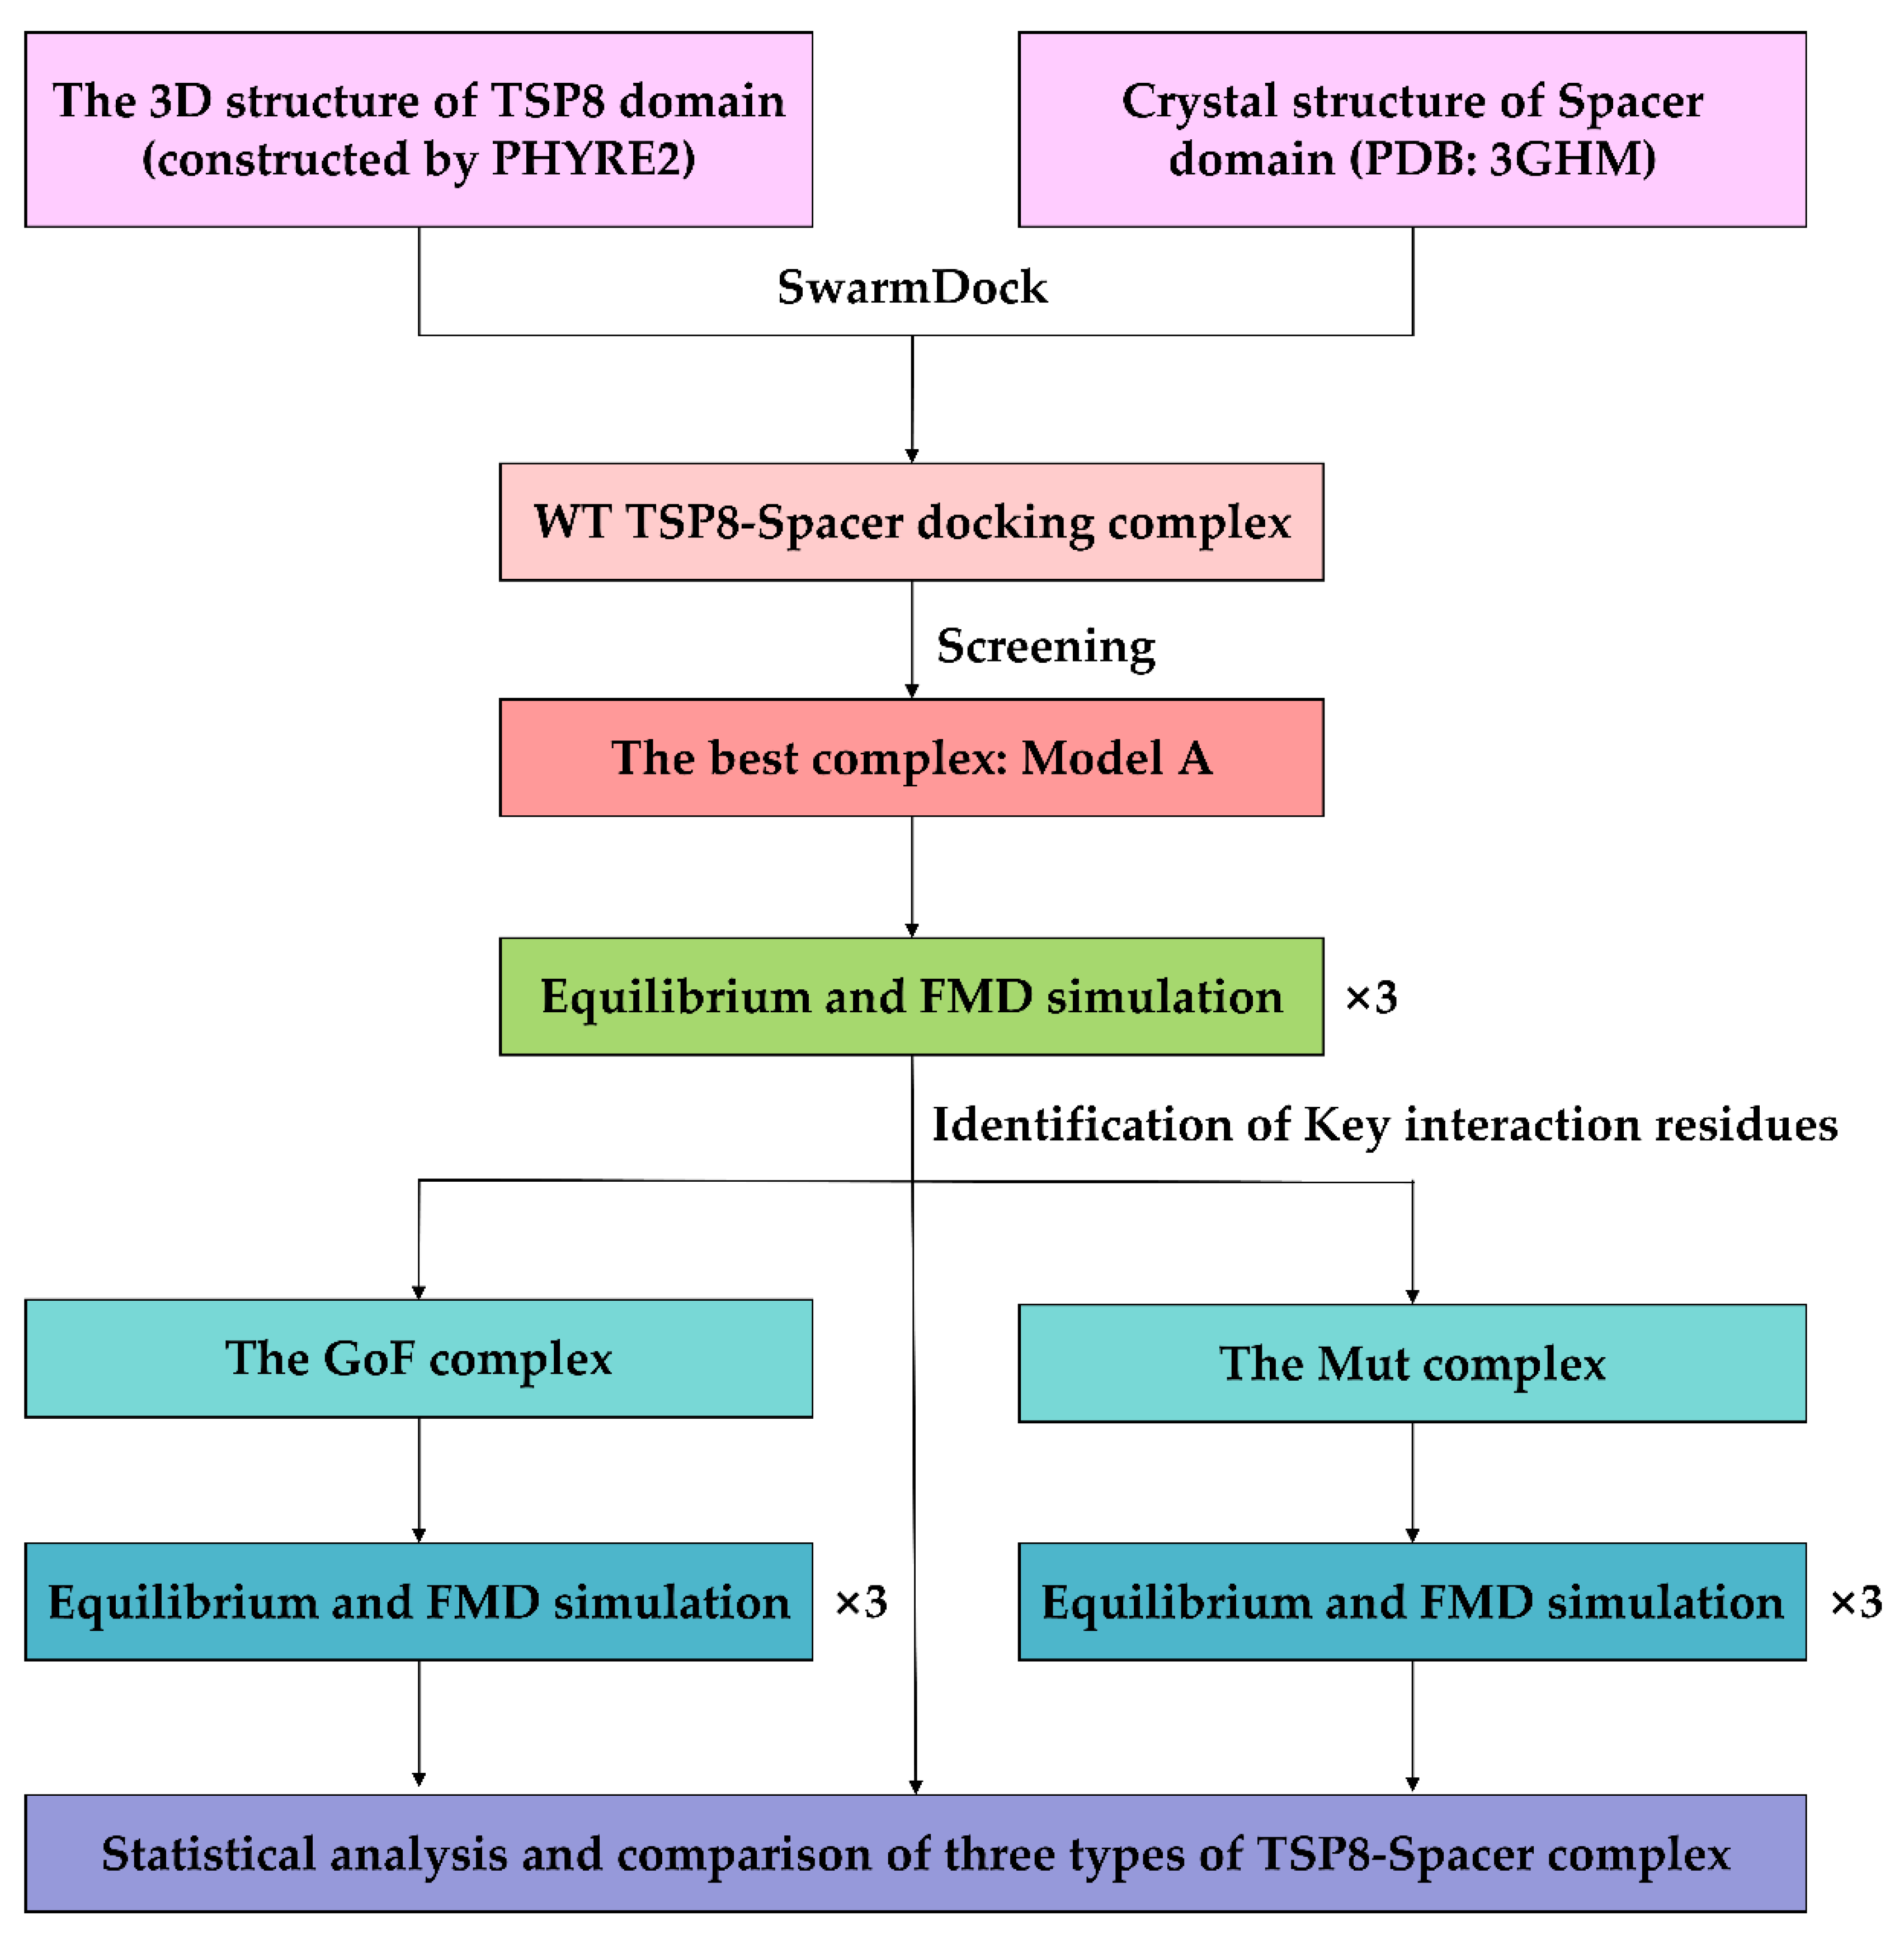
2.1. The Optimal TSP8-Spacer Docking Complex

Ninety-two percent of TSP8 residues were modeled with 99% confidence with its template, thrombospondin-1 TSR domains 2 and 3 (PDB: 3R6B). Figure 1A showed the 3D structure of the TSP8 domain: one long β-strand (β2) anti-paralleled to two short β-strands (β1 and β3), which were connected by three turns and five loops.
After docking by SwarmDock Server, 127 TSP8-Spacer complexes were obtained. According to the two criteria (Methods), two potential TSP8-Spacer complexes, 67d and 47d, were selected. The democratic scoring [18] displayed that 67d ranked first and 47d ranked fourth. Based on this, 67d was designated as Model A and 47d was designated as Model B. Table 1 showed that more hydrogen bonds (H-bonds) and salt bridges were formed on the interface of Model A (Figure 1B), indicating it was more stable. Seven H-bonds and three salt bridges were located on the interface of Model A, involving three residues of exosite-3 (Arg568, Arg660, and Tyr665). Model B contained five H-bonds, four of which were formed by the residues of exosite-3 (Arg568, Phe592, and Arg660). No salt bridge was observed in Model B.
After obtaining their 3D structures, we ran 20 ns equilibrium simulations of Model A and Model B to further assess their structural stability. The time courses of the root-mean-square deviation (RMSD) of heavy atoms showed that both models reached their equilibrium state at 20 ns (Figure 2A). Further analysis revealed that the mean number of H-bonds (NHB) on the interface of Model A was ~6 with a Gaussian distribution, ~3-fold higher than that of Model B, suggesting that Model A was more stable than Model B (Figure 2B). The stability of Model A was also reflected by the interaction energy (Figure 2C). The interaction energy of Model A was −361.1 kcal/mol and ~2-fold lower than that of Model B (−200.7 kcal/mol). The average solvent accessible surface area (SASA) of Model A was comparable to that of Model B (Figure 2D). We also analyzed the H-bonds and salt bridges on the interface of the two Models (Table 2). During 20 ns equilibrium simulations, seven H-bonds and four salt bridges existed in Model A, whereas three H-bonds and one salt bridge existed in Model B. Four residues (Arg568, Arg660, Tyr661, and Tyr665) of exosite-3 formed H-bonds, and two of them (Arg568 and Arg660) formed salt bridges with the TSP8 domain in Model A. In comparison, only one residue (Arg568) of exosite-3 formed an H-bond with the TSP8 domain in Model B. These findings suggested that Model A was more stable, mediated by the interactions of exosite-3 and the TSP8 domain. Model A was thus selected for the subsequent simulations.

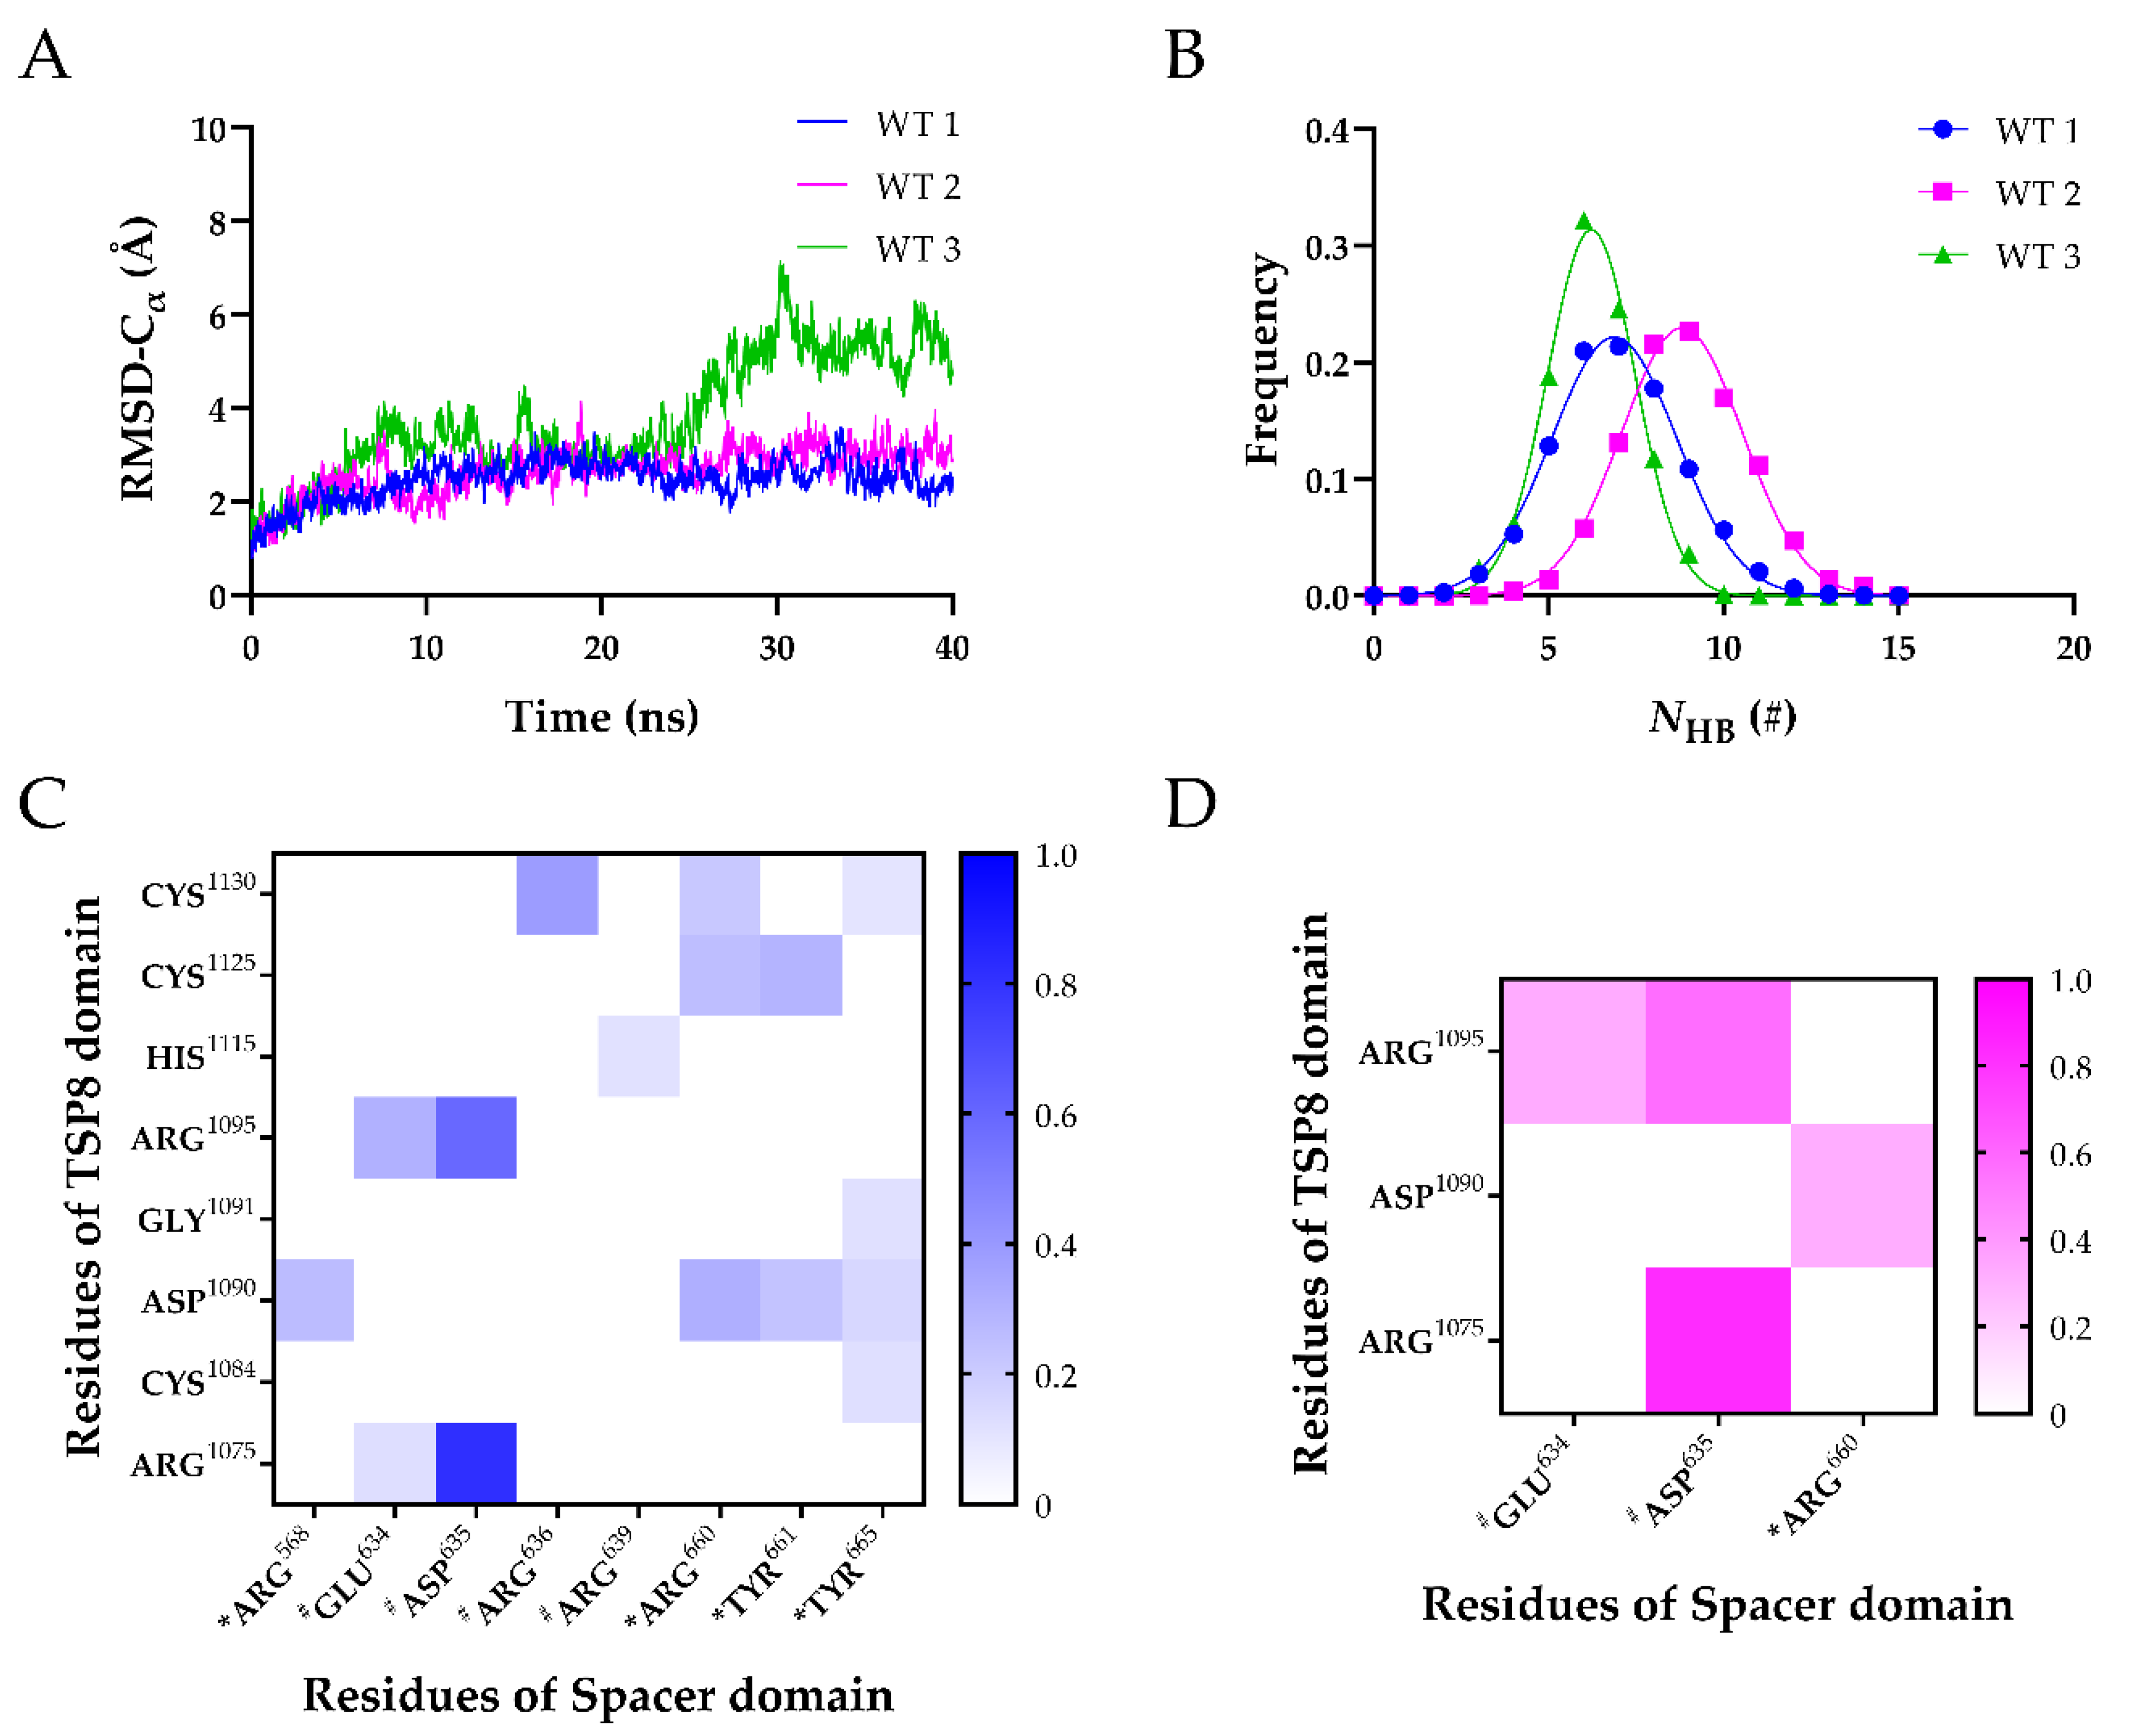
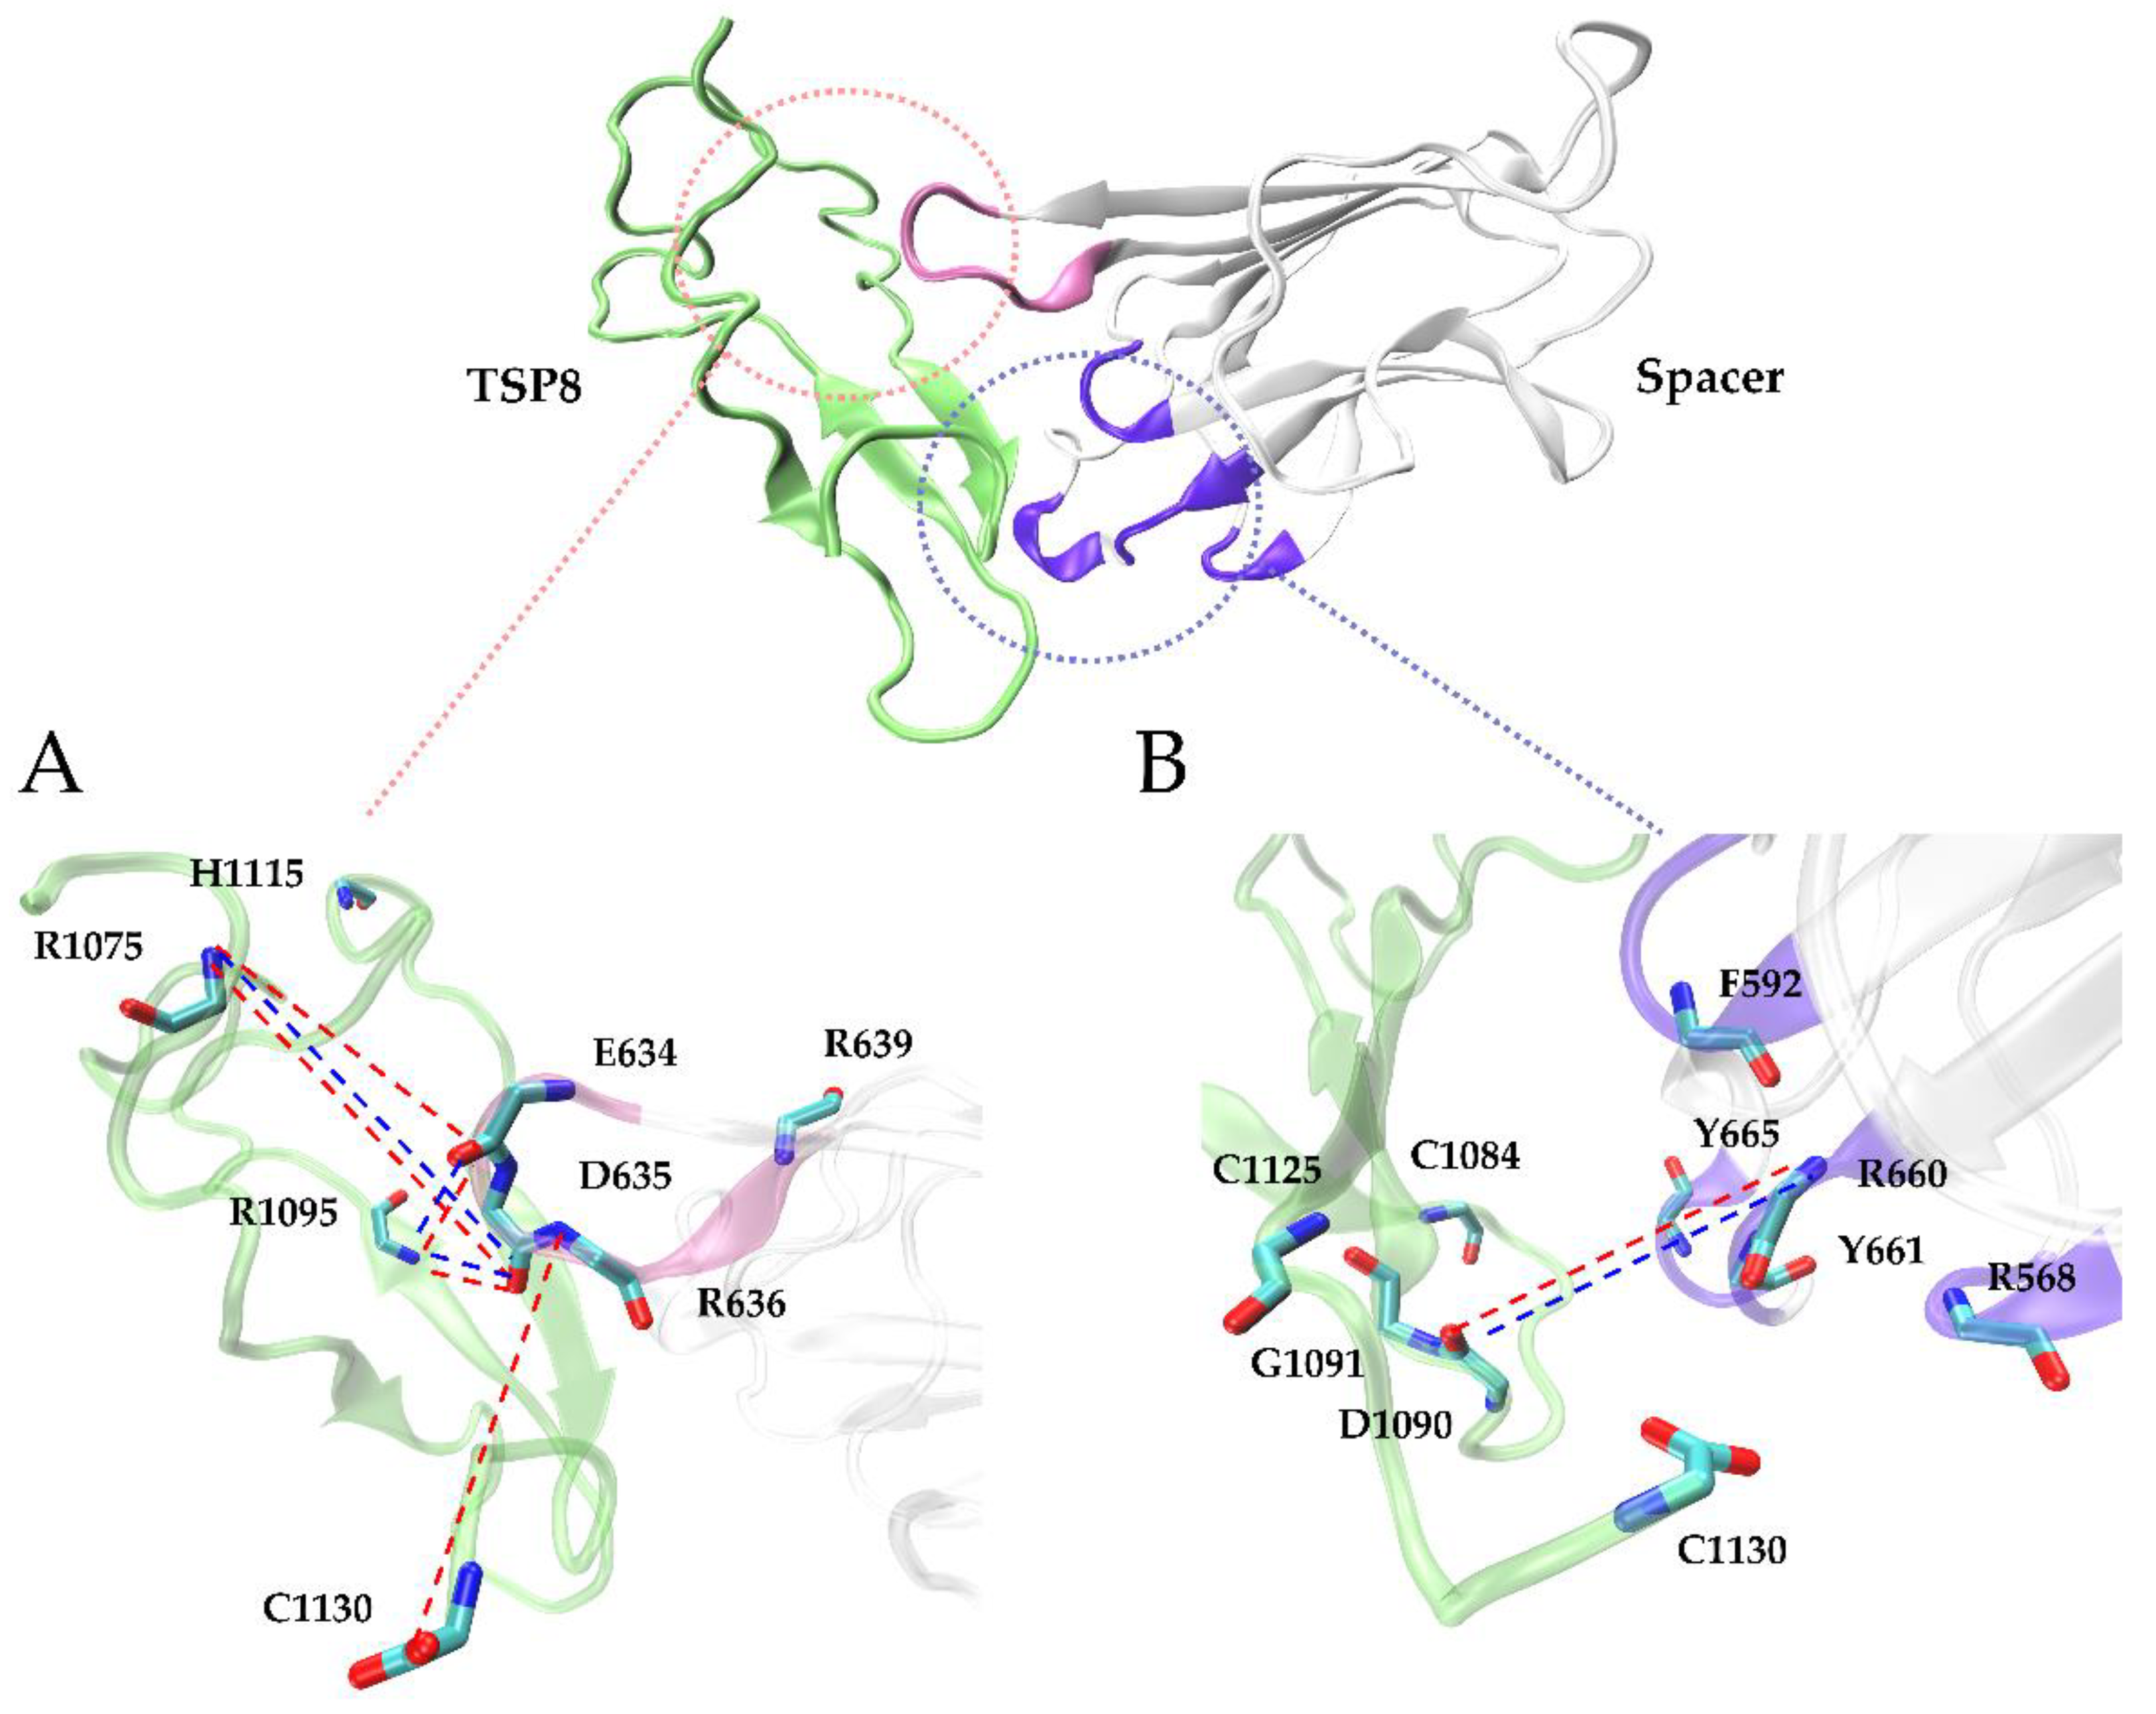
2.2. Arg1075, Asp1090, Arg1095, and Cys1130 Were the Key Residues on the TSP8 Domain Binding to the Spacer Domain

Simulations of Model A were performed for 40 ns equilibrium thrice to obtain three equilibrated conformations of the TSP8-Spacer complex (WT1, WT2, and WT3). The time courses of the heavy-atoms RMSD ascended rapidly, fluctuated, and finally reached a stable plateau after 30 ns around 4.0 Å, 5.0 Å, and 7.5 Å for WT1, WT2, and WT3 (Figure S1A), indicating that these three complexes have reached their equilibrated states. The NHB across the interface of three complexes were fitted to the Gaussian distribution (Figure S1B–D), implying that the conformational space of each complex was complete.
It was demonstrated that the key binding sites could be predicted via the stable H-bonds in free molecular dynamics (FMD) simulations [19]. Therefore, FMD simulations were performed for the equilibrated TSP8-Spacer complexes in parallel. As shown in Figure 3A, the time courses of Cα-RMSD of WT1 and WT2 were similar, with the Cα-RMSD climbing to ~3.0 Å within 10 ns and then fluctuating slightly. Large fluctuations of Cα-RMSD were observed after 20 ns in WT3, and the Cα-RMSD finally stabilized at ~5.5 Å. This indicated that WT1 and WT2 were more stable than WT3. The distributions of the NHB on the interface of three complexes were fitted to a Gaussian distribution (Figure 3B), and the mean NHB of WT1, WT2, and WT3 were 6.873 ± 1.797, 8.809 ± 1.736, and 6.218 ± 1.250, respectively. This implied that the interaction between the TSP8 domain and the Spacer domain was more stable in WT2. Therefore, we selected the structure of the last frame of WT2 during FMD stimulation for the subsequent mutations.
Considering that each FMD simulation obtained a possible conformational state of the TSP8-Spacer complex, we analyzed the H-bonds and salt bridges across the interface of all three complexes. Table 3 and Table 4 listed the H-bonds and salt bridges with an average survival ratio >10%. The H-bonds and salt bridges were classified into three categories: low (0~0.3), medium (0.3~0.55), and high (0.55~1.0) thermal stability according to their survival ratio value. The H-bonds with medium and high thermal stability were used to predict the key binding sites.
It was reported that exosite-3 was essential in mediating the auto-inhibition of ADAMTS13 [6,12,20]. Our MD simulations displayed that the exosite-3 residues did participate in the formation of H-bonds and salt bridges on the TSP8-Spacer complex, but their survival ratios were not high (Table 3 and Table 4). Among these H-bonds, Arg660-Asp1090 formed the fourth H-bond with moderate thermal stability (average survival ratio 0.313 ± 0.255). Except for that, all other H-bonds formed between the exosite-3 residues and the TSP8 domain exhibited low thermal stability. The average survival ratios of the H-bonds formed by Arg568, Tyr661, and Tyr665 with Asp1090 were 0.261 ± 0.109, 0.234 ± 0.191, and 0.155 ± 0.127, respectively. In addition to interacting with Asp1090, exosite-3 also formed H-bonds with other residues on the TSP8 domain. Arg660 formed the other two H-bonds with Cys1125 and Cys1130, and their average survival ratios were 0.251 ± 0.205 and 0.215 ± 0.176, respectively. The average survival ratio of the H-bond Tyr661-Cys1125 was 0.293 ± 0.178. Tyr665 formed three H-bonds with Cys1084, Gly1091, and Cys1130, but their average survival ratios were all below 0.15. Only one salt bridge was observed between the exosite-3 and the TSP8 domain. Arg660-Asp1090 formed the fourth salt bridge with a medium average survival ratio of 0.320 ± 0.261 (Table 4).
Interestingly, Glu634, Asp635, and Arg636 on the Spacer domain formed H-bonds and salt bridges with residues on the TSP8 domain with high survival ratios. Glu634, Asp635, and Arg636 are the residues of exosite-4 that play important roles in the proteolysis of VWF73 and multimeric VWF [21]. Asp635 formed the top two H-bonds with Arg1075 (average survival ratio 0.815 ± 0.067) and Arg1095 (average survival ratio 0.591 ± 0.242). In addition, Asp635 also formed the top two salt bridges with Arg1075 (average survival ratio 0.829 ± 0.110) and Arg1095 (average survival ratio 0.569 ± 0.241). Arg636 formed the third H-bond with Cys1130 (average survival ratio 0.385 ± 0.149). Glu634 formed the fifth H-bond with Arg1095 and the 12th H-bond with Arg1075, with the average survival ratio of 0.305 ± 0.249 and 0.127 ± 0.068. Glu634 also formed the third salt bridge with Arg1095 (average survival ratio 0.330 ± 0.269). Apart from these three residues, Arg639 on exosite-4 formed a low survival ratio (0.117 ± 0.095) H-bond with His1115. The key interactions of the TSP8-Spacer complex are illustrated in Figure 4.
Arg1075, Asp1090, Arg1095, and Cys1130 on the TSP8 domain formed 11 out of 16 H-bonds and all four salt bridges with residues on the Spacer domain (Table 3 and Table 4). More importantly, they participated in the formation of the top five H-bonds with a high or medium thermal stability, suggesting they were the key residues mediating the TSP8-Spacer interactions. It is consistent with the previous report that point mutation in Arg1075 or Arg1095 was found in newborns with congenital TTP [22].
Taken together, both exosite-3 and exosite-4, particularly Glu634, Asp635, and Arg636 in the latter, were critical for the TSP8-Spacer interactions. Arg1075, Asp1090, Arg1095, and Cys1130 were predicted to be the key residues on the TSP8 domain.

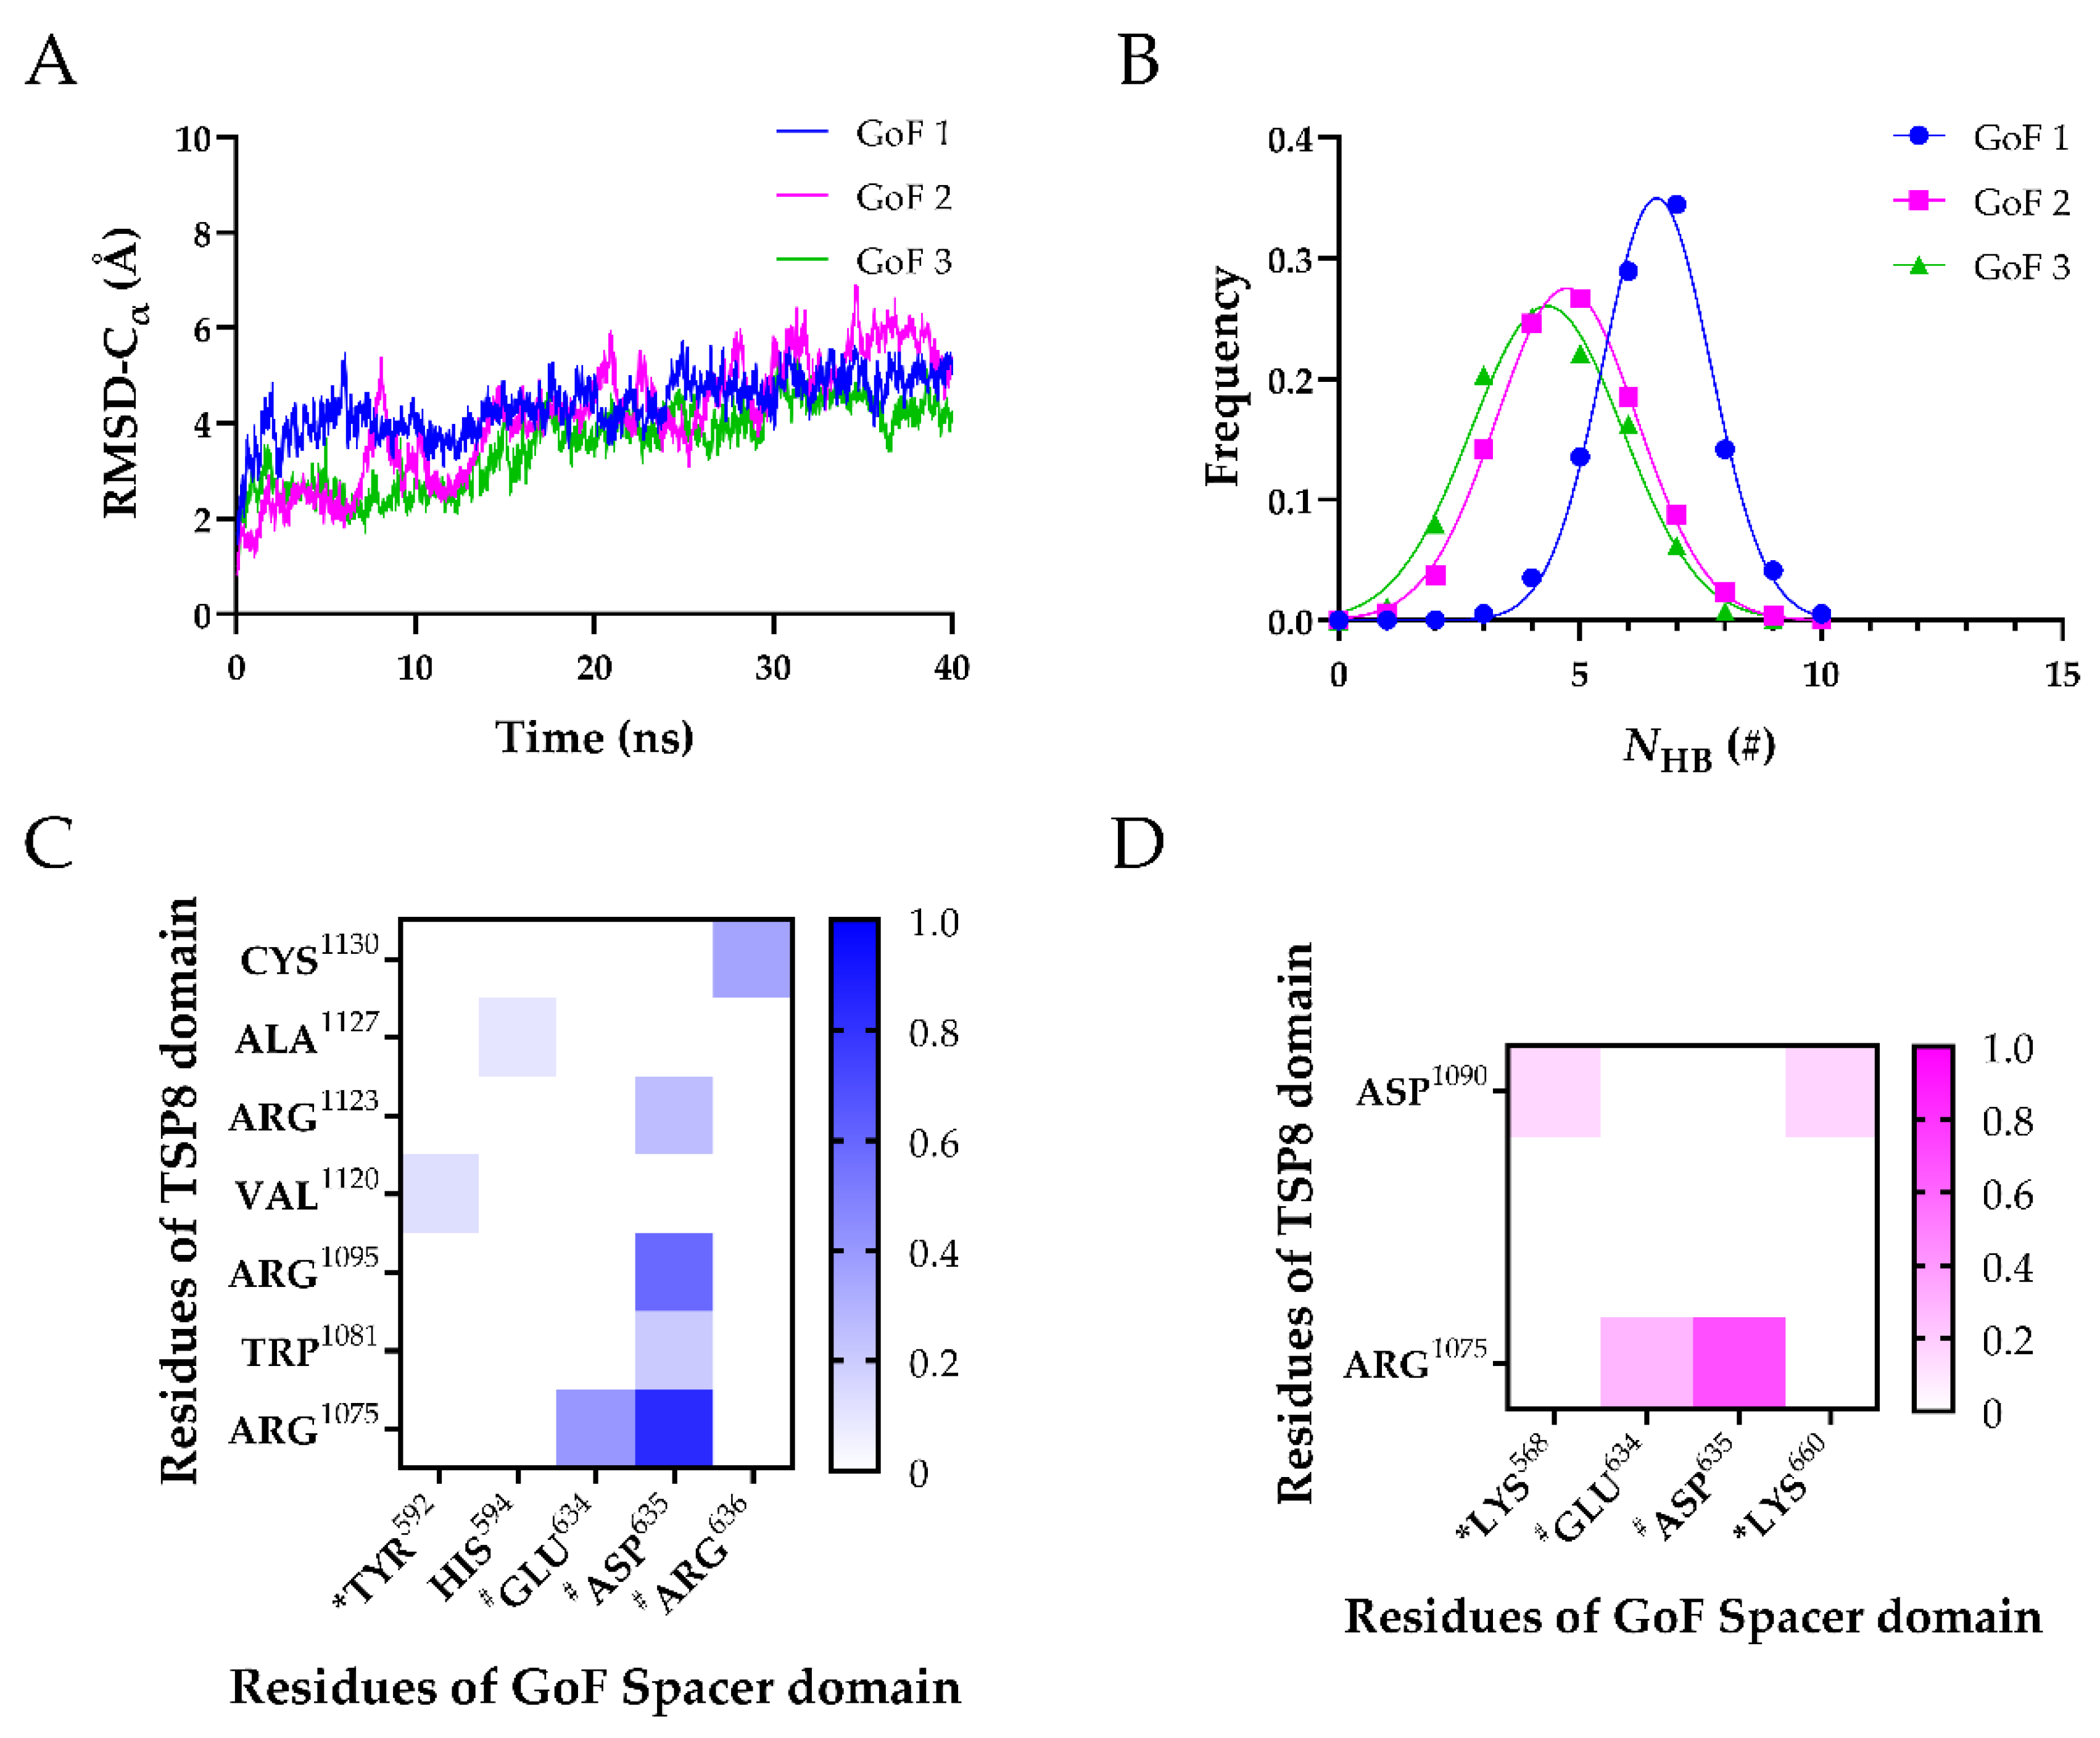
2.3. GoF Mutations Attenuated the Binding of Exosite-3 but Enhanced the Binding of Exosite-4 to the TSP8 Domain

It was reported that after mutating the five key residues (R568K/F592Y/R660K/Y661F/Y665F) on the Spacer domain, the conformation of ADAMTS13 converted to an “open” state and its catalytic efficiency increased [5,12], indicating that these mutations weakened the binding of the Spacer domain to the C-terminal domains of ADAMTS13. To further validate our TSP8-Spacer model, the structure of the last frame of the FMD simulation of WT2 was selected and the five residues in the Spacer domain were mutated accordingly to obtain the GoF complex. The energy minimization and 40 ns equilibration were performed thrice, and three GoF complexes were obtained (GoF1, GoF2, and GoF3). The time courses of the Cα-RMSD of three complexes were similar, with high fluctuation during the first 30 ns and stabilization at ~6.0 Å for the last 10 ns, as shown in Figure S2A. The NHB distributions of GoF1, GoF2, and GoF3 were fitted to the Gaussian distribution, with a mean NHB of 6.856 ± 1.564, 6.099 ± 1.641, and 4.628 ± 1.336, respectively (Figure S2B–D).
After obtaining their stable conformations, these GoF complexes were subject to FMD simulations. In Figure 5A, the Cα-RMSD of three GoF complexes climbed gradually. The mutations of the Spacer domain diminished the interactions on the interface by two aspects. First, the mean NHB was reduced. The mean NHB of the GoF complex was less than that of the WT complex. Additionally, the key binding sites on the Spacer domain that stabilized the complex were changed from two to one. Interactions of exosite-3 with the TSP8 domain were dramatically reduced. Only a newly formed H-bond (Tyr592-Val1120) and two weak salt bridges (Lys568-Asp1090 and Lys660-Asp1090) existed between the GoF exosite-3 and the TSP8 domain. Their average survival ratios were 0.129 ± 0.105 (Tyr592-Val1120), 0.156 ± 0.127 (Lys568-Asp1090), and 0.167 ± 0.136 (Lys660-Asp1090), respectively (Table 5 and Table 6). The stability of the complex was mainly dependent on exosite-4. Glu634, Asp635, and Arg636 on the Spacer domain formed six out of eight H-bonds and two out of four salt bridges with residues on the TSP8 domain (Table 5 and Table 6). Particularly, mutations on the Spacer domain increased the binding of Asp635 to the TSP8 domain. It bound four residues: Arg1075, Arg1095, Trp1081, and Arg1123. The H-bonds of Asp635-Arg1075 and Asp635-Arg1095 still ranked first and the second, with the corresponding average survival ratios of 0.835 ± 0.091 and 0.585 ± 0.239. The average survival ratios of two newly formed H-bonds by Asp635 were 0.206 ± 0.168 (with Trp1081) and 0.257 ± 0.210 (with Arg1123). In addition to Arg635, the H-bond formed by Glu634-Arg1075 (average survival ratio 0.406 ± 0.125) and Arg636-Cys1130 (average survival ratio 0.356 ± 0.259) were still essential for maintaining the bindings between the TSP8 domain and the GoF Spacer domain. These data demonstrated that the mutations of the Spacer domain attenuated the binding of exosite-3 but enhanced the binding of exosite-4 to the TSP8 domain.

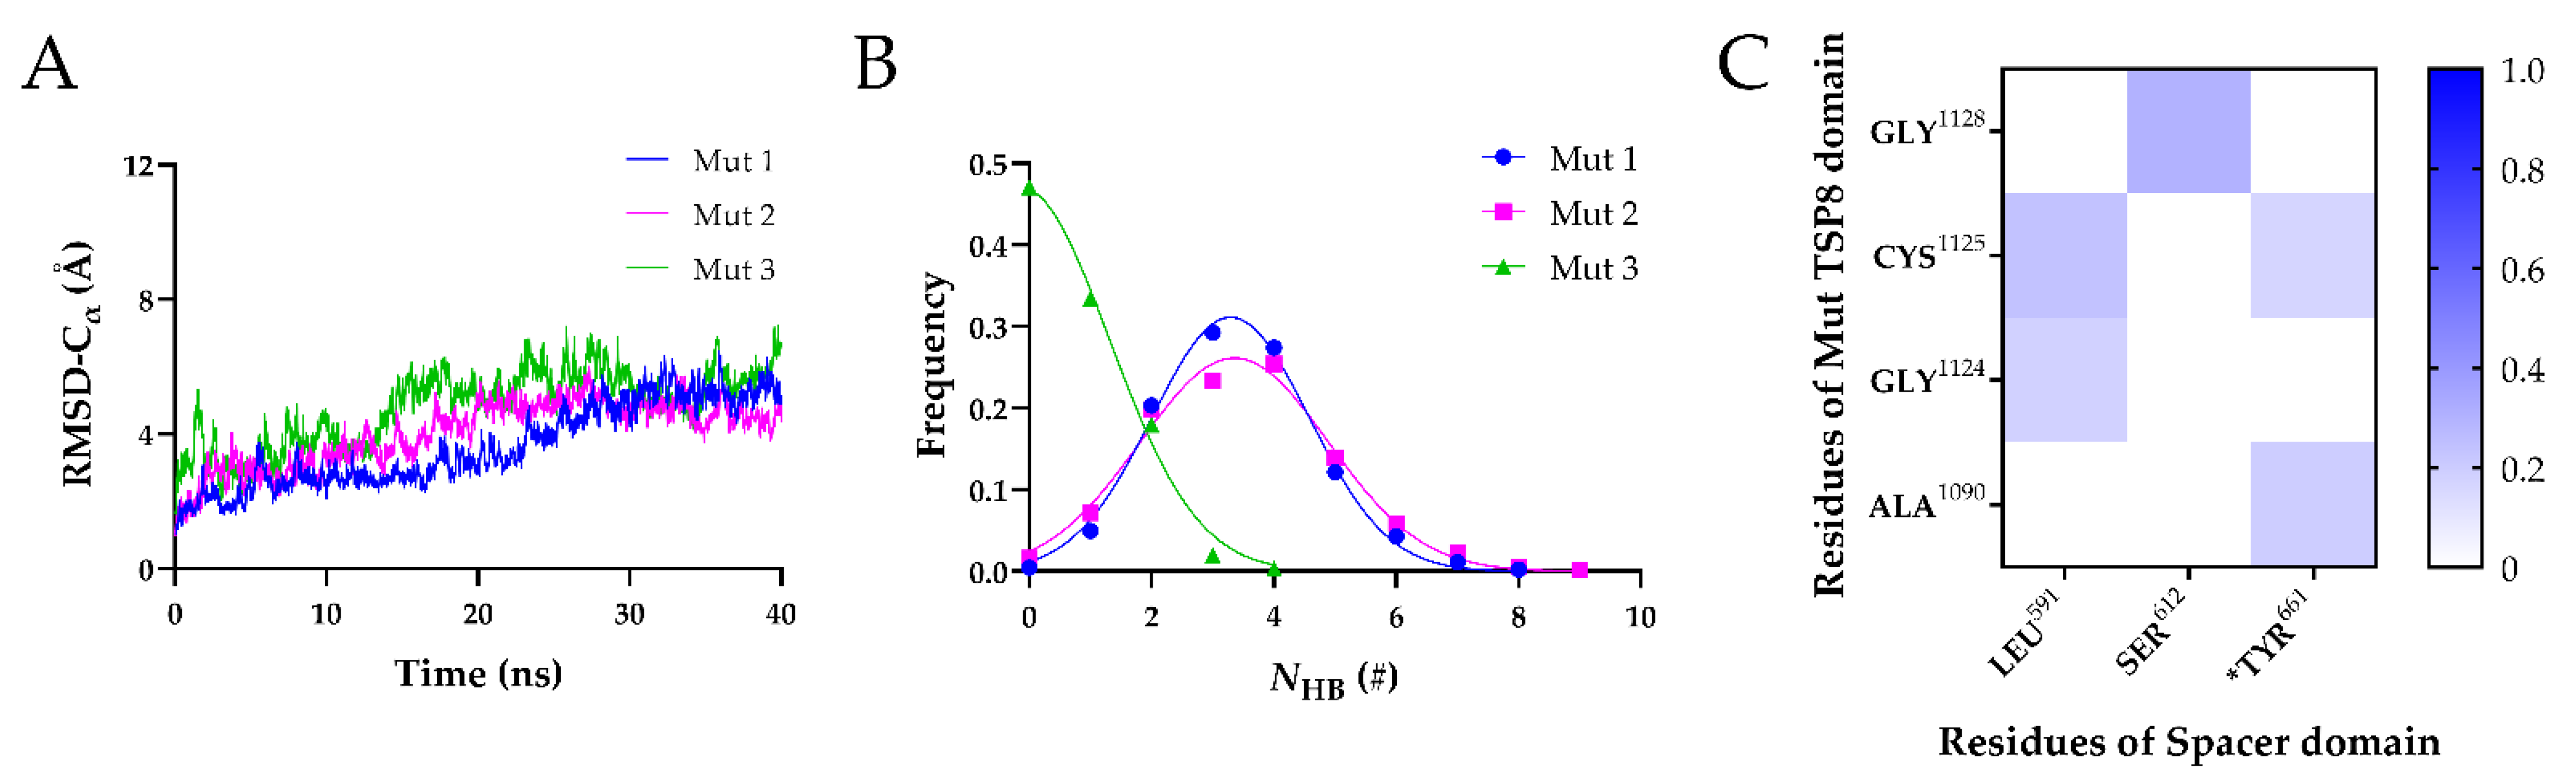
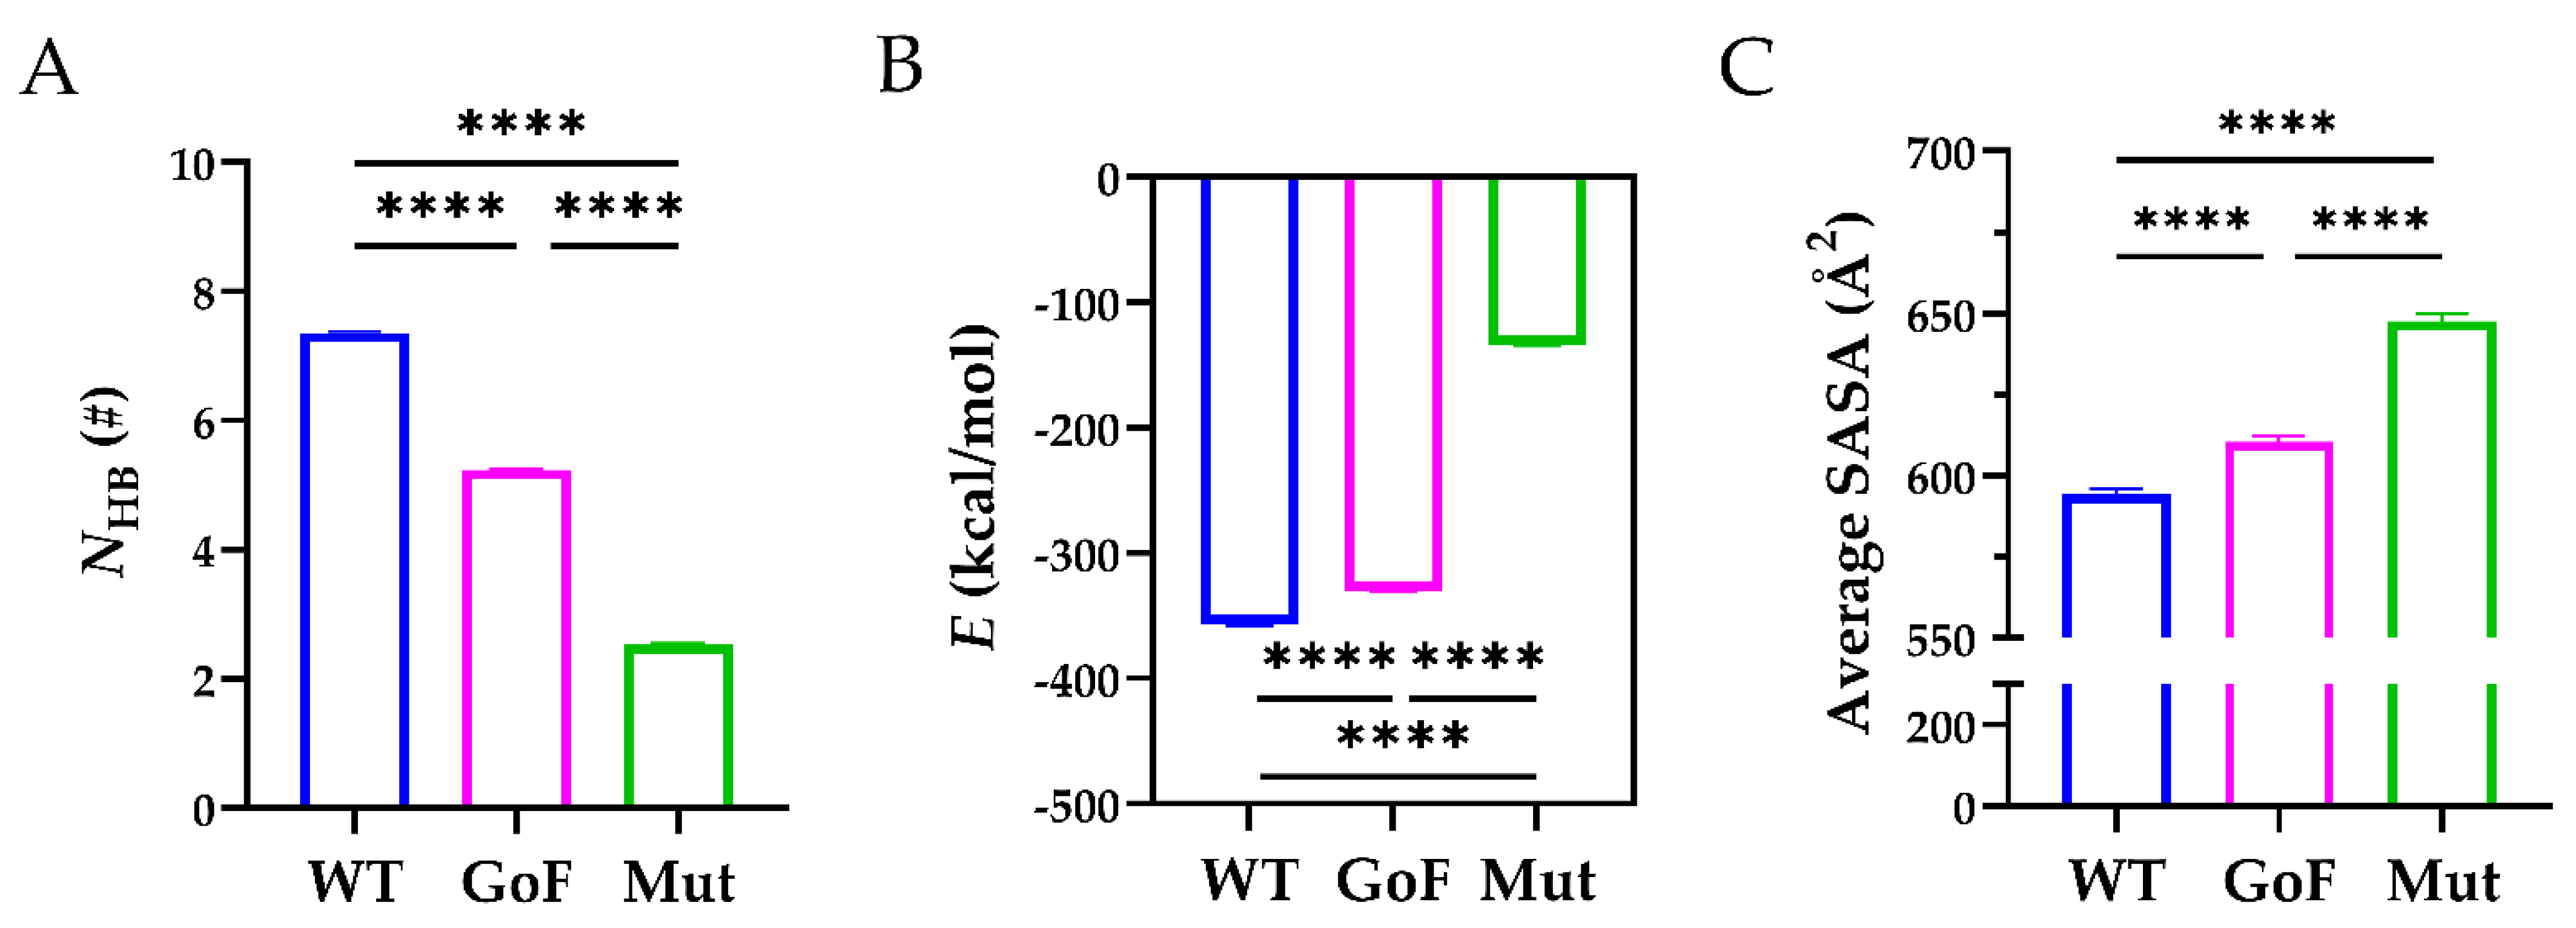
2.4. The TSP8 Mutations Reduced the Stability of the Complex

To investigate whether the predicted residues (Arg1075, Asp1090, Arg1095, and Cys1130) on the TSP8 domain are critical, these four residues were all mutated to uncharged Ala to obtain the Mut complex. The Mut complex was subject to 40 ns equilibrium simulation thrice, and three Mut complexes (Mut1, Mut2, and Mut3) were obtained. The RMSD of heavy atoms for the Mut1, Mut2, and Mut3 fluctuated around 4.0 Å, 5.5 Å, and 5.0 Å, respectively (Figure S3A). The mean NHB on the interface of each Mut complex was less than five during the 40 ns simulation (Figure S3B–D). Of note, the mean NHB on the interface of Mut2 and Mut3 were as low as 2.439 ± 1.226 and 2.657 ± 2.159. These data suggested that mutations of the four residues on the TSP8 domain weakened the complex stability.
Subsequently, the equilibrated Mut complexes were subject to 40 ns FMD simulations. As shown in Figure 6A, the Cα-RMSD vs. time curves of three Mut complexes were similar, with the Cα-RMSD climbing to ~6 Å within 30 ns and then fluctuating slightly. The mean NHB on the interface of these Mut complexes decreased dramatically (Figure 6B). The mean NHB on the interface of the Mut1 and Mut2 was 3.293 ± 1.284 and 3.354 ± 1.535, respectively. In particular, almost no H-bonds were found on the interface of Mut3. We further analyzed the H-bonds and salt bridges on the interface of the complexes in detail. The four mutations resulted in the loss of all salt bridges on the interface of three Mut complexes. In addition, only five H-bonds were able to survive beyond 0.1 in three FMD simulations (Figure 6C and Table 7). The most stable H-bond was formed by Ser612-Gly1128, with an average survival ratio of 0.300 ± 0.212. The average survival ratios of the other four residue pairs were all below 0.3. We found that Tyr661 played a role in maintaining the stability of the Mut complex by interacting with Ala1090 (average survival ratio 0.194 ± 0.078) and Cys1125 (average survival ratio 0.164 ± 0.116). The average survival ratio of the H-bonds formed by Cys1125 and Gly1124 with Leu591 were 0.239 ± 0.169 and 0.182 ± 0.129, respectively.
The data above demonstrated that mutating Arg1075, Asp1090, Arg1095, and Cys1130 to Ala destabilized the TSP8-Spacer complex. This also emphasized the importance of these predicted residues on the TSP8 domain in the regulation of ADAMTS13 auto-inhibition.
Next, we compared the stability of the WT, GoF, and Mut complexes. As shown in Figure 7A, the mean NHB across the interface of the WT complex (7.130 ± 1.960) was significantly higher than those of the GoF complex (5.276 ± 1.803) and the Mut complex (2.064 ± 2.381). In addition, the mean NHB of the GoF complex was significantly higher than that of the Mut complex. The corresponding interaction energy for the WT, GoF, and Mut complexes were −356.8 ± 1.143, −330.1 ± 0.889, and −134.1 ± 0.884 kcal/mol, and the differences among these three complexes were statistically significant (p < 0.0001) (Figure 7B). The interaction energy indicated that the WT complex was energy favorable compared to the other two complexes. Furthermore, the average SASA of the WT complex was 594.3 ± 1.870 Å2, significantly less than those of the GoF (610.5 ± 1.623 Å2) and Mut complex (647.6 ± 2.415 Å2), suggesting that mutations either in the Spacer or TSP8 domain partially exposed the hydrophobic binding core (Figure 7C). These data demonstrated that mutations on the Spacer or TSP8 domain impaired the Spacer-TSP8 binding, and the four specific mutations on the TSP8 domain resulted in the most unstable complex.

3. Discussion

Plasma exchange, the main therapy for acquired TTP (aTTP), still has a mortality rate of 10–20% in aTTP treatment [23]. The main reason for the high mortality rate is the rapid neutralization of ADAMTS13 by anti-ADAMTS13 IgGs produced by aTTP patients. Recombinant WT ADAMTS13 was shown to be safe and nonimmunogenic against congenital TTP (cTTP) in a phase I study [24]. However, it is still potentially neutralized by anti-ADAMTS13 IgGs in aTTP patient plasma. Better understanding the molecular basis of the structure of ADAMTS13 and selectively modifying the key residues might provide a new drug for the aTTP treatment. In line with this notion, it was suggested that GoF ADAMTS13 could be exploited for the development of a new drug as its efficient cleavage activity and its resistance to anti-ADAMTS13 auto-antibodies from patients with aTTP [12]. Recently, South et al. [25] identified a point mutation in Linker3 (located between TSP8 and CUB1 domains), Ala1144Val, which greatly enhanced the ADAMTS13 activity, effectively restored blood flow in a distal FeCl3 MCAo model, and reduced tissue hypoperfusion in a transient MCAo model of ischemia/reperfusion (I/R) injury. In the present study, we constructed the TSP8-Spacer complex by homology modelling and performed MD simulations. The key residues predicted in the present study, Arg1075, Asp1090, Arg1095, and Cys1130 on the TSP8 domain, might provide potential targets for new drug development.
It is well established that exosite-3 is crucial in mediating ADAMTS13 auto-inhibition [5,6,8]. GoF ADAMTS13 exhibits “open” conformation and increased proteolytic activity [12]. Recently, several studies have revealed that exosite-4 plays a key role in ADAMTS13 auto-inhibition as well. Kim and his colleagues demonstrated that exosite-3 directly interacted with Arg1326, Glu1387, and Glu1389 in CUB2, whereas exosite-4 bound to Trp1245, Trp1250, Lys1252, and Arg1272 in CUB1 [15]. Our previous study proposed that exosite-3 might bind to Glu1231, Asp1259, and Leu1251, whereas exosite-4 was capable of interacting with Arg1251 and Asp1261 in CUB1 [16]. The present results demonstrated that both exosite-3 and exosite-4 interact with the TSP8 domain, further emphasizing the significance of exosite-3 and exosite-4 in mediating ADAMTS13 auto-inhibition. Our MD simulations predicted that Arg1075, Asp1090, Arg1095, and Cys1130 on the TSP8 domain were key residues binding to the Spacer domain. In the WT complex, Asp1090 formed four H-bonds (with Arg568, Arg660, Tyr661, and Tyr665) and one salt bridge (with Arg660) (Table 3 and Table 4). In addition, the H-bond and salt bridge formed by Asp1090-Arg660 both exhibited medium thermal stability. Importantly, in the GoF and Mut complexes, the interactions of residue 1090 with exosite-3 were not completely abolished (Table 6 and Table 7). These data demonstrated that interactions between Asp1090 and exosite-3 might be the key to ensuring the TSP8-Spacer binding. In the WT complex, Arg1075 and Arg1095 tightly bound to exosite-4. Arg1075-Asp635 and Arg1095-Asp635 formed the top two H-bonds and top two salt bridges in the WT complex (Table 3 and Table 4), and these two residue pairs were less affected by the GoF mutations (Table 5 and Table 6). Cys1130 locating at the C-terminus of the TSP8 domain was less constrained and could contact both exosite-3 and exosite-4 in the WT complex. The GoF mutation ruined the H-bond formed by Cys1130 and exosite-3, but did not influence the H-bond formed by Cys1130 and exosite-4 (Cys1130-Arg636). Mutations of Arg1075, Asp1090, Arg1095, and Cys1130 into Ala resulted in the disappearance of all salt bridges on the interface (Table 7). These results indicate that Arg1075, Asp1090, Arg1095, and Cys1130 in the TSP8 domain are likely to be essential for ADAMTS13 to cleave VWF. Indeed, it was identified that causative mutations, i.e., p.R1075C, p.R1095W, and p.R1095Q, resulted in congenital ADAMTS13 deficiency [22].
In the present study, the GoF complex did not dissociate during 40 ns FMD, which is not consistent with previous reports. Under electron microscopy or small-angle X-ray scattering, the GoF ADAMTS13 adopts an “open” conformation [5,7]. The limited simulation time (40 ns) may be one of the reasons. This inconsistency may be also due to our mutation strategy. To investigate the interaction of the TSP8 domain and the GoF Spacer domain, we mutated the Spacer domain based on the stabilized WT TSP8-Spacer complex, resulting in a stable GoF mutation complex. Of note, our previous study with atomic force microscopy scanning demonstrated that 11.78% and 75.36% of GoF ADAMTS13 molecules in “closed” and intermediate states [26], implying that the interactions of the distal domains and the Spacer domain are not fully disrupted in some GoF ADAMTS13 molecules. Four key residues on the TSP8 domain are predicted in the present study. However, more experiments are needed to validate the significance of these residues.
Overall, we investigated the interaction of the TSP8 domain with the Spacer domain. MD simulations were used to depict the key residues on the TSP8 domain. The results revealed that Arg1075, Asp1090, Arg1095, and Cys1130 played important roles in maintaining the stability of the WT complex. Moreover, mutation of these four residues impaired the TSP8-Spacer binding, leading to an unstable complex.

4. Materials and Methods

4.1. Construction of the WT TSP8-Spacer Complex

The 3D structure of the Spacer domain (residues: Ser556-Pro682) was derived from the crystal structure of ADAMTS13-DTCS resolved by Akiyama et al. in 2009 (PDB ID: 3GHM; Resolution: 2.6 Å) [3]. As the crystal structure of the TSP8 domain is unavailable, the amino acid sequence of the TSP8 domain (residues: Cys1072 to Val1131) were uploaded to Phyre2 [27] to perform homology modeling. Among the 54 models of the TSP8 domain, we selected the top-ranked model, which shared the highest alignment coverage (92%) with the template thrombospondin-1 TSR domains 2 and 3 (PDB: 3R6B), to dock with the Spacer domain.
The SwarmDock Server was utilized to do the flexible docking [18], without the assumption of specific residues located on the interface of the Spacer or TSP8 domain. After getting all docking complexes, the top ten low energy models were investigated with VMD (Visual Molecular Dynamics). Two docking complexes, 67d and 47d, were selected based on the following two criteria: (1) partial or all five key residues of exosite-3 on the Spacer domain are on the interface; (2) Leu621, Glu622, and Asp623 on the loop β6–β7 of the Spacer domain are not on the interface, because they interact with the CA region of the Cys domain, the adjacent N-terminal domain of the Spacer domain [3].
Subsequently, these two complexes were subject to the energy minimization and 20 ns equilibration simulation with NAMD (Nanoscale Molecular Dynamics) to analyze and select the most stable model for subsequent experiments. The optimal TSP8-Spacer docking complex was then subjected to energy minimization, equilibrium, and FMD simulations thrice to re-analyze the stability of the WT TSP8-Spacer complex [19].

4.2. Construction of the Mutated TSP8-Spacer Complexes

Based on the FMD simulation of the WT TSP8-Spacer complex, we mutated the predicted key residues on the TSP8 domain to Ala to obtain the TSP8-mutated complex (named Mut complex). We also mutated exosite-3 (R568K/F592Y/R660K/Y661F/Y665F) of the Spacer domain to obtain the GoF Spacer-TSP8 complex (named GoF complex). These two complexes were then respectively subjected to three independent energy minimization, equilibrium, and FMD simulations to further explore the effects of these mutations on the interaction of the Spacer domain and the TSP8 domain.

4.3. Molecular Dynamics Simulation

By utilizing VMD, the WT, GoF, and Mut complexes were immersed into a rectangular box composed of TIP3P water molecules. Protein atoms were 25 Å away from the wall. Na+ and Cl were added to the system at a concentration of 150 mM to mimic the physiological environment. Particle mesh Ewald (PME) [28] was used to calculate the electrostatic interactions, and a 12 Å switching cut-off was set for electrostatic and van der Waals interaction.
The system was subjected to the energy minimization in the CHARMM27 all-atom force field [29] with NAMD. The energy minimization can be divided into three parts: (1) fixed all atoms in a complex; (2) fixed the backbone of a complex and other atoms were free; and (3) all atoms were free. After running the energy minimization for 15,000 steps in each part thrice (the time step of 2 fs), the system was subject to 40 ns equilibration at the constant temperature of 310 K and the constant pressure of 1 atm. RMSD of heavy atoms and the time course of the NHB on the interface were analyzed to determine whether the system had been equilibrated. When three different equilibrated poses for a complex were obtained, they were used as the initial conformation for the following FMD simulations in parallel. The FMD simulation was performed for 40 ns without controlling the temperature and pressure, which is similar to the NVE ensemble [30]. Figure 8 showed the overall workflow of the complex construction and simulation.

4.4. Data Analysis

4.4.1. The Selection of Key Residues

An H-bond was defined as a bond with an angle greater than 150° and a distance less than 3.5 Å between the donor and acceptor atoms. A salt bridge was defined as a bond formed by -O on the side chain of acidic amino acid and -N on the side chain of basic amino acid, with the bond length less than 4 Å. The survival ratio of an H-bond or a salt bridge was defined as the bond dwell time over the simulation duration, which was used to characterize the thermal stability of a complex. We used heat maps to illustrate H-bonds and salt bridges with an average survival ratio greater than 10%. The key residues were defined if those residues formed H-bonds or salt bridges with an average survival ratio greater than 30%.

4.4.2. Structural Stability Analysis

We used VMD tools to analyze the trajectories of all simulations. Cα-RMSD was applied to compute the deviation of a conformation from the initial state and describe the conformational stability [31]. The SASA characterized the degree of the hydrophobic core exposure with a 1.4 Å cutoff [32]. To estimate the binding energy of a complex, we calculated the interaction energy (E) of a complex with a combination of the van der Waals energy and electrostatic energy.

4.4.3. Statistical Analysis

The NHB was fitted with Gaussian distribution. For a two-group comparison, the unpaired Student’s t-test (parametric) was used. For a multiple-group comparison, one-way ANOVA was used with a Bonferroni post hoc test. The value of p < 0.05 was considered statistically significant. GraphPad Prism 8.0.1 software was used to analyze the data.

Supplementary Materials

The following are available online. Figure S1: Three equilibrium simulations of the WT complex. Figure S2: Three equilibrium simulations of the GoF complex. Figure S3: Three equilibrium simulations of the Mut complex.

Author Contributions

Conceptualization, J.L.; methodology, Z.W., J.Y., X.X., G.L., Y.F., J.W. and J.L.; formal analysis, Z.W. and J.Y.; investigation, Z.W., J.Y. and J.L.; writing—original draft preparation, Z.W.; writing—review and editing, Z.W., Y.F., J.W. and J.L.; funding acquisition, Y.F., J.W. and J.L. All authors have read and agreed to the published version of the manuscript.

Funding

This research was funded by the National Science Foundation of China, grant number 31771012 and 32071303 (to Jiangguo Lin), 1167219 (to Ying Fang), and 11432006 (to Jianhua Wu).

Institutional Review Board Statement

Not applicable.

Informed Consent Statement

Not applicable.

Data Availability Statement

The data is available on request from the author.

Conflicts of Interest

The authors declare no conflict of interest.

Sample Availability

Samples of the compounds are not available from the authors.

References

  1. Ercig, B.; Wichapong, K.; Reutelingsperger, C.P.M.; Vanhoorelbeke, K.; Voorberg, J.; Nicolaes, G.A. Insights into 3D Structure of ADAMTS13: A Stepping Stone towards Novel Therapeutic Treatment of Thrombotic Thrombocytopenic Purpura. Thromb. Haemost. 2018, 118, 28–41. [Google Scholar] [CrossRef]
  2. Zanardelli, S.; Crawley, J.T.B.; Chion, C.K.N.C.K.; Lam, J.K.; Preston, R.; Lane, D.A. ADAMTS13 Substrate Recognition of von Willebrand Factor A2 Domain. J. Biol. Chem. 2006, 281, 1555–1563. [Google Scholar] [CrossRef] [PubMed] [Green Version]
  3. Akiyama, M.; Takeda, S.; Kokame, K.; Takagi, J.; Miyata, T. Crystal structures of the noncatalytic domains of ADAMTS13 reveal multiple discontinuous exosites for von Willebrand factor. Proc. Natl. Acad. Sci. USA 2009, 106, 19274–19279. [Google Scholar] [CrossRef] [PubMed] [Green Version]
  4. Joly, B.S.; Coppo, P.; Veyradier, A. An update on pathogenesis and diagnosis of thrombotic thrombocytopenic purpura. Expert Rev. Hematol. 2019, 12, 383–395. [Google Scholar] [CrossRef] [PubMed]
  5. South, K.; Luken, B.; Crawley, J.; Phillips, R.; Thomas, M.; Collins, R.F.; Deforche, L.; Vanhoorelbeke, K.; Lane, D.A. Conformational activation of ADAMTS13. Proc. Natl. Acad. Sci. USA 2014, 111, 18578–18583. [Google Scholar] [CrossRef] [Green Version]
  6. South, K.; Freitas, M.O.; Lane, D.A. A model for the conformational activation of the structurally quiescent metalloprotease ADAMTS13 by von willebrand factor. J. Biol. Chem. 2017, 292, 5760–5769. [Google Scholar] [CrossRef] [Green Version]
  7. Zhu, J.; Muia, J.; Gupta, G.; Westfield, L.A.; Vanhoorelbeke, K.; Tolia, N.H.; Sadler, J.E. Exploring the “minimal” structure of a functional ADAMTS13 by mutagenesis and small-angle X-ray scattering. Blood 2019, 133, 1909–1918. [Google Scholar] [CrossRef] [PubMed] [Green Version]
  8. Muia, J.; Zhu, J.; Gupta, G.; Haberichter, S.L.; Friedman, K.D.; Feys, H.; Deforche, L.; Vanhoorelbeke, K.; Westfield, L.A.; Roth, R.; et al. Allosteric activation of ADAMTS13 by von Willebrand factor. Proc. Natl. Acad. Sci. USA 2014, 111, 18584–18589. [Google Scholar] [CrossRef] [Green Version]
  9. Crawley, J.T.B.; de Groot, R.; Xiang, Y.; Luken, B.M.; Lane, D.A. Unraveling the scissile bond: How ADAMTS13 recognizes and cleaves von Willebrand factor. Blood 2011, 118, 3212–3221. [Google Scholar] [CrossRef] [PubMed] [Green Version]
  10. Petri, A.; Kim, H.J.; Xu, Y.; De Groot, R.; Li, C.; Vandenbulcke, A.; Vanhoorelbeke, K.; Emsley, J.; Crawley, J.T.B. Crystal structure and substrate-induced activation of ADAMTS13. Nat. Commun. 2019, 10, 1–16. [Google Scholar] [CrossRef] [Green Version]
  11. South, K.; Freitas, M.O.; Lane, D.A. Conformational quiescence of ADAMTS-13 prevents proteolytic promiscuity. J. Thromb. Haemost. 2016, 14, 2011–2022. [Google Scholar] [CrossRef] [PubMed] [Green Version]
  12. Jian, C.; Xiao, J.; Gong, L.; Skipwith, C.G.; Jin, S.Y.; Kwaan, H.C.; Zheng, X.L. Gain-of-function ADAMTS13 variants that are resistant to autoantibodies against ADAMTS13 in patients with acquired thrombotic thrombocytopenic purpura. Blood 2012, 119, 3836–3843. [Google Scholar] [CrossRef] [Green Version]
  13. Pos, W.; Sorvillo, N.; Fijnheer, R.; Feys, H.B.; Kaijen, P.H.P.; Vidarsson, G.; Voorberg, J. Residues Arg568 and Phe592 contribute to an antigenic surface for anti-ADAMTS13 antibodies in the spacer domain. Haematologica 2011, 96, 1670–1677. [Google Scholar] [CrossRef] [PubMed]
  14. Pos, W.; Crawley, J.T.B.; Fijnheer, R.; Voorberg, J.; Lane, D.A.; Luken, B.M. An autoantibody epitope comprising residues R660, Y661, and Y665 in the ADAMTS13 spacer domain identifies a binding site for the A2 domain of VWF. Blood 2010, 115, 1640–1649. [Google Scholar] [CrossRef]
  15. Kim, H.J.; Xu, Y.; Petri, A.; Vanhoorelbeke, K.; Crawley, J.T.B.; Emsley, J. Crystal structure of ADAMTS13 CUB domains reveals their role in global latency. Sci. Adv. 2021, 7, eabg4403. [Google Scholar] [CrossRef]
  16. Yang, J.; Wu, Z.; Xie, X.; Liu, G.; Fang, Y.; Wu, J.; Lin, J. Characterization of the interactions of ADAMTS13 CUB1 domain to WT- and GOF-Spacer domain by molecular dynamics simulation. J. Mol. Graph. Model. 2021, 109, 108029. [Google Scholar] [CrossRef] [PubMed]
  17. Banno, F.; Chauhan, A.K.; Kokame, K.; Yang, J.; Miyata, S.; Wagner, D.D.; Miyata, T. The distal carboxyl-terminal domains of ADAMTS13 are required for regulation of in vivo thrombus formation. Blood 2009, 113, 5323–5329. [Google Scholar] [CrossRef]
  18. Moal, I.H.; Chaleil, R.A.G.; Bates, P.A. Flexible Protein-Protein Docking with SwarmDock. Methods Mol. Biol. 2018, 1764, 413–428. [Google Scholar] [CrossRef]
  19. Fang, X.; Fang, Y.; Liu, L.; Liu, G.; Wu, J. Mapping paratope on antithrombotic antibody 6B4 to epitope on platelet glycoprotein Ibalpha via molecular dynamic simulations. PLoS ONE 2012, 7, e42263. [Google Scholar] [CrossRef] [PubMed]
  20. Velásquez Pereira, L.C.; Roose, E.; Graça, N.A.G.; Sinkovits, G.; Kangro, K.; Joly, B.S.; Tellier, E.; Kaplanski, G.; Falter, T.; Von Auer, C.; et al. Immunogenic hotspots in the spacer domain of ADAMTS13 in immune-mediated thrombotic thrombocytopenic purpura. J. Thromb Haemost. 2021, 19, 478–488. [Google Scholar] [CrossRef]
  21. Casina, V.; Hanby, H.; Lyalenko, A.; Zheng, X.L. Identification of a Novel Exosite (Glu634-Arg639) in the Spacer Domain of ADAMTS13 Required for Recognition of Von Willebrand Factor. Blood 2012, 120, 2214. [Google Scholar] [CrossRef]
  22. Kremer Hovinga, J.A.; Heeb, S.R.; Skowronska, M.; Schaller, M. Pathophysiology of thrombotic thrombocytopenic purpura and hemolytic uremic syndrome. J. Thromb. Haemost. 2018, 16, 618–629. [Google Scholar] [CrossRef] [Green Version]
  23. Bell, W.R.; Braine, H.G.; Ness, P.M.; Kickler, T.S. Improved Survival in Thrombotic Thrombocytopenic Purpura–Hemolytic Uremic Syndrome. N. Engl. J. Med. 1991, 325, 398–403. [Google Scholar] [CrossRef] [PubMed]
  24. Scully, M.; Knoebl, P.; Kentouche, K.; Rice, L.; Windyga, J.; Schneppenheim, R.; Hovinga, J.A.K.; Kajiwara, M.; Fujimura, Y.; Maggiore, C.; et al. Recombinant ADAMTS-13: First-in-human pharmacokinetics and safety in congenital thrombotic thrombocytopenic purpura. Blood 2017, 130, 2055–2063. [Google Scholar] [CrossRef]
  25. South, K.; Saleh, O.; Lemarchand, E.; Coutts, G.; Smith, C.J.; Schiessl, I.; Allan, S.M. Robust Thrombolytic and Anti-Inflammatory Action of a Constitutively Active ADAMTS13 Variant in Murine Stroke Models. Blood 2021. [Google Scholar] [CrossRef] [PubMed]
  26. Yu, S.; Liu, W.; Fang, J.; Shi, X.; Wu, J.; Fang, Y.; Lin, J. AFM Imaging Reveals Multiple Conformational States of ADAMTS13. J. Biol. Eng. 2019, 13, 9. [Google Scholar] [CrossRef] [Green Version]
  27. Kelley, L.A.; Mezulis, S.; Yates, C.M.; Wass, M.N.; Sternberg, M.J.E. The Phyre2 web portal for protein modeling, prediction and analysis. Nat. Protoc. 2015, 10, 845–858. [Google Scholar] [CrossRef] [Green Version]
  28. Darden, T.; York, D.M.; Pedersen, L.G. Particle mesh Ewald: An N⋅log(N) method for Ewald sums in large systems. J. Chem. Phys. 1993, 98, 10089–10092. [Google Scholar] [CrossRef] [Green Version]
  29. Sonne, J.; Jensen, M.; Hansen, F.Y.; Hemmingsen, L.; Peters, G.H. Reparameterization of All-Atom Dipalmitoylphosphatidylcholine Lipid Parameters Enables Simulation of Fluid Bilayers at Zero Tension. Biophys. J. 2007, 92, 4157–4167. [Google Scholar] [CrossRef] [PubMed] [Green Version]
  30. Wang, Y.; McCammon, J.A. Introduction to Molecular Dynamics: Theory and Applications in Biomolecular Modeling. In Computational Modeling of Biological Systems: From Molecules to Pathways; Dokholyan, N.V., Ed.; Springer: Boston, MA, USA, 2012; pp. 3–30. [Google Scholar]
  31. Jiang, X.; Sun, X.; Lin, J.; Ling, Y.; Fang, Y.; Wu, J. MD Simulations on a Well-Built Docking Model Reveal Fine Mechanical Stability and Force-Dependent Dissociation of Mac-1/GPIbα Complex. Front. Mol. Biosci. 2021, 8, 638396. [Google Scholar] [CrossRef] [PubMed]
  32. Zhang, Y.; Lin, Z.; Fang, Y.; Wu, J. Prediction of Catch-Slip Bond Transition of Kindlin2/β3 Integrin via Steered Molecular Dynamics Simulation. J. Chem. Inf. Model. 2020, 60, 5132–5141. [Google Scholar] [CrossRef] [PubMed]
Figure 1. The models of the TSP8 domain and the TSP8-Spacer complex. (A) The best model of TSP8 domain from the Phyre2, including three β-strands (yellow), three β-turns (cyan), and five loops (grey); (B) conformation of the TSP8 domain (left, green) interacting with the Spacer domain (right, blue) (PDB ID: 3GHM) in Model A. Exosite-3 (magenta) of the Spacer domain was illustrated.
Molecules 26 07525 g001
Figure 2. The structural stability of Model A was superior to that of Model B during the 20 ns equilibrium. (A) The time courses of Cα-RMSD for Model A and Model B; (B) the number of H-bonds (NHB) frequencies of the two models were fitted by Gaussian distribution; (C) plots of the mean interaction energy (E) of two models; (D) plots of the average SASA on the interface of two models. Data were presented as mean ± SEM. Differences on the interaction energy and average SASA of two models were analyzed with Student’s t-test (ns indicates not significant, **** indicates p < 0.0001, n = 20).
Molecules 26 07525 g002
Figure 3. Three FMD simulations of the WT TSP8-Spacer complex. (A) Variation of Cα-RMSD of WT1 (blue), WT2 (magenta), and WT3 (green) with time. The Cα-RMSD value fluctuated mildly when the time exceeded 30 ns; (B) Gaussian fitting of the NHB frequencies of three complexes (R2 > 0.99). The heat maps of average survival ratios of H-bonds (C) and salt bridges (D) on the interface of the TSP8-Spacer complex. * Indicates residues in exosite-3 of the Spacer domain, and # indicates residues in exosite-4 of the Spacer domain.
Molecules 26 07525 g003
Figure 4. Cartoon representations of the 3D structure of WT TSP8-Spacer complex. Exosite-4 (pink) and exosite-3 (violet), both located at the distal end of the Spacer domain, are critical in stabilizing the complex. The detailed interactions between the TSP8 domain (green) and exosite-4 (inset A) or exosite-3 (inset B) are displayed here. We present all residues involved in these interactions, and the H-bonds (red dashed lines) and salt bridges (blue dashed lines) with an average survival ratio over 0.3.
Molecules 26 07525 g004
Figure 5. Three FMD simulations of the GoF complex. (A) Variation of Cα-RMSD with time for GoF1 (blue), GoF2 (magenta), and GoF3 (green). The Cα-RMSD fluctuated smoothly in a range of 1 Å when the time exceeded 30 ns; (B) Gaussian fitting of the NHB frequencies of three GoF complexes (R2 > 0.98). The heat maps of the survival ratios of H-bonds (C) and (D) salt bridges on the interface of the GoF complex. * Indicates residues in exosite-3 of the Spacer domain, and # indicates residues in exosite-4 of the Spacer domain.
Molecules 26 07525 g005
Figure 6. Three FMD simulations of the Mut complex. (A) Variation of Cα-RMSD with time for Mut1 (blue), Mut2 (magenta), and Mut3 (green). The Cα-RMSD fluctuated in a range of 1 Å when the time exceeded 20 ns. (B) Frequencies of the NHB for three Mut complexes. The NHB of the Mut1, Mut2 and Mut3 were fitted by Gaussian distribution (R2 > 0.98). (C) The heat maps of the average survival ratios of H-bonds on the interface of the Mut complex.
Molecules 26 07525 g006
Figure 7. Comparisons of the WT, GoF, and Mut complexes. (A) The mean NHB, (B) the mean E, and (C) the average SASA across the interface of the WT (blue), GoF (magenta), and Mut (green) complexes. One-way ANOVA with a Bonferroni post hoc test was used to analyze the difference (**** indicates p < 0.0001, n = 3).
Molecules 26 07525 g007
Figure 8. Workflow diagram of the simulation process.
Molecules 26 07525 g008
Table 1. Residue interactions on the static interface of Model A and B.
ModelH-BondSalt Bridge
TSP8SpacerTSP8Spacer
Model AVAL1078GLU634ARG1075GLU634
GLY1089*ARG568ASP1090*ARG568
ASP1090*ARG660ARG1095ASP635
ARG1094*TYR665--
ARG1095ASP635--
LYS1118HIS588--
ARG1123ARG636--
Model BCYS1072*ARG568--
TYR1074*ARG660--
GLN1103ARG636--
ALA1104*PHE592--
PRO1109*ARG660--
* Indicates residues in exosite-3 of the Spacer domain.
Table 2. Residue interactions on the interface of Model A and Model B at equilibrium.
ModelTSP8SpacerSurvival Ratio
H-BondSalt Bridge
Model AARG1095ASP6350.9710.988
ASP1090*TYR6610.228-
ASP1090*ARG6600.6370.587
ASP1090*ARG5680.5870.381
LYS1118ASP6720.180-
SER1085*TYR6650.165-
ARG1075GLU6340.8080.706
Model BASP1111*ARG5680.212-
THR1098ARG6360.188-
ARG1096ASP6350.5080.218
* Indicates residues in exosite-3 of the Spacer domain.
Table 3. The H-bonds on the interface of the WT TSP8-Spacer complex with an average survival ratio >10%.
RankingTSP8SpacerSurvival RatioAverage
WT 1WT 2WT 3(Mean ± SEM)
1ARG1075#ASP6350.6520.9110.8830.815 ± 0.067
2ARG1095#ASP6350.8430.9300.0000.591 ± 0.242
3CYS1130#ARG6360.0510.4230.6810.385 ± 0.149
4ASP1090*ARG6600.0000.9380.0000.313 ± 0.255
5ARG1095#GLU6340.0000.0000.9150.305 ± 0.249
6CYS1125*TYR6610.7180.1610.0000.293 ± 0.178
7ASP1090*ARG5680.4460.3360.0000.261 ± 0.109
8CYS1125*ARG6600.0000.7540.0000.251 ± 0.205
9ASP1090*TYR6610.0000.7030.0000.234 ± 0.191
10CYS1130*ARG6600.0000.0000.6460.215 ± 0.176
11ASP1090*TYR6650.4660.0000.0000.155 ± 0.127
12ARG1075#GLU6340.2850.0970.0000.127 ± 0.068
13CYS1084*TYR6650.3650.0000.0000.122 ± 0.099
14GLY1091*TYR6650.3530.0000.0000.118 ± 0.096
15HIS1115#ARG6390.3500.0000.0000.117 ± 0.095
16CYS1130*TYR6650.0000.3140.0000.105 ± 0.085
* Indicates residues in exosite-3 of the Spacer domain, and # indicates residues in exosite-4 of the Spacer domain.
Table 4. The salt bridges on the interface of the WT TSP8-Spacer complex with an average survival ratio >10%.
RankingTSP8SpacerSurvival RatioAverage
WT 1WT 2WT 3(Mean ± SEM)
1ARG1075#ASP6350.5600.9850.9430.829 ± 0.110
2ARG1095#ASP6350.7160.9930.0000.569 ± 0.241
3ARG1095#GLU6340.0000.0000.9890.330 ± 0.269
4ASP1090*ARG6600.0000.9600.0000.320 ± 0.261
* Indicates residues in exosite-3 of the Spacer domain, and # indicates residues in exosite-4 of the Spacer domain.
Table 5. The H-bonds on the interface of the GoF complex with an average survival ratio >10%.
RankingTSP8SpacerSurvival RatioAverage
GoF 1GoF 2GoF 3(Mean ± SEM)
1ARG1075#ASP6350.9920.8930.6210.835 ± 0.091
2ARG1095#ASP6350.8440.0000.9100.585 ± 0.239
3ARG1075#GLU6340.6680.4140.1370.406 ± 0.125
4CYS1130#ARG6360.9870.0790.0000.356 ± 0.259
5ARG1123#ASP6350.0000.0000.7710.257 ± 0.210
6TRP1081#ASP6350.6180.0000.0000.206 ± 0.168
7VAL1120*TYR5920.0000.0000.3860.129 ± 0.105
8ALA1127HSD5940.0000.3040.0000.101 ± 0.083
* Indicates residues in exosite-3 of the Spacer domain, and # indicates residues in exosite-4 of the Spacer domain.
Table 6. The salt bridges on the interface of the GoF complex with an average survival ratio >10%.
RankingTSP8SpacerSurvival RatioAverage
GoF 1GoF 2GoF 3(Mean ± SEM)
1ARG1075#ASP6350.6660.9500.4500.689 ± 0.118
2ARG1075#GLU6340.0000.0000.8580.286 ± 0.233
3ASP1090*LYS6600.0000.5000.0000.167 ± 0.136
4ASP1090*LYS5680.0000.4670.0000.156 ± 0.127
* Indicates residues in exosite-3 of the Spacer domain, and # indicates residues in exosite-4 of the Spacer domain.
Table 7. The H-bonds on the interface of the Mut complex with an average survival ratio >10%.
RankingTSP8SpacerSurvival RatioAverage
Mut 1Mut 2Mut 3(Mean ± SEM)
1GLY1128SER6120.9000.0000.0000.300 ± 0.212
2CYS1125LEU5910.0000.7180.0000.239 ± 0.169
3ALA1090*TYR6610.1010.4130.0680.194 ± 0.078
4GLY1124LEU5910.5460.0000.0000.182 ± 0.129
5CYS1125*TYR6610.4920.0000.0000.164 ± 0.116
* Indicates residues in exosite-3 of the Spacer domain.
Publisher’s Note: MDPI stays neutral with regard to jurisdictional claims in published maps and institutional affiliations.

