
Validation of the Developed Zero-Order Infrared Spectrophotometry Method for Qualitative and Quantitative Analyses of Tranexamic Acid in Marketed Tablets

 ,
, 
Abstract
1. Introduction
2. Results
2.1. Preliminary Study of Infrared Spectrophotometry
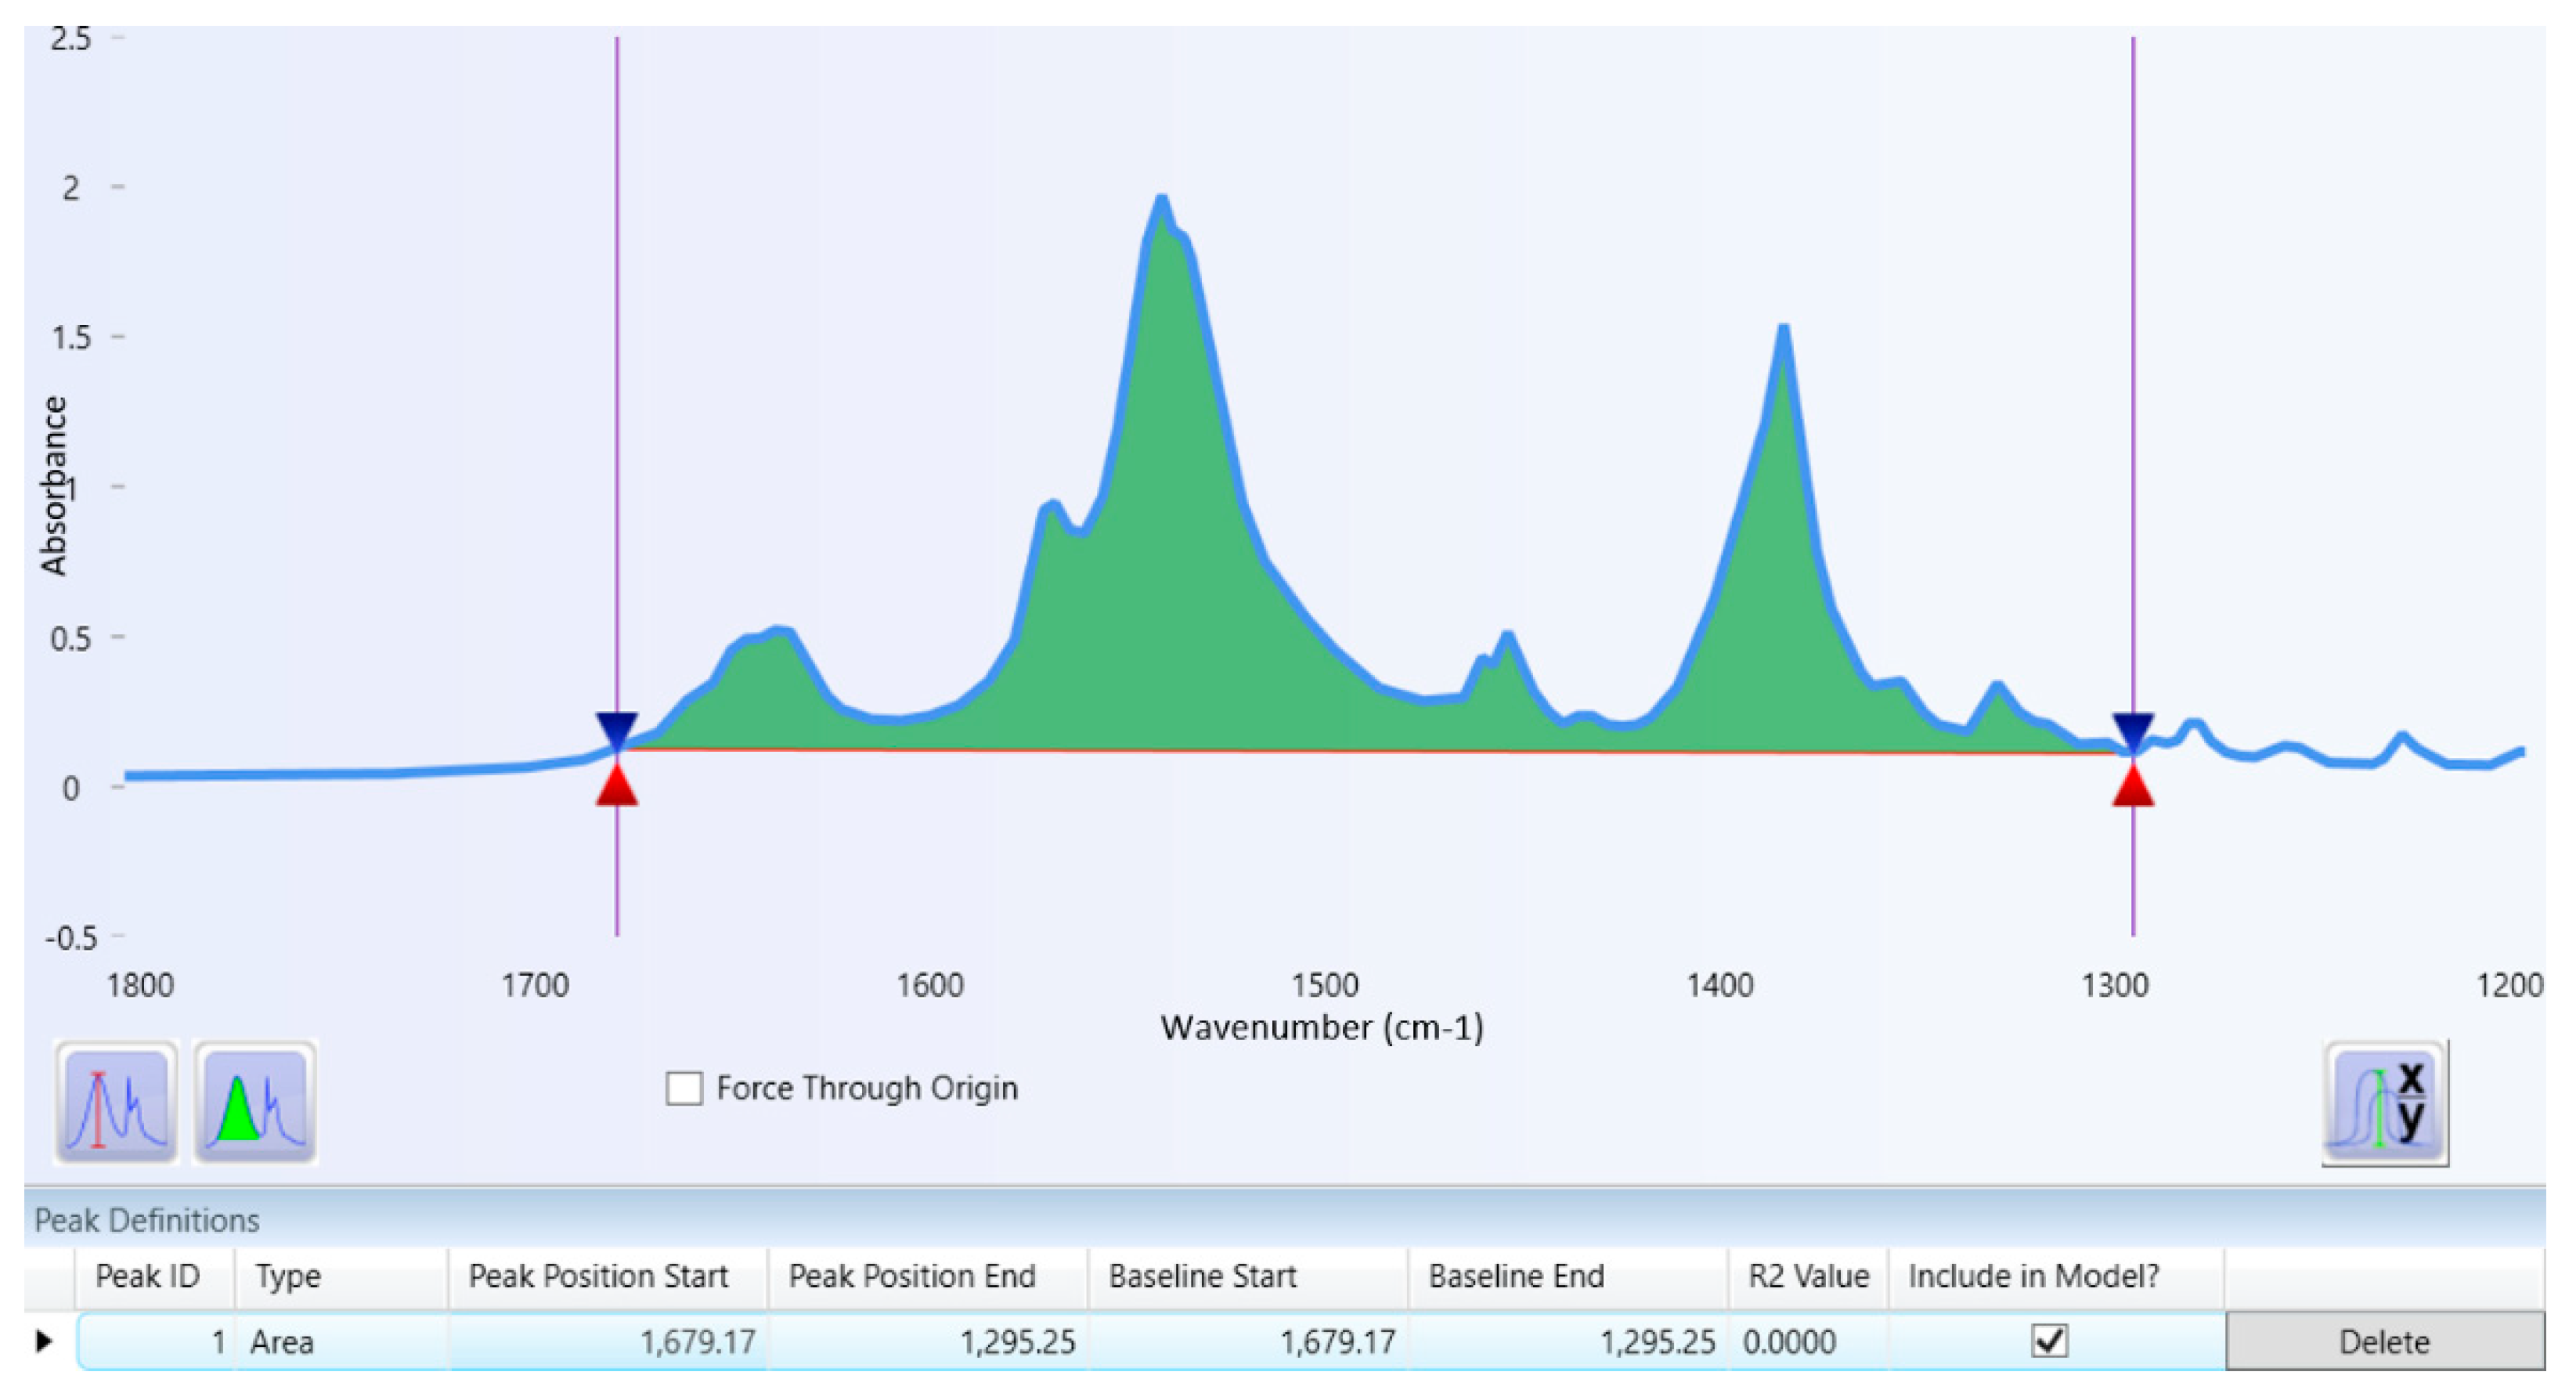
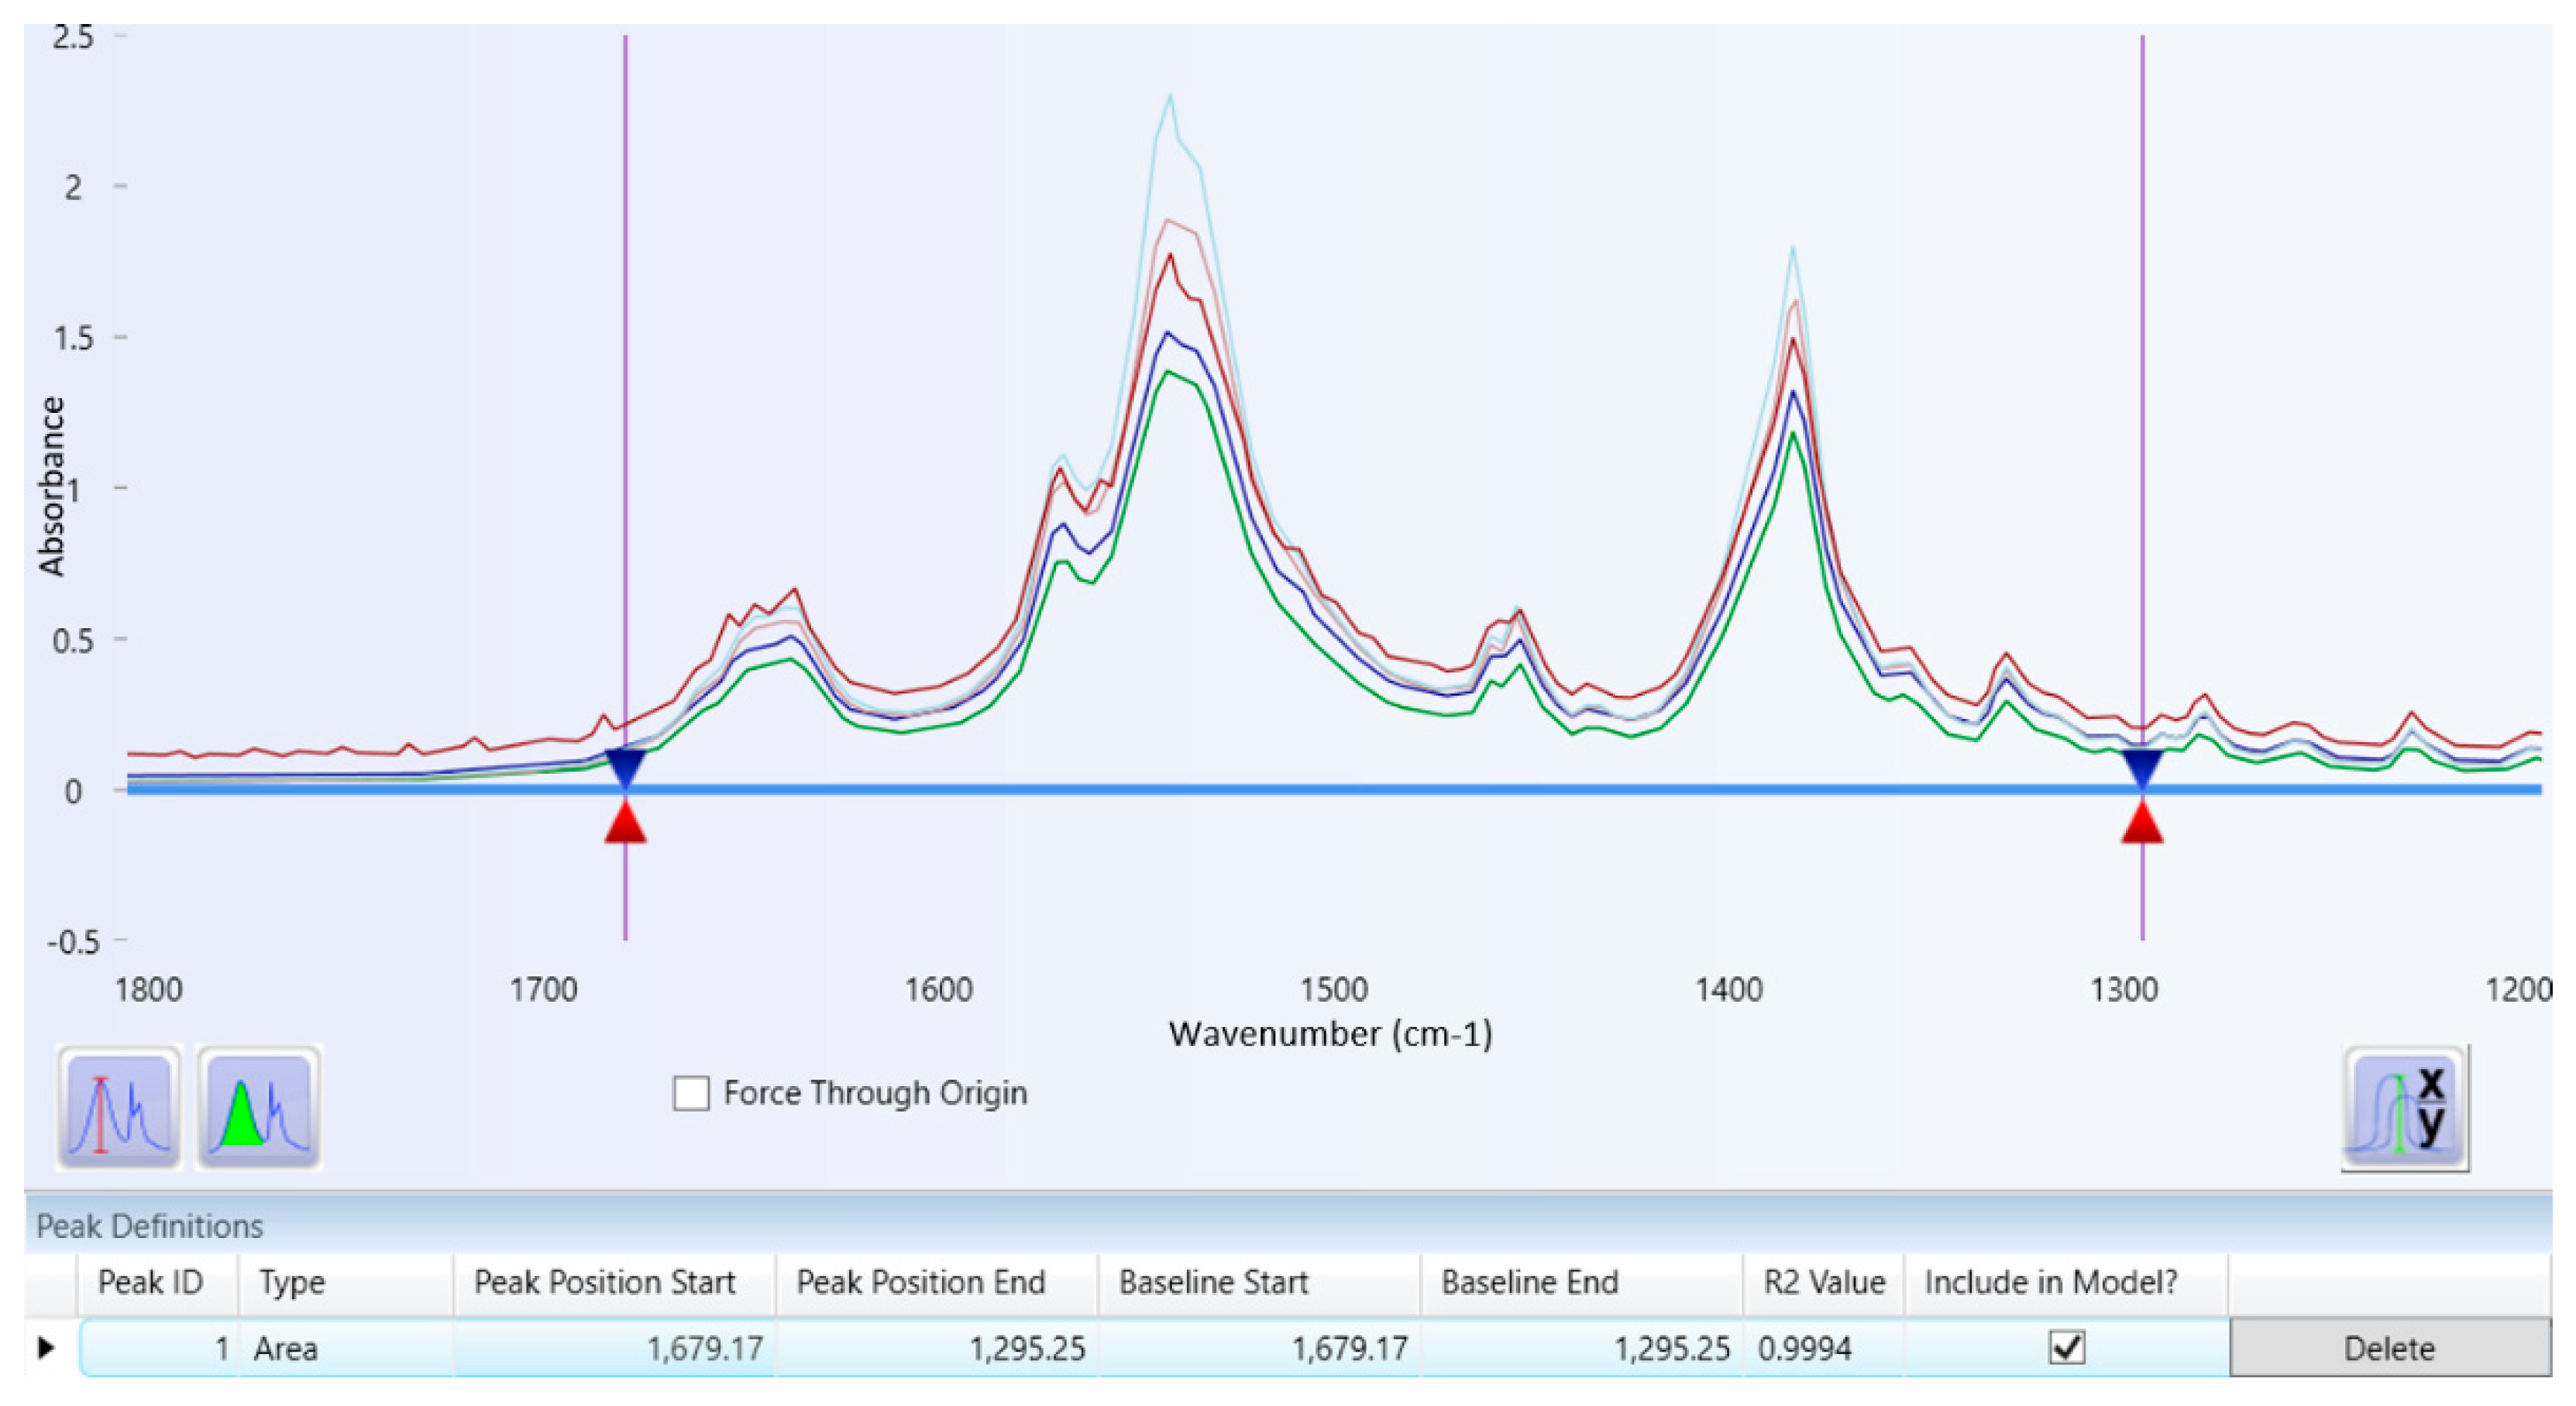
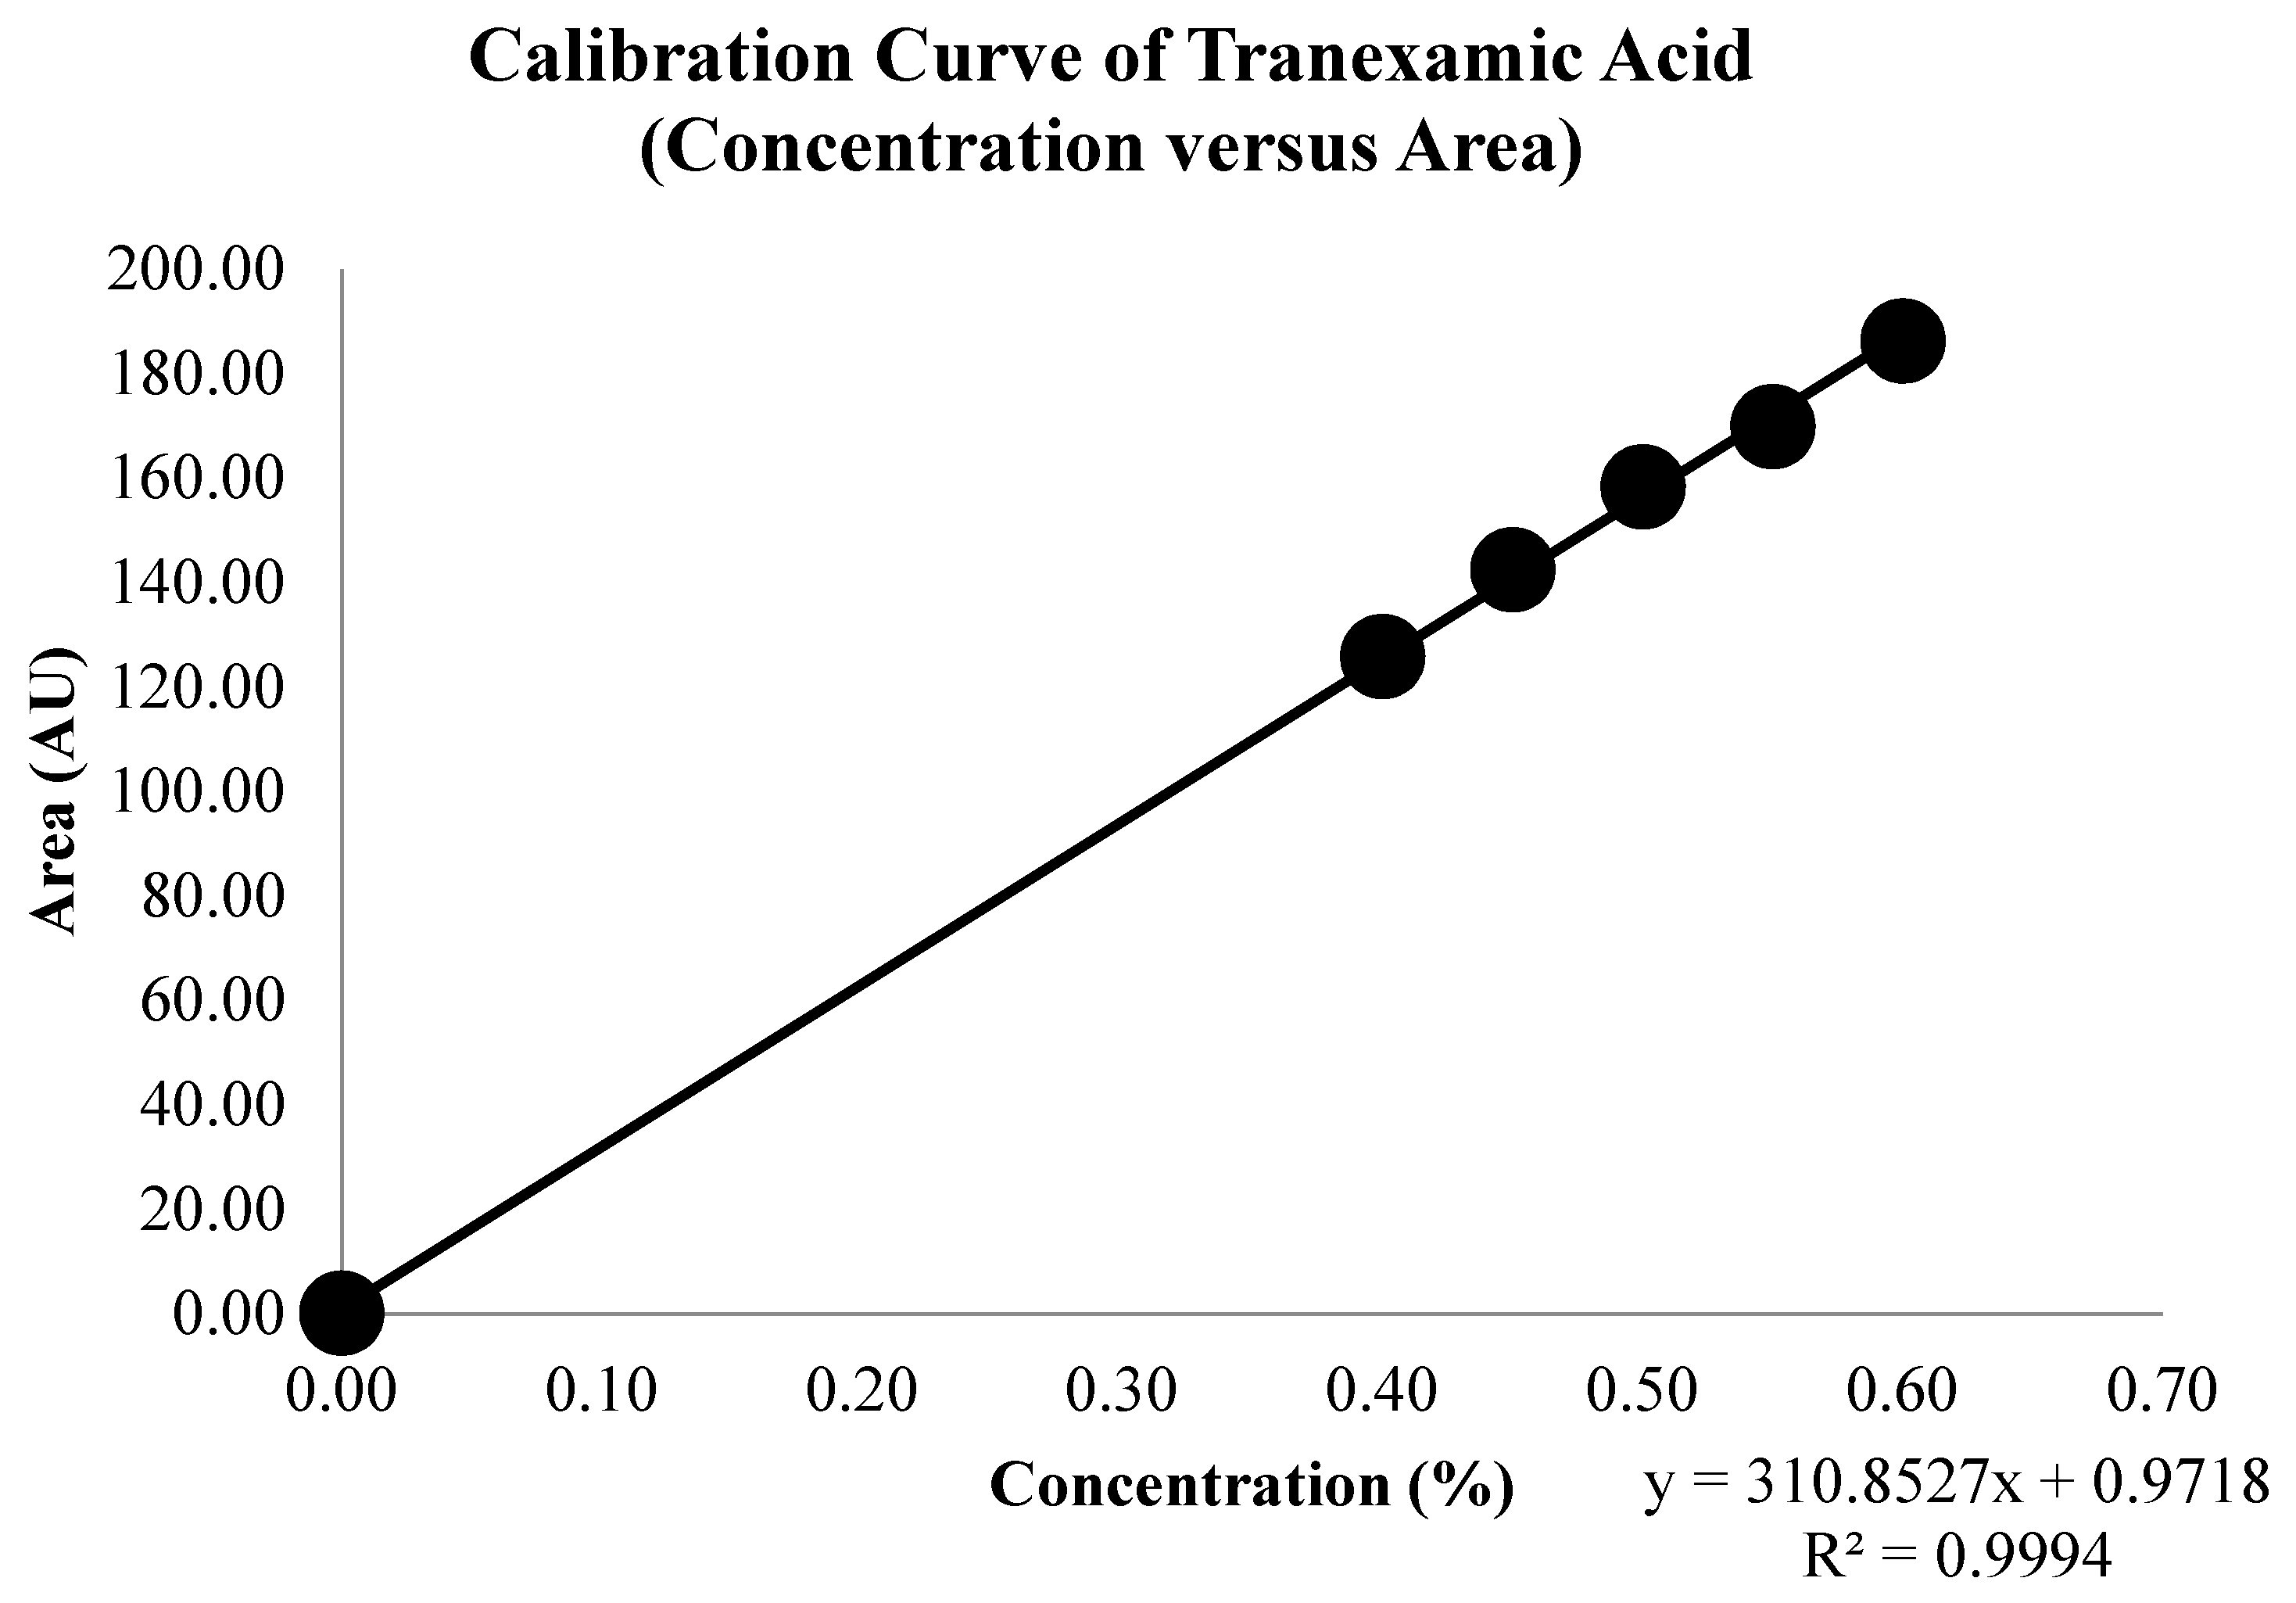
2.2. Regression of Tranexamic Acid
2.3. Analysis of Tranexamic Acid in Marketed Tablets
3. Discussion
3.1. Preliminary Study of Infrared Spectrophotometry
3.2. Regression of Tranexamic Acid
3.3. Analysis of Tranexamic Acid in Marketed Tablets
3.4. Validation of the Infrared Spectrophotometry Method
4. Materials and Methods
4.1. Tools and Materials
4.2. Preliminary Study of Infrared Spectrophotometry
4.3. Regression of the Tranexamic Acid Standard
4.4. Analysis of Tranexamic Acid in Marketed Tablets
4.5. Validation of the Infrared Spectrophotometry Method
5. Conclusions
Author Contributions
Funding
Institutional Review Board Statement
Informed Consent Statement
Data Availability Statement
Acknowledgments
Conflicts of Interest
Sample Availability
References
- Marinho, D.S. Perioperative hyperfibrinolysis—Physiology and pathophysiology. Braz. J. Anesthesiol. 2021, 71, 65–75. [Google Scholar] [CrossRef] [PubMed]
- Lichota, A.; Szewczyk, E.M.; Gwozdzinski, K. Factors affecting the formation and treatment of thrombosis by natural and synthetic compounds. Int. J. Mol. Sci. 2020, 21, 7975. [Google Scholar] [CrossRef] [PubMed]
- Gale, A.J. Continuing education course #2: Current understanding of hemostasis. Toxicol. Pathol. 2011, 39, 273–280. [Google Scholar] [CrossRef]
- Scarafoni, E.E. A systematic review of tranexamic acid in plastic surgery: What’s new? Plast. Reconstr. Surg.—Glob. Open 2021, 9, 3172. [Google Scholar] [CrossRef]
- Joseph, J.; Martinez-Devesa, P.; Bellorini, J.; Burton, M.J. Tranexamic acid for patients with nasal haemorrhage (epistaxis). Cochrane Database Syst. Rev. 2018, 12, CD004328. [Google Scholar] [CrossRef] [PubMed]
- Pabinger, I.; Fries, D.; Schöchl, H.; Streif, W.; Toller, W. Tranexamic acid for treatment and prophylaxis of bleeding and hyperfibrinolysis. Wien. Klin. Wochenschr. 2017, 129, 303–316. [Google Scholar] [CrossRef] [PubMed]
- Soundarya, S.; Srinivasan, M.S. Tranexamic acid in dermatology. Ann. Trop. Med. Public Health 2020, 23, 231–509. [Google Scholar] [CrossRef]
- Menditto, E.; Orlando, V.; de Rosa, G.; Minghetti, P.; Musazzi, U.; Cahir, C.; Kurczewska-Michalak, M.; Kardas, P.; Costa, E.; Lobo, J.S.; et al. Patient centric pharmaceutical drug product design—The impact on medication adherence. Pharmaceutics 2020, 12, 44. [Google Scholar] [CrossRef] [PubMed]
- Prakash, G.; Chandra, S.A.; Sandhya, P.; Bidur, C.; Samir, D. Pharmacopoeial comparison of in-process and finished product quality control test for pharmaceutical tablets. GSC Biol. Pharm. Sci. 2020, 11, 155–165. [Google Scholar] [CrossRef]
- Gadkariem, E.A.; Mohamed, M.A.; Jabbir, M.A. Spectrophotometry method for the determination of tranexamic acid in bulk and dosage forms. World Appl. Sci. J. 2012, 19, 1263–1267. [Google Scholar]
- Nugrahani, I.; Aulia, W.N. The performance of derivate FTIR spectrophotometry method compared to colorimetry for tranexamic acid tablet content determination. Pharmaciana 2018, 8, 11–24. [Google Scholar] [CrossRef][Green Version]
- Ashfaq, M.; Aslam, A.; Mustafa, G.; Danish, M.; Nazar, M.F.; Asghar, M.N. Derivatization/chromophore introduction of tranexamic acid and its HPLC determination in pharmaceutical formulations. J. Assoc. Arab. Univ. Basic Sci. 2015, 17, 51–56. [Google Scholar] [CrossRef]
- Delyle, S.G.; Abe, E.; Batisse, A.; Tremey, B.; Fischler, M.; Devillier, P.; Alvarez, J.C. A validated assay for the quantitative analysis of tranexamic acid in human serum by liquid chromatography coupled with electrospray ionisation mass spectrometry. Clin. Chim. Acta 2010, 411, 438–443. [Google Scholar] [CrossRef]
- Patil, K.R.; Rane, V.P.; Sangshetti, J.N.; Shinde, D.B. Assay determination of tranexamic acid in pharmaceutical dosage form (tablet) using HPLC and ELS detector. Eurasian J. Anal. Chem. 2010, 5, 204–211. [Google Scholar]
- Patil, R.; Ahmed, A.K.L.; Firke, S.; Pawar, D. RP-HPLC PDA analysis of tranexamic acid in bulk and tablet dosage form. Anal. Chem. Lett. 2017, 7, 813–821. [Google Scholar] [CrossRef]
- Sher, N.; Fatima, N.; Perveen, S.; Siddiqui, F.A.; Sial, A.W. Pregabalin and tranexamic acid evaluation by two simple and sensitive spectrophotometric methods. Int. J. Anal. Chem. 2015, 2015, 241412. [Google Scholar] [CrossRef] [PubMed]
- Md Noh, M.F.; Gunasegavan, R.D.N.; Khalid, N.M.; Balasubramaniam, V.; Mustar, S.; Abd Rashed, A. Recent techniques in nutrient analysis for food composition database. Molecules 2020, 25, 4567. [Google Scholar] [CrossRef] [PubMed]
- Ker, K.; Roberts, I.; Chaudhri, R.; Fawole, B.; Beaumont, D.; Balogun, E.; Prowse, D.; Pepple, T.; Javaid, K.; Kayani, A.; et al. WOMAN-2 trial collaborators. Tranexamic acid for the prevention of postpartum bleeding in women with anaemia: Study protocol for an international, randomised, double-blind, placebo-controlled trial. Trials 2018, 19, 712. [Google Scholar] [CrossRef] [PubMed]
- Sentilhes, L.; Senat, M.V.; le Lous, M.; Winer, N.; Rozenberg, P.; Kayem, G.; Verspyck, E.; Fuchs, F.; Azria, E.; Gallot, D.; et al. Tranexamic Acid for the Prevention of Blood Loss after Cesarean Delivery. N. Engl. J. Med. 2021, 384, 1623–1634. [Google Scholar] [CrossRef]
- Hu, C.; Zhang, Y.; Zhou, Y.; Liu, Z.; Meng, Q.; Feng, X. A review of pretreatment and analysis of macrolides in food (Update Since 2010). J. Chromatogr. A 2020, 1634, 461662. [Google Scholar] [CrossRef] [PubMed]
- Chen, Y.; Zou, C.; Mastalerz, M.; Hu, S.; Gasaway, C.; Tao, X. Applications of micro-fourier transform infrared spectroscopy (FTIR) in the geological sciences—A review. Int. J. Mol. Sci. 2015, 16, 30223–30250. [Google Scholar] [CrossRef]
- Nugrahani, I.; Musaddah, M. Development and validation analysis of acyclovir tablet content determination method using FTIR. Int. J. Appl. Pharm. 2016, 8, 43–47. [Google Scholar]
- Güzel, B.; Canli, O. Method validation and measurement uncertainty of possible thirty volatile organic compounds (VOCs) presented in the polyethylene present in bottled drinking waters sold in Turkey. J. Anal. Sci. Technol. 2020, 11, 44. [Google Scholar] [CrossRef]
- Saini, S.; Mandal, S.; Agarwal, D. Simultaneous estimation of admixture drugs by RP-HPLC: A Review. Asian J. Pharm. Res. Dev. 2020, 8, 180–185. [Google Scholar]
- Shaikh, T.; Nafady, A.; Talpur, F.N.; Sirajuddin; Agheem, M.H.; Shah, M.R.; Sherazi, S.T.H.; Soomro, R.A.; Siddiqui, S. Tranexamic acid derived gold nanoparticles modified glassy carbon electrode as sensitive sensor for determination of nalbuphine. Sens. Actuators B Chem. 2015, 211, 359–369. [Google Scholar] [CrossRef]
- Fahmi, Z.; Mudasir, M.; Rohman, A. Attenuated total reflectance-FTIR Spectra combined with multivariate calibration and discrimination analysis for analysis of patchouli oil adulteration. Indones. J. Chem. 2020, 20, 1–8. [Google Scholar] [CrossRef]
- Nandiyanto, A.B.D.; Oktiani, R.; Ragadhita, R. How to read and interpret ftir spectroscope of organic material. Indones. J. Sci. Technol. 2019, 4, 97–118. [Google Scholar] [CrossRef]
- Yan, Y.; Yang, Y.; Ran, M.; Zhou, X.; Zou, L.; Guo, M. Application of infrared spectroscopy in prediction of asphalt aging time history and fatigue life. Coatings 2020, 10, 959. [Google Scholar] [CrossRef]
- Fanelli, S.; Zimmermann, A.; Totóli, E.G.; Salgado, H.R.N. FTIR spectrophotometry as a green tool for quantitative analysis of drugs: Practical application to amoxicillin. J. Chem. 2018, 2018, 3920810. [Google Scholar] [CrossRef]
- Socaciu, C.; Fetea, F.; Ranga, F.; Bunea, A.; Dulf, F.; Socaci, S.; Pintea, A. Attenuated total reflectance-fourier transform infrared spectroscopy (ATR-FTIR) coupled with chemometrics, to control the botanical authenticity and quality of cold-pressed functional oils commercialised in Romania. Appl. Sci. 2020, 10, 8695. [Google Scholar] [CrossRef]
- Hackshaw, K.V.; Miller, J.S.; Aykas, D.P.; Rodriguez-Saona, L. Vibrational spectroscopy for identification of metabolites in biologic samples. Molecules 2020, 25, 4725. [Google Scholar] [CrossRef]
- Almond, J.; Sugumaar, P.; Wenzel, M.N.; Hill, G.; Wallis, C. Determination of the carbonyl index of polyethylene and polypropylene using specified area under band methodology with ATR-FTIR spectroscopy. e-Polymers 2020, 20, 369–381. [Google Scholar] [CrossRef]
- Fritzsche, A.; Ritschel, T.; Schneider, L.; Totsche, K.U. Identification and quantification of single constituents in groundwater with Fourier-transform infrared spectroscopy and Positive Matrix Factorization. Vib. Spectrosc. 2019, 100, 152–158. [Google Scholar] [CrossRef]
- Sonawane, S.S.; Chhajed, S.S.; Attar, S.S.; Kshirsagar, S.J. An approach to select linear regression model in bioanalytical method validation. J. Anal. Sci. Technol. 2019, 10, 1. [Google Scholar] [CrossRef]
- Akhgar, C.K.; Ramer, G.; Żbik, M.; Trajnerowicz, A.; Pawluczyk, J.; Schwaighofer, A.; Lendl, B. The next generation of IR spectroscopy: EC-QCL-based Mid-IR transmission spectroscopy of proteins with balanced detection. Anal. Chem. 2020, 92, 9901–9907. [Google Scholar] [CrossRef]
- Cowger, W.; Gray, A.; Christiansen, S.H.; DeFrond, H.; Deshpande, A.D.; Hemabessiere, L.; Lee, E.; Mill, L.; Munno, K.; Ossmann, B.E.; et al. Critical review of processing and classification techniques for images and spectra in microplastic research. Appl. Spectrosc. 2020, 74, 989–1010. [Google Scholar] [CrossRef] [PubMed]
- Yapar, E.A.; Özdemirhan, M.E. An overview on pharmacopoeias in the world and monograph elaboration techniques. Univers. J. Pharm. Res. 2020, 5, 57–64. [Google Scholar] [CrossRef]
- Directorate General of the Pharmaceuticals and Medical Devices. Indonesian Pharmacopoeia—Issue 6; Health Ministry of the Republic of Indonesia: Jakarta, Indonesia, 2020.
- Belouafa, S.; Habti, F.; Benhar, S.; Belafkih, B.; Tayane, S.; Hamdouch, S.; Bennamara, A.; Abourriche, A. Statistical tools and approaches to validate analytical methods: Methodology and practical examples. Int. J. Metrol. Qual. Eng. 2017, 8, 9. [Google Scholar] [CrossRef]
- Marson, B.; Concentino, V.; Junkert, A.; Fachi, M.; Vilhena, R.; Pontarolo, R. Validation of analytical methods in a pharmaceutical quality system—An overview focused on HPLC methods. Química Nova 2020, 43, 1190–1203. [Google Scholar] [CrossRef]
- Gavali, K.V.; Shaikh, A.A.; Tamboli, A.M.; Khan, N.I. Development and validation of UV method for the simultaneous estimation of racecadotril and ofloxacin in bulk drugs and marketed formulation. World J. Pharm. Res. 2020, 1, 792–802. [Google Scholar] [CrossRef]
- Aasodi, R.R.; Murugan, V.; Premakumari, K.B. Application of total error concept in the analytical method validation for the assay of essential amino acids by precolumn derivatization. J. Appl. Pharm. Sci. 2020, 10, 31–42. [Google Scholar] [CrossRef]
- Jampilek, J.; Dolowy, M.; Pyka-Pajak, A. Estimating limits of detection and quantification of ibuprofen by TLC-Densitometry at different chromatographic conditions. Processes 2020, 8, 919. [Google Scholar] [CrossRef]
- Stoilova, N.; Boneva, I.; Yaneva, S. Development and validation of analytical methods for monitoring program for control of residues of pharmacologically active substances in tissues with animal origin. Pharma Innov. 2020, 9, 29–35. [Google Scholar]
- Ekasari, W.; Widiyastuti, Y.; Subositi, D.; Hamsidi, R.; Widyawaruyanti, A.; Basuki, S.; Setyawan, D. Determination of cassiarin a level of Cassia siamea leaf obtained from various regions in Indonesia using the TLC-densitometry method. Sci. World J. 2020, 2020, 7367836. [Google Scholar] [CrossRef]
- Lavanya, C.G.; Ravisankar, P.; Akhil, K.G.; Mounika, K.; Srinivasa, B.P. Analytical method validation parameters—An updated review. Int. J. Pharm. Sci. Rev. Res. 2020, 61, 1–7. [Google Scholar]
- Bui, V.T.; Doan, C.S.; Tong, T.T.V.; Le, D.C. Development and validation of a simple, green infrared spectroscopic method for quantitation of sildenafil citrate in siloflam tablets of unknown manufacturing formula. J. Anal. Methods Chem. 2021, 2021, 6616728. [Google Scholar] [CrossRef]
- Kotadiya, M.; Khristi, A. Quantitative determination and validation of teneligliptine hydrobromide hydrate using FTIR spectroscopy. J. Chem. Pharm. Res. 2017, 9, 109–114. [Google Scholar]
- Singh, A.; Baghel, U.S.; Sinha, M.; Ashawat, M.S. Quantitative analysis of rosuvastatin calcium in bulk and solid pharmaceutical dosage forms using green and rapid fourier-transform infrared spectroscopic method. Indian J. Pharm. Sci. 2020, 82, 632–639. [Google Scholar] [CrossRef]
- Sheeja, V.K.; Swapna, A.S. Method development and validation for the simultaneous estimation of clonazepam and paroxetine in combined dosage form using FT-IR. Asian J. Res. Chem. 2020, 13, 12–14. [Google Scholar] [CrossRef]
- Judeh, A.A.; Sarief, A.; Umar, Y.; Ashwaq, O.; Haque, S.M. Development, computational studies and validation of spectrophotometric method of metformin hydrochloride in pharmaceutical formulations. J. Chil. Chem. Soc. 2020, 65, 4895–4899. [Google Scholar] [CrossRef]
- Naz, A.; Tabish, I.; Naseer, A.; Siddiqi, A.Z.; Siddiqui, F.A.; Mirza, A.Z. Green chemistry approach: Method development and validation for identification and quantification of entecavir using FT-IR in bulk and pharmaceutical dosage form. Future J. Pharm. Sci. 2021, 7, 75. [Google Scholar] [CrossRef]
- Chikanbanjar, N.; Semwal, N.U.J. A review article on analytical method validation. J. Pharm. Innov. 2020, 1, 48–58. [Google Scholar]
- Almeida, J.; Bezerra, M.; Markl, D.; Berghaus, A.; Borman, P.; Schlindwein, W. Development and validation of an in-line API quantification method using AQbD principles based on UV-Vis spectroscopy to monitor and optimise continuous hot melt extrusion process. Pharmaceutics 2020, 12, 150. [Google Scholar] [CrossRef] [PubMed]


| Method | Detector | Treatment |
|---|---|---|
| Spectrophotometry | Ultraviolet Visible [10] | 2,6-Dichloroquinone-4-Chlorimide [10] |
| Infrared [11] | First Order [11] | |
| High-Performance Liquid Chromatography | Mass Spectrophotometry [13] | [13] |
| Evaporative Light Scattering [14] | [14] | |
| Ultraviolet-Visible Detector [12] | Benzene Sulfonyl Chloride [12] | |
| Photo Diode Array [15] | [15] |
| Obtained Wavenumber | Reference Wavenumber | Functional Group/Fingerprint |
|---|---|---|
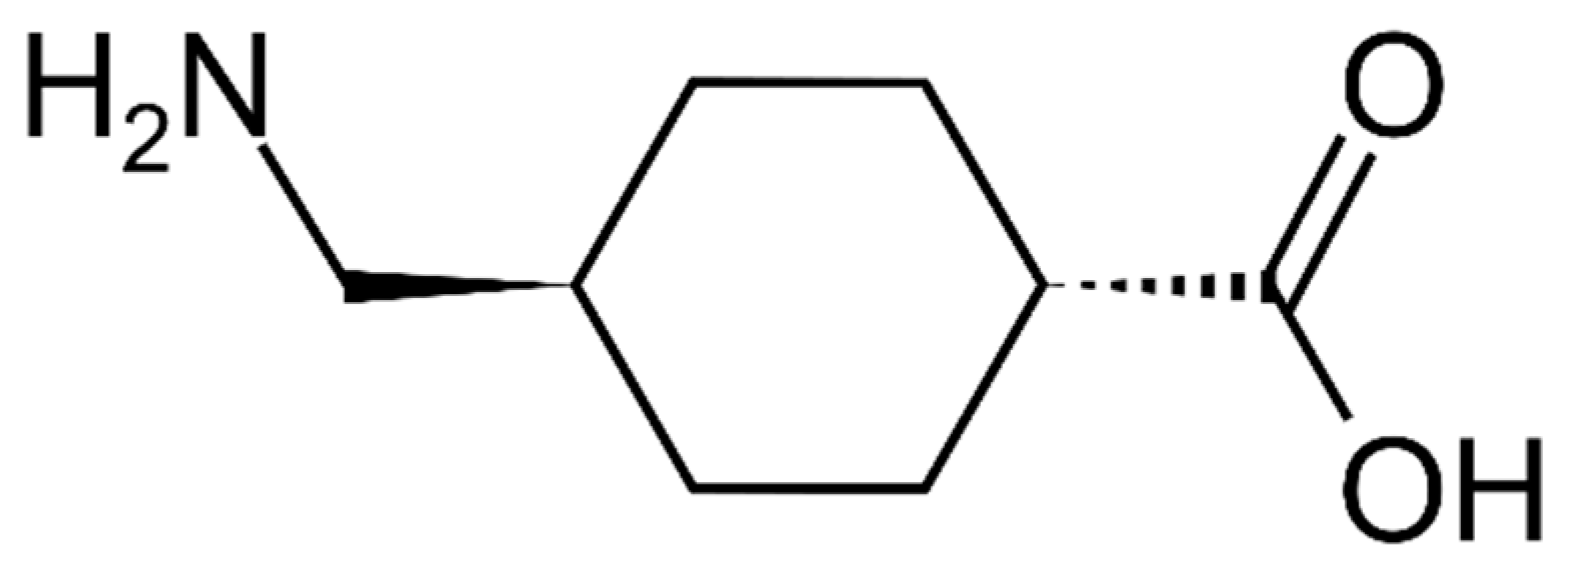
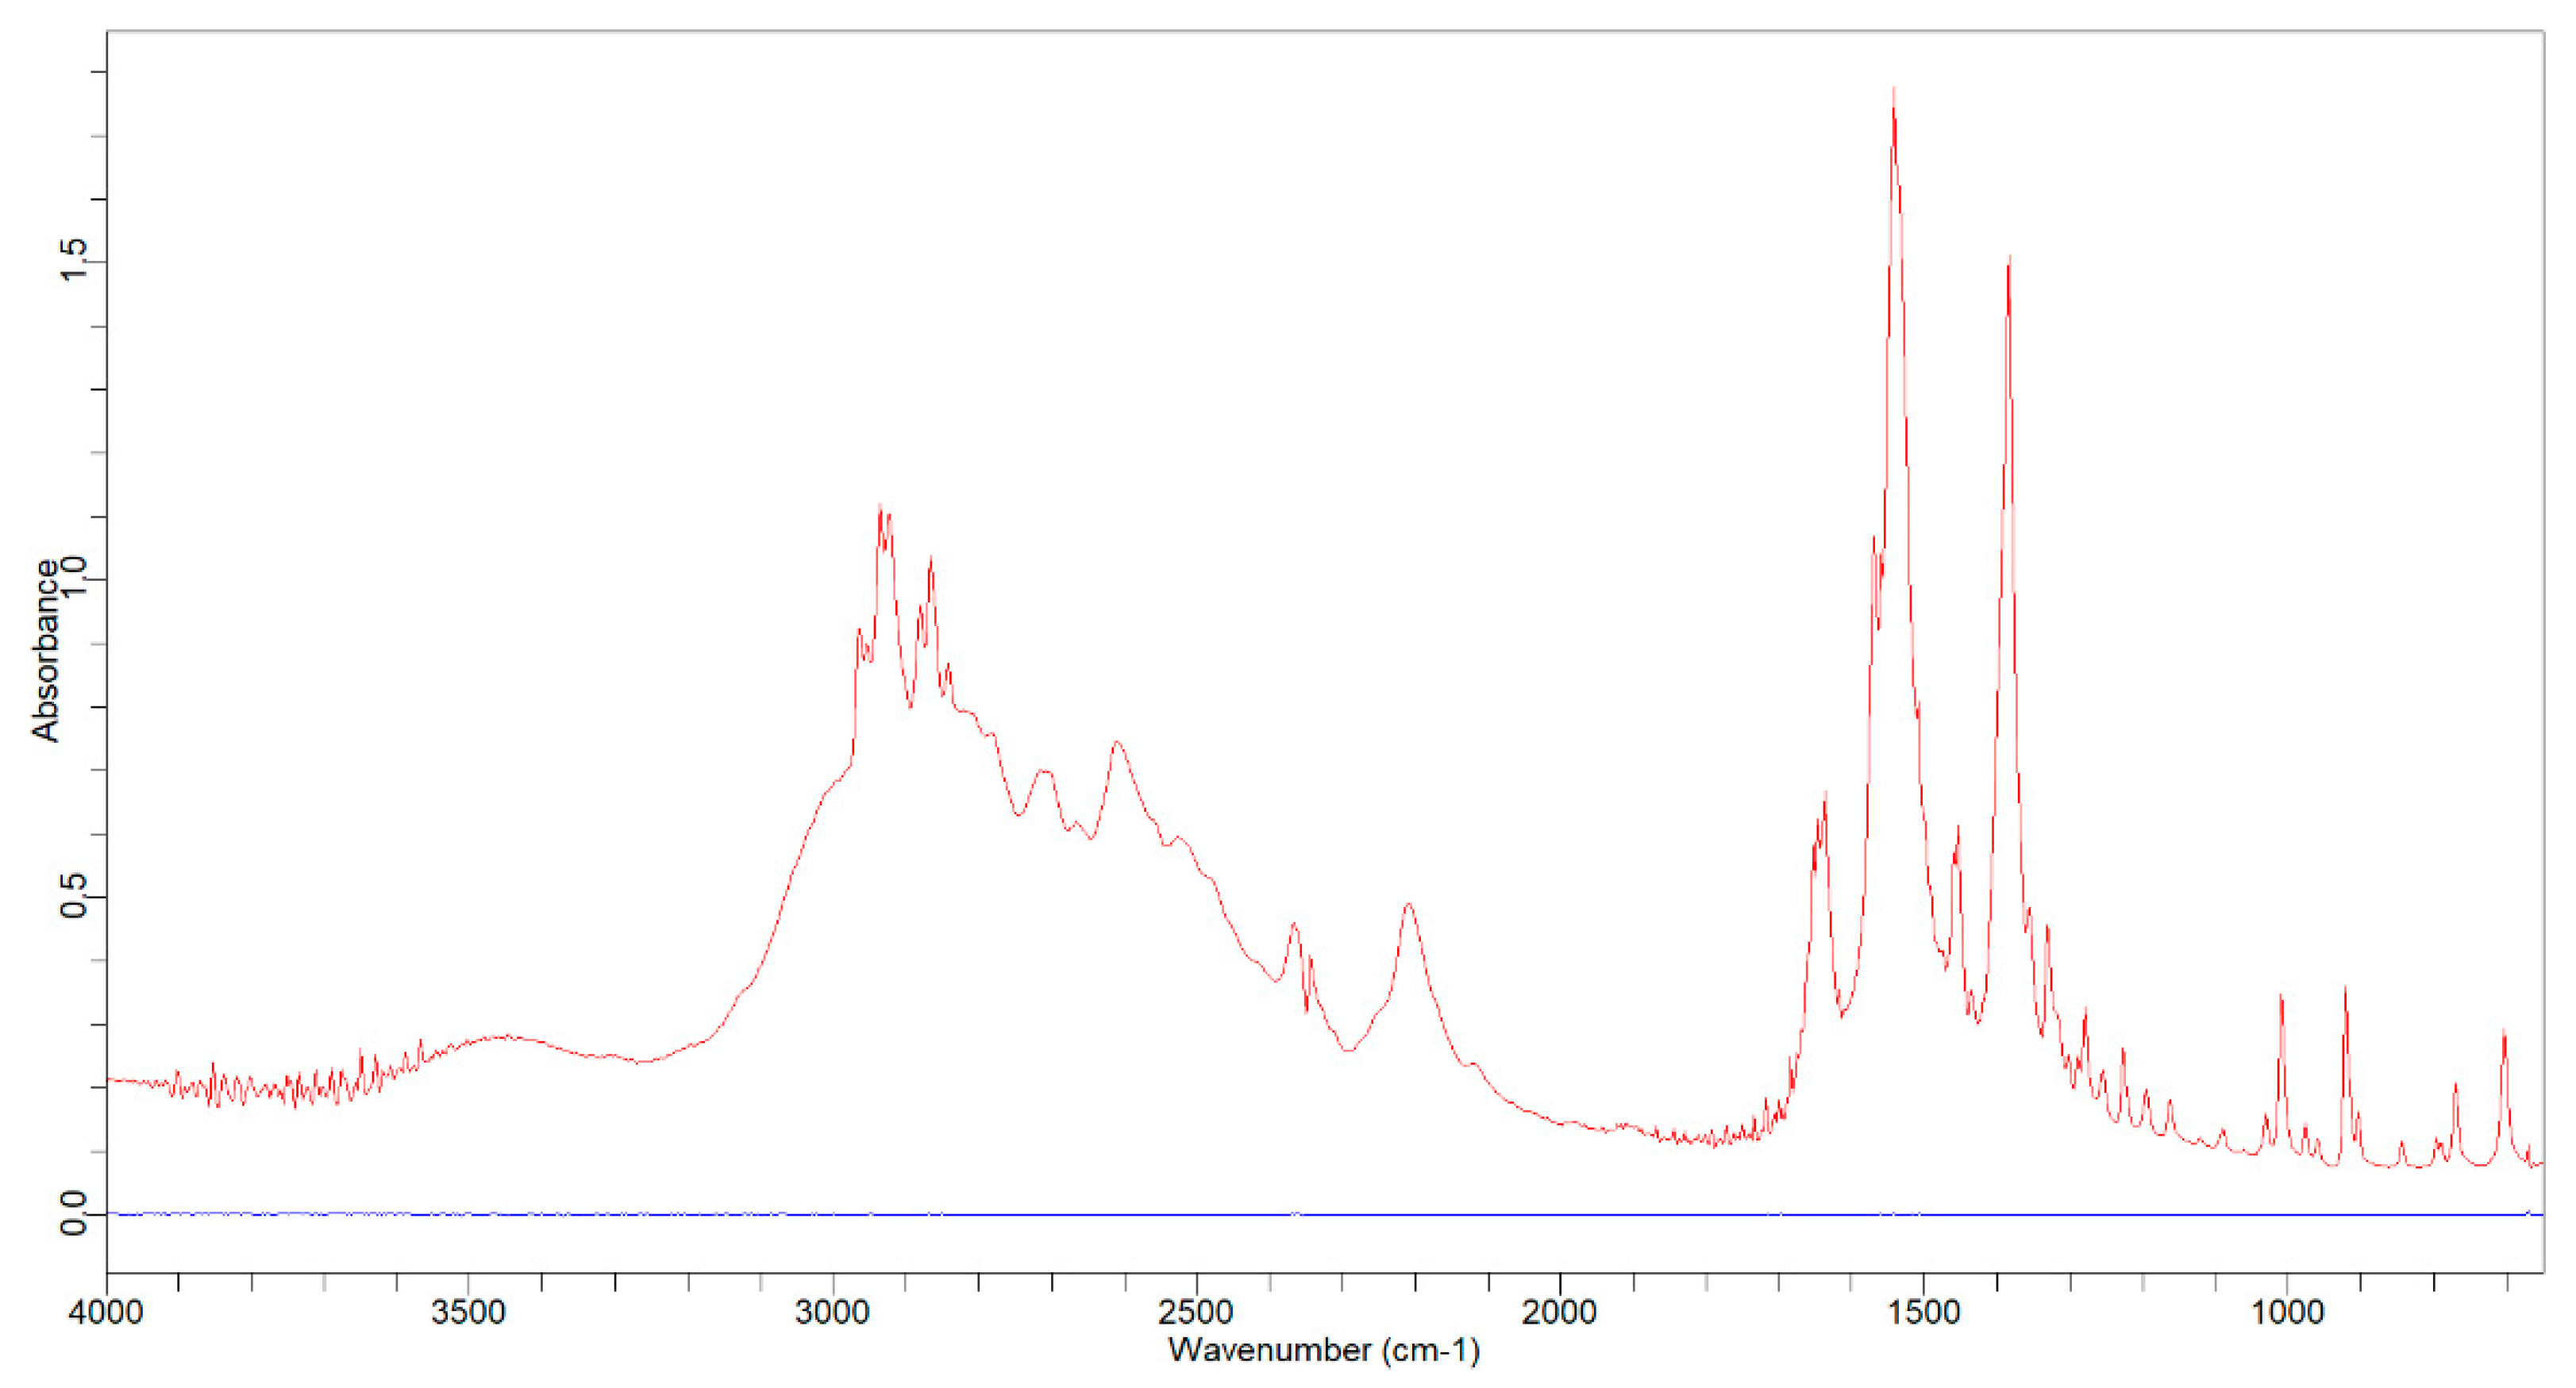
| 2965.11 cm−1 | ±3000 cm−1 (Strong & Board) | –COOH (O–H Stretching) |
| 769.73 cm−1 | 600 cm−1 to 800 cm−1 (Medium) | –COOH (O–H Bending) |
| 1162.86 cm−1 and 1196.50 cm−1 | 1000 cm−1 to 1200 cm−1 (Medium) | –COOH (O–H Bending) |
| 1569.18 cm−1 and 1541.34 cm−1 | 1300 cm−1 to 1600 cm−1 (Medium) | –COOH (O–H Bending) |
| 1638.25 cm−1 | <1700 cm−1 (Medium) | –COOH (C=O Stretching) |
| 1010.16 cm−1 and 922.53 cm−1 | ±1050 cm−1 (Medium) | –COOH (C–O Stretching) |
| 3445.97 cm−1 | 3650–3250 cm−1 (Medium) | –NH2 (N–H Stretching) |
| 1638.22 cm−1 | 1650–1590 cm−1 (Medium) | –NH2 (N–H Bending) |
| 1030.64 cm−1 | 1090–1020 cm−1 (Medium) | –NH2 (C–N Stretching) |
| 2715.39 cm−1 and 2611.01 cm−1 | >3000 cm−1 (Medium) | Alkane (C–H Stretching) |
| 2935.05 cm−1 | ±2935 cm−1 (Medium) | Alkane (C–H Stretching) |
| 2879.43 cm−1 and 2868.32 cm−1 | ±2860 cm−1 (Medium) | Alkane (C–H Stretching) |
| 2210.28 cm−1 | ±2200 cm−1 (Medium) | Alkyne (C≡C Stretching) |
| 1453.69 cm−1 and 1384.70 cm−1 | ±1470 cm−1 (Medium) | Alkane (C–H Bending) |
| 702.57 cm−1 | ±720 cm−1 (Medium) | Alkane (C–H Bending) |
| Number | Concentration (%) | Area (AU) |
|---|---|---|
| 1 | 0.00 | 0.2444308000 |
| 2 | 0.40 | 125.8313214400 |
| 3 | 0.45 | 142.4944207150 |
| 4 | 0.50 | 158.3252190500 |
| 5 | 0.55 | 169.8243798000 |
| 6 | 0.60 | 186.2427745000 |
| Number | Sample | Qualitative Analysis (Tranexamic Acid Similarity Index) | Quantitative Analysis (Tranexamic Acid Level) |
|---|---|---|---|
| 1 | Transamin® 500 mg Tablet (Otto Pharmaceutical Industries) | 0.9083 | 97.56% ± 0.19% |
| 2 | Plasminex® 500 mg Tablet (Sanbe Farma) | 0.9157 | 101.80% ± 0.24% |
| 3 | Pytramic® 500 mg Tablet (Pyridam Farma) | 0.9065 | 99.73% ± 0.22% |
| 4 | Kalnex® 500 mg Tablet (Kalbe Farma) | 0.9279 | 102.74% ± 0.27% |
| 5 | Nexa® 500 mg Tablet (Sanbe Farma) | 0.9189 | 100.47% ± 0.22% |
| 6 | Nexitra® 500 mg Tablet (Ifars) | 0.9192 | 99.50% ± 0.21% |
| 7 | Tranexamic Acid 500 mg Tablet (First Medifarma) | 0.9027 | 98.65% ± 0.21% |
| 8 | Tranexamic Acid 500 mg Tablet (Bernofarm) | 0.9122 | 102.55% ± 0.26% |
Publisher’s Note: MDPI stays neutral with regard to jurisdictional claims in published maps and institutional affiliations. |
© 2021 by the authors. Licensee MDPI, Basel, Switzerland. This article is an open access article distributed under the terms and conditions of the Creative Commons Attribution (CC BY) license (https://creativecommons.org/licenses/by/4.0/).
Share and Cite
Nerdy, N.; Margata, L.; Sembiring, B.M.; Ginting, S.; Putra, E.D.L.; Bakri, T.K. Validation of the Developed Zero-Order Infrared Spectrophotometry Method for Qualitative and Quantitative Analyses of Tranexamic Acid in Marketed Tablets. Molecules 2021, 26, 6985. https://doi.org/10.3390/molecules26226985
Nerdy N, Margata L, Sembiring BM, Ginting S, Putra EDL, Bakri TK. Validation of the Developed Zero-Order Infrared Spectrophotometry Method for Qualitative and Quantitative Analyses of Tranexamic Acid in Marketed Tablets. Molecules. 2021; 26(22):6985. https://doi.org/10.3390/molecules26226985
Chicago/Turabian StyleNerdy, Nerdy, Linda Margata, Bunga Mari Sembiring, Selamat Ginting, Effendy De Lux Putra, and Tedy Kurniawan Bakri. 2021. "Validation of the Developed Zero-Order Infrared Spectrophotometry Method for Qualitative and Quantitative Analyses of Tranexamic Acid in Marketed Tablets" Molecules 26, no. 22: 6985. https://doi.org/10.3390/molecules26226985
APA StyleNerdy, N., Margata, L., Sembiring, B. M., Ginting, S., Putra, E. D. L., & Bakri, T. K. (2021). Validation of the Developed Zero-Order Infrared Spectrophotometry Method for Qualitative and Quantitative Analyses of Tranexamic Acid in Marketed Tablets. Molecules, 26(22), 6985. https://doi.org/10.3390/molecules26226985