Article

Construction of a Luminescent Cadmium-Based Metal–Organic Framework for Highly Selective Discrimination of Ferric Ions

1
School of Chemistry and Environmental Engineering, Hanshan Normal University, Chaozhou 521041, China
2
Guangdong Provincial Key Laboratory of Functional Substances in Medicinal Edible Resources and Healthcare Products, Chaozhou 521041, China
*
Author to whom correspondence should be addressed.
Molecules 2021, 26(22), 6847; https://doi.org/10.3390/molecules26226847
Submission received: 8 October 2021 / Revised: 31 October 2021 / Accepted: 4 November 2021 / Published: 13 November 2021
(This article belongs to the Special Issue Potential Applications of Functional Porous Organic Frameworks)

Abstract

:
Fluorescent metal–organic frameworks (MOFs) are ideal materials for sensors because of their adjustable pore size and functional groups, which provide them with favorable metal ion selective recognition. In this paper, a new cadmium-based MOF was synthesized using Cd(NO3)2·4H2O and 3,3′,5,5′-biphenyltetracarboxylic acid by solvothermal method. CdBPTC owned three types of channels with dimensions of approximately 8.4 × 8.3 Å, 6.0 × 5.2 Å, 9.7 × 8.4 Å along a, b, and c axis, respectively. This MOF has high selectivity to ferric ions and shows excellent anti-inference ability toward many other cations. The results indicate that the fluorescence quenching efficiency of CdBPTC is close to 100% when the concentration of Fe3+ reaches 1.0 × 10⁻³ mol·L−1. Moreover, the luminescent intensity at 427 nm presents a linear relationship at a concentration range of 2.0 × 10⁻⁴~7.0 × 10⁻⁴ mol·L−1, which can be quantitatively expressed by the linear Stern–Volmer equation I0/I = 8489 [Fe3+] − 0.1400, which is comparable to the previously reported better-performing materials. Competitive energy absorption and ion exchange may be responsible for the variation in fluorescence intensity of CdBPTC in different Fe3+ concentrations.

1. Introduction

Iron ions play an irreplaceable role in living systems, and the lack or excess of ferrum in the human body causes serious dysfunction. Iron ions are an important component of hemoglobin and myoglobin but are also related to transferrin. In addition, the level of iron ions content has a profound impact on industrial and agricultural production, as well as daily life [1,2,3,4,5]. Therefore, the detection of iron ions is of great significance for environmental detection and life science. Currently, the methods for the determination of iron ions include oxidation–reduction titration, electrochemistry, inductively coupled plasma spectroscopy (ICP), inductively coupled plasma mass spectrometry (ICP–MS), flame atomic absorption spectrometry (FAAS), etc. Each approach has its advantages and disadvantages. For example, the methods of polarography and potassium dichromate titration analysis are simple to operate but with low sensitivity. Although FAAS and ICP–MS have good sensitivity, their high price, complicated pretreatment, and operation restrict their widespread use. In this context, the detection of iron ions based on luminescence has attracted much attention due to its simplicity, rapidity, and high sensitivity [6,7,8,9,10].
Metal–organic frameworks (MOFs) are new types of porous crystal materials [11,12] mainly composed of inorganic metal ions or metal clusters and organic ligands connected by coordination bonds to form regular two- or three-dimensional network structures, which have been widely applied in separation and storage of gases [13], chemical sensing [14], catalysis [15,16], food detection [17], biomedicine [18,19] and other fields [20,21]. Fluorescent MOFs and organic porous materials [22,23,24] are ideal candidates for sensors because of their adjustable pore size and functional groups, which provide them with favorable metal ion selective recognition. It has been reported in the literature that iron quenched the fluorescence of MOFs owing to the paramagnetic feature and intensely visible absorbance of Fe3+, thus forming a “turn-off” sensor. For instance, Lv. R. et al. [5] synthesized a new luminescent Cd-MOF, which can detect Al3+ and Fe3+ by means of fluorescence quenching. The detection limit reached 0.56 μM for Al3+ and 0.3 μM for Fe3+, respectively. Nevertheless, some examples selectively detected Fe3+ via the “turn-on” effect, such as Co-based JXUST-2 [25], and Tb-based Tb-TCPP [26,27], in which turn-on MOFs were used simultaneously as fluorescent sensors for Fe3+, Cr3+, and Al, and displayed a 10-fold fluorescence enhancement. However, few studies have used MOFs for the specificity recognition of Fe3+ through the turn-on or turn-off effect under different concentrations.
In this paper, a new cadmium-based MOF (named as CdBPTC) was synthesized using Cd(NO3)2·4H2O and 3,3′,5,5′-biphenyltetracarboxylic acid (H4BPTC) by solvothermal method and characterized by single-crystal X-ray diffraction (SXRD), powder X-ray diffraction (PXRD), thermogravimetric analysis (TGA), Fourier transform infrared spectroscopy (FTIR), and fluorescence spectroscopy. Fe3+ significantly affected the fluorescence properties of CdBPTC. Interestingly, the fluorescence intensity was higher than that of CdBPTC when the concentration of Fe3+ was in the range of 1 × 10⁻⁹~1 × 10⁻⁵ mol·L−1. Above 10−4 mol·L−1, the fluorescence intensity dropped sharply with turn-off effect, showing a linear relationship in the range of 2 × 10⁻⁴~7 × 10⁻⁴ mol·L−1.

2. Results and Discussion

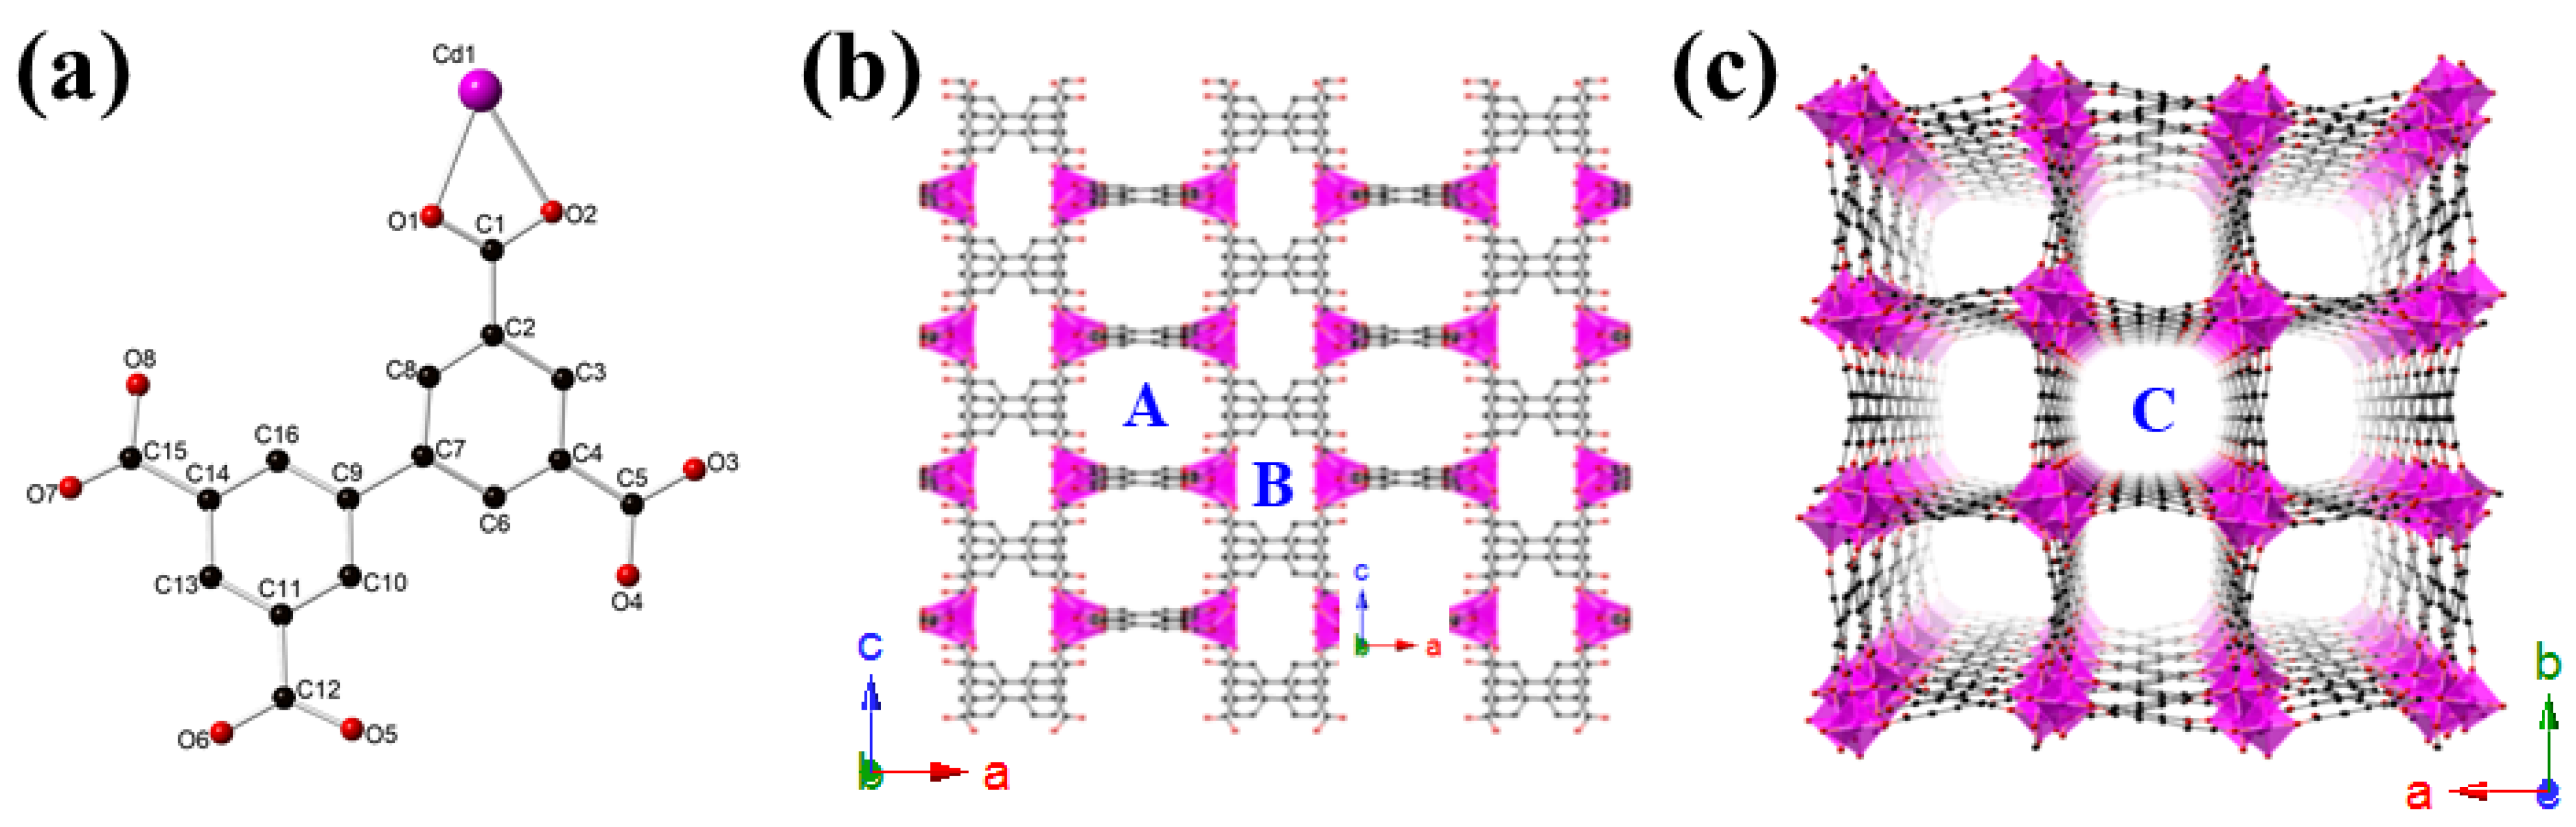
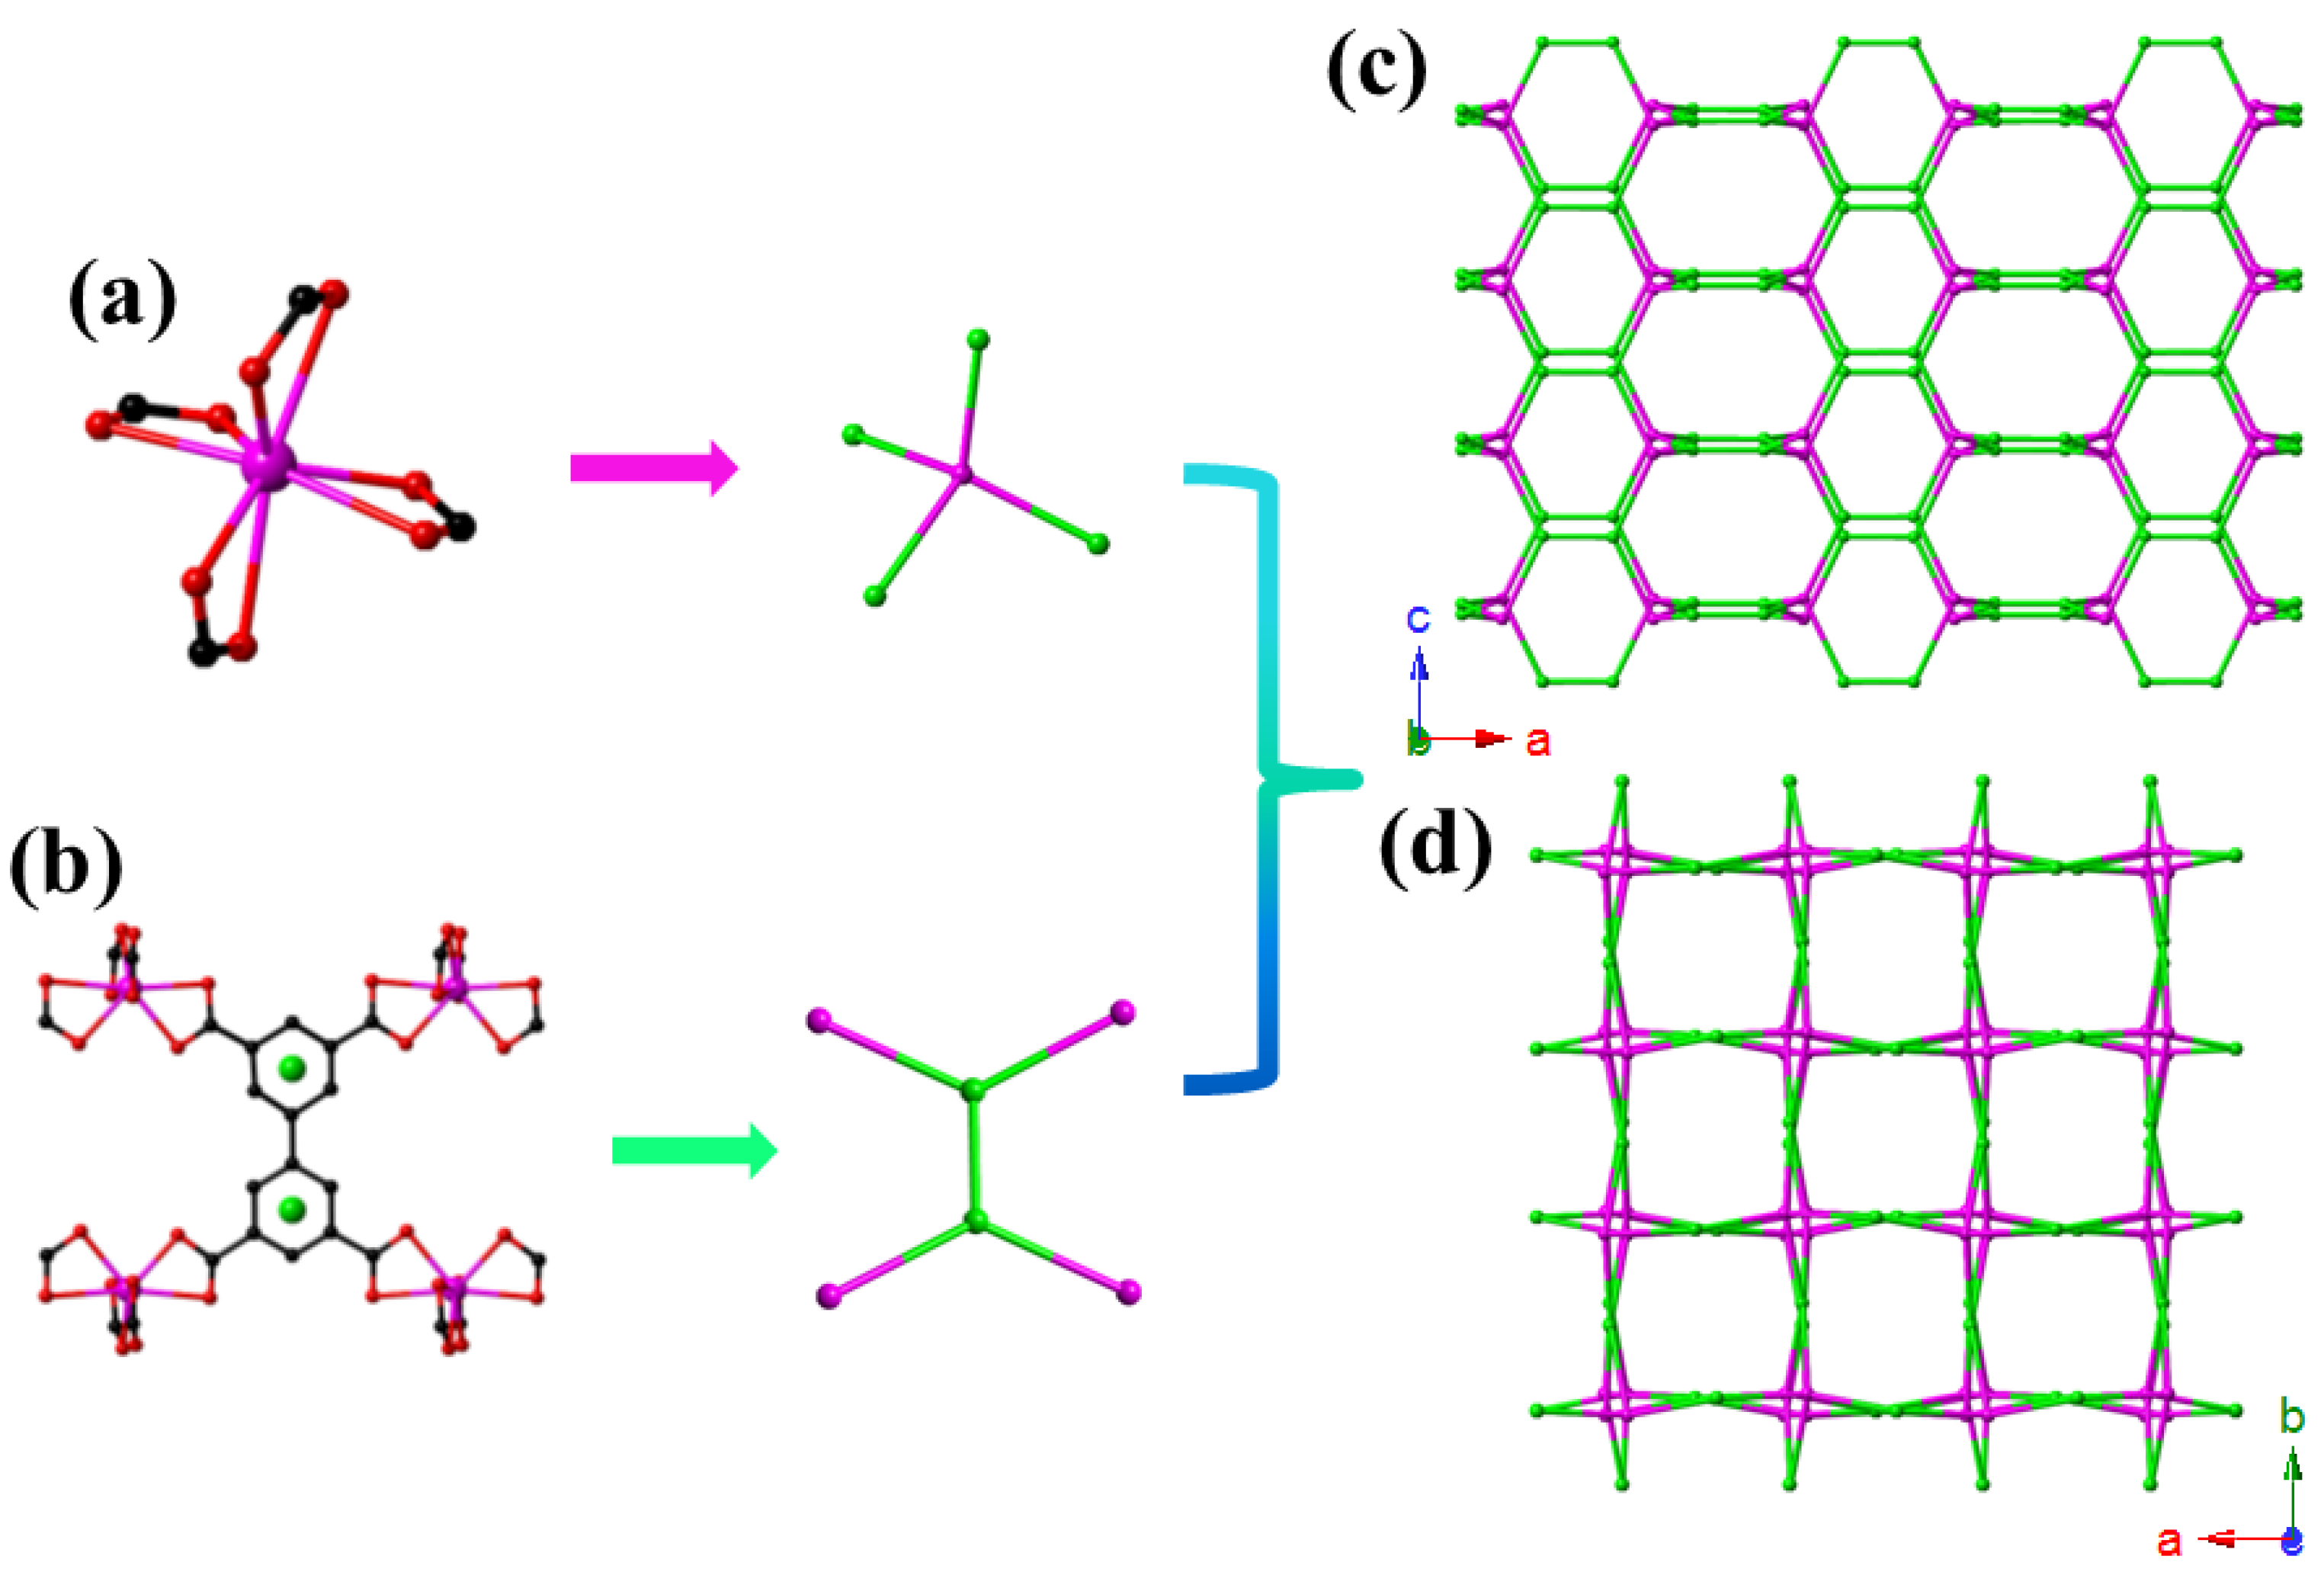
2.1. Crystal Structure Description of {[Me2NH2]2[CdBPTC]·6H2O}n (CdBPTC)

SXRD analyses revealed that CdBPTC crystallized in a tetragonal noncentrosymmetric I41cd space group (No. 110). As shown in Figure 1a, the asymmetric unit of CdBPTC consists of a crystallographically independent Cd2+, a fully deprotonated BPTC4− ligand. The coordination environment of the eight-coordinated Cd2+ center is composed of eight oxygen atoms from four chelating bidentate carboxylate groups, forming a simple mononuclear Cd(COO)4 SBU (Figure 2a). The BPTC4− ligand serves as a μ4-bridge to link four Cd centers by a μ42222 coordination mode through eight carboxylate oxygen atoms and extended into an infinite three-dimensional (3D) porous network (Figure 1b,c, Figure 2a, and Figure S1). CdBPTC owns three types of one-dimensional (1D) channel with dimensions of approximately 8.4 × 8.3 Å (pore A), 6.0 × 5.2 Å (pore B), and 9.7 × 8.4 Å (pore C), respectively, along the crystallographic a, b, and c axis, giving rise to the high porosity of 68.1% per unit cell volume, which is calculated by using the squeeze routine of PLATON [28]. Due to the presence of a large number of Me2NH2+ in the channel, hydrogen bonding forces may be generated with MOFs, resulting in the collapse of the frameworks after the removal of these ions. Unfortunately, we could not obtain specific surface area through conventional experiments. Crystal data and structure refinement parameters are summarized in Table 1 and Table S1.
The topological network pattern of CdBPTC is shown in Figure 2. In order to reflect the shape of the MOF channel, the BPTC4- ligand and mononuclear Cd2+ unit were considered to be three- and four-connected nodes instead of four- and four-connected nodes, respectively. Topological analysis indicated that the structure could be simplified as a (4, 3, 3)-connected net with stoichiometry (3-c)2(4-c) and point symbol of {62.84}{62.8}2. The phase purity of the as-synthesized CdBPTC was characterized by PXRD. As a result, the experimental peaks were consistent with the simulated one obtained by SXRD, indicating the samples were of high purity (Figure S2). However, there were slight differences in the low 2theta degrees due to the disorder of crystal structure after grinding (Figure S12).

2.2. Framework Stability

The TGA curve of CdBPTC revealed that the framework could be thermally stable up to ca. 360 °C (Figure S4). When the temperature rose to 140 °C, the weight loss was about 17.0%, which should be the escape of six water molecules. Then, the MOF slowly lost the two dimethylamine cations and began to collapse when the temperature exceeded 360 °C. The CdBPTC powders were immersed in different organic solvents such as DMF, DMSO, EtOH, etc. for 3 days, respectively. Then, the solid samples were filtered, followed by PXRD measurements. Comparing the PXRD patterns of the experimental and simulated samples, no obvious differences were found (Figure S5). These results demonstrated the excellent thermal and chemical stability of CdBPTC.

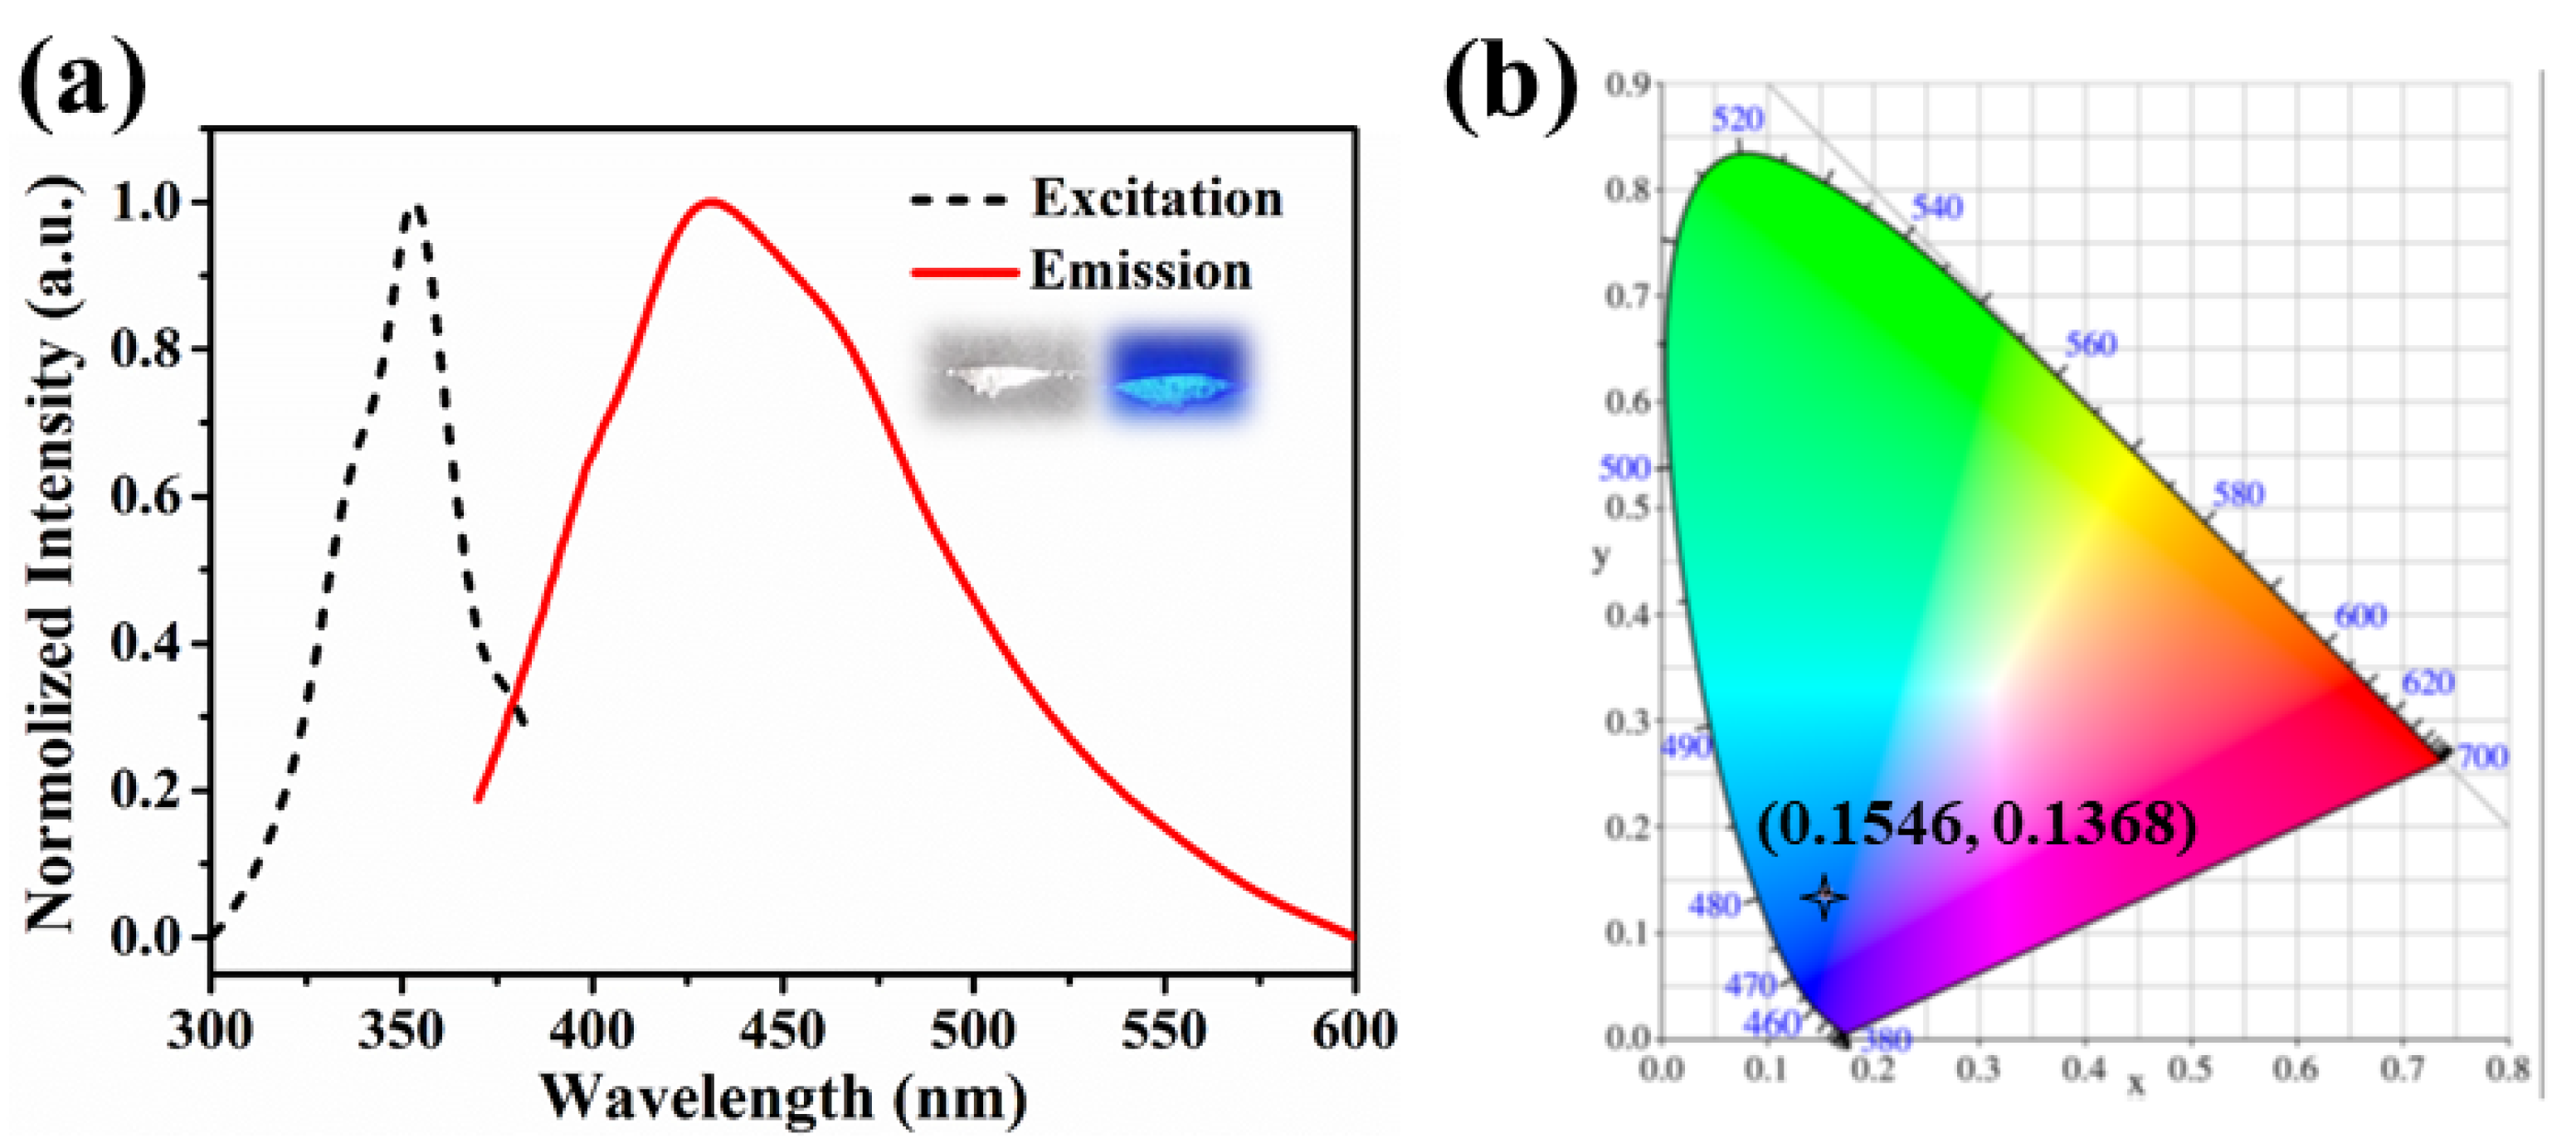
2.3. Luminescent and Sensing Properties

As depicted in Figure 3, the luminescence characters of CdBPTC were performed in a solid state at room temperature. The sample showed blue fluorescence with an emission peak at 427 nm (excited at 354 nm), which could be mainly due to the intraligand charge transfer (ILCT) because the ligand H4BPTC also exhibited a similar emission (Figure S6).

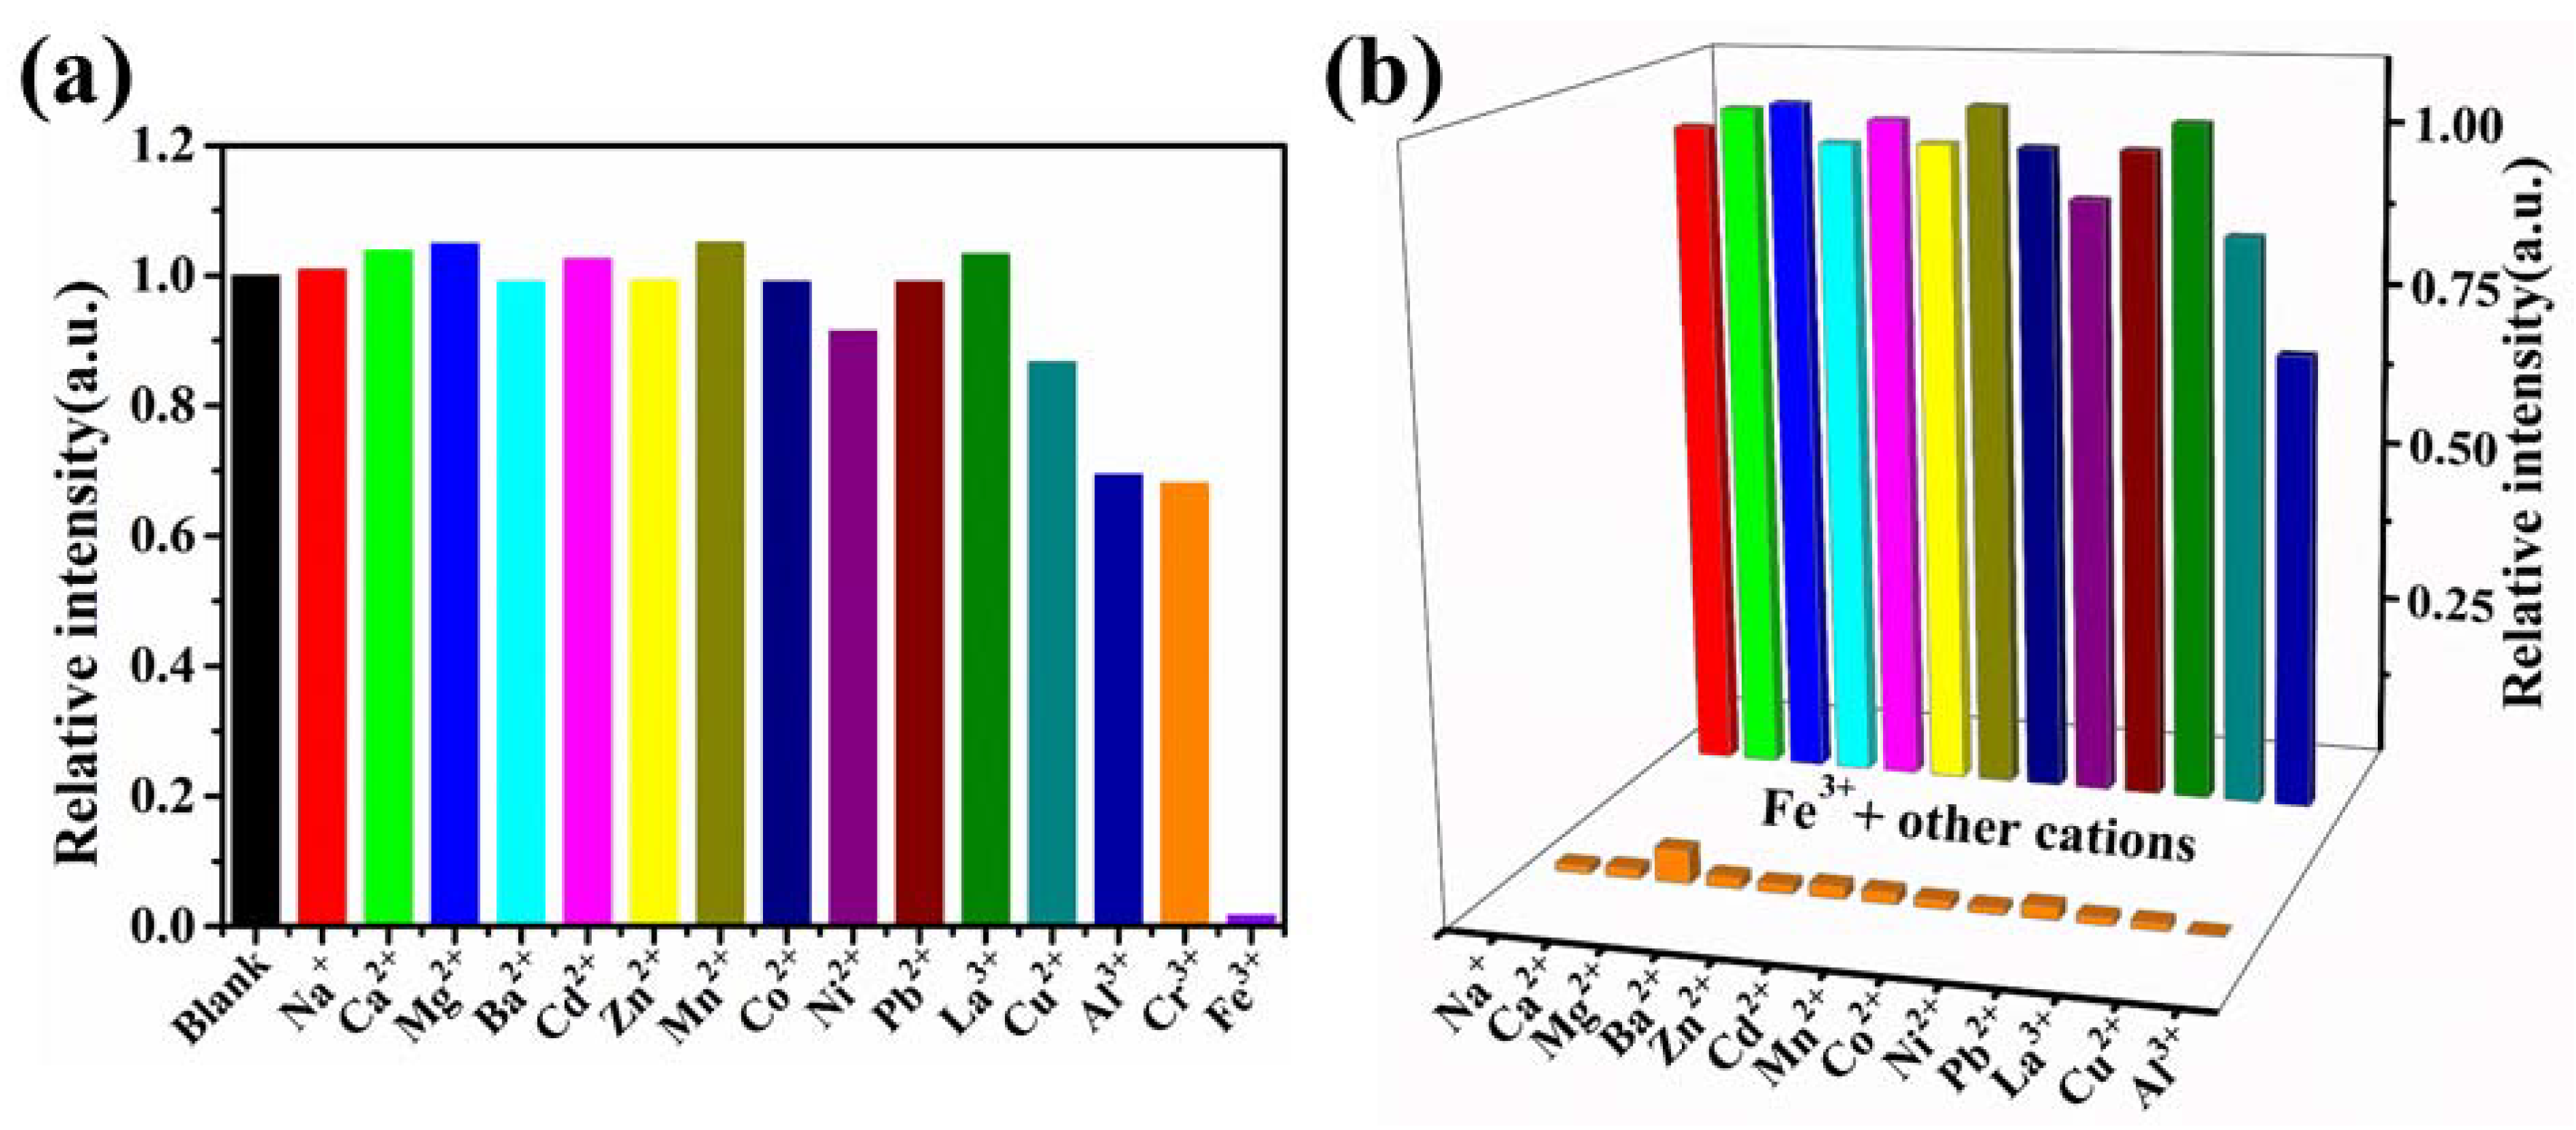
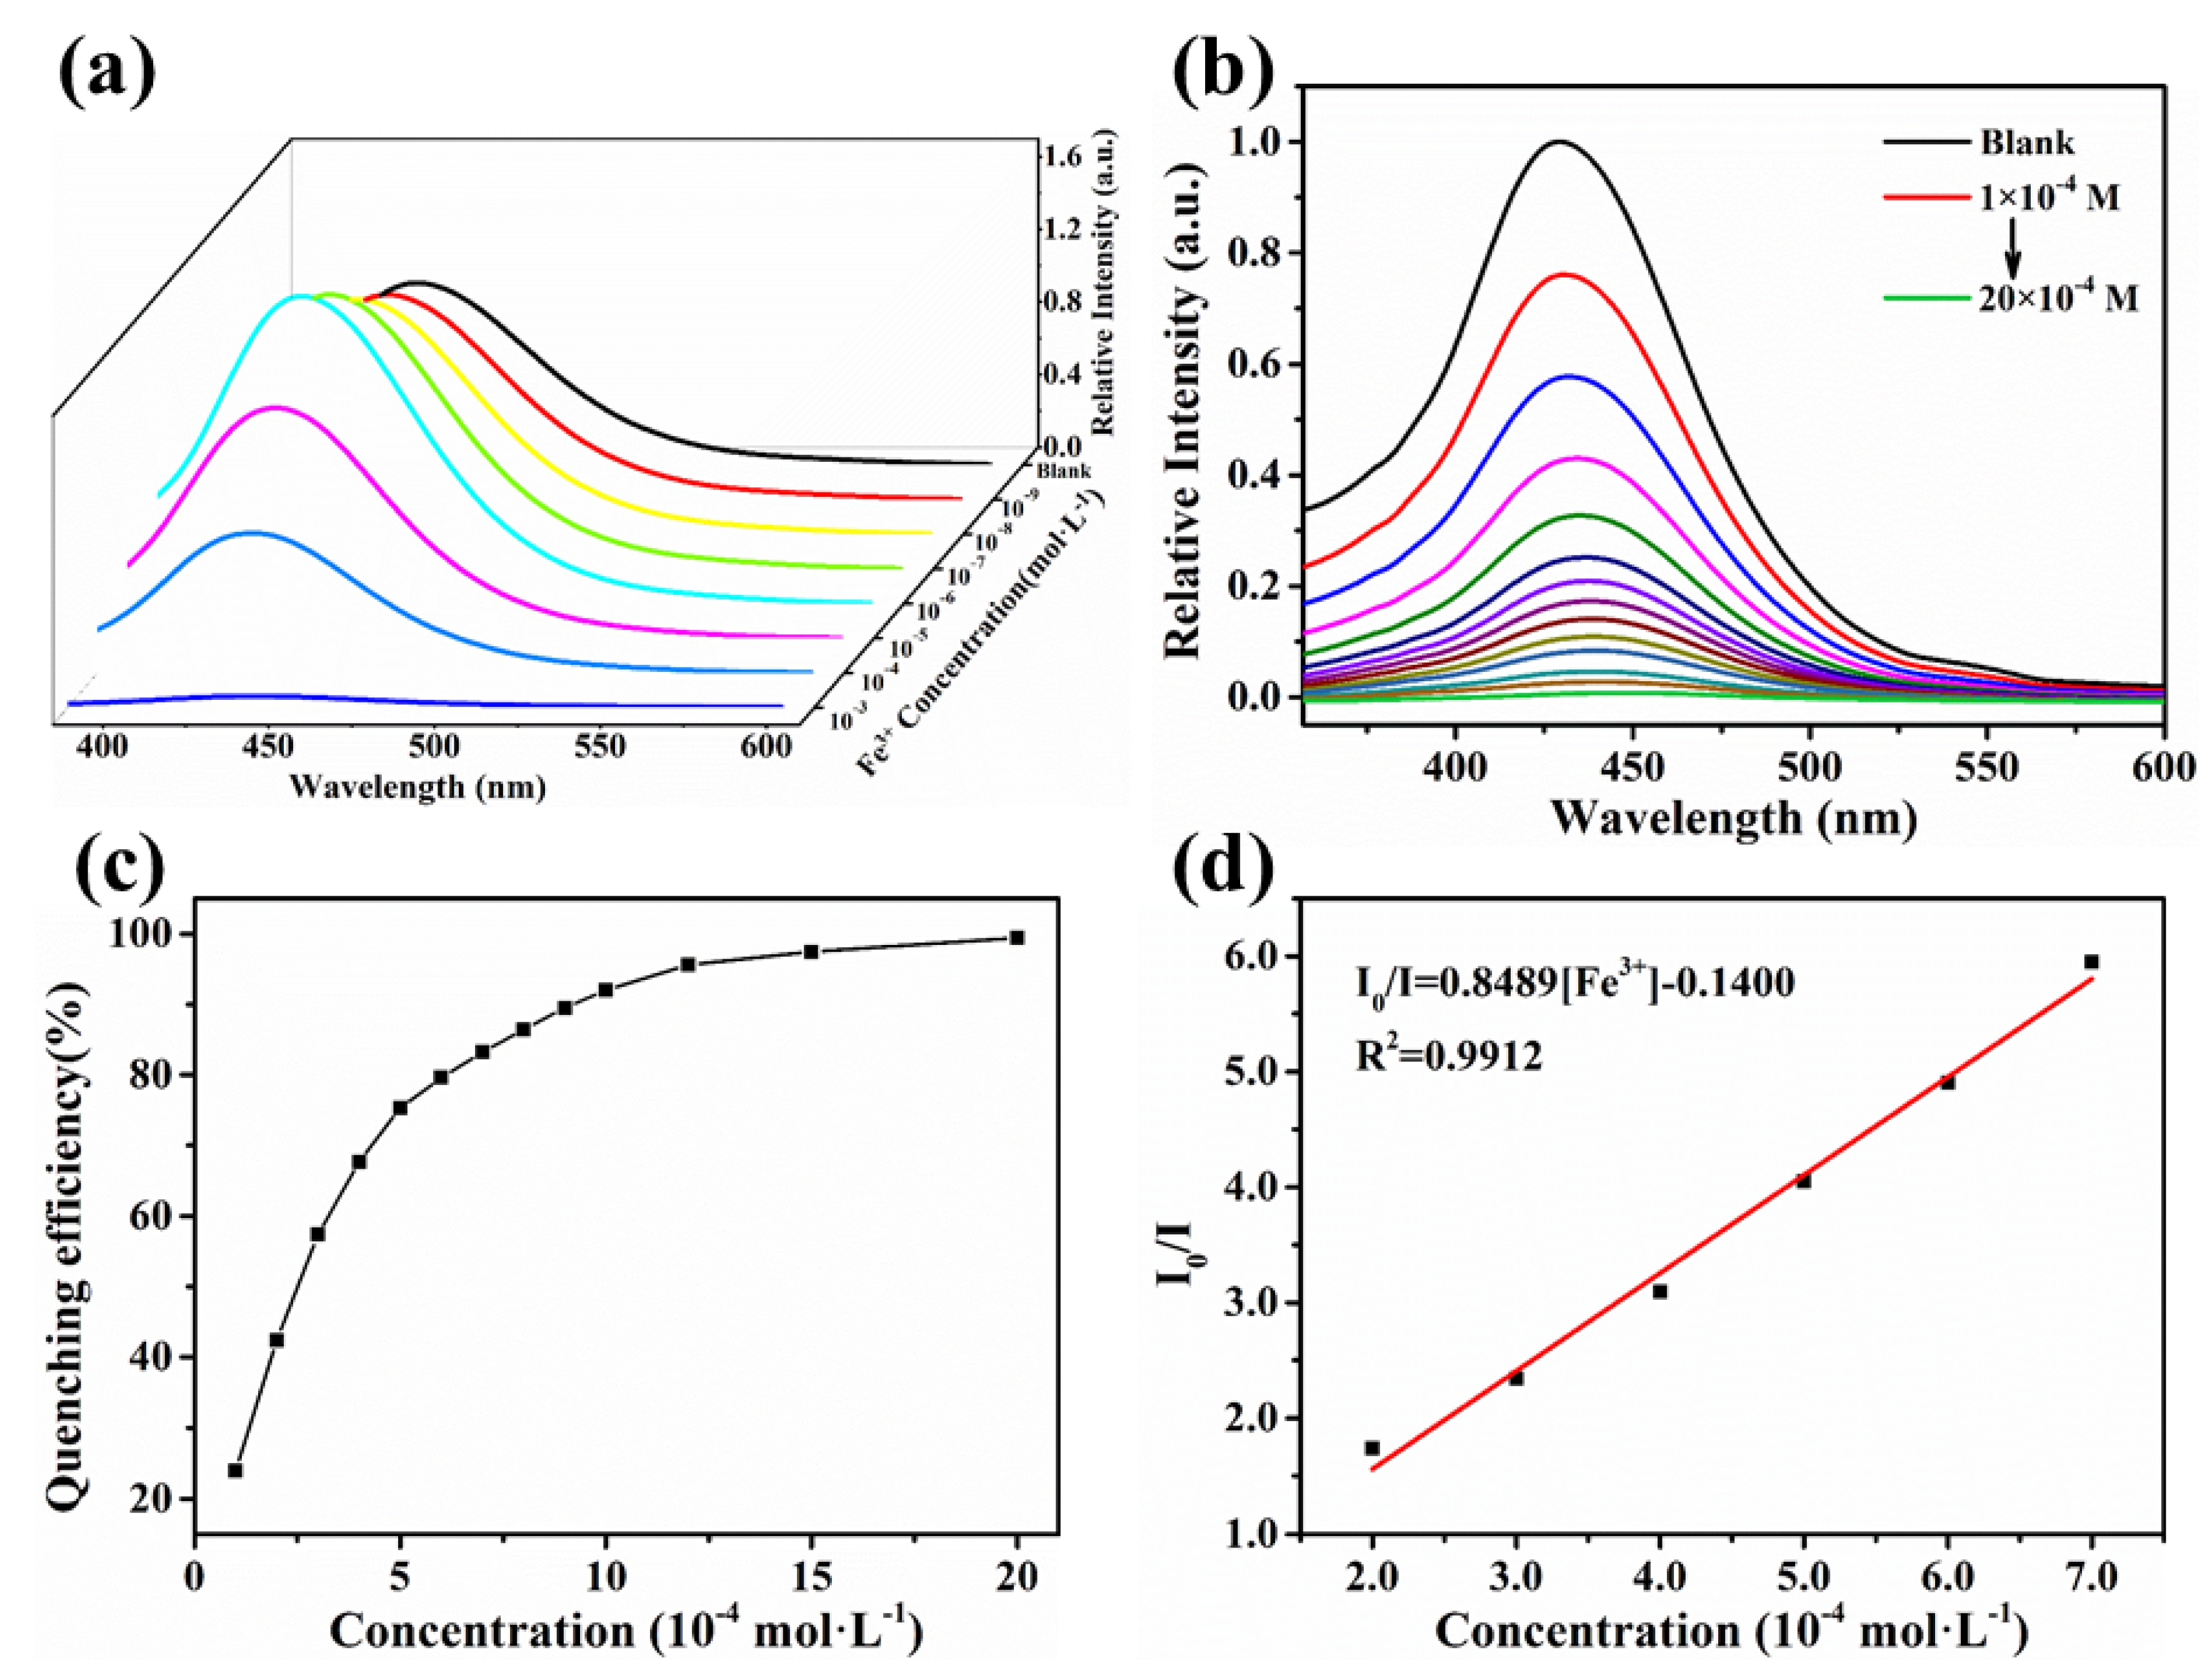
2.3.1. Fluorescence Detection of Metal Ions

A total of 15 mg ground CdBPTC sample was added to 15 mL DMF, then sonicated in an ultrasonic washer for 20 min; thus, suspended solutions were obtained. Na+, Ca2+, Mg2+, Ba2+, Cd2+, Zn2+, Mn2+, Co2+, Ni2+, Pb2+, Cu2+, La3+, Eu3+, Tb3+, Al3+, Cr3+, and Fe3+ aqueous solutions (30 μL 0.1 mol·L−1) were separately added to CdBPTC suspensions (3 mL), stirred, and tested the emission spectra immediately. Obviously, the fluorescence of MOF was almost completely quenched after the addition of Fe3+. In comparison, the addition of other cations did not cause an obvious fluorescence response, and only partial decreased luminescence intensity was observed for Al3+ and Cr3+ (about 30% lower than the original intensity; Figure 4a). After the addition of Eu3+ and Tb3+, the unique characteristic peaks of rare-earth ions were observed, but the emission peaks of MOF at 427 nm did not decrease significantly (Figures S14 and S15). CdBPTC exhibited suitable selectivity and responsiveness to Fe3+ with a turn-off effect.
Considering the influence of other ions on Fe3+ selectivity, 1.0 × 10⁻³ mol·L−1 Na+/Fe3+, Ca2+/Fe3+, Mg2+/Fe3+, Ba2+/Fe3+, Cd2+/Fe3+, Zn2+/Fe3+, Mn2+/Fe3+, Co2+/Fe3+, Ni2+/Fe3+, Pb2+/Fe3+, Cu2+/Fe3+, La3+/Fe3+, Cu2+/Fe3+, Al3+/Fe3+ competition experiments were also carried out. As shown in Figure 4b, the fluorescence intensity decreased significantly with the addition of the corresponding Fe3+. Additionally, the fluorescence quenching was completed immediately; that is to say, the turn-off effect still existed in the presence of other cations. The above results manifested that CdBPTC had high selectivity for Fe3+.
To further study the sensitivity of CdBPTC for sensing Fe3+, the quantitative detection was investigated through the fluorescence titration spectra analyses. The fluorescence intensity of MOF gradually increased with the increase in Fe3+ concentrations in the range of 1.0 × 10⁻⁹~1.0 × 10⁻⁶ mol·L−1 (Figure 5a, the fluorescence measurements should be tested after 10 min with steady signals). In order to fairly evaluate the fluorescence enhancement effect of MOF in the presence of Fe3+ at very low concentrations, we conducted the same experiment on Cr3+, Tb3+, Eu3+, La3+, Zn2+, Mn2+, Fe2+ at the same concentration, respectively. As shown in Figures S13–S19, the fluorescence intensity also increased slightly in the presence of other metal ions. To eliminate the influence of a small amount of water in the solution, Fe3+ in DMF solution was selected for an experiment under the same conditions, and the same phenomenon was obtained, as shown in Figure S11. We speculate that this can be caused by the two Me2NH2+ contained in the MOF pore exchange ions with these metal cations. Interestingly, as the Fe3+ concentration reached 1.0 × 10⁻⁴ mol·L−1, the fluorescence intensity dropped sharply (Figure 5b). It is worth noting that attenuation of the fluorescence signals could be observed immediately. The fluorescence-quenching efficiency was calculated by using the formula: (1 − I/I0) × 100%, where I0 and I are the values of the luminescence intensity of pristine CdBPTC and Fe3+ loaded CdBPTC, respectively, indicating that CdBPTC showed a high sensitivity in sensing fluorescence quenching. The quenching efficiency was close to 100% when the concentration of Fe3+ reached 1.0 × 10⁻³ mol·L−1 (Figure 5c). Moreover, the luminescence-quenching coefficient (Ksv) can be quantitatively expressed by the linear Stern–Volmer equation [29,30] I0/I = 8489 [Fe3+] − 0.1400. The luminescent intensity at 427 nm presented a linear relationship at a concentration range of 2.0 × 10⁻⁴~7.0 × 10⁻⁴ mol·L1 and R2 > 0.99 (Figure 5d). Therefore, the Ksv value could reach 8489 L·mol−1, which is comparable to the previously reported [31,32,33] better-performing materials. By the calculation of the 3σ/k formula (σ is the standard error; k is the slope), the detection limit for Fe3+ was found to be 9.04 ppm. In addition, we also tested the fluorescence spectra of CdBPTC in the presence of Fe2+ at different concentrations. As shown in Figure S19, the fluorescence intensity also showed obvious enhancement at 10−9~10−6 mol·L−1. When the concentration increased to 10−3 mol·L−1, the fluorescence quenched immediately, but the quenching efficiency (85%) was lower than that of Fe3+.

2.3.2. Fluorescence-Sensing Mechanism of the CdBPTC Probe

According to previous reports, the luminescence effect of MOF caused by metal ions mainly results from the destruction of MOF structure, ion exchange, host–guest interaction, and iron quenched the fluorescence of MOFs, owning to the paramagnetic feature and significant visible absorbance of Fe3+. In order to investigate the possible mechanism, 15 mg CdBPTC solid sample was immersed into 1 mL 1.0 × 10⁻² mol·L−1 DMF solutions of different metal ions (replace the metal salt solution after 24 h), respectively, and kept in dark for three days. Then, the solid fluorescence and PXRD were measured after filtration and drying (Figures S8–S10). The structure of CdBPTC before and after the addition of metal ions was studied. As shown in Figures S8 and S12, after adding metal ions, or after grinding MOF and then sensing Fe3+, or after soaking in water for 6 h, the framework was maintained, as confirmed by basically unchanged PXRD diffraction peaks, indicating that the luminescence quenching was not caused by the damage of the MOF structures.
Furthermore, given the anionic framework of CdBPTC, the increased fluorescence of MOF in the presence of metal cations at low concentrations may be the result of cation exchange. With the initial addition of Fe3+ (10−9~10−6 mol·L−1), the charge balance of the frameworks was gradually broken. After 10 min, the stable fluorescence signal indicated that the ion exchange between host and guest was complete, and the fluorescence intensity of MOF was enhanced. However, when the concentration of Fe3+ increased to 1.0 × 10⁻⁴ mol·L−1, the fluorescence quenching of MOF was obvious without waiting. To explore the possible mechanism, the UV–Vis spectrum of MOF in the solid state was tested (Figure S20). The absorption peaks of CdBPTC appear in the range of 200–350 nm. Moreover, the UV–Vis absorption spectra of Fe3+ with different concentrations were measured (Figure S21). No obvious absorption signals were observed at 105 and 10−6 mol·L−1. When the concentration reached 10−4 mol·L−1, significant absorption peaks began to appear in the range of 300~400 nm, which overlapped with the absorption wavelength of MOF. Meanwhile, the UV–Vis absorption spectra of Na+, Mg2+, Co2+, Ni2+, Pb2+, Cu2+, Mn2+, Zn2+, Fe2+, La3+, Al3+, Cr3+, Tb3+, and Eu3+ were measured at the same concentration, respectively, and only Fe3+ had an obvious absorption peak (Figure S21). In addition, the maximum emission wavelength of CdBPTC solid sample was located at 427 nm within the Fe3+ concentration in the range of 1.0 × 10⁻⁹~1.0 × 10⁻⁶ mol·L−1, while above 10−3 mol·L−1, a weak shoulder peak appeared at 470 nm in the solid-state fluorescence spectrum, whereas others showed little change (Figure S10). Therefore, we speculate that ion exchange is the main reason affecting the fluorescence of MOF at low concentration, while at high concentration, the competitive absorption of excitation source energy between metal ions and MOF leads to the fluorescence quenching of MOF [33,34,35,36]. Interestingly, when CdBPTC was exposed to Fe3+ in the DMF solution, the color of the solution changed from yellow to brown. By contrast, the naked eye recognition and detection for Fe3+ could be realized.

3. Materials and Methods

3.1. Chemicals and Reagents

All reagents and solvents including the H4BPTC ligand were purchased from commercial sources and used without further purification.

3.2. Apparatus

TGA was carried out in a nitrogen stream using the DTG-60 thermal analysis equipment with a heating rate of 10 °C·min−1 (Shimadzu, Kyoto, Japan). PXRD patterns of the bulk samples were measured on a Rigaku MiniFlex600 X-ray diffractometer (Rigaku, Kyoto, Japan). FTIR was obtained by KBr disks on a Shimadzu IRAffinity-1 FTIR spectrometer in the range of 4000–400 cm−1 (Shimadzu, Kyoto, Japan, abbreviations for the IR bands: w = weak, m = medium, b = broad, and vs. = very strong). Elemental analysis was carried out with Vario EL III CHNS equipment (Elementar, Langenselbold, Germany). The steady-state photoluminescence spectra (PL) for all samples were recorded on an RF-5301PC spectrofluorometer (Shimadzu, Kyoto, Japan).

3.3. Synthesis of {[Me2NH2]2[CdBPTC]·6H2O}n

A mixture of Cd(NO3)2·4H2O (0.05 mmol, 16 mg), 3,3′,5,5′-biphenyltetracarboxylic acid (H4BPTC, 0.0375 mmol, 13 mg), and mixed solvent N,N-dimethylformamide (DMF)/H2O (4.5 mL, 4:0.5, v/v), with an additive of drops of HNO3 (68%, 0.08 mL), was sealed in a Pyrex glass tube and heated in an oven at 90 °C for 72 h and cooled to room temperature at a rate of 5 °C·h−1. Colorless prism crystals were filtered and washed with DMF. Yield: ca. 90% based on H4BPTC. FTIR spectrum (KBr pellets, cm−1): 3442(br, m), 3078(br, m), 2789(m), 2472(w), 1616(s), 1562(s), 1435(s), 1413(s), 1363(s), 1315(m), 1018(w), 1014(w), 773(m), 731(m), 657(m), 651(m), 516(w), 420(w). Elemental analysis (CHN), (C20H34N2O14Cd)n, that is, {[Me2NH2]2 [Cd(BPTC)]∙6H2O)}n, calculated (%): C 37.60, H 5.36, N 4.38; found (%): C 37.72, H 5.29, N 4.67.

3.4. Determination of the Crystal Structures

A suitable size and high-quality crystal of CdBPTC was mounted at the end of glass fiber for single-crystal X-ray diffraction analysis. Data collection was performed by a Rigaku XtaLAB PRO MM007-DW diffractometer system, which was equipped with an RA-Micro7HF-MR-DW(Cu/Mo) X-ray generator and a Pilatus3R-200K-A detector (Cu Kα, λ = 1.54178 Å). The structure was solved by direct methods and refined by full-matrix least-squares refinements based on F2. Anisotropic thermal parameters were applied to all non-hydrogen atoms. The hydrogen atoms were generated geometrically. The crystallographic calculations were performed using the SHELXL programs [37,38]. The treatment for the guest molecules in the cavities of CdBPTC involves the use of the SQUEEZE program of PLATON. The existences of [Me2NH2]+ and H2O were further verified by the FTIR spectra, elemental analysis, and TGA data, obtaining the final chemical formulas of {[Me2NH2]2[CdBPTC]·6H2O}n.

3.5. Sensing Experiment

In metal ions sensing, 3 mg of CdBPTC was ground to a fine powder and ultrasonically dispersed into 3 mL DMF to prepare the 1 mg·mL−1 uniform suspensions. Various M(NO3)x aqueous solutions were added to the above suspensions. Then, the suspensions were loaded in the cuvettes for collecting the photoluminescence spectra. The fluorescence intensity of the suspension in DMF was measured as the blank sample.

4. Conclusions

In summary, we successfully synthesized an anionic microporous MOF, CdBPTC, with good thermal and chemical stability. CdBPTC was proved to be highly selective for the discrimination of ferric ions and showed excellent anti-inference ability toward many other cations. The luminescent intensity presented a linear relationship at a concentration range of 2.0 × 10⁻⁴~7.0 × 10⁻⁴ mol·L−1. The Ksv was about 8489 L·mol−1, which was obtained from the linear Stern–Volmer equation. This MOF exhibited a fluorescence “turn-off” effect for Fe2+ and Fe3+, which may be attributed to the competitive absorption of excitation source energy between ferric ions and CdBPTC. This type of MOFs can be developed as a potential candidate for the detection of Fe3+ in complex environments and can also be used for the determination of iron ion concentration in environmental hygiene, food safety, medical health, soil, and other media.

Supplementary Materials

The following are available online. Figure S1: Ball-and-stick view of the coordination environments of Cd2+ and BPTC4- in CdBPTC, Figure S2: PXRD patterns of CdBPTC, Figure S3: FTIR spectra of CdBPTC and H4BPTC ligand, Figure S4: TGA curve of CdBPTC, Figure S5: PXRD patterns of CdBPTC soaked in different organic solvents, Figure S6: The emission spectra of CdBPTC and H4BPTC ligand in solid state at room temperature, Figure S7: Photoluminescence spectra of CdBPTC in DMF and aqueous solutions containing different metal ions (1 × 10⁻³ mol·L−1) when excited at 337 nm, Figure S8: PXRD patterns of H4BPTC after being dispersed in DMF and different metal ions solutions for 72 h, Figure S9: Images of CdBPTC powder soaked in DMF solutions of different metal salts (1.0 × 10⁻² mol·L−1) for 0 h (a) and 72 h (b), Figure S10: Solid emission spectra of CdBPTC after soaked in pure DMF, DMF solution of Fe3+ ion and other cations (1.0 × 10⁻² mol·L−1) for 72 h. The inset shows the darker color of the CdBPTC sample after immersion in the solution of ferric ions, Figure S11: Liquid luminescence spectra of CdBPTC presenting turn-on and turn-off fluorescence signals with different concentrations of Fe3+ DMF solution at room temperature, λex = 337 nm, Figure S12: PXRD patterns of CdBPTC after grinding, sensing, or soaking in water, Figure S13: Liquid luminescence spectra of CdBPTC/DMF suspensions with different concentrations of Cr3+ at room temperature, λex = 337 nm, Figure S14: Liquid luminescence spectra of CdBPTC/DMF suspensions with different concentrations of Tb3+ at room temperature, λex = 337 nm, Figure S15: Liquid luminescence spectra of CdBPTC/DMF suspensions with different concentrations of Eu3+ at room temperature, λex = 337 nm, Figure S16: Liquid luminescence spectra of CdBPTC/DMF suspensions with different concentrations of La3+ at room temperature, λex = 337 nm, Figure S17: Liquid luminescence spectra of CdBPTC/DMF suspensions with different concentrations of Mn2+ at room temperature, λex = 337 nm, Figure S18: Liquid luminescence spectra of CdBPTC/DMF suspensions with different concentrations of Zn2+ at room temperature, λex = 337 nm, Figure S19: Liquid luminescence spectra of CdBPTC/DMF suspensions with different concentrations of Fe2+ at room temperature, λex = 337 nm, Figure S20: Solid UV–Vis spectra of CdBPTC and H4BPTC ligand, Figure S21: UV–Vis absorption spectra of Fe3+ aqueous solutions with different concentrations, Figure S22: UV–Vis absorption spectra of different metal cations in aqueous solutions (1 × 10⁻³ mol·L−1), Table S1: Selected bond lengths (Å) and bond angles (°) of CdBPTC.

Author Contributions

Conceptualization, H.C. and L.-L.X.; methodology, L.-L.X.; software, G.-W.W.; validation, L.-L.X., Q.-F.Z. and G.-W.W.; formal analysis, Q.-F.Z. and D.W.; investigation, H.C., L.-L.X. and D.W.; resources, L.-L.X. and H.C.; data curation, L.-L.X., Q.-F.Z. and D.W.; writing—original draft preparation, L.-L.X. and Q.-F.Z.; writing—review and editing, H.C.; visualization, H.C. and L.-L.X.; supervision, L.-L.X. and H.C.; project administration, L.-L.X.; funding acquisition, L.-L.X. and H.C. All authors have read and agreed to the published version of the manuscript.

Funding

This work was financially supported by the National Natural Science Foundation of China (21901055 and 21701038), the Natural Science Foundation of Guandong Province (2019A1515011974), the Special Projects in Key Fields of Colleges and Universities in Guangdong Province (2021ZDZX2065), the Scientific Research Funds of Hanshan Normal University (XN201917), and Guangdong Provincial Key Laboratory of Functional Substances in Medicinal Edible Resources and Healthcare Products (2021B1212040015).

Institutional Review Board Statement

Not applicable.

Informed Consent Statement

Not applicable.

Data Availability Statement

The data presented in this study are available in supplementary material.

Acknowledgments

The authors are grateful to Hanshan Normal University for the necessary research works and instruments.

Conflicts of Interest

The authors declare no conflict of interest.

Sample Availability

Samples of the compounds are not available from the authors.

References

  1. Chen, D.M.; Zhang, N.N.; Liu, C.S.; Du, M. Template-directed synthesis of a luminescent Tb-MOF material for highly selective Fe3+ and Al3+ ion detection and VOC vapor sensing. J. Mater. Chem. C 2017, 5, 2311–2317. [Google Scholar] [CrossRef]
  2. Yu, C.; Sun, X.; Zou, L.; Li, G.; Zhang, L.; Liu, Y. A pillar-layered Zn-LMOF with uncoordinated carboxylic acid sites: High performance for luminescence sensing Fe3+ and TNP. Inorg. Chem. 2019, 58, 4026–4032. [Google Scholar] [CrossRef]
  3. Wang, J.; Yu, M.; Chen, L.; Li, Z.; Li, S.; Jiang, F.; Hong, M. Construction of a stable lanthanide Metal-Organic Framework as a luminescentprobe for rapid naked-eye recognition of Fe3+ and acetone. Molecules 2021, 26, 1695. [Google Scholar] [CrossRef] [PubMed]
  4. Liu, F.; Theil, E.C. Ferritins: Dynamic Management of biological Iron and oxygen chemistry. Acc. Chem. Res. 2005, 38, 167–175. [Google Scholar] [CrossRef] [PubMed]
  5. Lv, R.; Chen, Z.; Fu, X.; Yang, B.; Li, H.; Su, J.; Gu, W.; Liu, X. A highly selective and fast-response fluorescent probe based on Cd-MOF for the visual detection of Al3+ ion and quantitative detection of Fe3+ ion. J. Solid State Chem. 2018, 259, 67–72. [Google Scholar] [CrossRef]
  6. He, J.; Xu, J.; Yin, J.; Li, N.; Bu, X.H. Recent advances in luminescent metal-organic frameworks for chemical sensors. Sci. China Mater. 2019, 62, 1655–1678. [Google Scholar] [CrossRef] [Green Version]
  7. Pamei, M.; Puzari, A. Luminescent transition metal–organic frameworks: An emerging sensor for detecting biologically essential metal ions. Nano-Struct. Nano-Objects 2019, 19, 100364. [Google Scholar] [CrossRef]
  8. Zhang, Y.; Yuan, S.; Day, G.; Wang, X.; Yang, X.; Zhou, H.-C. Luminescent sensors based on metal-organic frameworks. Coord. Chem. Rev. 2018, 354, 28–45. [Google Scholar] [CrossRef]
  9. Fang, X.; Zong, B.; Mao, S. Metal–Organic Framework-based sensors for environmental contaminant sensing. Nano-Micro Lett. 2018, 10, 64. [Google Scholar] [CrossRef] [Green Version]
  10. Zhang, Q.; Wang, J.; Kirillov, A.M.; Dou, W.; Xu, C.; Xu, C.; Yang, L.; Fang, R.; Liu, W. Multifunctional Ln–MOF luminescent probe for efficient sensing of Fe3+, Ce3+, and acetone. ACS Appl. Mater. Inter. 2018, 10, 23976–23986. [Google Scholar] [CrossRef]
  11. Yao, Z.Q.; Xu, J.; Zou, B.; Hu, Z.; Wang, K.; Yuan, Y.J.; Chen, Y.P.; Feng, R.; Xiong, J.B.; Hao, J. A dual-stimuli-responsive coordination network featuring reversible wide-range luminescence-tuning behavior. Angew. Chem. Int. Ed. 2019, 58, 5614–5618. [Google Scholar] [CrossRef]
  12. Wang, Q.; Astruc, D. State of the art and prospects in Metal–Organic Framework (MOF)-based and MOF-derived nanocatalysis. Chem. Rev. 2020, 120, 1438–1511. [Google Scholar] [CrossRef]
  13. Zeng, H.; Xie, M.; Wang, T.; Wei, R.J.; Xie, X.J.; Zhao, Y.; Lu, W.; Li, D. Orthogonal-array dynamic molecular sieving of propylene/propane mixtures. Nature 2021, 595, 542–548. [Google Scholar] [CrossRef] [PubMed]
  14. Huang, Y.L.; Qiu, P.L.; Bai, J.P.; Luo, D.; Lu, W.; Li, D. Exclusive recognition of acetone in a luminescent BioMOF through multiple hydrogen-bonding interactions. Inorg. Chem. 2019, 58, 7667–7671. [Google Scholar] [CrossRef] [PubMed]
  15. Du, J.J.; Zhang, X.; Zhou, X.P.; Li, D. Robust heterometallic MOF catalysts for the cyanosilylation of aldehydes. Inorg. Chem. Front. 2018, 5, 2772–2776. [Google Scholar] [CrossRef]
  16. Wang, X.N.; Zhang, P.; Kirchon, A.; Li, J.L.; Chen, W.M.; Zhao, Y.M.; Li, B.; Zhou, H.C. Crystallographic visualization of postsynthetic nickel clusters into Metal–Organic Framework. J. Am. Chem. Soc. 2019, 141, 13654–13663. [Google Scholar] [CrossRef]
  17. Bhardwaj, N.; Bhardwaj, S.K.; Mehta, J.; Kim, K.H.; Deep, A. MOF–bacteriophage biosensor for highly sensitive and specific detection of staphylococcus aureus. ACS Appl. Mater. Inter. 2017, 9, 33589–33598. [Google Scholar] [CrossRef]
  18. Cai, H.; Huang, Y.L.; Li, D. Biological metal-organic frameworks: Structures, host-guest chemistry and bio-applications. Coord. Chem. Rev. 2019, 378, 207–221. [Google Scholar] [CrossRef]
  19. Hou, S.L.; Dong, J.; Jiang, X.L.; Jiao, Z.H.; Wang, C.M.; Zhao, B. Interpenetration-dependent luminescent probe in Indium-Organic Frameworks for selectively detecting nitrofurazone in water. Anal. Chem. 2018, 90, 1516–1519. [Google Scholar] [CrossRef] [PubMed] [Green Version]
  20. Xu, L.L.; Zhang, H.F.; Li, M.A.; Ng, S.W.; Feng, J.H.; Mao, J.G.; Li, D. Chiroptical activity from an achiral biological Metal-Organic Framework. J. Am. Chem. Soc. 2018, 140, 11569–11572. [Google Scholar] [CrossRef]
  21. Ryu, U.; Jee, S.; Rao, P.C.; Shin, J.; Ko, C.; Yoon, M.; Park, K.S.; Choi, K.M. Recent advances in process engineering and upcoming applications of metal-organic frameworks. Coord. Chem. Rev. 2021, 426, 213544. [Google Scholar] [CrossRef]
  22. Yuan, Y.; Zhu, G. Porous aromatic frameworks as a platform for multifunctional applications. ACS Central Sci. 2019, 5, 409–418. [Google Scholar] [CrossRef] [PubMed] [Green Version]
  23. Yuan, Y.; Yang, Y.; Ma, X.; Meng, Q.; Wang, L.; Zhao, S.; Zhu, G. Molecularly imprinted porous aromatic frameworks and their composite components for celective extraction of uranium ions. Adv. Mater. 2018, 30, 1706507. [Google Scholar] [CrossRef] [PubMed]
  24. Yang, Y.; Yan, Z.; Wang, L.; Meng, Q.; Yuan, Y.; Zhu, G. Constructing synergistic groups in porous aromatic frameworks for the selective removal and recovery of lead(II) ions. J. Mater. Chem. A 2018, 6, 5202–5207. [Google Scholar] [CrossRef]
  25. Tian, X.M.; Yao, S.L.; Qiu, C.Q.; Zheng, T.F.; Chen, Y.-Q.; Huang, H.; Chen, J.-L.; Liu, S.-J.; Wen, H.-R. Turn-on luminescent sensor toward Fe3+, Cr3+, and Al3+ based on a Co(II) Metal–Organic Framework with open functional sites. Inorg. Chem. 2020, 59, 2803–2810. [Google Scholar] [CrossRef]
  26. Fu, C.; Sun, X.; Zhang, G.; Shi, P.; Cui, P. Porphyrin-based Metal–Organic Framework probe: Highly selective and sensitive fluorescent turn-on sensor for M3+ (Al3+, Cr3+, and Fe3+) ions. Inorg. Chem. 2021, 60, 1116–1123. [Google Scholar] [CrossRef] [PubMed]
  27. Dang, S.; Ma, E.; Sun, Z.M.; Zhang, H. A layer-structured Eu-MOF as a highly selective fluorescent probe for Fe3+ detection through a cation-exchange approach. J. Mater. Chem. 2012, 22, 16920–16926. [Google Scholar] [CrossRef]
  28. Spek, A. Single-crystal structure validation with the program PLATON. J. Appl. Crystallogr. 2003, 36, 7–13. [Google Scholar] [CrossRef] [Green Version]
  29. Wei, W.; Lu, R.; Tang, S.; Liu, X. Highly cross-linked fluorescent poly(cyclotriphosphazene-co-curcumin) microspheres for the selective detection of picric acid in solution phase. J. Mater. Chem. A 2015, 3, 4604–4611. [Google Scholar] [CrossRef]
  30. Weng, H.; Yan, B. A flexible Tb(III) functionalized cadmium metal organic framework as fluorescent probe for highly selectively sensing ions and organic small molecules. Sens. Actuators B Chem. 2016, 228, 702–708. [Google Scholar] [CrossRef]
  31. Zhao, D.; Liu, X.H.; Zhao, Y.; Wang, p.; Liu, Y.; Azam, M.; Al-Resayes, S.I.; Lu, Y.; Sun, W.Y. Luminescent Cd (II)–organic frameworks with chelating NH2 sites for selective detection of Fe (III) and antibiotics. J. Mater. Chem. A 2017, 5, 15797–1580732. [Google Scholar] [CrossRef]
  32. Wang, L.; Yao, Z.Q.; Ren, G.J.; Han, S.D.; Hu, T.L.; Bu, X.H. A luminescent metal–organic framework for selective sensing of Fe3+ with excellent recyclability. Inorg. Chem. Commun. 2016, 65, 9–12. [Google Scholar] [CrossRef]
  33. Hu, F.l.; Shi, Y.X.; Chen, H.H.; Lang, J.P. A Zn (II) coordination polymer and its photocycloaddition product: Syntheses, structures, selective luminescence sensing of iron (III) ions and selective absorption of dyes. Dalton Trans. 2015, 44, 18795–18803. [Google Scholar] [CrossRef]
  34. Chen, M.; Xu, W.M.; Tian, J.Y.; Cui, H.; Zhang, J.X.; Liu, C.S.; Du, M. A Terbium(III) lanthanide–organic framework as a platform for a recyclable multi-responsive luminescent sensor. J. Mater. Chem. C 2017, 5, 2015–2021. [Google Scholar] [CrossRef]
  35. Yang, C.X.; Ren, H.B.; Yan, X.P. Fluorescent Metal–Organic Framework MIL-53(Al) for highly selective and sensitive detection of Fe3+ in aqueous solution. Anal. Chem. 2013, 85, 7441–7446. [Google Scholar] [CrossRef] [PubMed]
  36. Zhang, S.T.; Yang, J.; Wu, H.; Liu, Y.Y.; Ma, J.F. Systematic Investigation of high-sensitivity luminescent sensing for polyoxometalates and iron(III) by MOFs assembled with a new resorcin[4] arene-Functionalized Tetracarboxylate. Chem. Eur. J. 2015, 21, 15806–15819. [Google Scholar] [CrossRef]
  37. Hübschle, C.B.; Sheldrick, G.M.; Dittrich, B. ShelXle: A Qt graphical user interface for SHELXL. J. Appl. Crystallogr. 2011, 44, 1281–1284. [Google Scholar] [CrossRef] [Green Version]
  38. Sheldrick, G. A short history of SHELX. Acta Crystallogr. A 2008, 64, 112–122. [Google Scholar] [CrossRef] [PubMed] [Green Version]
Figure 1. The asymmetric unit of CdBPTC (Cd, magenta; O, red; C, black) (a) and its polyhedral view of the 3D structure along b axis (b) and c axis (c).
Molecules 26 06847 g001
Figure 2. The simplified four-connected node of the mononuclear Cd2+ unit (a) and two 3-connected linkers (b). The (4, 3, 3)-connected topological along b axis (c) and c axis (d).
Molecules 26 06847 g002
Figure 3. Excitation and emission spectra of CdBPTC, the insert shows samples under sunlight (left) and the ultraviolet light at 365 nm (right) (a), and the corresponding CIE chromaticity diagram showing the luminescence colors of CdBPTC (b).
Molecules 26 06847 g003
Figure 4. (a) The relative luminescence intensity of CdBPTC/DMF suspensions at room temperature after adding different metal ions, λex = 337 nm; (b) relative fluorescence intensity of CdBPTC + Mn+ and CdBPTC + Mn+ + Fe3+ at 427 nm (λex = 337 nm, M was Na+, Ca2+, Mg2+, Ba2+, Cd2+, Zn2+, Mn2+, Co2+, Ni2+, Pb2+, Cu2+, La3+, Al3+, and Fe3+, respectively).
Molecules 26 06847 g004
Figure 5. Liquid luminescence spectra of CdBPTC presenting turn-on (a) and turn-off (b) fluorescence signals with different concentrations of Fe3+ at room temperature, λex = 337 nm.; (c) quenching efficiency; (d) Stern–Volmer plot for the fluorescence intensity of CdBPTC after adding Fe3+.
Molecules 26 06847 g005
Table 1. Crystal data and structure refinement results for CdBPTC.
CompoundCdBPTC
Empirical formulaC16H6CdO8
Formula weight438.61
Temperature (K)100.15
Crystal systemTetragonal
Space groupI41cd
a20.07520 (10)
c36.7826 (3)
Volume (Å3)14,823.89 (19)
Z16
ρcalc (g·cm−3)0.786
μ (mm−1)4.897
F (000)3424.0
Independent reflections5869 [Rint = 0.0332]
Data/restraints/parameters5869/25/215
Goodness of fit on F21.087
R1 [I ≥ 2σ(I)] a0.0399
wR2 [all data] b0.1365
Flack parameter0.478 (16)
CCDC number2,112,156
a R1 = Σ(||F0| − |Fc||)/Σ|F0|; b wR2 = [Σw(F02Fc2)2w(F02)2]1/2.
Publisher’s Note: MDPI stays neutral with regard to jurisdictional claims in published maps and institutional affiliations.

