Article

Deposition of Hybrid Photocatalytic Layers for Air Purification Using Commercial TiO2 Powders

by
Ewoud Cosaert
1,
Cédric Wolfs
2,
Stéphanie D. Lambert
2,
Geraldine J. Heynderickx
3 and
Dirk Poelman
1,*
1
LumiLab, Department of Solid State Sciences, Ghent University, 9000 Ghent, Belgium
2
Nanomaterials, Catalysis & Electrochemistry, Department of Chemical Engineering, University of Liège, 4000 Liège, Belgium
3
Laboratory for Chemical Technology, Ghent University, 9000 Ghent, Belgium
*
Author to whom correspondence should be addressed.
Molecules 2021, 26(21), 6584; https://doi.org/10.3390/molecules26216584
Submission received: 15 September 2021 / Revised: 25 October 2021 / Accepted: 28 October 2021 / Published: 30 October 2021
(This article belongs to the Special Issue Hybrid Materials for Advanced Applications)

Abstract

:
Photocatalytic nanomaterials, using only light as the source of excitation, have been developed for the breakdown of volatile organic compounds (VOCs) in air for a long time. It is a tough challenge to immobilize these powder photocatalysts and prevent their entrainment with the gas stream. Conventional methods for making stable films typically require expensive deposition equipment and only allow the deposition of very thin layers with limited photocatalytic performance. The present work presents an alternative approach, using the combination of commercially available photocatalytic nanopowders and a polymer or inorganic sol–gel-based matrix. Analysis of the photocatalytic degradation of ethanol was studied for these layers on metallic substrates, proving a difference in photocatalytic activity for different types of stable layers. The sol–gel-based TiO 2 layers showed an improved photocatalytic activity of the nanomaterials compared with the polymer TiO 2 layers. In addition, the used preparation methods require only a limited amount of photocatalyst, little equipment, and allow easy upscaling.

1. Introduction

It has been known for several decades that exposure to volatile organic compounds (VOCs) forms a risk for human health [1], including the so-called sick-building syndrome [2]. VOCs originating from building materials can cause headache, nausea, and irritation of the throat, but also can result in increased fatigue and neurological symptoms, such as concentration difficulty and depression. Some VOCs, such as benzene and formaldehyde, are even carcinogenic [3]. VOCs are emitted from paints, cleaning chemicals, furniture, textiles, etc. [4]. Since humans spend a lot of their time indoors, this is an important issue to solve.
Ever since the discovery of the photocatalytic water splitting property of titanium dioxide ( TiO 2 ) electrodes by Fujishima and Honda in 1972 [5], this phenomenon has gained interest in many research fields, such as photo-oxidation/photodegradation of aqueous/gaseous pollutants, CO 2 reduction by photocatalysis, photocatalytic self-cleaning, and hydrogen production by the splitting of water [6].
TiO 2 is one of the most used and investigated materials for photocatalysis. It has a high oxidation efficiency, is nontoxic, has a high photostability, is chemically inert, and is environmentally friendly. Furthermore, Ti is widely available in the Earth’s crust, resulting in a low cost of TiO 2 [7]. Commercial TiO 2 is widely available in powder form. Depending on the application, this powder can be modified to meet specific requirements, such as high thermal stability, high photocatalytic activity, etc. Upon UV illumination of TiO 2 , electron–hole pairs are created. Reaction of the latter with the surrounding molecules, can result in the creation of radicals, which are able to decompose organic compounds. The band gap of the most common phases of TiO 2 , anatase and rutile, are 3.2 eV and 3.0 eV, respectively. In [8], a scheme of the valence band maximum and the conduction band minimum for different photocatalysts is shown. Since TiO 2 can only absorb UV light, which accounts for ca. 4% of the solar spectrum, the activities of TiO 2 are usually limited due to low solar energy utilization. For dedicated photocatalytic reactors using artificial light, UV light sources with a photon energy larger than that of TiO 2 are readily available, and both mercury discharge (‘blacklight’) lamps or LEDs—both emitting at 365 nm—are typically used. In addition, the fast charge recombination also often leads to low photocatalytic performance of TiO 2 . These shortcomings could be enhanced by doping TiO 2 with metal and nonmetal elements.
In this research, the photocatalytic activity of TiO 2 nanopowders from different suppliers is compared. In photocatalysis for air purification, it is a major challenge to immobilize the photocatalyst in such a way that it is not dragged away by the gas stream, especially in high flow velocities, such as exhausts, fume hoods, and ventilation systems. At the same time, the immobilized photocatalytic particles should remain in contact with the atmosphere and retain their large surface area. In this work, the powders are fixed onto Al substrates. The obtained thick powder layers enable the comparison between the different powders. From this comparison, a single type of TiO 2 powder is selected for further immobilization research, since the former layers are easily damaged. Different polymers are used for immobilization onto Al substrates, thus creating polymer/ TiO 2 hybrid layers. Additionally, sol–gel TiO 2 / TiO 2 powder hybrid layers are prepared to immobilize the nanopowder. The physical properties and photocatalytic degradation of all samples are measured and compared.

2. Materials and Methods

2.1. Materials

Table 1 provides an overview of the samples on Al substrates prepared in this research; the type of TiO 2 powder, the deposition method, and the sample names are mentioned.
Eight different TiO 2 powders were used for comparison: Aeroxide P25, Aeroxide P90, Aeroxide PF2, and Aeroxide T805 from Evonik Industries; Kronoclean 7000 and Kronoclean 7050 from Kronos; and CristalACTiV PC105 and CristalACTiV PC500 from Cristal—hereafter referred to as P25, P90, PF2, T805, K7000, K7050, PC105, and PC500, respectively. These powders were used as received, without any further purification or processing.
After the analysis of the photocatalytic activity of the TiO 2 powders, P25 was selected for investigating other immobilization methods, as explained later in the text. P25 TiO 2 was mixed with three types of polymer solutions: polyethylene glycol (PEG M.W. 20,000), polyvinylpyrrolidone (PVP M.W. 8000), and poly(methyl methacrylate) (PMMA M.W. 35,000). For dissolution of the polymers, acetone (≥99.5% for PMMA and PEG) or ethanol (≥99.8% for PVP) was used.
This P25 TiO 2 powder was also used for a hybrid sol–gel TiO 2 /P25 TiO 2 coating. For the preparation of this coating, 2-methoxyethanol (≥99.8%), titanium isopropoxide (TTIP) (≥97%), and distilled H 2 O were used. As a reference, sol–gel TiO 2 samples without the addition of P25 TiO 2 were synthesized.
For the photocatalytic activity measurements, the decomposition of absolute ethanol (≥99.9%) was studied.

2.2. Synthesis

For the comparison of the commercial TiO 2 powders, samples were prepared on aluminum substrates. First, the aluminum substrate was machined to remove a square of 2 cm × 2 cm with a depth of 100 μ m in the middle of the aluminum plate. Next, 0.3 g of TiO 2 powder was added to 300 μ L 1,2 propanediol [9] and mixed in a mortar until a homogeneous paste was obtained. This paste was then placed onto the aluminum substrate and spread in the depth profile of 100 μ m using a razor blade, so that it was fully filled with this TiO 2 paste. The samples were placed in an oven at 150 °C for two hours. This resulted in a thick (100 μ m) layer of TiO 2 powder, which was suitable for measurement. It should be noted, however, that these layers were prone to damage upon handling.
In order to prepare the hybrid layers, the polymers were first dissolved in acetone (for PMMA and PEG) or ethanol (for PVP). 3 g of polymer was dissolved in 120 mL solvent for an hour in an ultrasonic bath. Next, 0.5 g of P25 was added to each solution and again placed in an ultrasonic bath for 20 min. Aluminum substrates (76 mm × 26 mm) were dip-coated (DC) in these solutions using a Bungard BEL RDC21-K dip-coater, resulting in polymer/P25 TiO 2 hybrid layers. The following settings were used on the dip-coater: a downward moving speed of 200 mm/min (v d o w n _ d i p ), an upward moving speed of 60 mm/min (v u p _ d i p ), and a time (t d o w n ) of 1 min during which the substrate was inside the solution without moving. These samples with PEG, PVP, and PMMA were named PEG P25, PVP P25, and PMMA P25, respectively.
For the sol–gel-coated samples, first, 0.5 g of P25 TiO 2 powder was mixed with 24 mL of 2-methoxyethanol at 80 ° C using a magnetic stirrer overnight. Second, flasks covered with flexible laboratory film were purged with N 2 to remove air. A total 20 mL of 2-methoxyethanol and 4.6 mL of titanium isopropoxide (TTIP) was added to these flasks. The first solution was then injected into the latter solution. Finally, 0.6 mL of H 2 O + 2 mL 2-methoxyethanol was added to the solution, which was mixed for 30 min. Aluminum substrates (76 mm × 26 mm) were coated using either dip-coating, with the same settings as mentioned above, or spray-coating (SC) of one layer, using a Harder and Steenbeck airbrush with a 0.2 mm nozzle and air pressure of 3 bar, resulting in a sol–gel TiO 2 /P25 TiO 2 hybrid layer. These samples were named DC sol–gel P25 and SC sol–gel P25, respectively. The same process was also performed to synthesize the reference sol–gel TiO 2 samples, with the exception that no P25 TiO 2 powder was added. These reference samples were named DC sol–gel ref and SC sol–gel ref, respectively.

2.3. Experimental Methods

Powder X-ray diffraction (PXRD) measurements were performed on all TiO 2 powders in order to obtain information about the crystal structure of the samples. A Bruker D5000 θ– 2 θ diffractometer with Cu K α radiation ( λ = 0.154 nm, 40 kV, 40 mA) was used for these measurements, with 2 θ ranging from 10 ° –80 ° , a step size of 0.02 ° and a dwell time of 1.5 s per step. The data were analyzed with EVA software from Bruker (Billerica, MA, USA). Scherrer’s equation [10] was used to estimate crystallite sizes by determining the FWHM of the XRD peaks at 25 ° and 48 ° , taking into account the instrumental broadening. An average was calculated from these crystallite sizes.
Scanning electron microscopy (SEM) was performed to study the layer morphology using a FEI Quanta 200 F instrument at high vacuum. This technique was combined with energy dispersive X-ray spectroscopy (EDX) using EDAX Genesis 4000 hardware and software to identify the elements in the layers.
Diffuse reflectance measurements were performed using a Perkin Elmer Lambda 1050 UV-Vis-NIR spectrophotometer with an integrating sphere as detector. The measured diffuse reflectance spectra were converted to absorbance spectra using the Kubelka–Munk (K–M) transform [11].
The photocatalytic degradation of ethanol was measured with a stainless steel batch reactor (volume 8.75 L) connected to a Pfeiffer Vacuum GSD 301 C2 quadrupole mass spectrometer (QMS). A detailed description of this setup can be found in [12]. The samples were mounted inside this reactor on a heating stage, which was kept at 40 C during the measurements, to avoid temperature fluctuations by, e.g., the light source. A pumping system (rotary and turbomolecular pump, Pfeiffer Vacuum) was used for evacuating the stainless steel reactor, after which the latter was disconnected from these pumps by closing a valve. A gas mixture Ar/O 2 (80%/20%) was introduced up to a pressure of 1050 mbar, to create a slight overpressure and avoid air leaking in. Ethanol (6 μ L) was injected into the reactor chamber as the VOC, corresponding to a VOC concentration of 273 ppm. A small fan inside was responsible for circulation of the gas mixture. After stabilization during 1 h, the sample was irradiated by the light of a UV mercury high-pressure discharge lamp (100 W), which entered the reactor through a quartz window. This lamp emits UV light with dominant wavelengths 254 nm, 297 nm, 302 nm, 313 nm, 334 nm, and 365 nm, all suitable to activate TiO 2 (band gap for anatase, 3.2 eV; for rutile, 3.0 eV) [12]. The QMS then analyzed gas samples from the reactor chamber as a function of time. For the dip-coated and spray-coated samples, two coated aluminum slides were mounted simultaneously to increase the irradiated surface.
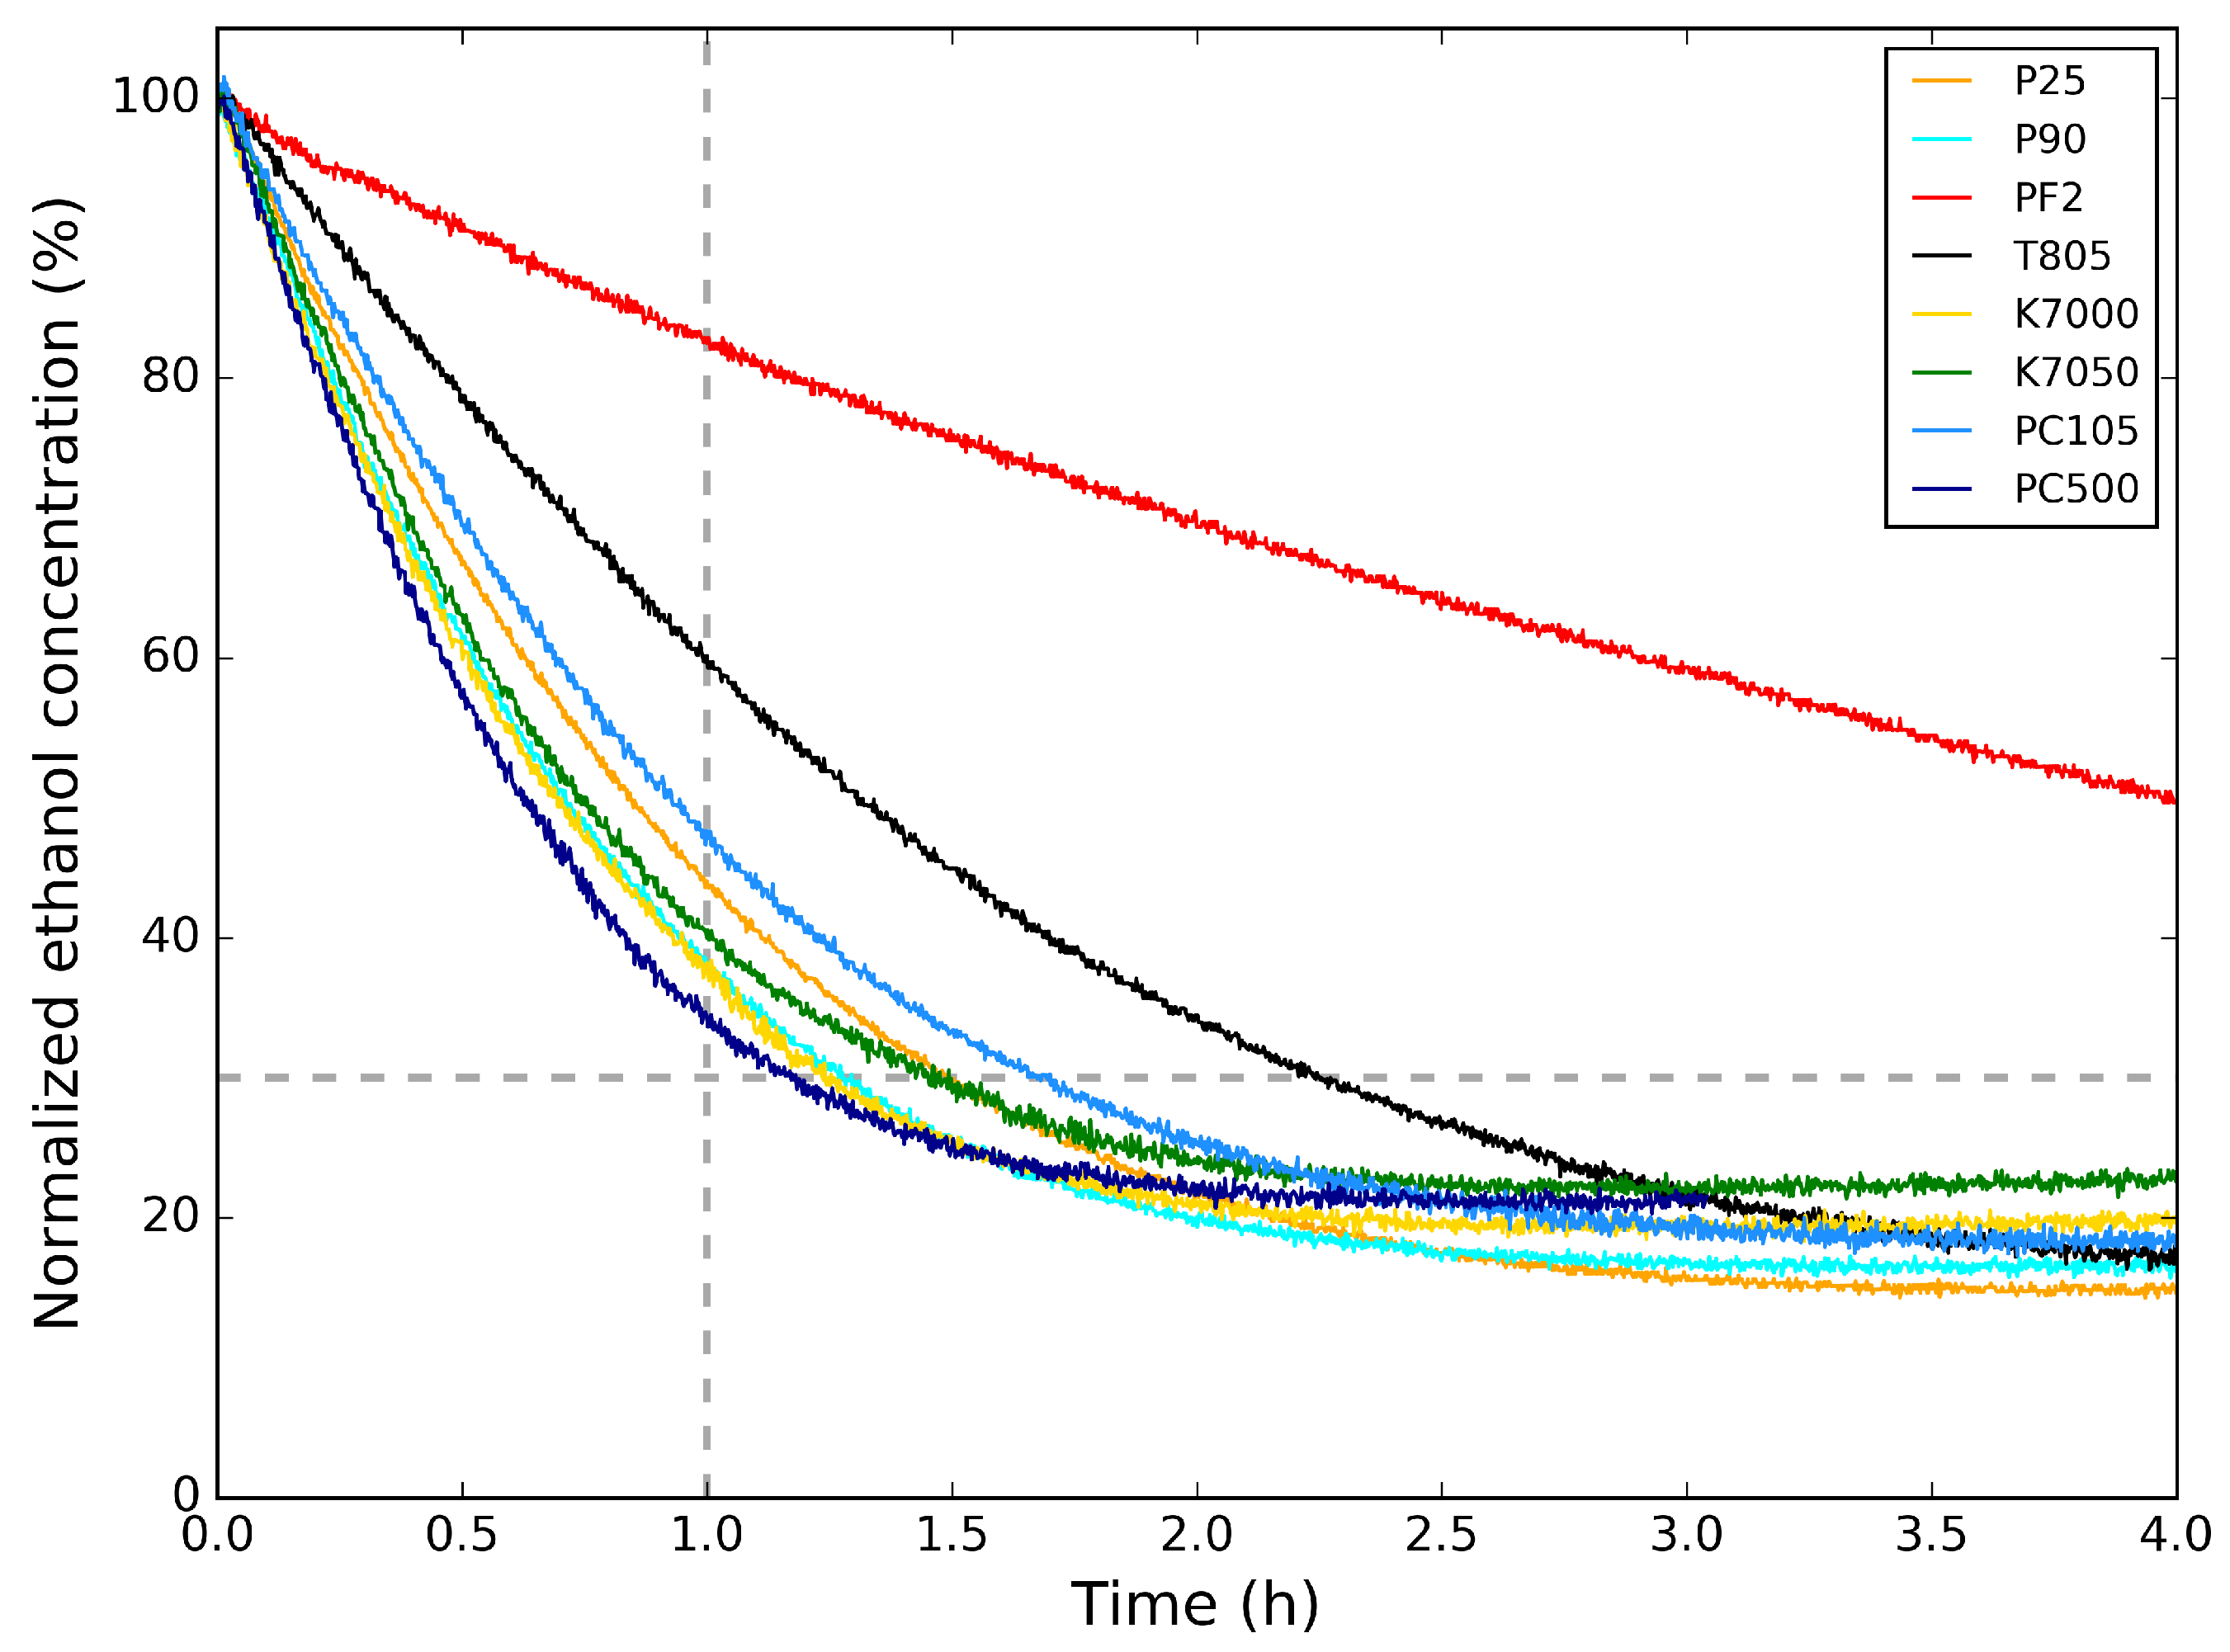
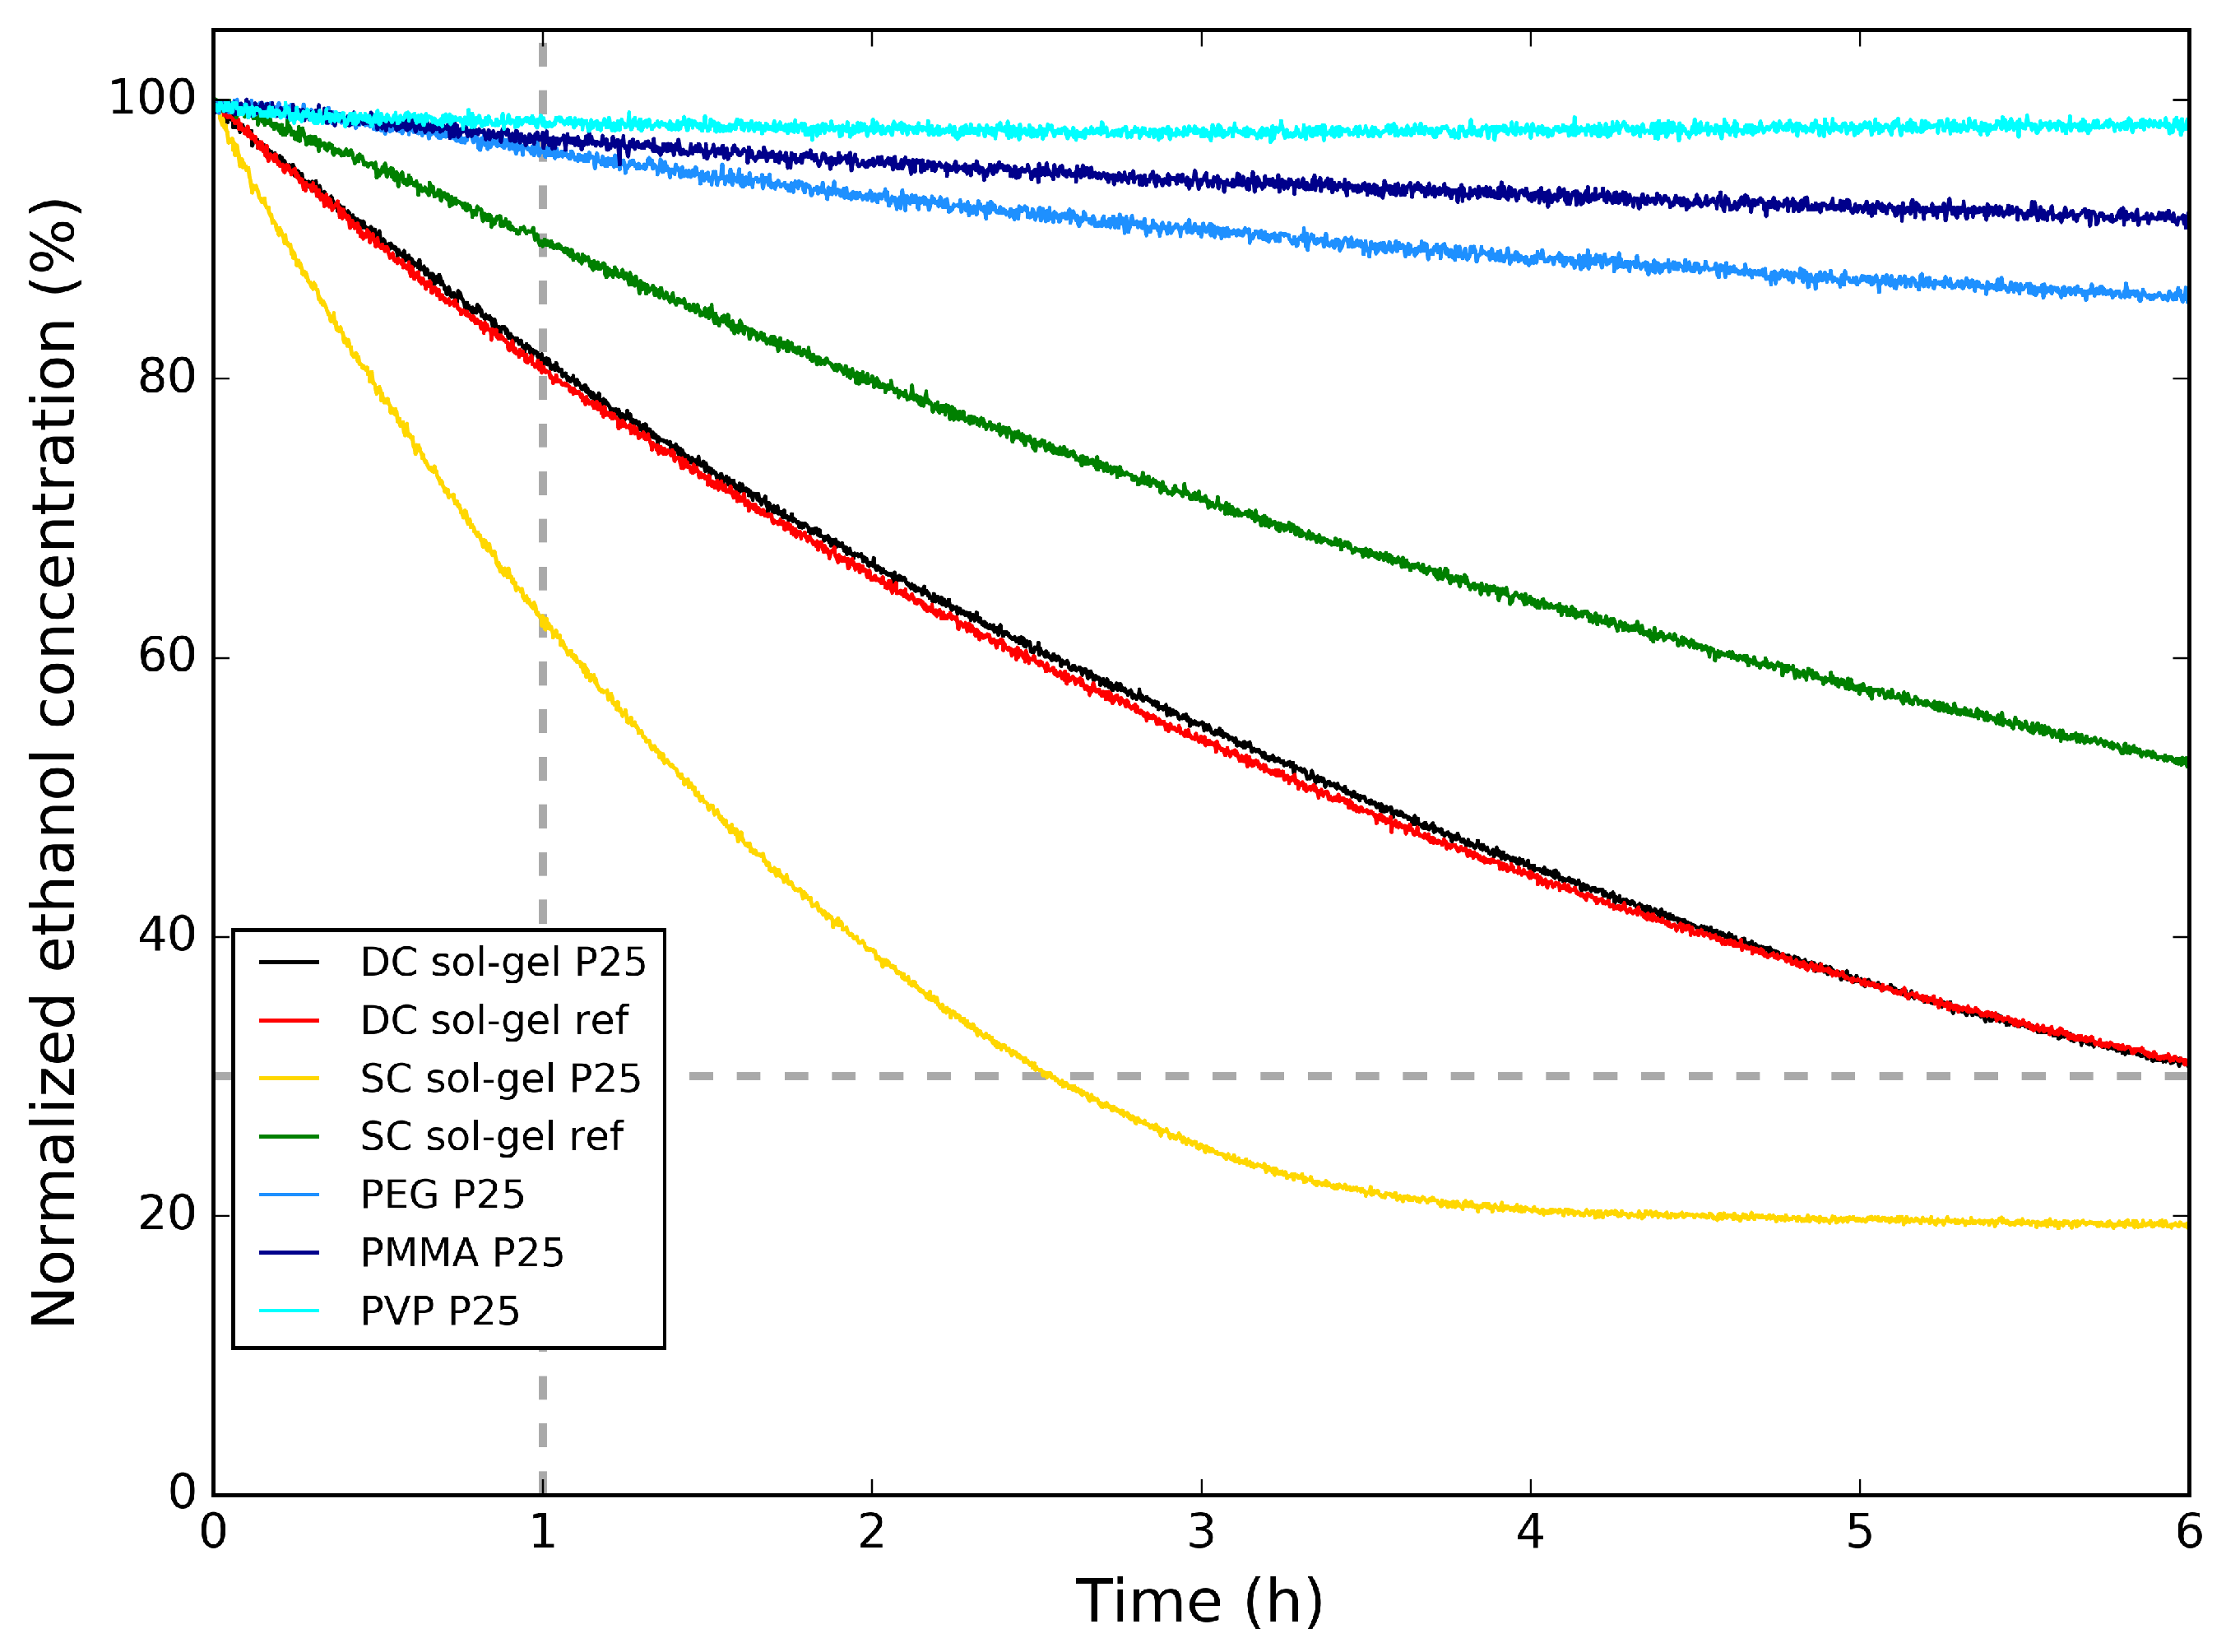
The degradation of ethanol was observed by measuring at the mass-to-charge ratio (m/z) at 45 amu. This measured signal from the QMS was corrected for the contribution of CO 2 to the 45-amu signal. This signal was divided by the signal from Ar (m/z = 40 amu) to correct for the decrease of the signal by the QMS, due to the continuous gas sampling from the reactor chamber. This ratio was then converted to normalized concentrations, displayed in the decomposition graphs in this work. For greater accuracy, only the parts of these graphs above 30% are considered for further analysis, indicated by a horizontal dashed line, since the contribution of CO 2 to the 45 amu signal is still nonzero after degradation. This still enables comparison of the photocatalytic activity of the different TiO 2 samples. In this research, the photocatalytic activity of different samples will be indicated by the normalized ethanol concentration in the reactor chamber 1 h after the start of the measurement, compared with the initial ethanol concentration. In the decomposition graphs, this is denoted by a vertical dashed line at 1 h.

3. Results and Discussion

3.1. TiO2 Powder Comparison

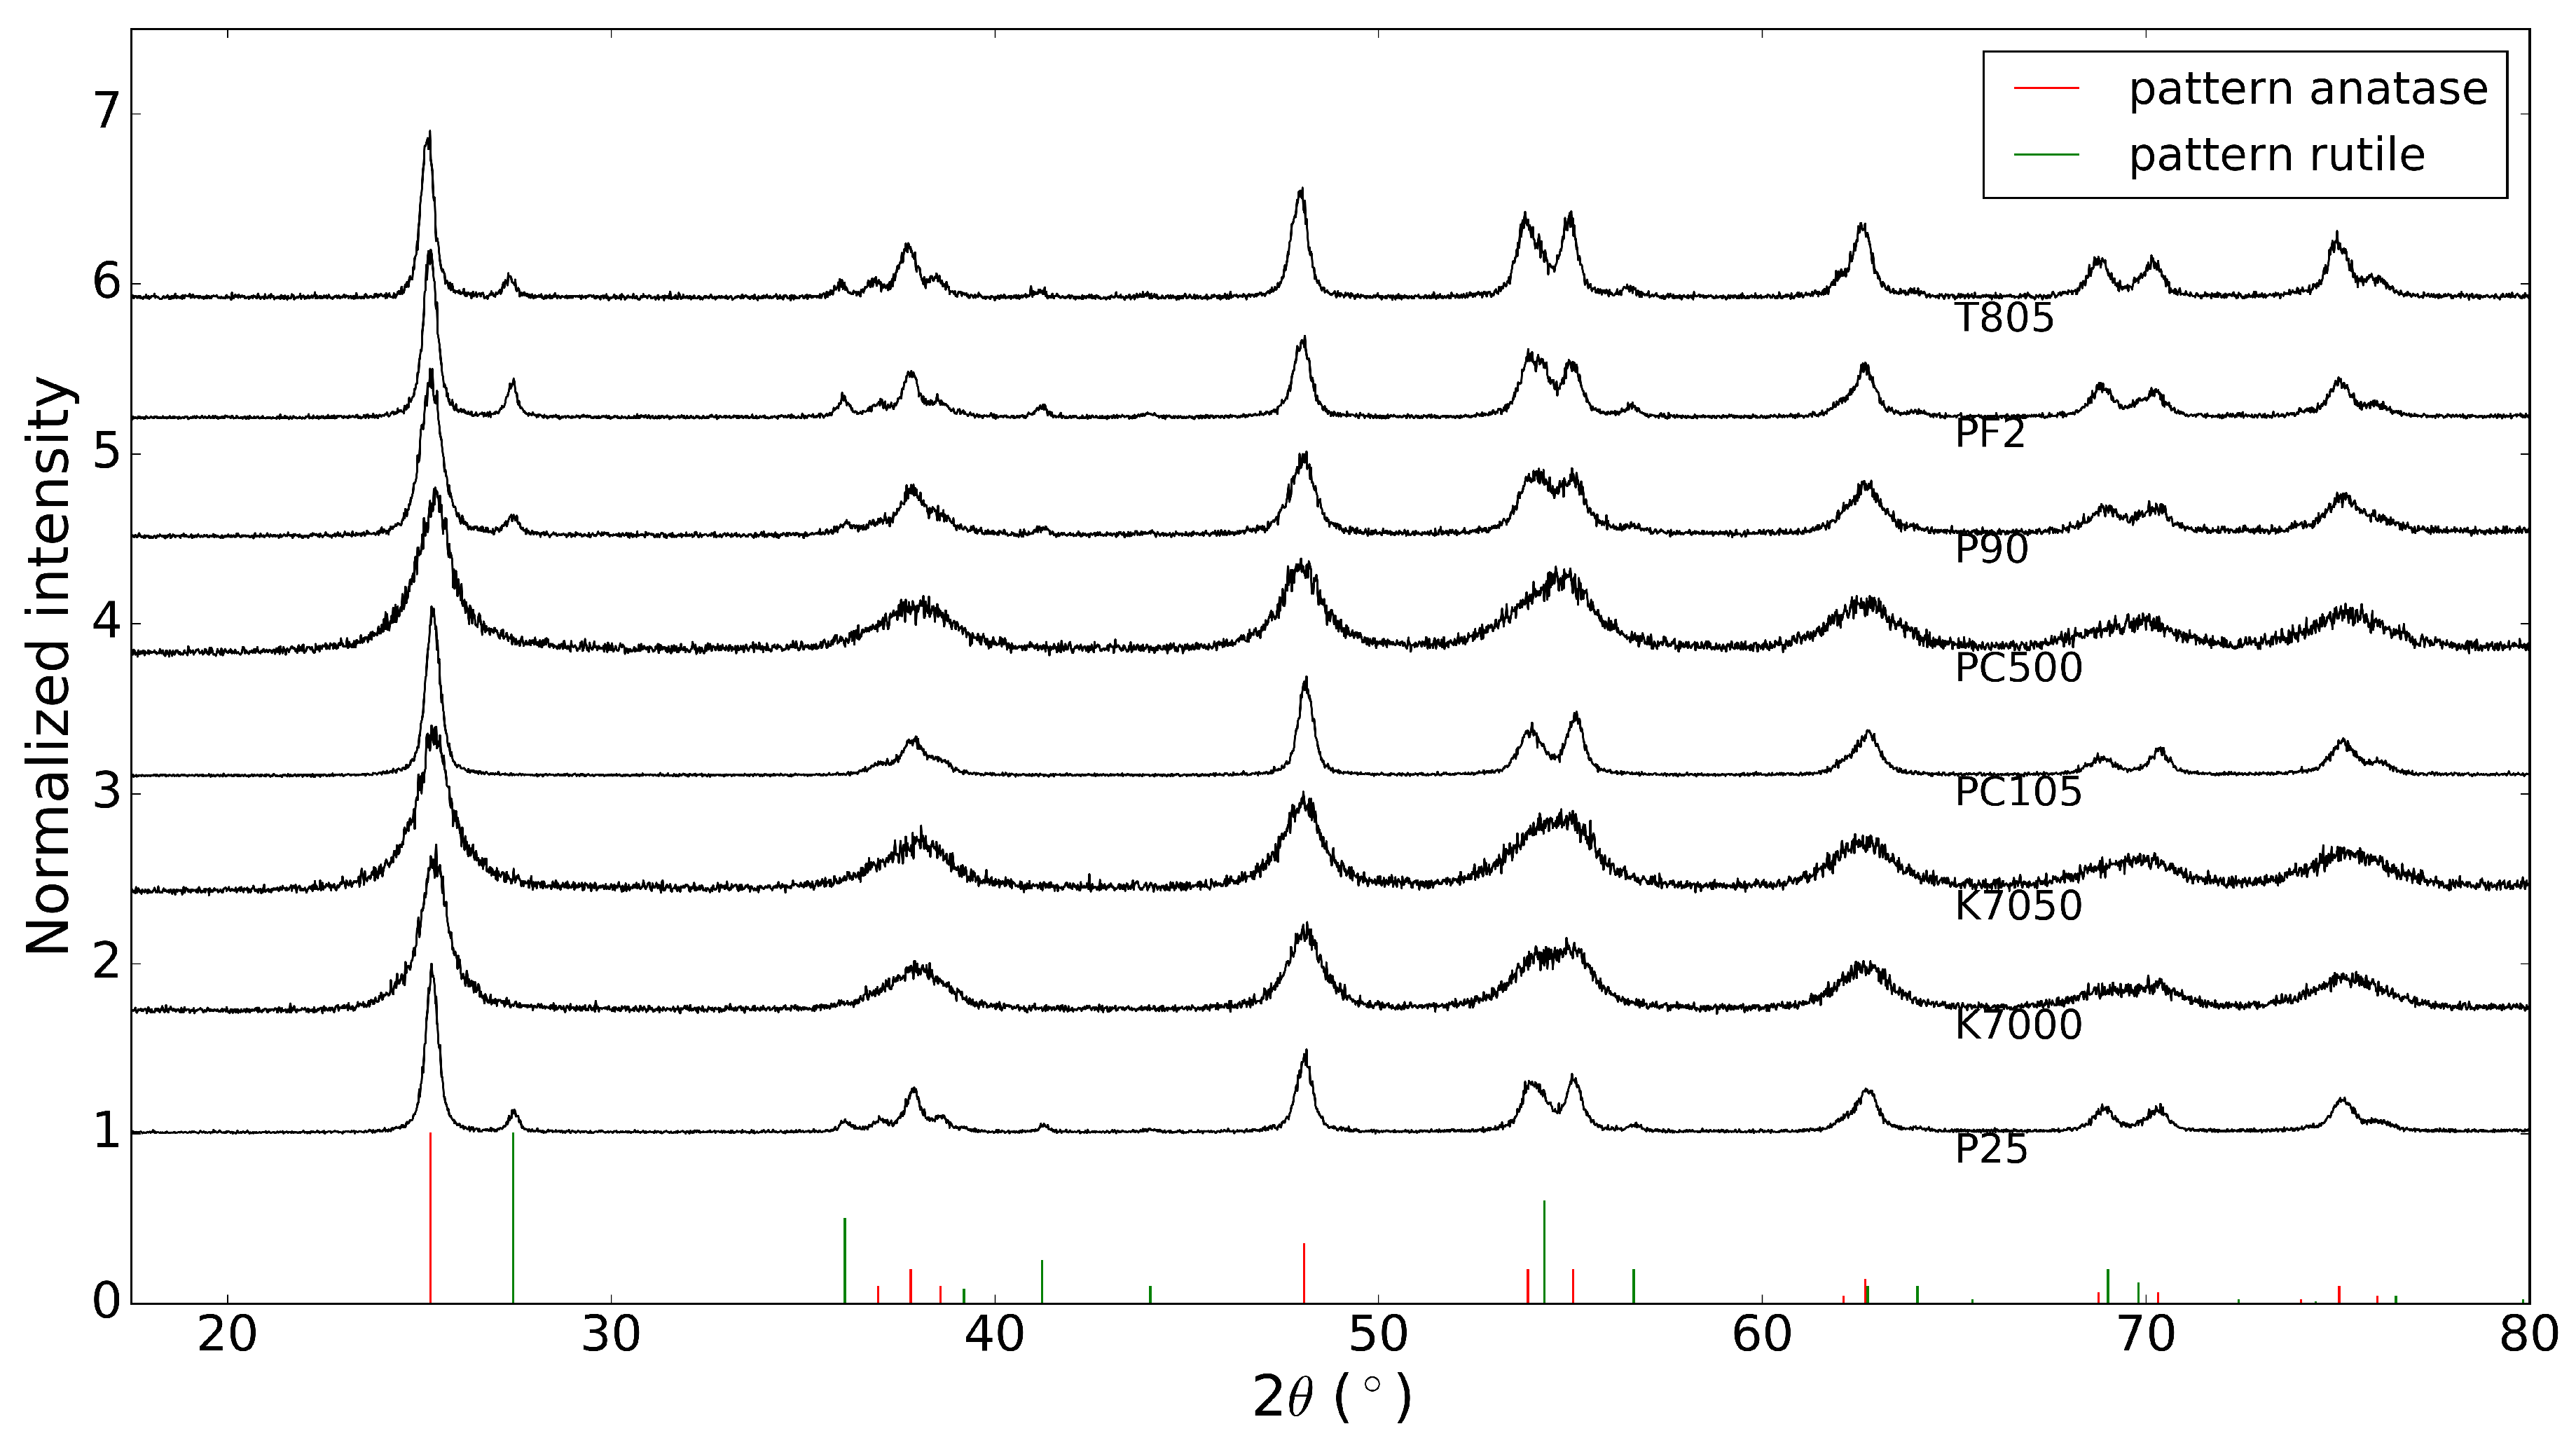
Before depositing the commercial TiO 2 powders on a substrate, the X-ray diffraction patterns of these ’raw’ powders were acquired. These results are shown in Figure 1, together with the database patterns of anatase and rutile, with PDF numbers 00-021-1272 and 00-021-1276, respectively [13]. It is clear that the TiO 2 powders from Evonik Industries indeed consist of a mixture of anatase and rutile, while the other powders are pure anatase, as stated by the manufacturers.
In Table 2, the estimation of the crystallite sizes from the Scherrer equation is shown, as well as the surface area of the powders, which is found in the product data sheets provided by the manufacturers. The Scherrer equation was applied to the XRD peaks with a 2 θ value of around 25 and 48 . As expected, larger crystallites correspond to lower surface area.
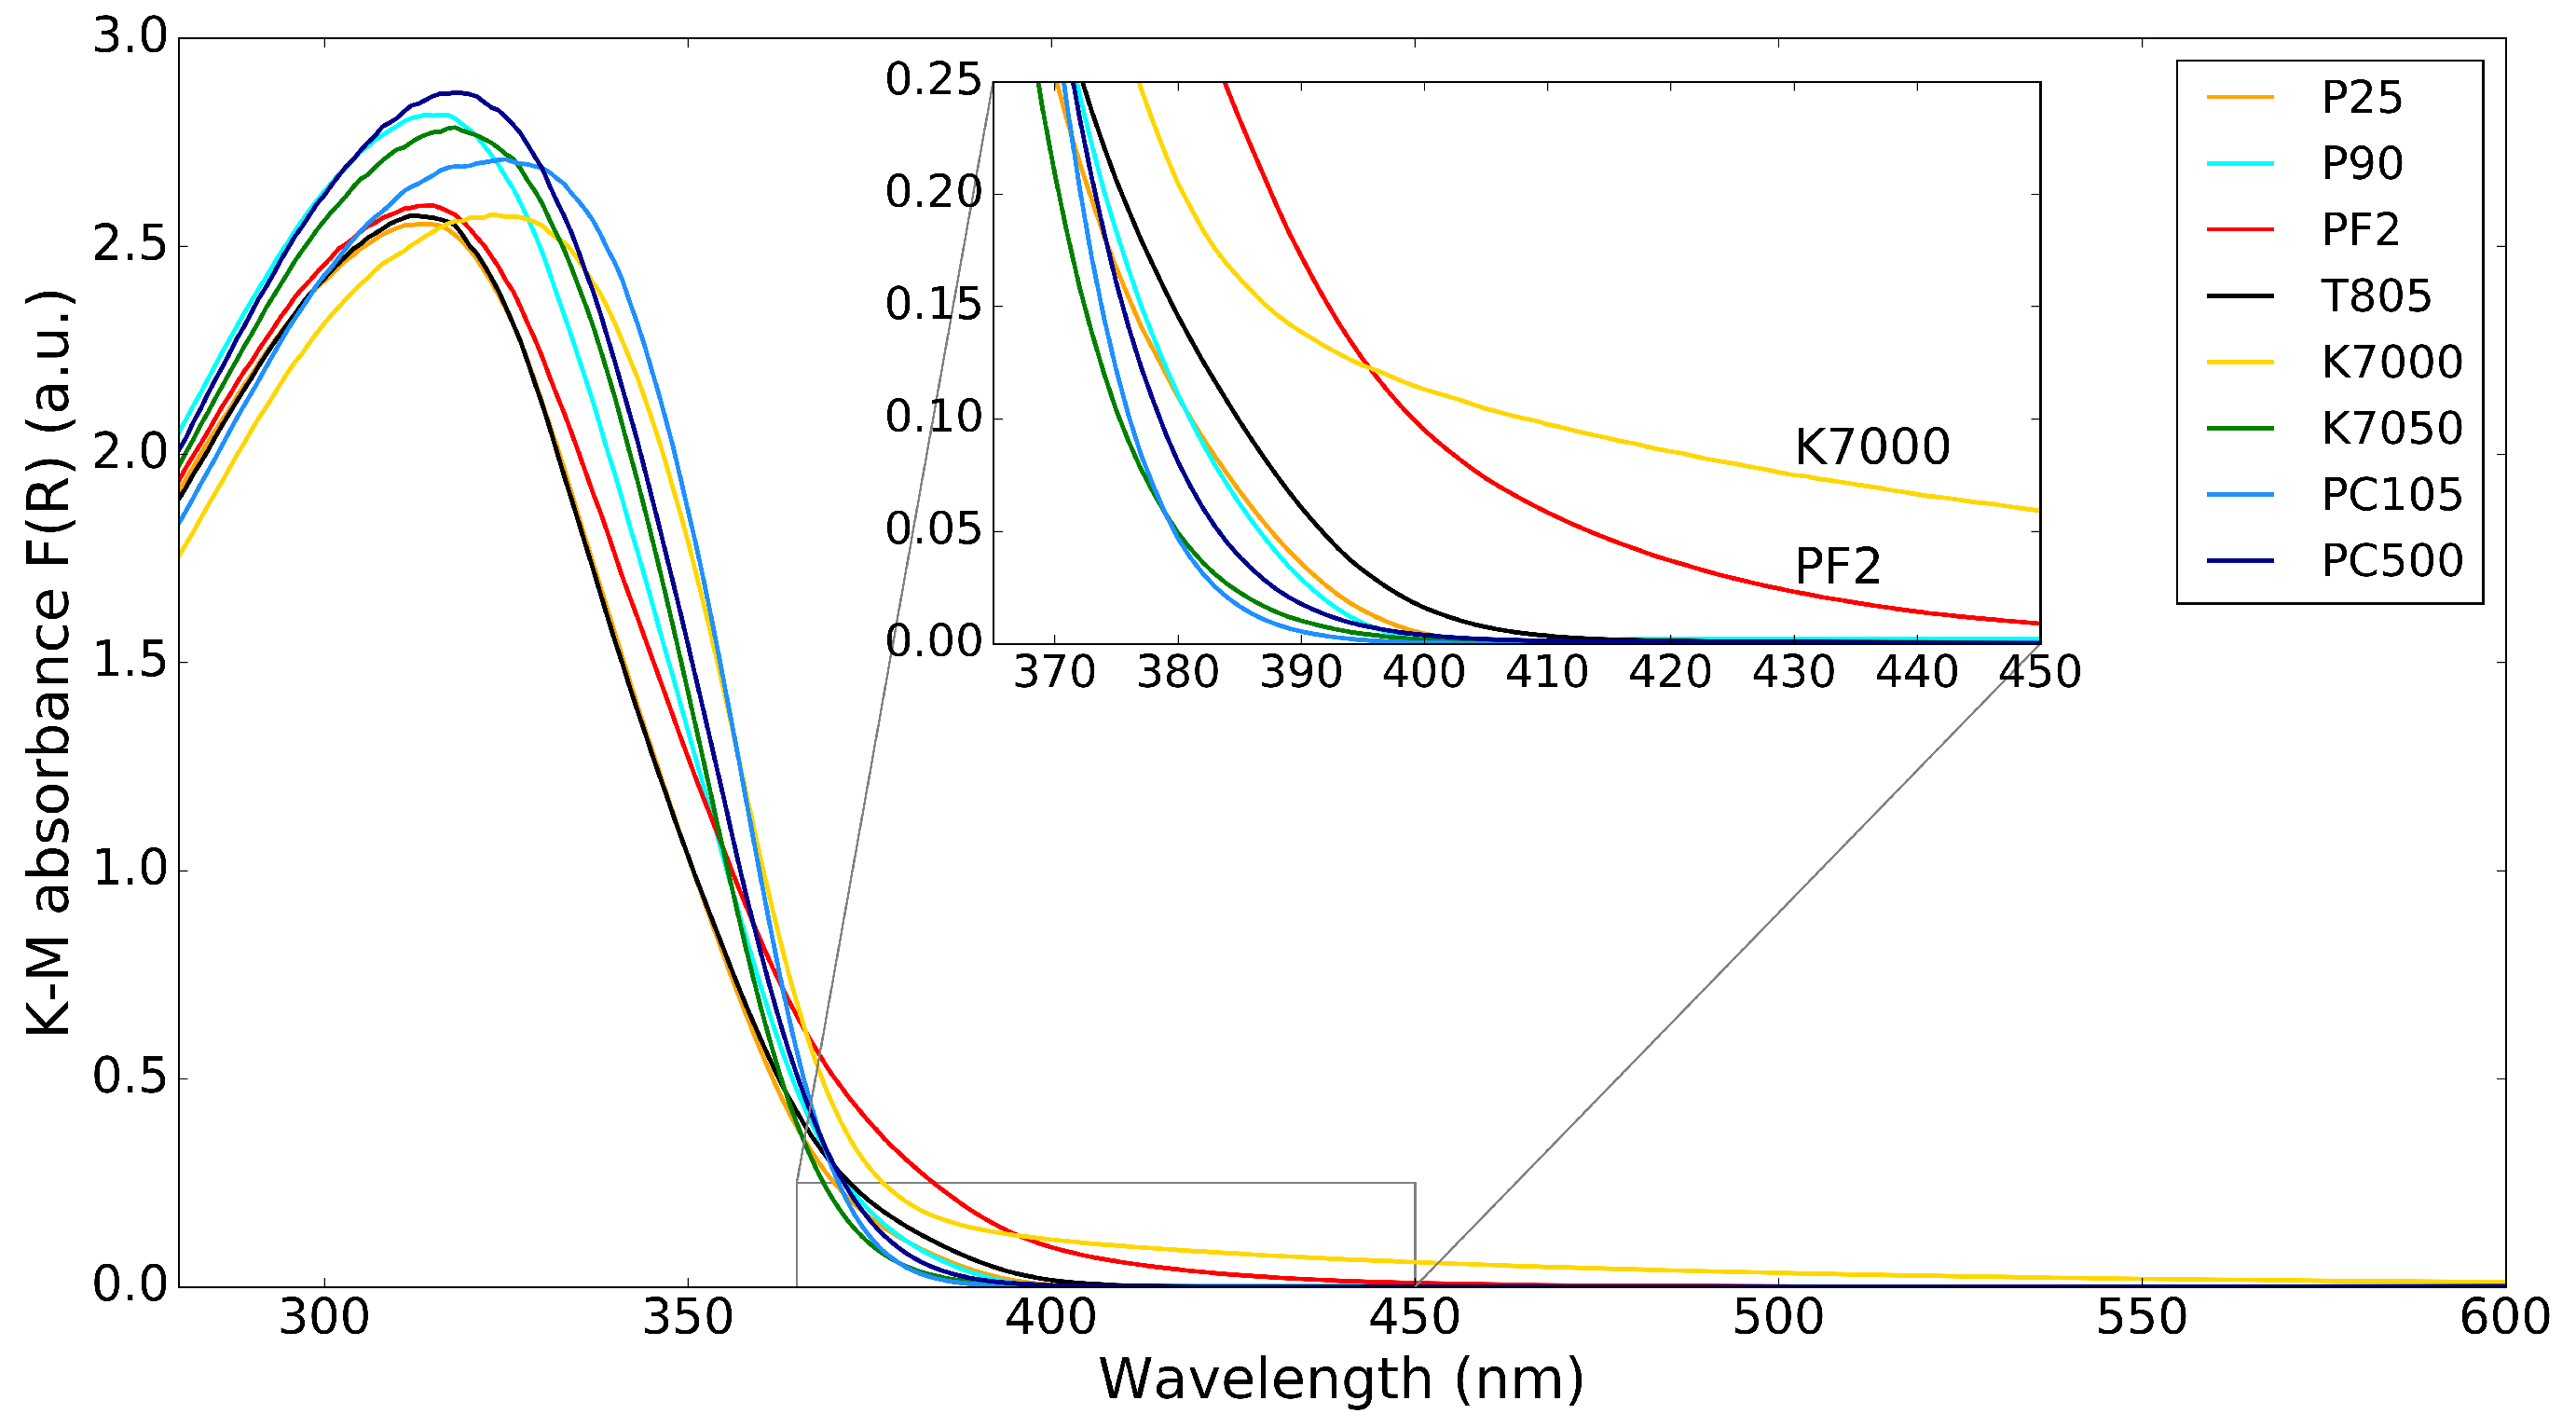
The K–M absorbance spectra of the commercial TiO 2 powders are shown in Figure 2, with an inset showing the absorbance in the lower wavelength part of the visible spectrum (364–450 nm) to highlight the absorption of visible light by the TiO 2 nanopowders. There are only small differences in absorbance of the different TiO 2 powders. The most interesting differences are for the K7000 and PF2 samples, which absorb some visible light up to 450 nm, as can be seen from the inset. The reason for this is that K7000 is TiO 2 with a carbon-modified surface, while PF2 is a mixture of TiO 2 and iron-oxide. This visible light absorption can be beneficial for visible light photocatalysis. It is common to try to increase the sensitivity of TiO 2 photocatalysts to visible light by doping with N or Fe [14]; Cu, Ni, Zn, or Pb [15], ZrO 2 [16]; and V, Nb, or Ta [17]. However, it is rare to find such doped photocatalysts in commercial nanopowders.
In Figure 3, the photocatalytic activity of the TiO 2 powders for the degradation of ethanol is shown. Here, the ethanol concentration is normalized to its initial concentration. In Table 3, the relative ethanol concentration values 1 h after the start of the photocatalytic degradation are listed. This is an indication of the photocatalysis rate of the TiO 2 samples. Comparing the photocatalytic degradation graphs and the values from Table 3 with the crystallite sizes in Table 2, it is clear that the TiO 2 powders with smaller crystallite sizes (PC500, P90, K7000, and K7050) induce a faster photocatalytic abatement of ethanol. The photocatalytic abatement for P25 and PC105, with larger crystallite sizes, is only slightly slower, indicating a subtle difference in photocatalytic activity. T805 and PF2 are less suitable for photocatalytic abatement of ethanol, with the former mostly applied as additive for toners for copiers and printers and the latter as heat stabilizer in silicones.
For the photocatalytic degradation of ethanol, both reproducibility and repeatability were studied to estimate the absolute error for the values in Table 3. For the former, the photocatalytic activity for different samples prepared using the same synthesis method was tested, while for the latter, the photocatalytic activity of the same sample was repeated. An absolute error for the percentage of normalized ethanol concentration after 1 h of photocatalytic degradation was estimated to 5% (Table 3), mostly related to the conditions of the experimental setup.

3.2. Polymer/TiO2 and Sol–Gel/TiO2 Hybrid Layers

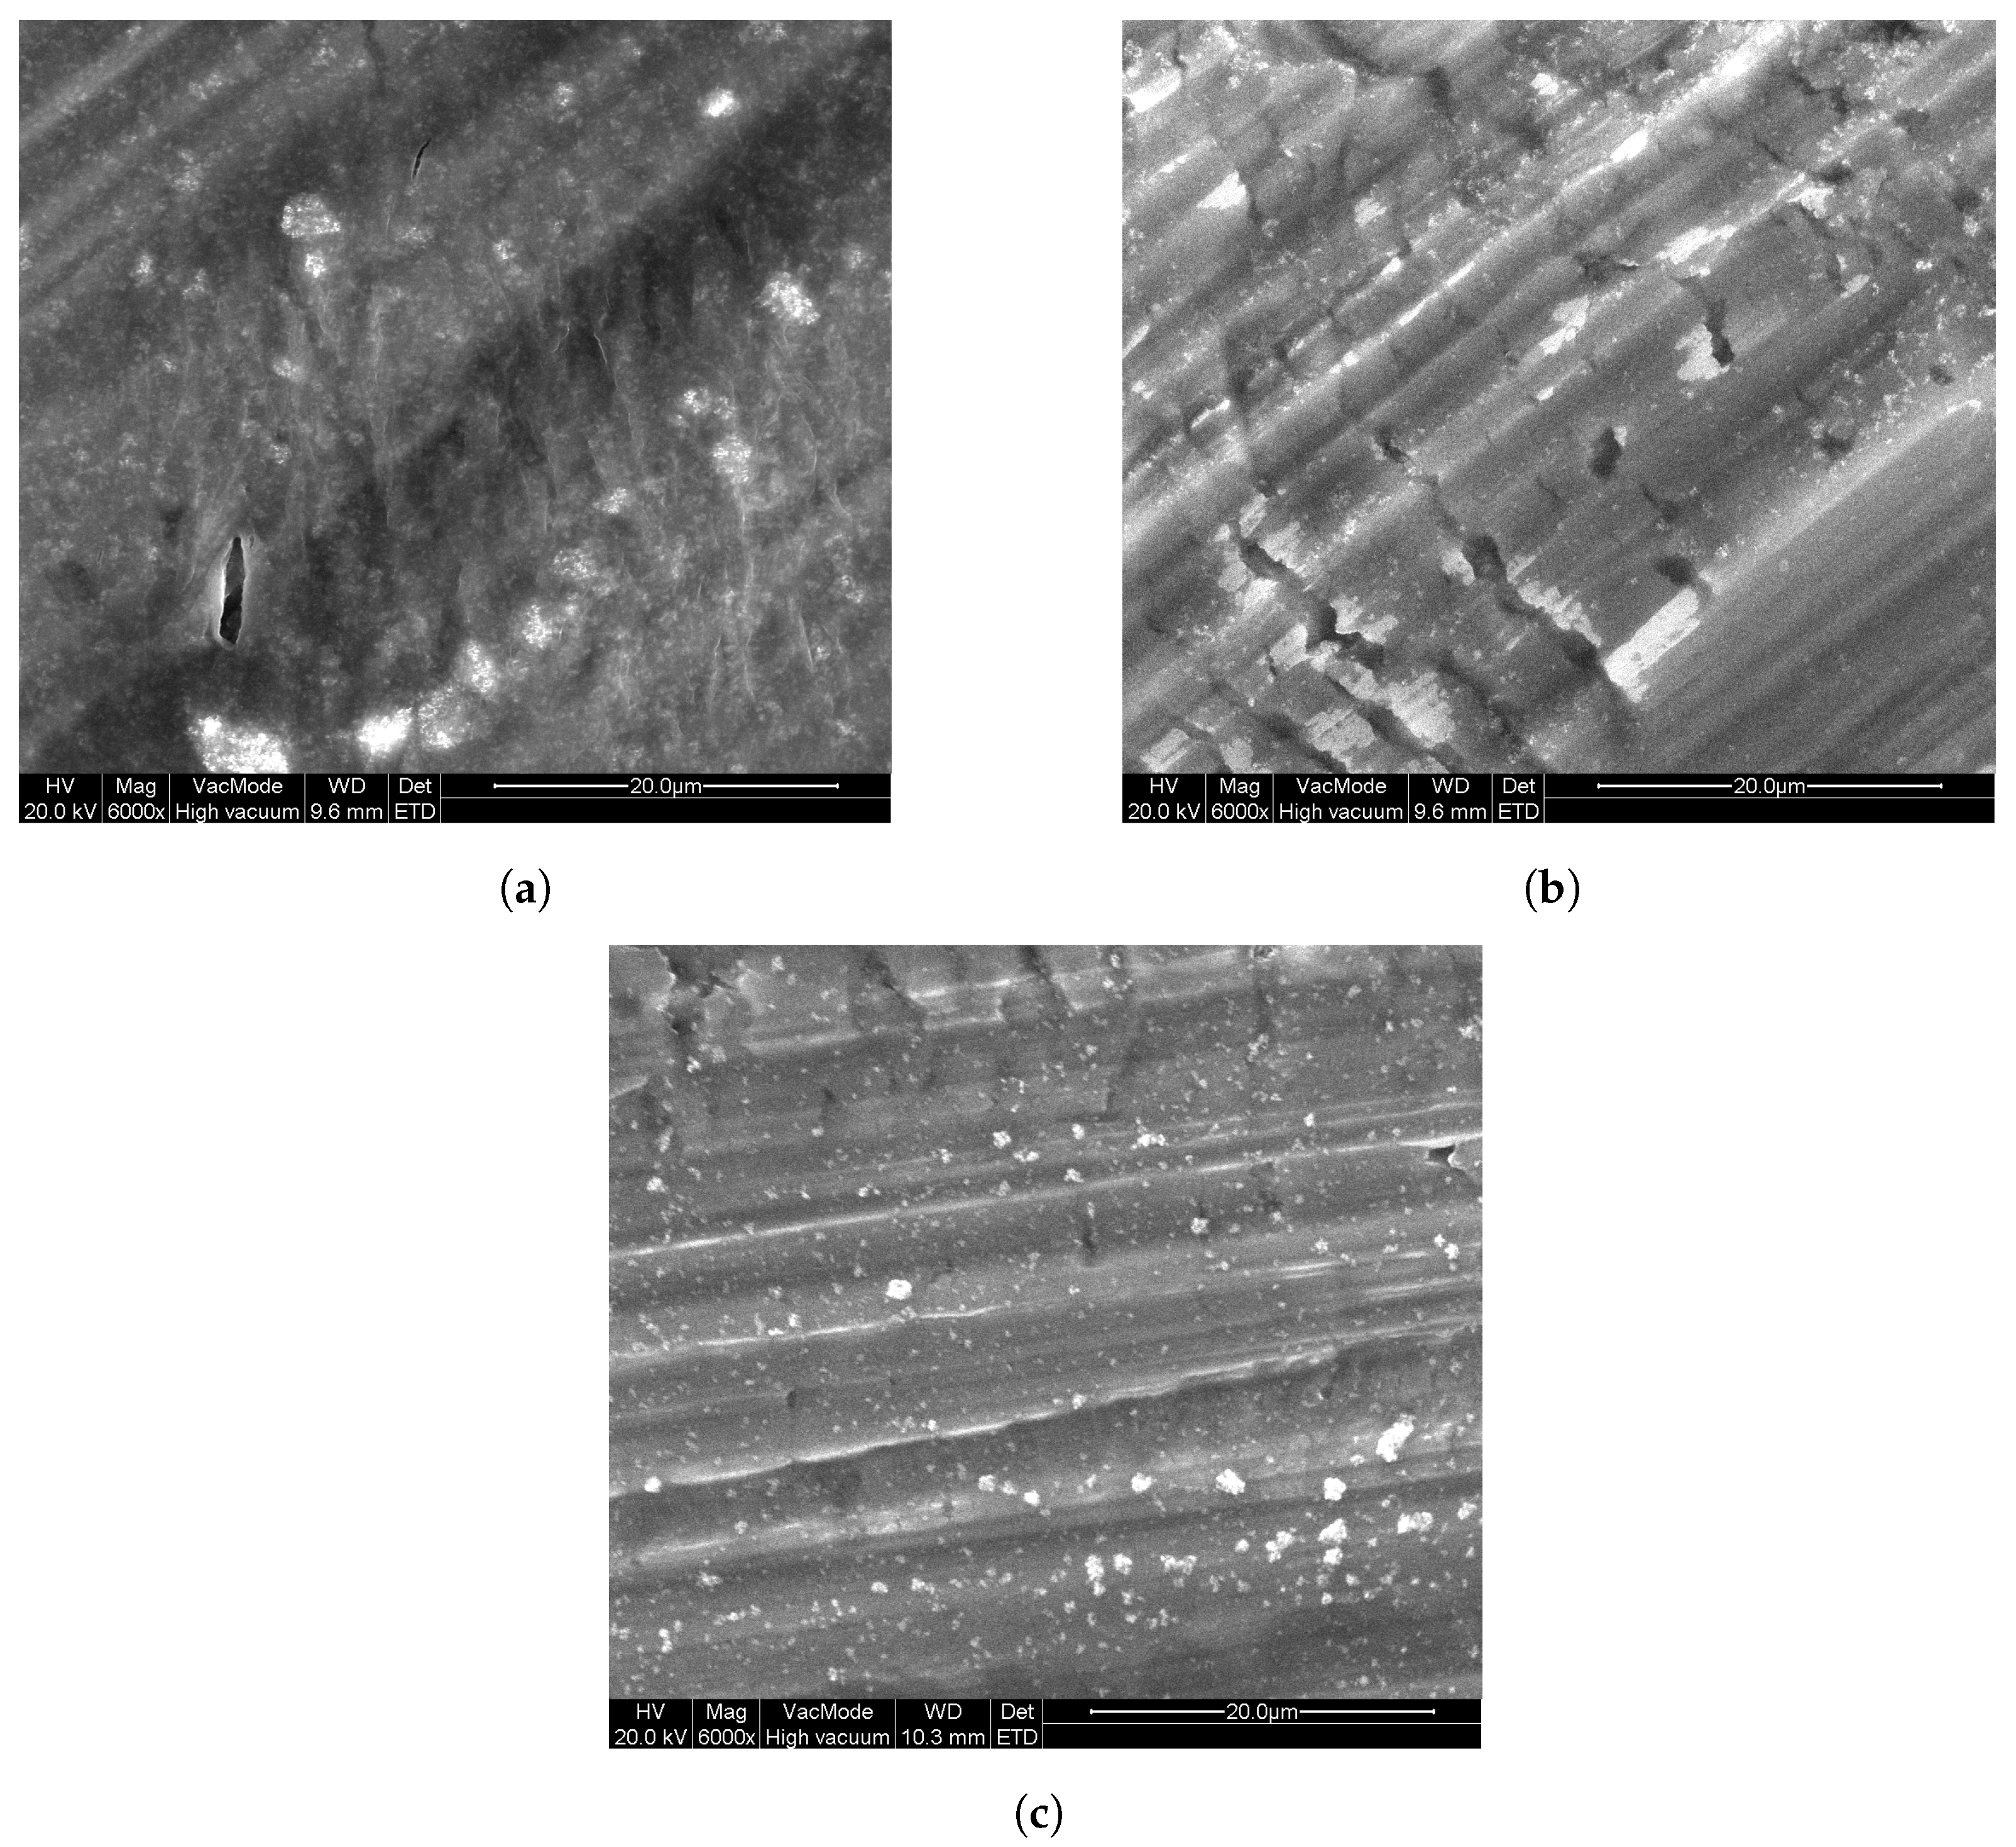
Since the abovementioned TiO 2 powder layers are easily damaged upon handling, another deposition approach is required to form photocatalytic layers for long-term usage. However, the results from Figure 3 enables us to select a suitable TiO 2 powder for further investigation. P25 TiO 2 powder is selected, since it is often used as a reference TiO 2 powder in research. Additionally, because the photocatalytic properties are similar to that of the other powders (except T805 and PF2), it is meaningful to use this photocatalyst as benchmark. Immobilization of this powder with different polymers (see Section 2) was investigated by dip-coating on Al substrates. In Figure 4, images acquired by SEM can be seen that show the surface morphology of these layers. From these, it can be seen that there are some particles present at the surface of these layers. These particles contain titanium, as confirmed by EDX measurements and are from the P25 powder. The layers seem firm with some slight cracking. The marked striations in the images are due to the large surface roughness of the aluminum substrates.
Additionally, P25 was coated onto Al substrates using a sol–gel method, as described in Section 2, by dip-coating and spray-coating. As a reference, sol–gel TiO 2 samples were prepared without the addition of P25 TiO 2 . In Figure 5, SEM images of these samples can be seen that show the surface morphology of these layers. From these images, it is clear that all sol–gel-prepared samples consist of firm layers onto the Al substrates, with only slight cracking. For the DC sol–gel P25 sample, in the homogeneous layer, particles can be seen in Figure 5a (lighter parts), of which EDX measurements confirmed that these particles contain titanium. For the DC sol–gel reference (Figure 5b) sample, these particles are absent. Looking at the spray-coated samples, the surface of SC sol–gel P25 in Figure 5c is similar to DC sol–gel P25, but with a higher concentration of titanium-containing particles at the surface, as was confirmed by EDX measurements. These particles are the added P25 TiO 2 . Comparing SC sol–gel P25 to SC sol–gel reference (Figure 5d), the surface of the reference sample does not contain P25.
In Figure 6, the photocatalytic degradation of ethanol for the polymer/P25 TiO 2 hybrid samples on aluminum substrate are compared to the sol–gel TiO 2 reference and the sol–gel TiO 2 /P25 TiO 2 hybrid samples on aluminum substrate. Here, the normalized ethanol concentration is shown as a function of time. First, the polymer/P25 TiO 2 samples are compared. Here, it is clear that the type of polymer has an influence on the rate of photocatalytic degradation. The TiO 2 particles are embedded in the polymer and the polymers are not porous, resulting in a low amount of TiO 2 directly in contact with the surrounding atmosphere, decreasing the reaction surface. This explains why, compared with the dip-coated sol–gel TiO 2 reference and the sol–gel TiO 2 /P25 TiO 2 samples, the photocatalytic degradation of ethanol is much slower—also indicated in Table 3—with between 96% and 98% of the initial ethanol concentration remaining in the reactor chamber after 1 h for the polymer/P25 TiO 2 samples, while for the dip-coated sol–gel TiO 2 samples, there is 81% of the initial ethanol concentration remaining in the reactor chamber after 1 h. From this improvement, it can be concluded that samples prepared by the sol–gel TiO 2 synthesis are more suited for photocatalytic degradation of VOC. The results from the sol–gel TiO 2 reference and the sol–gel TiO 2 /P25 TiO 2 are almost identical.
The photocatalytic activity can still be improved when compared with the photocatalytic activity of the bulk powder samples from Figure 3. Since the sol–gel TiO 2 samples show the best photocatalytic activity, this sample is also prepared onto Al substrate using spray-coating, both with and without addition of P25 TiO 2 in the synthesis. The photocatalytic degradation of ethanol from these samples is also shown in Figure 6. It can be seen that the spray-coated sol–gel TiO 2 reference samples have a slower photocatalytic degradation than the dip-coated sol–gel TiO 2 samples, with still 90% of the initial ethanol concentration remaining in the reactor chamber after 1 h. When adding P25 TiO 2 to the spray-coated solution, this improves to 63%, also listed in Table 3. This means that for spray-coating, the addition of commercial P25 TiO 2 powder enhances the photocatalytic activity of the coating. Comparing the spray-coated sol–gel P25 with the dip-coated sol–gel P25, it is clear that the photocatalytic activity is greatly enhanced, which is expected looking at the SEM images (Figure 5a,c, respectively) from the visibly higher concentration of P25 at the surface for the former.
It can be concluded that synthesizing a sol–gel TiO 2 /P25 TiO 2 hybrid layer using a spray-coating technique results in coatings that possess a high photocatalytic activity for degradation of ethanol. Still, the rate of photocatalytic activity is slightly lower than that of bulk powder. This spray-coating method could still be improved by varying the spray-coating parameters (nozzle size, spraying time and distance, etc.).

4. Conclusions

Photocatalytically active TiO 2 powder is widely available and can be easily obtained from different suppliers. In this work, different TiO 2 powders from Evonik Industries, Kronos, and Cristal were investigated and compared with each other. Applying a first immobilization technique, by spreading a paste of 1,2 propanediol and TiO 2 powder onto aluminum slides, resulted in ∼100 μ m-thick bulk powder layers. Among the TiO 2 powders, P25 was selected due to its photocatalytic performance and its regular role as a reference photocatalytic material. In order to prevent damage from gas streams, hybrid immobilization techniques were developed using this particular powder.
Polymer/P25 TiO 2 hybrid layers on Al were prepared by dip-coating these substrates. Limited photocatalytic degradation of ethanol was obtained, most probably due to the limited amount of TiO 2 on the surface of these polymer layers and the resulting low effective area available for photocatalytic reaction. Sol–gel TiO 2 /P25 TiO 2 hybrid layers on Al were also prepared by dip-coating, as well as a reference without addition of P25 TiO 2 . The photocatalytic performance of these samples was increased compared with that of the polymer/P25 TiO 2 samples. The photocatalytic degradation of ethanol of the sol–gel TiO 2 /P25 TiO 2 hybrid layer was enhanced by using a spray-coating technique, due to the higher P25 concentration at the surface, visible from the SEM images. The photocatalytic activity of the latter was only slightly lower than that of the bulk powder layers. Thus, the commercial P25 TiO 2 was successfully immobilized while only slightly decreasing the photocatalytic efficiency of the material. The spray-coated sol–gel TiO 2 reference sample, without commercial P25 TiO 2 showed a much slower photocatalytic degradation. The spray-coating method could still be optimized—by changing, e.g., the nozzle size, spraying time, and distance—and applied to the other commercial TiO 2 nanopowders. The presented methods offer a way to obtain stable coatings with high photocatalytic activity, which can be used in purification of gas streams with high flow rates.

Author Contributions

Conceptualization, D.P. and S.D.L.; methodology, software, and investigation, E.C. and C.W.; writing—original draft preparation, visualization, and data curation, E.C.; writing—review and editing, E.C., C.W., S.D.L., G.J.H. and D.P.; supervision, project administration, and funding acquisition, D.P. All authors have read and agreed to the published version of the manuscript.

Funding

This research was funded by Ghent University, grant number 01G00319.

Institutional Review Board Statement

Not applicable.

Informed Consent Statement

Not applicable.

Data Availability Statement

The data presented in this study are available on request from the corresponding author.

Acknowledgments

Olivier Janssens is acknowledged for performing SEM and EDX measurements. We are thankful to Julien Mahy for assistance with sol–gel TiO 2 / TiO 2 P25 synthesis.

Conflicts of Interest

The authors declare no conflict of interest.

References

  1. Jones, A.P. Indoor air quality and health. Atmos. Environ. 1999, 33, 4535–4564. [Google Scholar] [CrossRef]
  2. Bernstein, J.A.; Alexis, N.; Bacchus, H.; Bernstein, I.L.; Fritz, P.; Horner, E.; Li, N.; Mason, S.; Nel, A.; Oullette, J.; et al. The health effects of nonindustrial indoor air pollution. J. Allergy Clin. Immunol. 2008, 121, 585–591. [Google Scholar] [CrossRef] [PubMed]
  3. Tsai, W.T. Toxic Volatile Organic Compounds (VOCs) in the Atmospheric Environment: Regulatory Aspects and Monitoring in Japan and Korea. Environments 2016, 3, 23. [Google Scholar] [CrossRef]
  4. Mo, J.H.; Zhang, Y.P.; Xu, Q.J.; Lamson, J.J.; Zhao, R.Y. Photocatalytic purification of volatile organic compounds in indoor air: A literature review. Atmos. Environ. 2009, 43, 2229–2246. [Google Scholar] [CrossRef]
  5. Fujishima, A.; Honda, K. Electrochemical Photolysis of Water at a Semiconductor Electrode. Nature 1972, 238, 37–38. [Google Scholar] [CrossRef] [PubMed]
  6. Boyjoo, Y.; Sun, H.; Liu, J.; Pareek, V.K.; Wang, S. A review on photocatalysis for air treatment: From catalyst development to reactor design. Chem. Eng. J. 2017, 310, 537–559. [Google Scholar] [CrossRef]
  7. Daghrir, R.; Drogui, P.; Robert, D. Modified TiO2 For Environmental Photocatalytic Applications: A Review. Ind. Eng. Chem. Res. 2013, 52, 3581–3599. [Google Scholar] [CrossRef]
  8. Ullah, H.; Tahir, A.A.; Bibi, S.; Mallick, T.K.; Karazhanov, S.Z. Electronic properties of β-TaON and its surfaces for solar water splitting. Appl. Catal. B Environ. 2018, 229, 24–31. [Google Scholar] [CrossRef]
  9. Wicker, S.; Guiltat, M.; Weimar, U.; Hémeryck, A.; Barsan, N. Ambient Humidity Influence on CO Detection with SnO2 Gas Sensing Materials. A Combined DRIFTS/DFT Investigation. J. Phys. Chem. C 2017, 121, 25064–25073. [Google Scholar] [CrossRef] [Green Version]
  10. Patterson, A.L. The Scherrer Formula for X-Ray Particle Size Determination. Phys. Rev. 1939, 56, 978–982. [Google Scholar] [CrossRef]
  11. Kubelka, P. Ein Beitrag zur Optik der Farbanstriche (Contribution to the optic of paint). Z. Fur Tech. Phys. 1931, 12, 593–601. [Google Scholar]
  12. Eufinger, K.; De Gryse, R.; Poelman, D. Effect of Deposition Conditions and Doping on the Structure, Optical Properties and Photocatalytic Activity of d.c. Magnetron Sputtered TiO2 Thin Films. Ph.D Thesis, Ghent University, Ghent, Belgium, 2007. [Google Scholar]
  13. Swanson, H.E.; McMurdie, H.F.; Morris, M.C.; Evans, E.H. Standard X-ray Diffraction Powder Patterns. Nat. Bur. Stand. Monogr. 1969, 7, 82–83. [Google Scholar]
  14. Douven, S.; Mahy, J.G.; Wolfs, C.; Reyserhove, C.; Poelman, D.; Devred, F.; Gaigneaux, E.M.; Lambert, S.D. Efficient N, Fe Co-Doped TiO2 Active under Cost-Effective Visible LED Light: From Powders to Films. Catalysts 2020, 10, 547. [Google Scholar] [CrossRef]
  15. Malengreaux, C.M.; Douven, S.; Poelman, D.; Heinrichs, B.; Bartlett, J.R. An ambient temperature aqueous sol–gel processing of efficient nanocrystalline doped TiO2-based photocatalysts for the degradation of organic pollutants. J. Sol.-Gel Sci. Technol. 2014, 71, 557–570. [Google Scholar] [CrossRef]
  16. Mahy, J.G.; Lambert, S.D.; Tilkin, R.G.; Wolfs, C.; Poelman, D.; Devred, F.; Gaigneaux, E.M.; Douven, S. Ambient temperature ZrO2-doped TiO2 crystalline photocatalysts: Highly efficient powders and films for water depollution. Mater. Today Energy 2019, 13, 312–322. [Google Scholar] [CrossRef]
  17. Cimieri, I.; Poelman, H.; Avci, N.; Geens, J.; Lambert, S.D.; Heinrichs, B.; Poelman, D. Sol–gel preparation of pure and doped TiO2 films for the photocatalytic oxidation of ethanol in air. J. Sol.-Gel Sci. Technol. 2012, 63, 526–536. [Google Scholar] [CrossRef] [Green Version]
Figure 1. X-ray diffraction patterns of commercial TiO 2 powders (anatase PDF number: 00-021-1272, rutile PDF number: 00-021-1276 [13]).
Molecules 26 06584 g001
Figure 2. K–M absorbance spectrum for different TiO 2 powders. The inset shows the region from 365–450 nm.
Molecules 26 06584 g002
Figure 3. Photocatalytic degradation of ethanol for the TiO 2 powders measured at m/z = 45 amu. Only the part of the graph above the dashed line is considered for greater accuracy, since it is an artifact of the correction (see text).
Molecules 26 06584 g003
Figure 4. SEM images of the polymer/ TiO 2 coatings on aluminum substrates: (a) PEG P25, (b) PVP P25, and (c) PMMA P25.
Molecules 26 06584 g004
Figure 5. SEM images of the sol–gel TiO 2 coatings on aluminum substrates: (a) DC sol–gel P25, (b) DC sol–gel ref, (c) SC sol–gel P25, and (d) SC sol–gel ref.
Molecules 26 06584 g005
Figure 6. Normalized ethanol concentration vs. time for the polymer/P25 TiO 2 samples on Al and the sol–gel TiO 2 reference and the sol–gel TiO 2 /P25 TiO 2 samples on Al during the photocatalytic degradation tests of ethanol.
Molecules 26 06584 g006
Table 1. Overview of the prepared samples on Al substrates.
BulkPolymer (PEG, PVP or PMMA)Sol–Gel TiO 2 Sol–Gel TiO 2
TiO 2 powder addedP25; P90; PF2; T805; K7000; K7050; PC105; PC500 *P25P25-
deposition methodspreading paste with razor bladedip-coatingdip-coating (DC) or spray-coating (SC)dip-coating or spray-coating
sample nameP25; P90; PF2; T805; K7000; K7050; PC105; PC500PEG P25;PVP P25;PMMA P25DC sol–gel P25;SC sol–gel P25DC sol–gel ref; SC sol–gel ref
* See references in the text.
Table 2. Estimated crystal size and the listed surface area for the TiO 2 samples.
P25P90PF2T805K7000K7050PC105PC500
Estimated crystal size (nm)321730311193310
Surface area (m 2 /g)35–6570–11045–7035–55>225>225∼90∼350
Table 3. Percentage of normalized ethanol concentration, relative to the initial ethanol concentration, after 1 h of photocatalytic degradation for the different TiO 2 samples discussed in this work. An absolute error for these values was estimated to 5%.
Sample Name C EtOH / C 0 EtOH (1 h) (%)Sample Name C EtOH / C 0 EtOH (1 h) (%)
P2544PEG P2596
P9038PVP P2598
PF282PMMA P2598
T80560DC sol–gel ref81
K700038SC sol–gel ref90
K705040DC sol–gel P2581
PC10548SC sol–gel P2563
PC50034
Publisher’s Note: MDPI stays neutral with regard to jurisdictional claims in published maps and institutional affiliations.