
The Flow of Blood-Based Hybrid Nanofluids with Couple Stresses by the Convergent and Divergent Channel for the Applications of Drug Delivery


Abstract
1. Introduction
- Until now, no one has investigated the flow through a converging/diverging stretchable/shrinkable channel with blood as a base fluid and as nanoparticles.
- This article examines a suitable background of couple stress hybrid nanofluid flow through converging/diverging and stretchable/shrinkable channels.
- The addition of MHD, a Darcy–Forchheimer porous medium, thermal radiation, and heat absorption/omission terminologies further strengthen the novelty of the work.
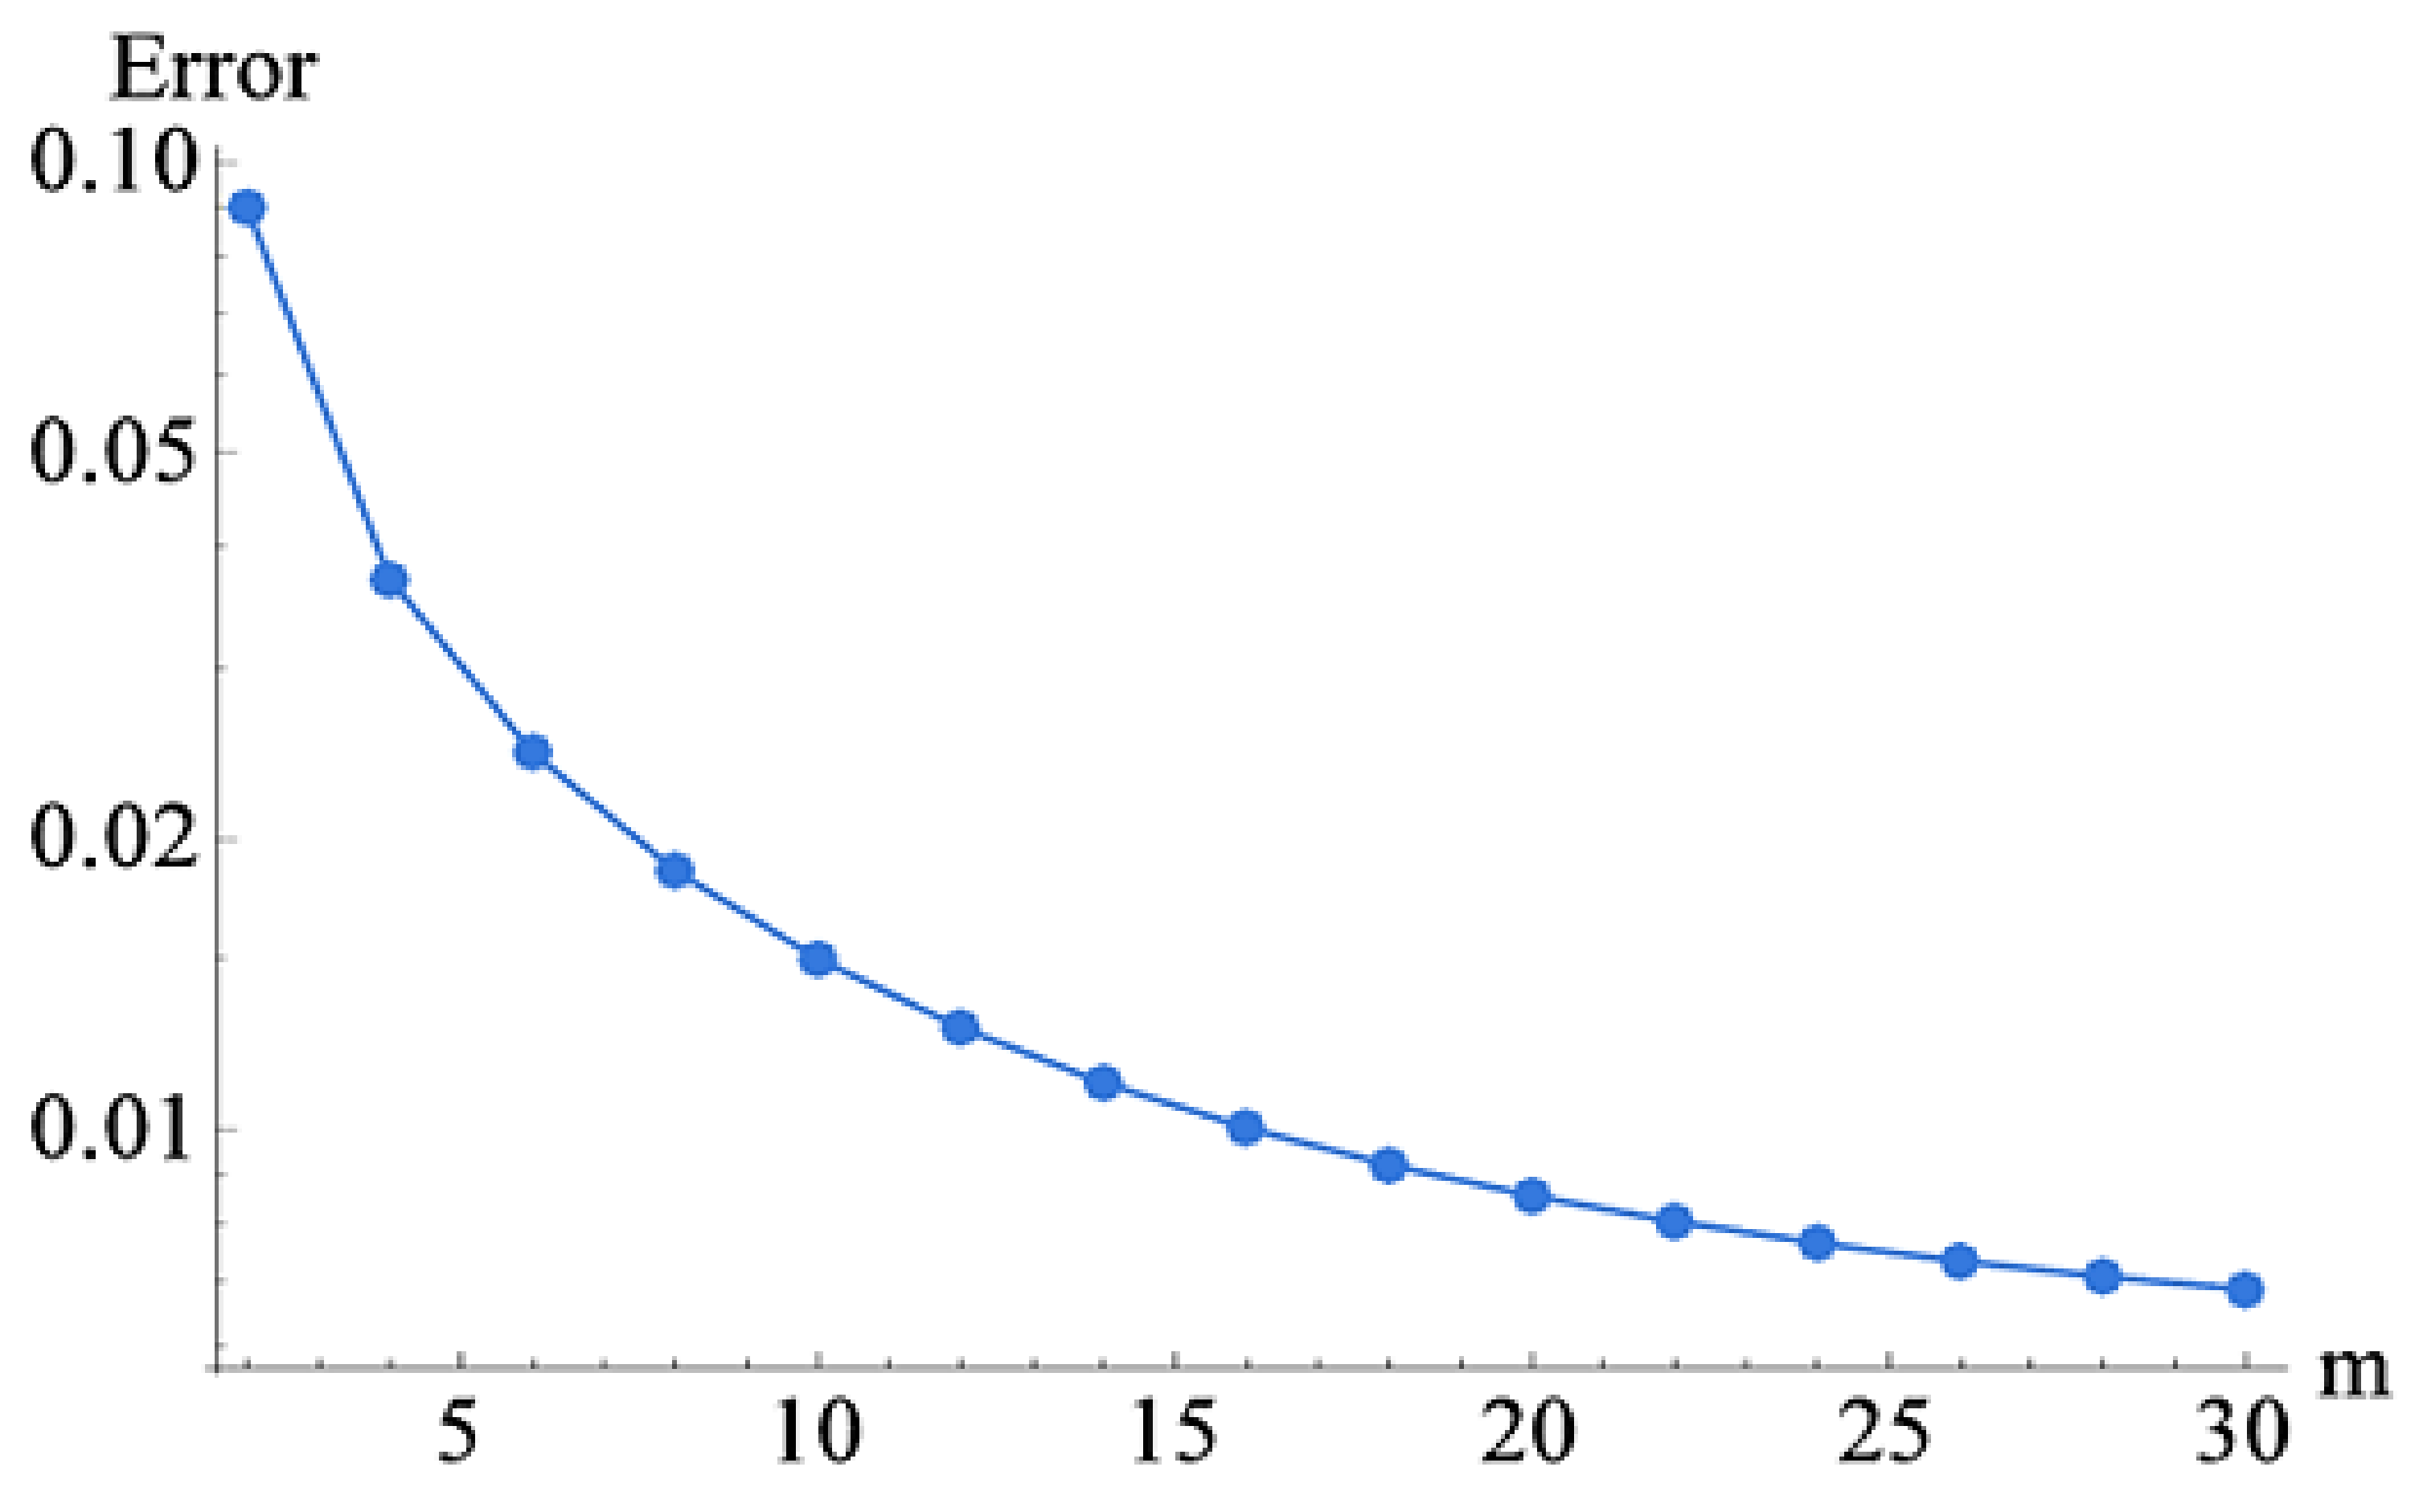
- The system of equations was then analytically solved by HAM.
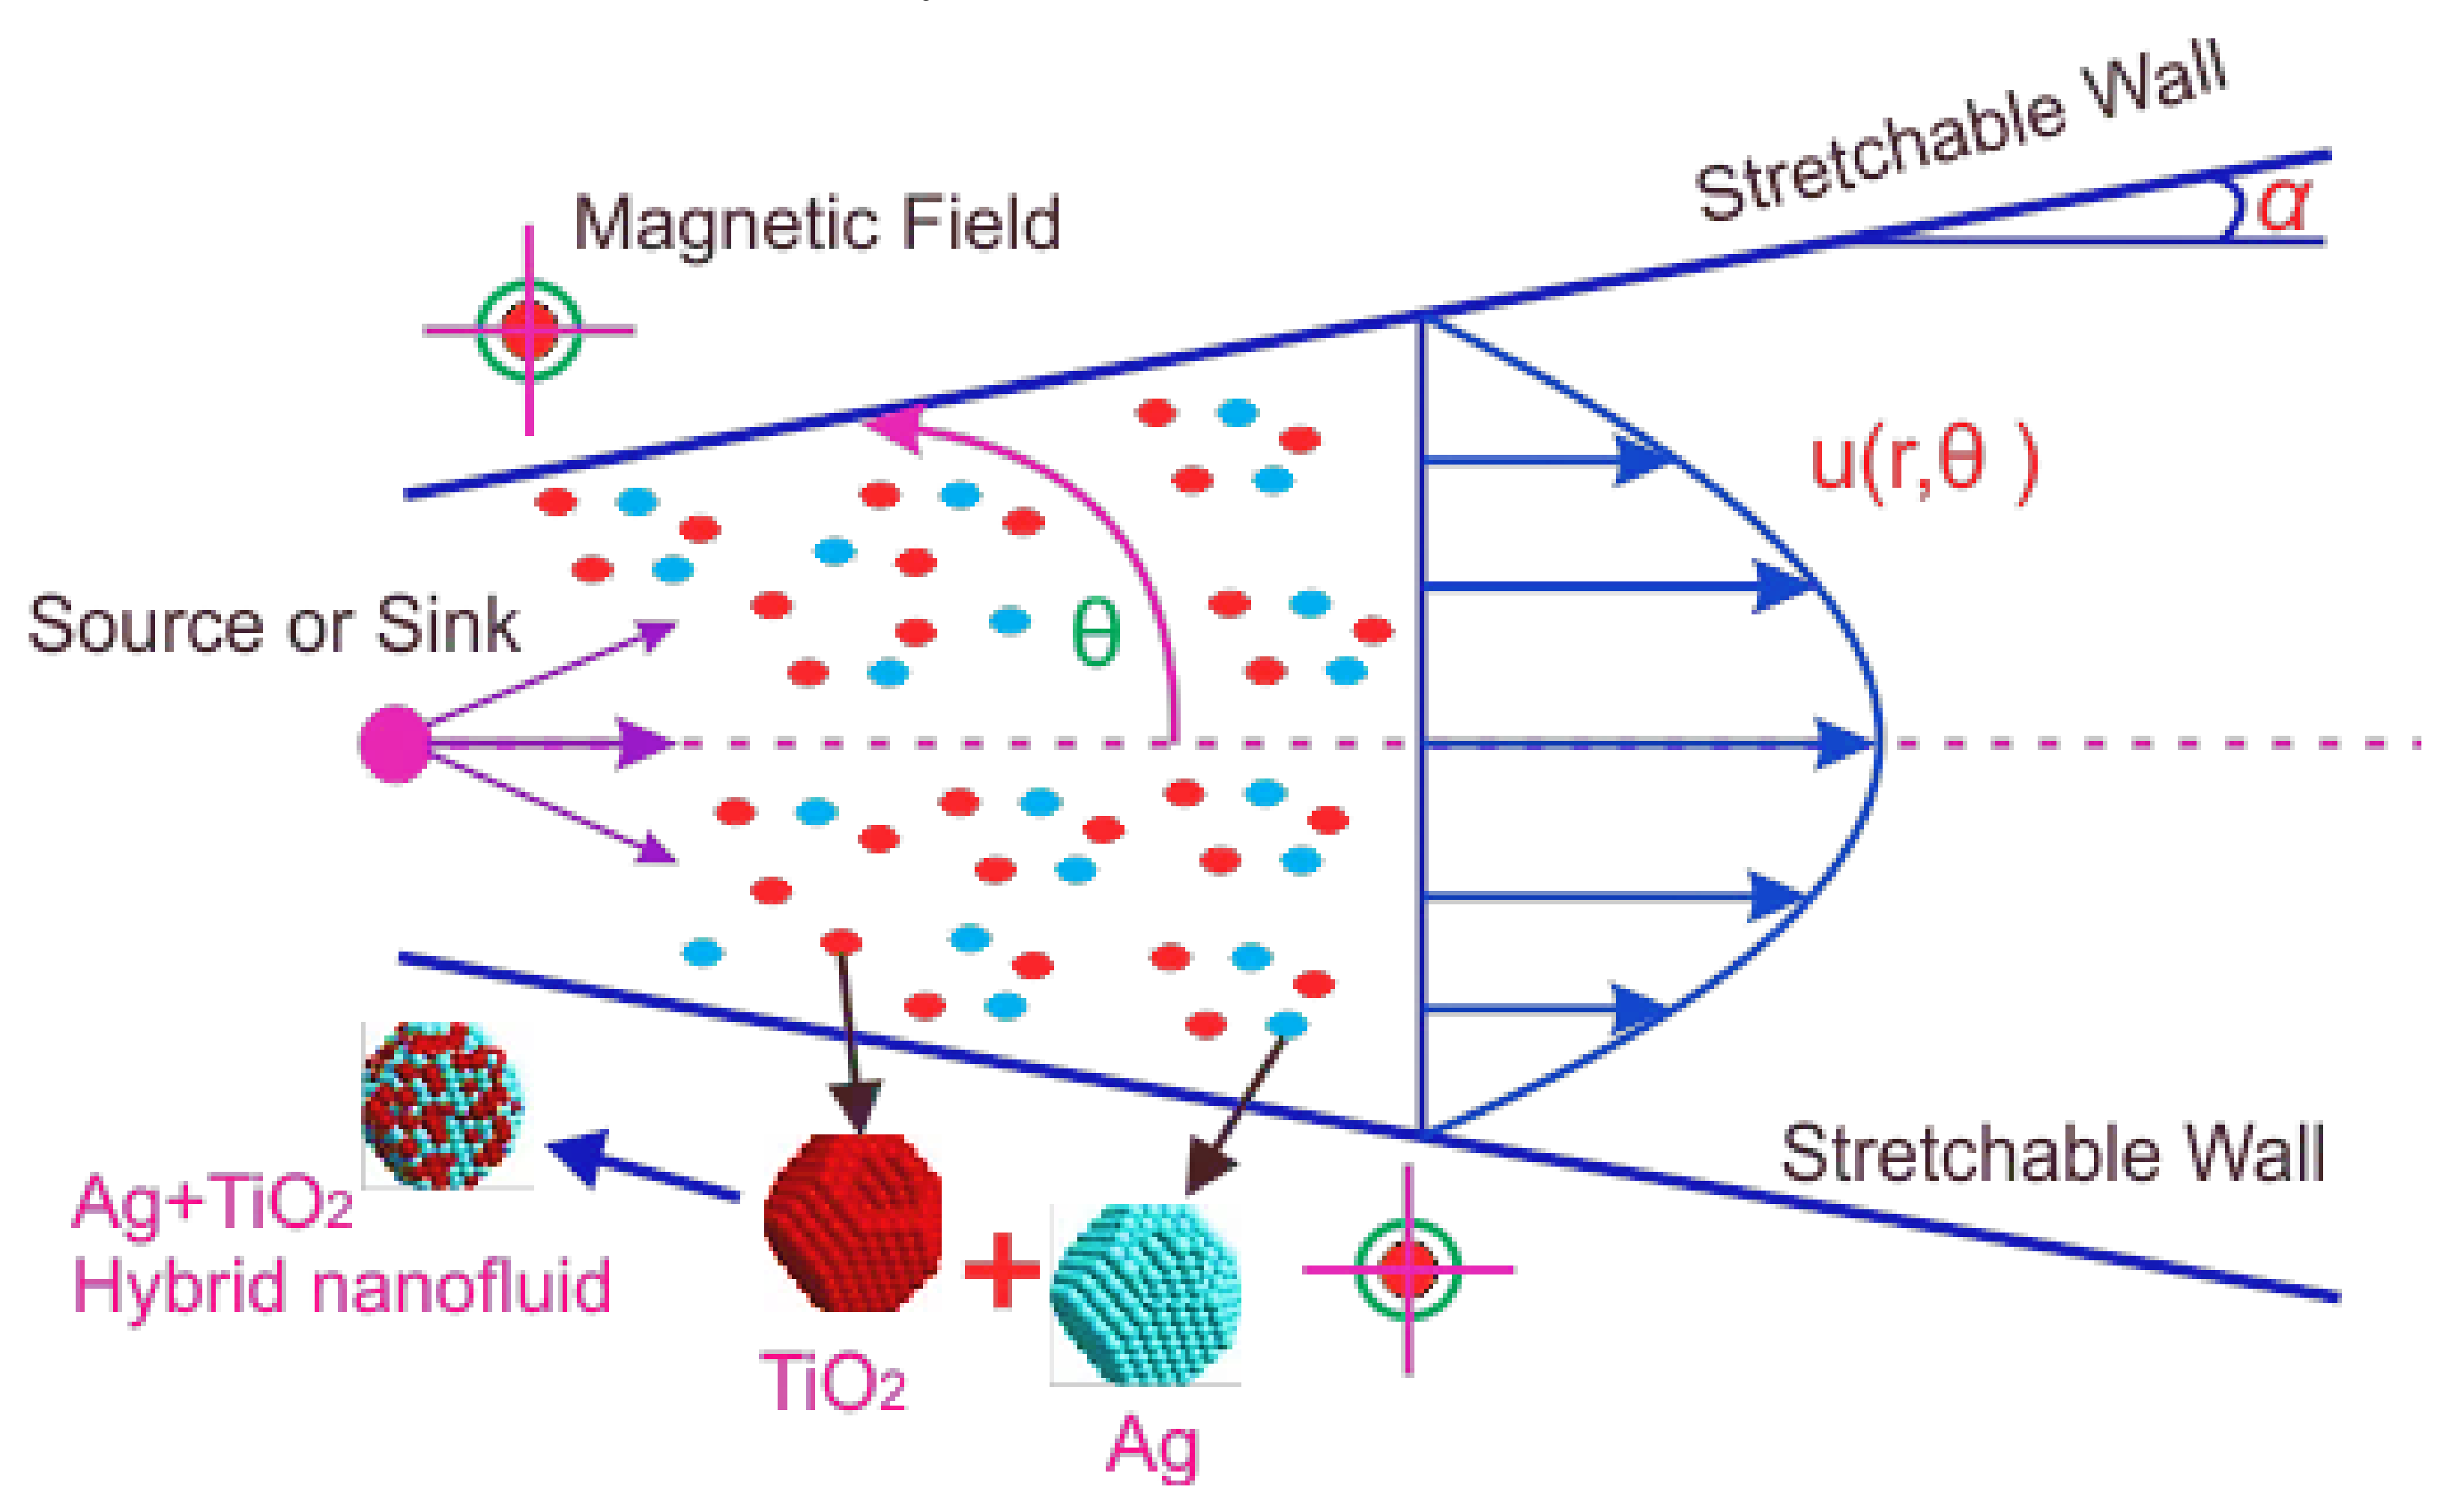
2. Formulation
2.1. Thermophysical Properties
2.2. Initial and Boundary Conditions
2.3. Introduction of Non-Dimensional Variables
2.4. Rate of Heat Transfer Due to Drag Force
3. Solution Methodology
4. Discussion of Results
5. Conclusions
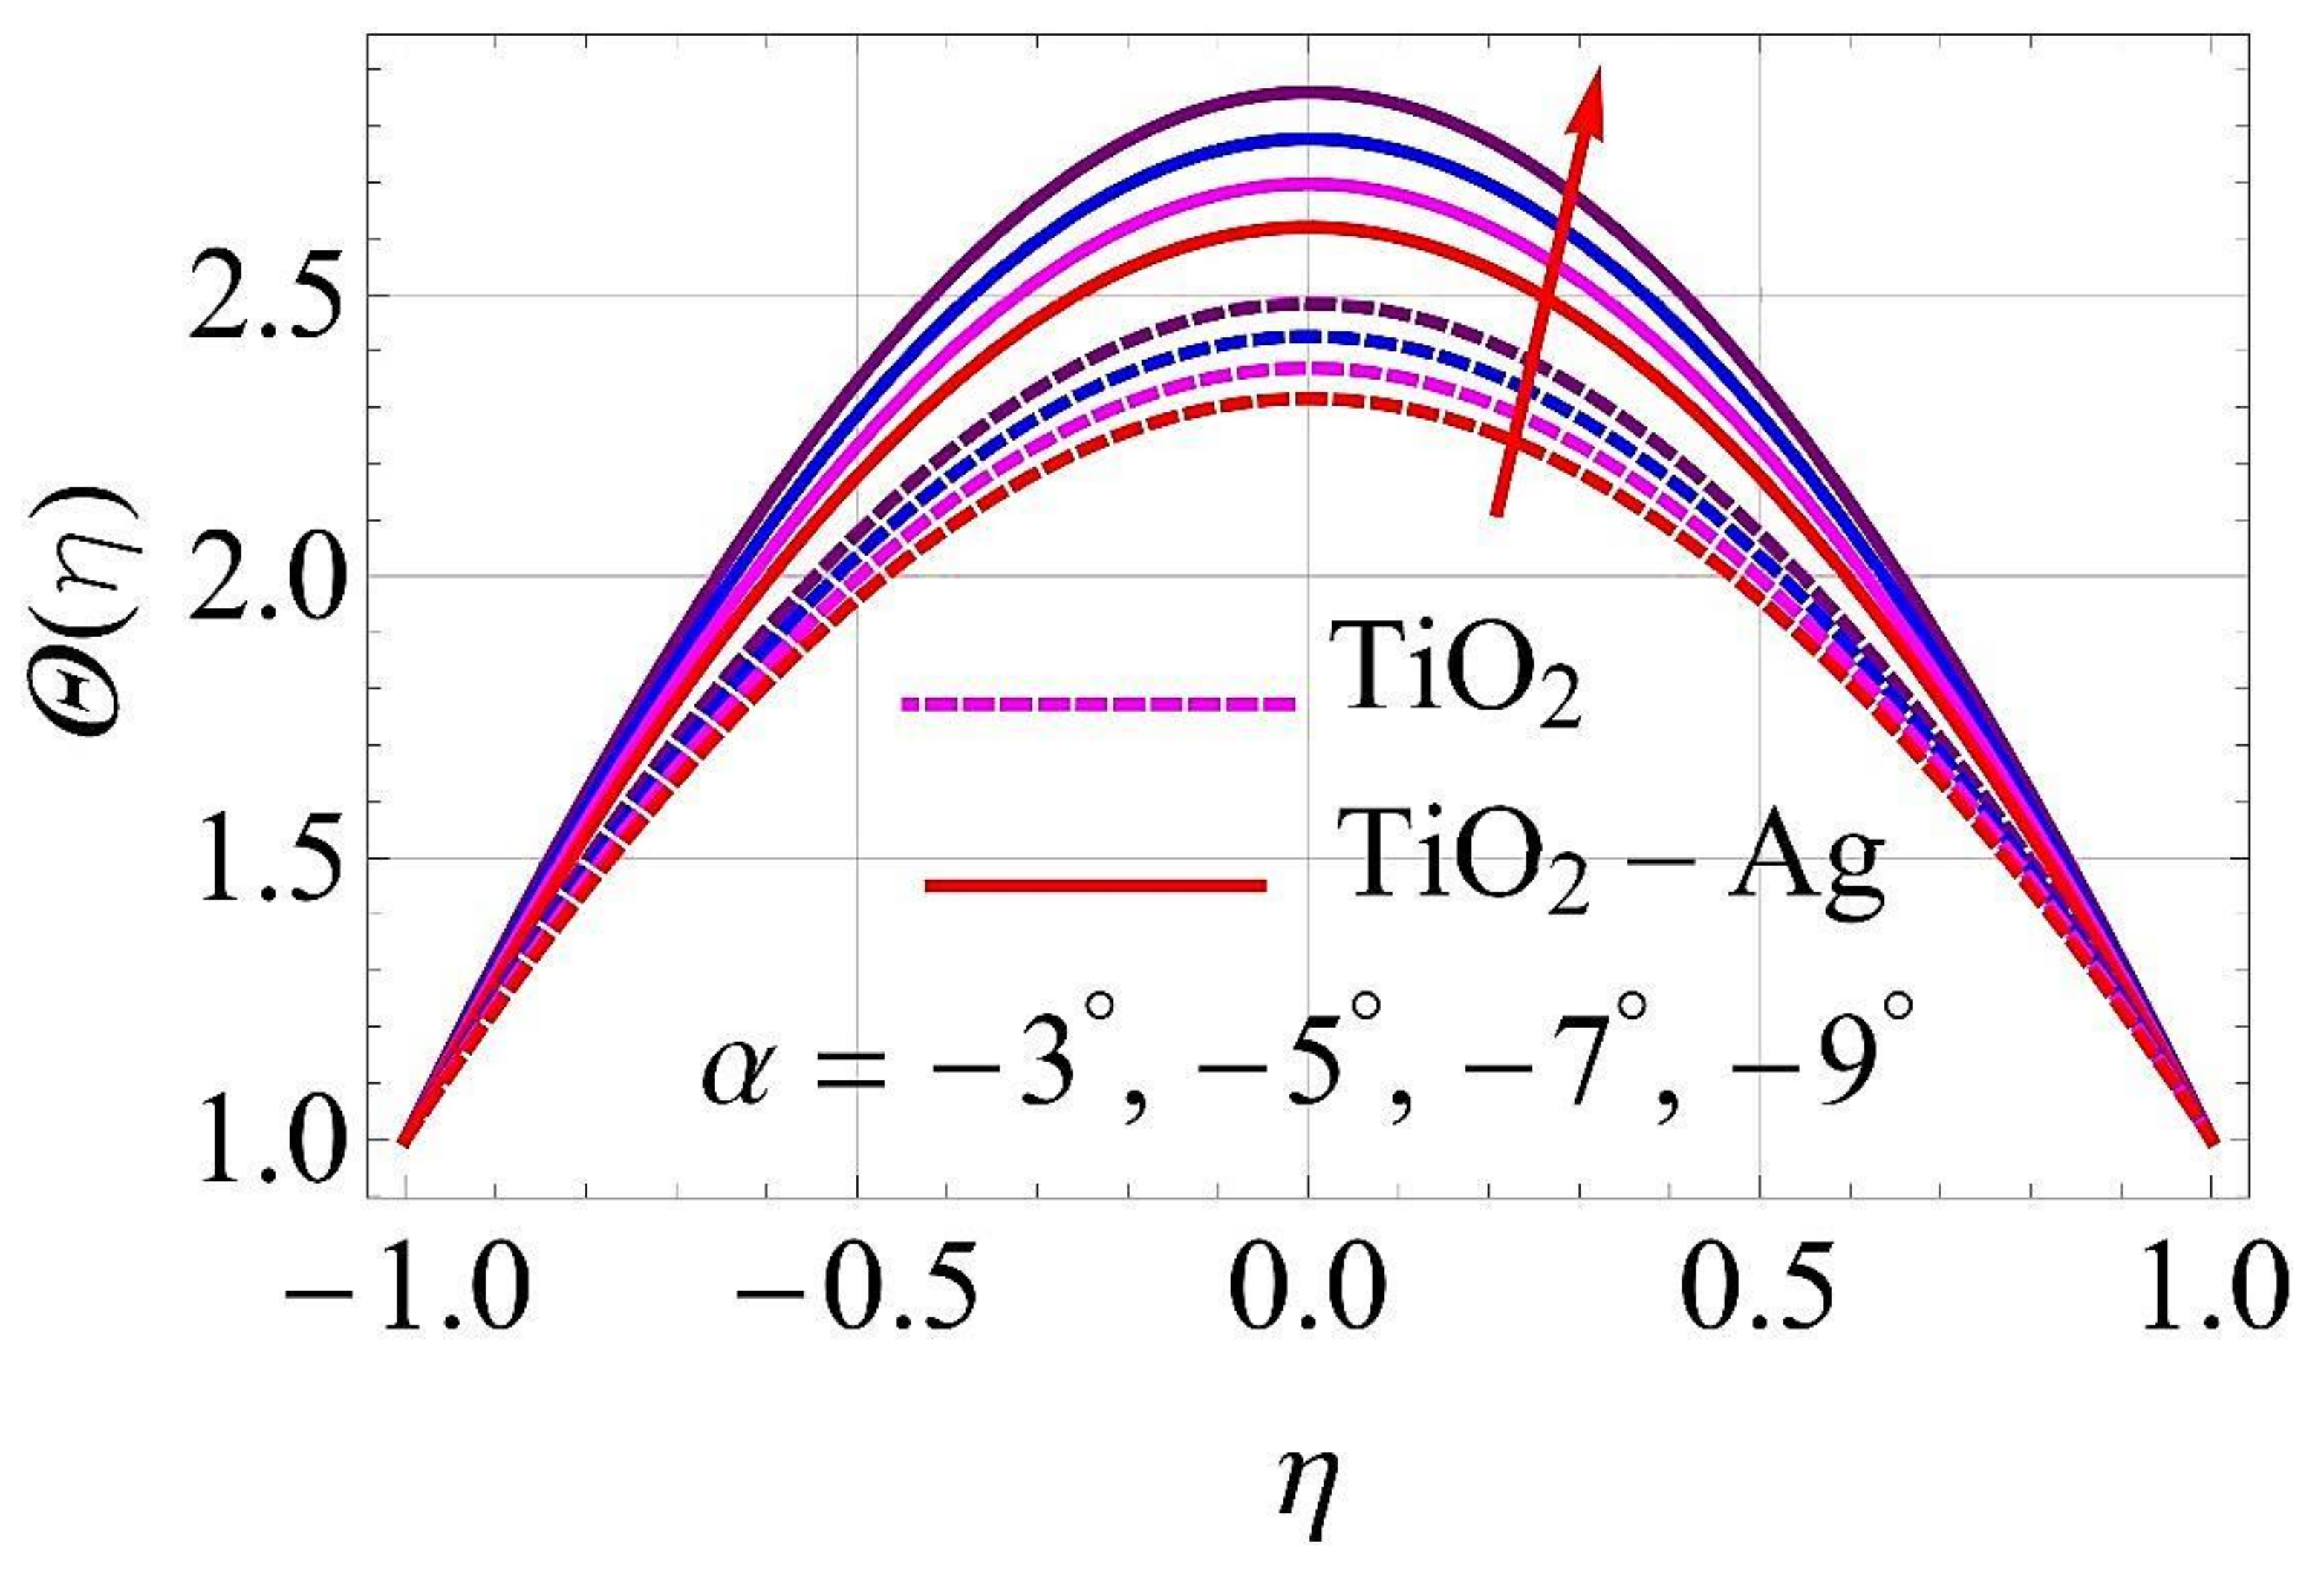
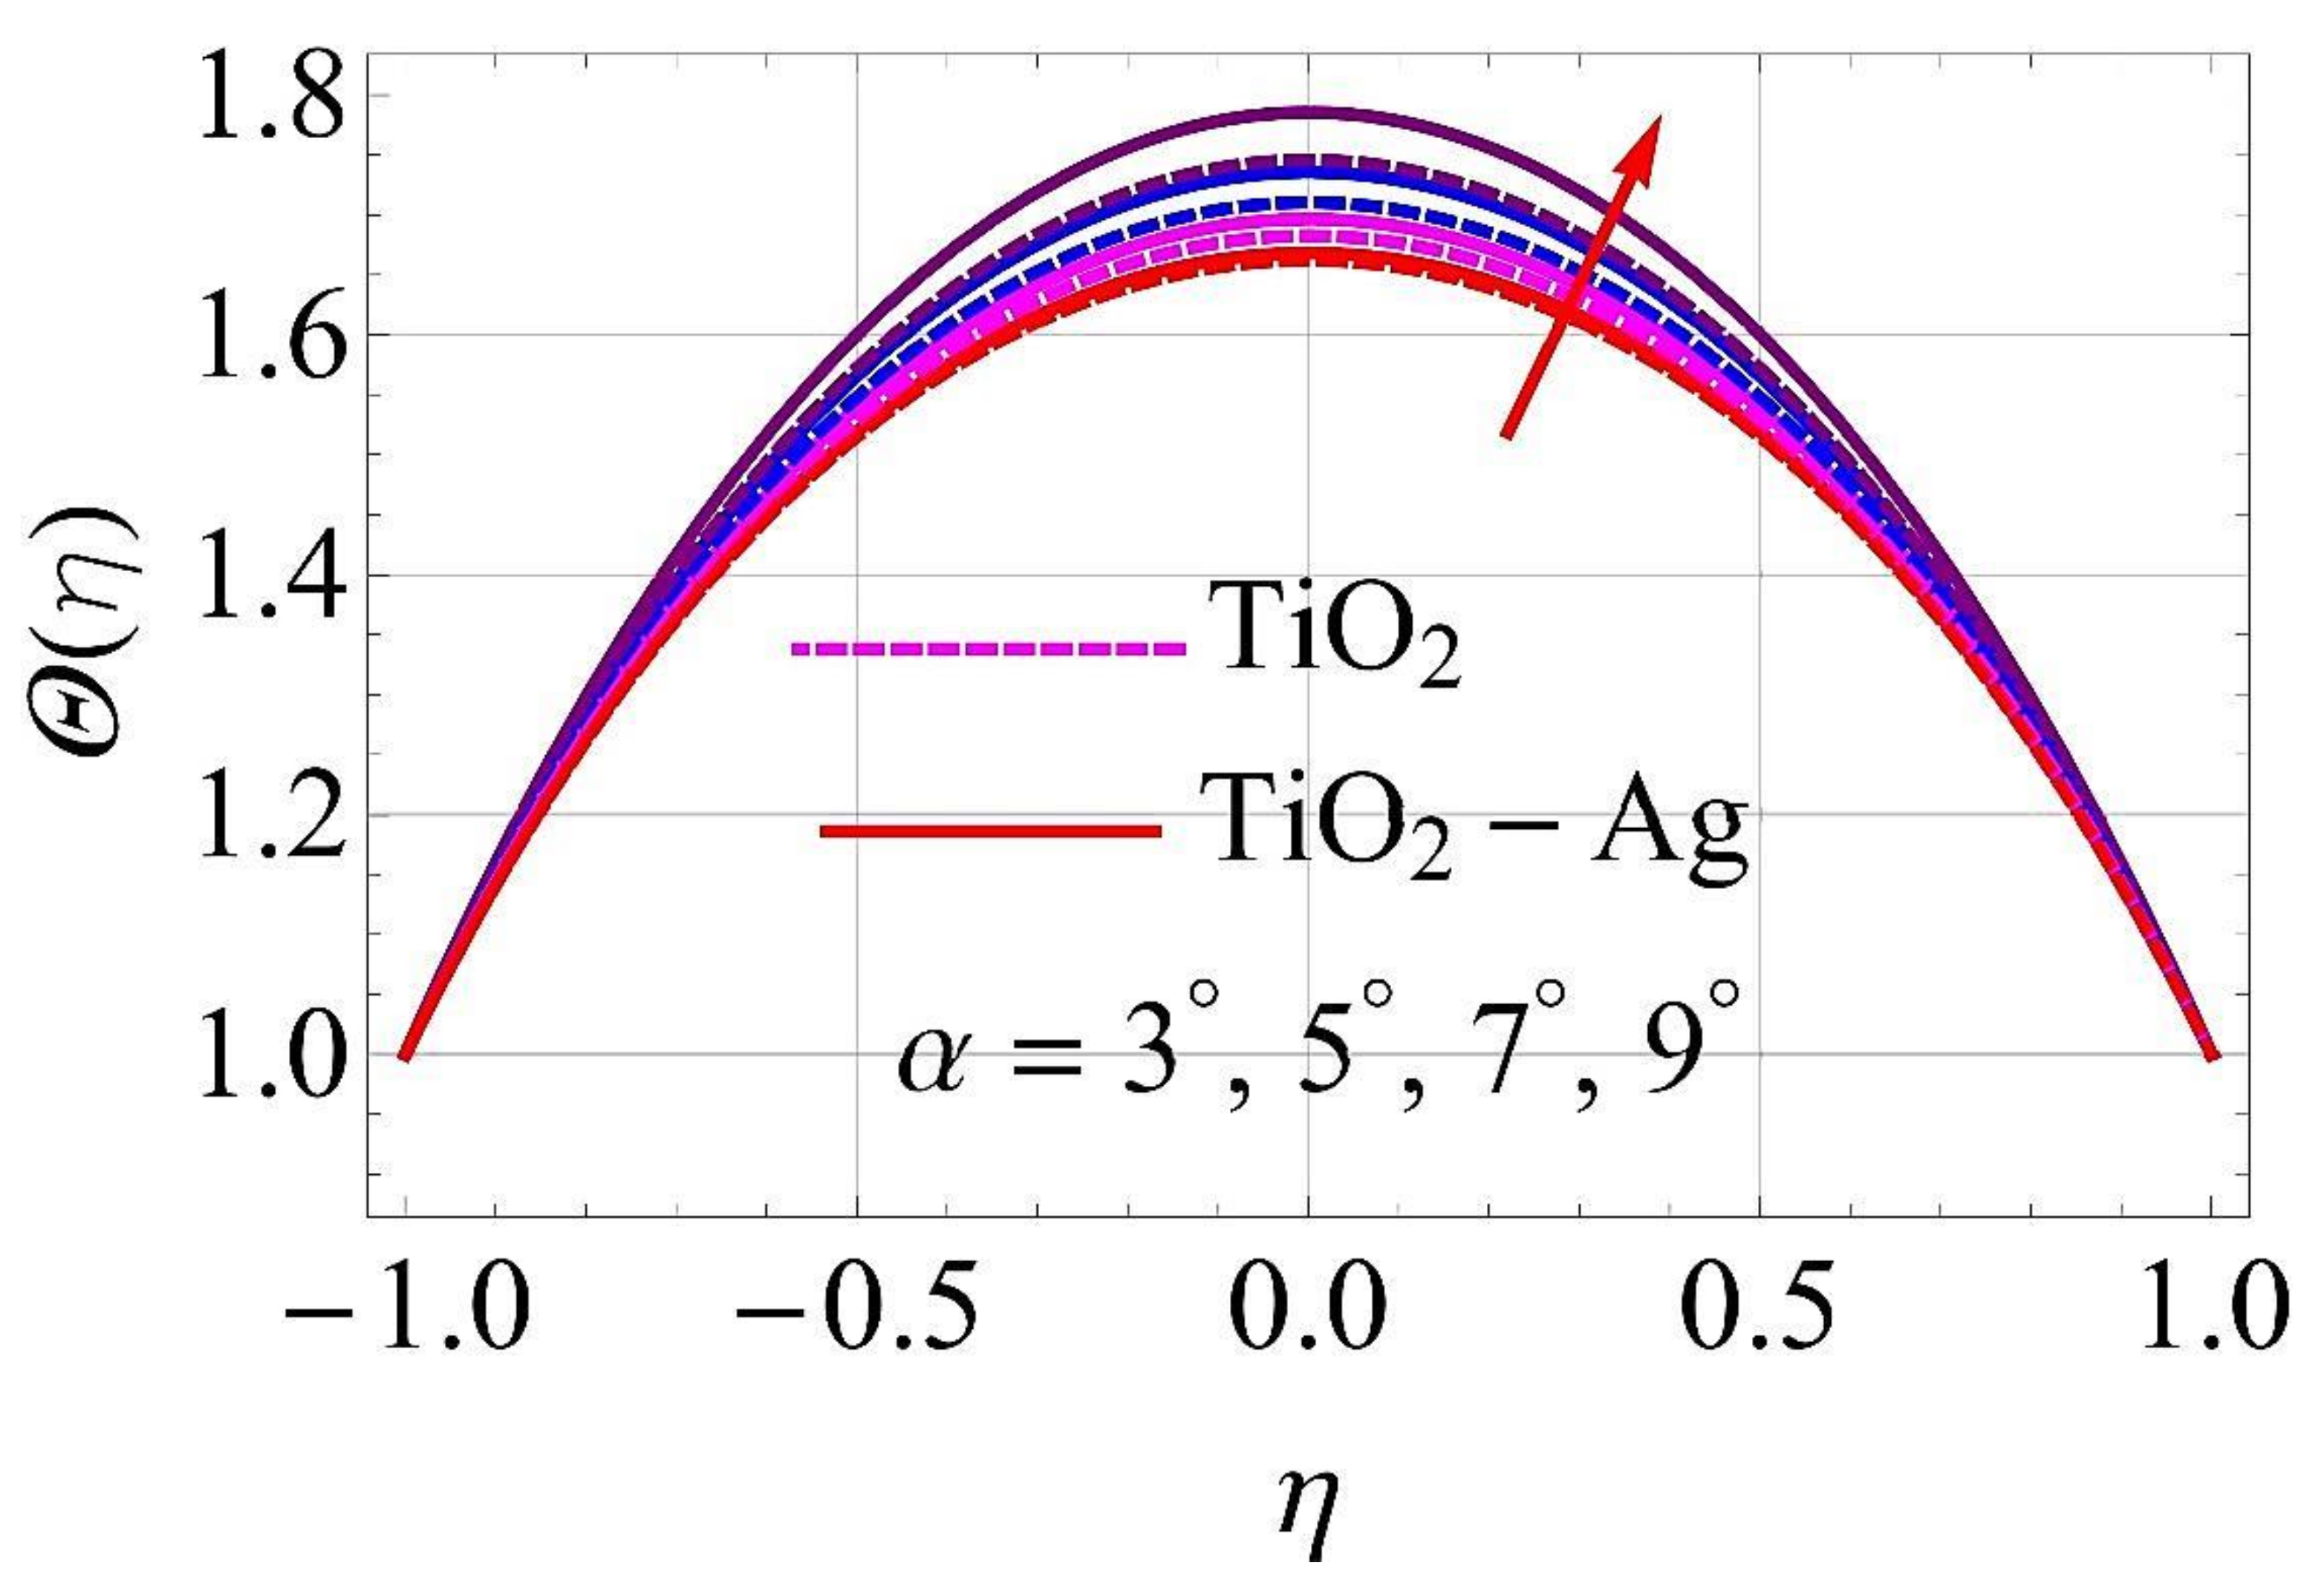
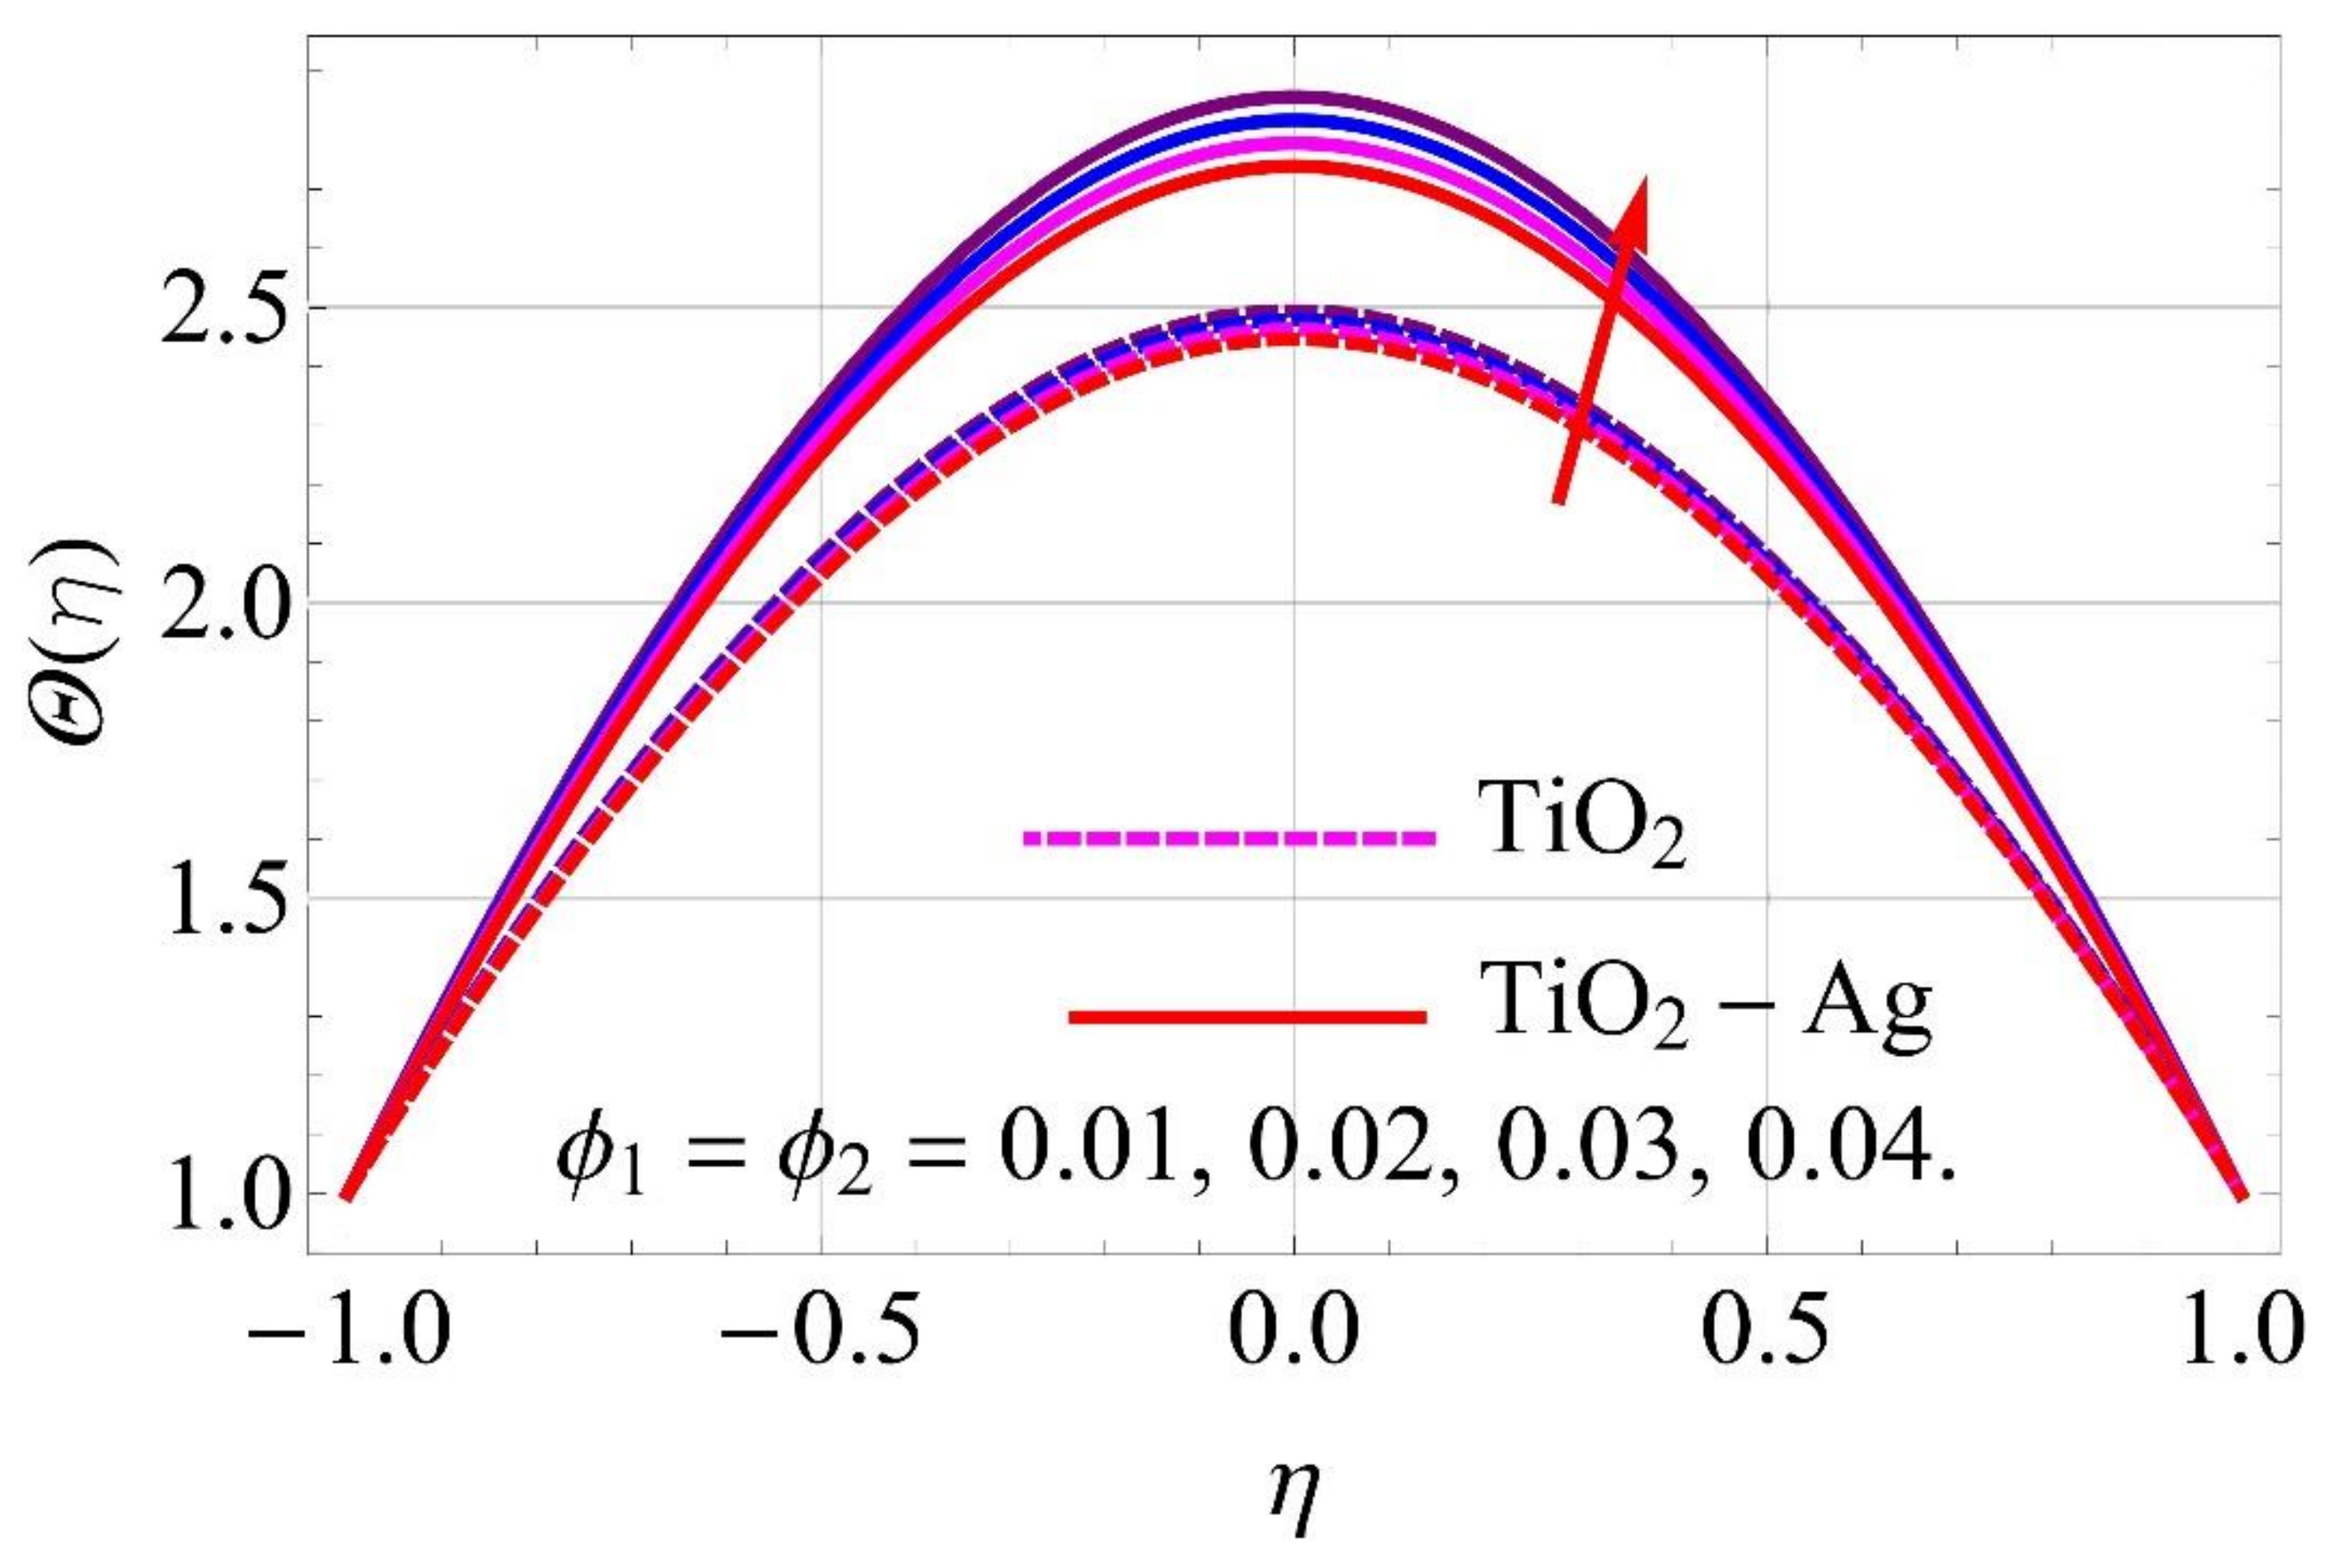
- The rising value of increases the temperature field and this impact is relatively larger in the case of hybrid nanofluid.
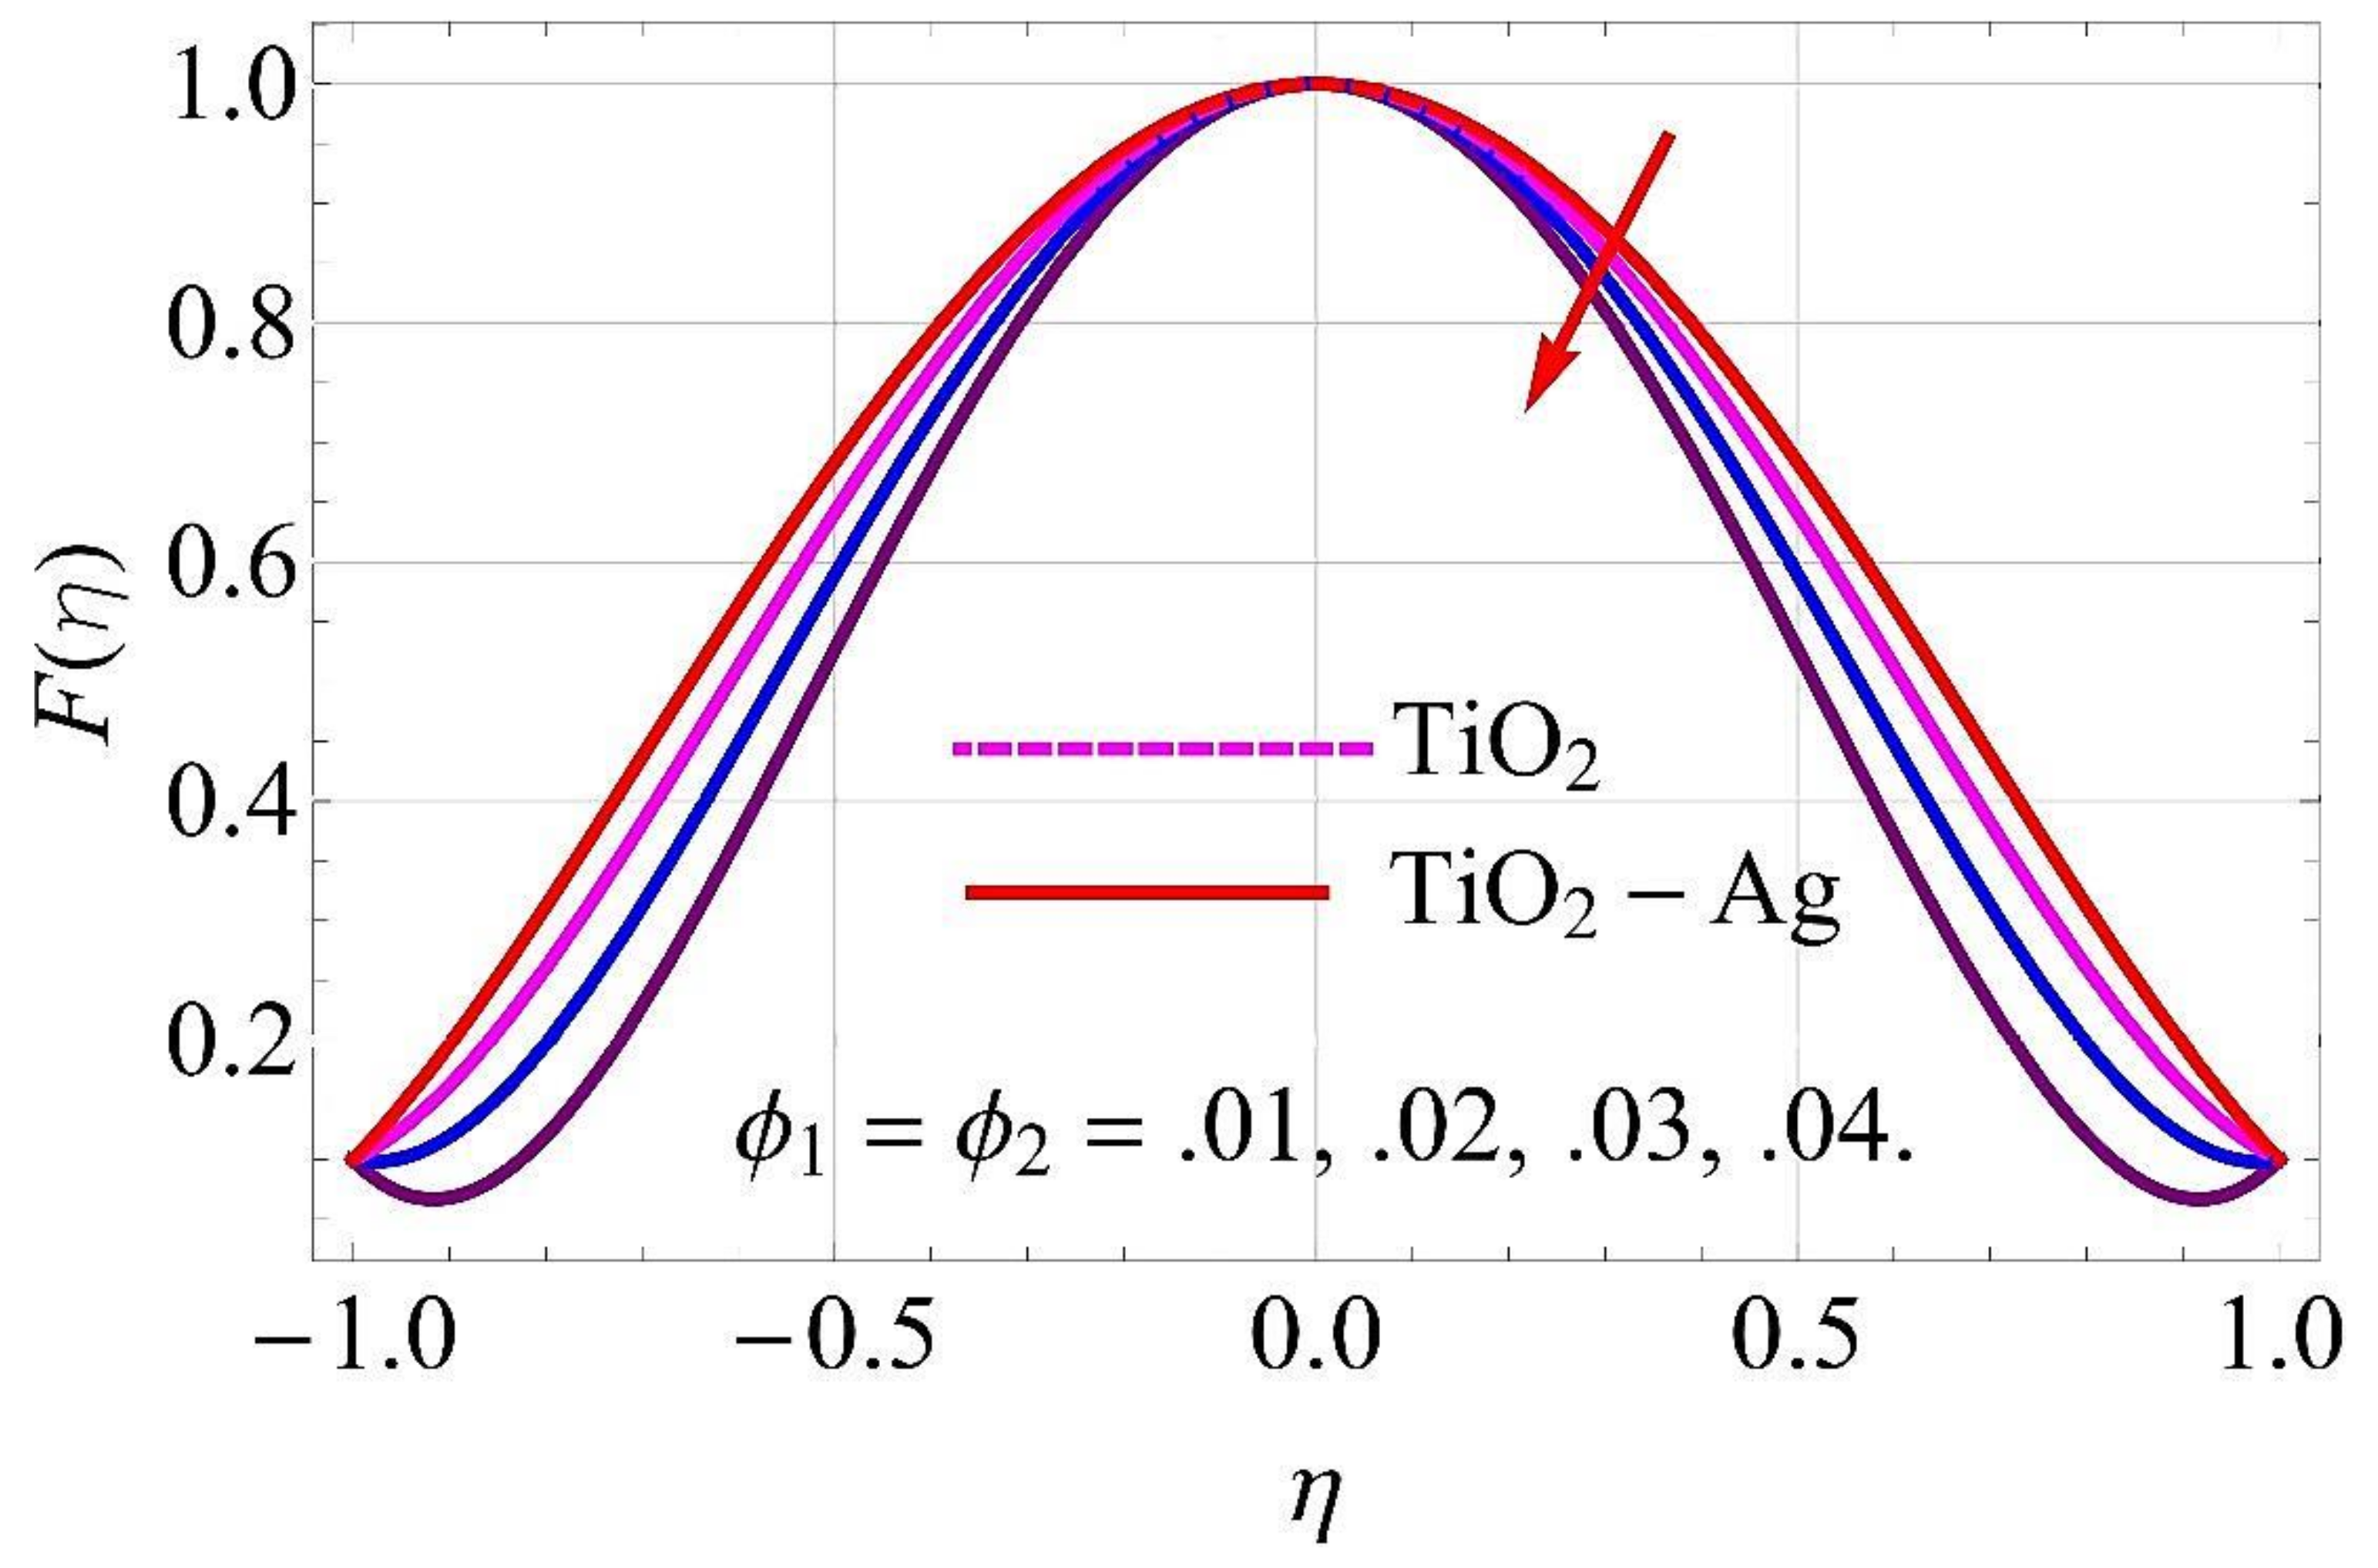
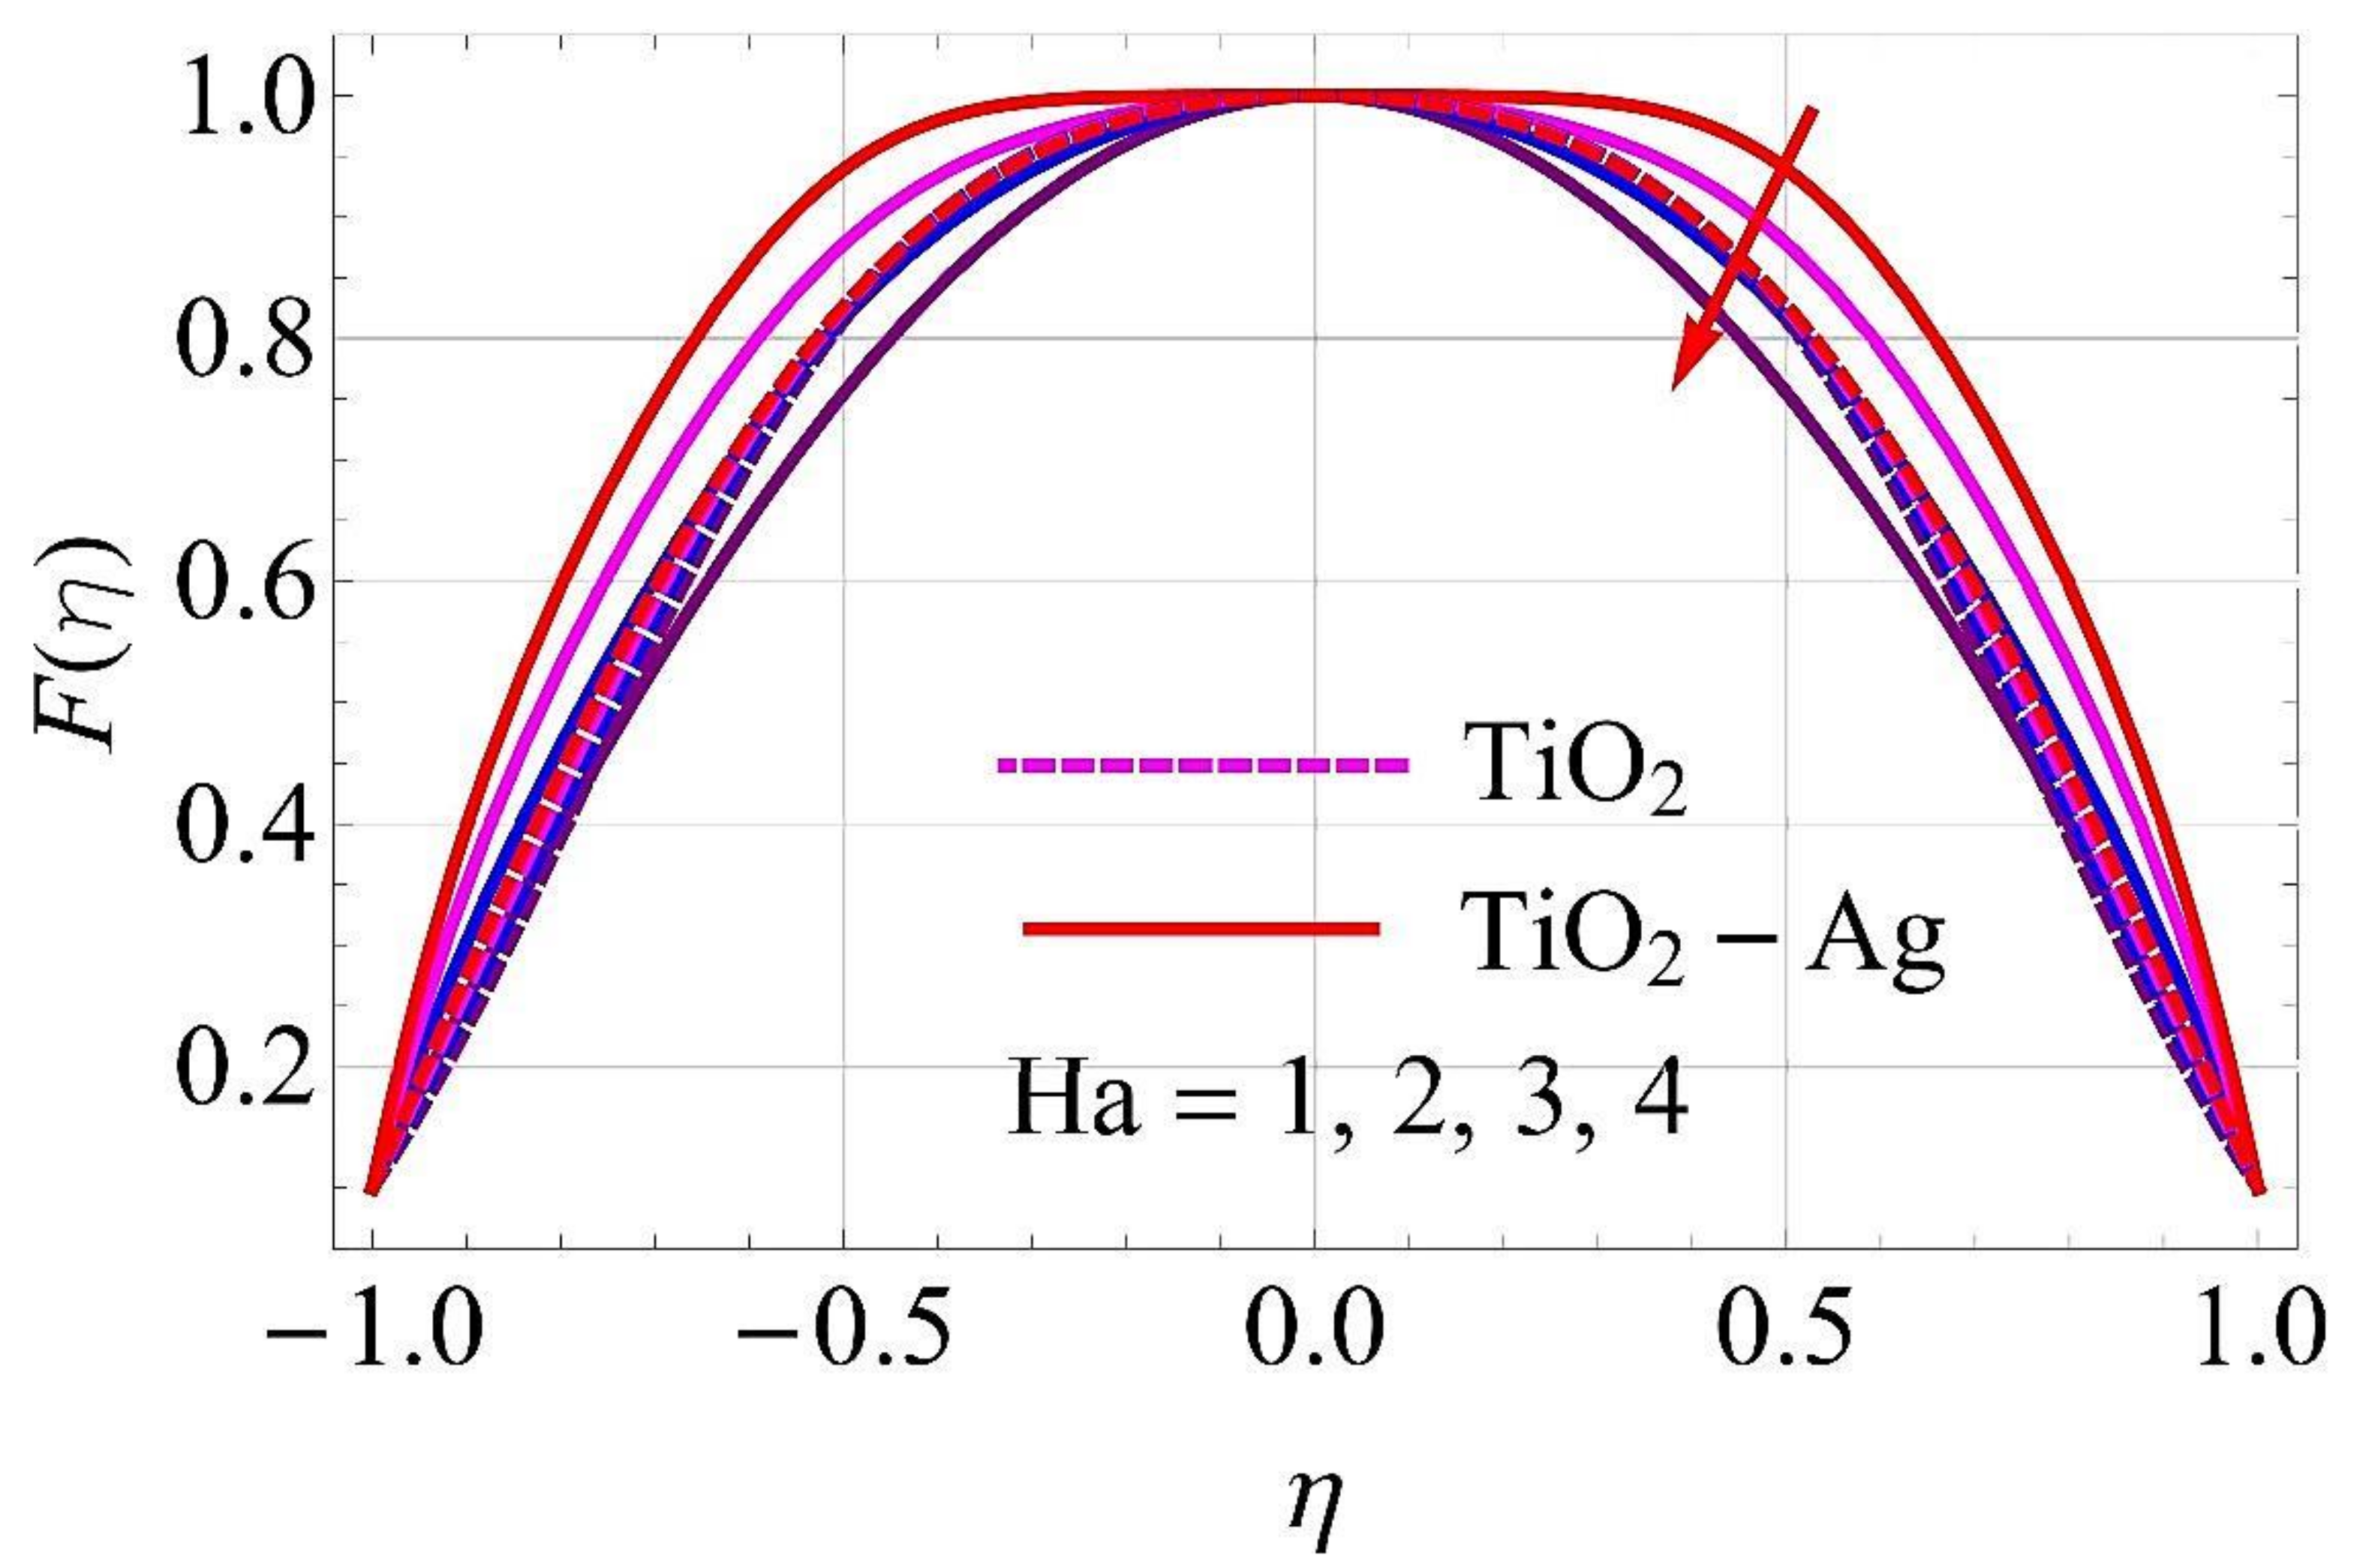
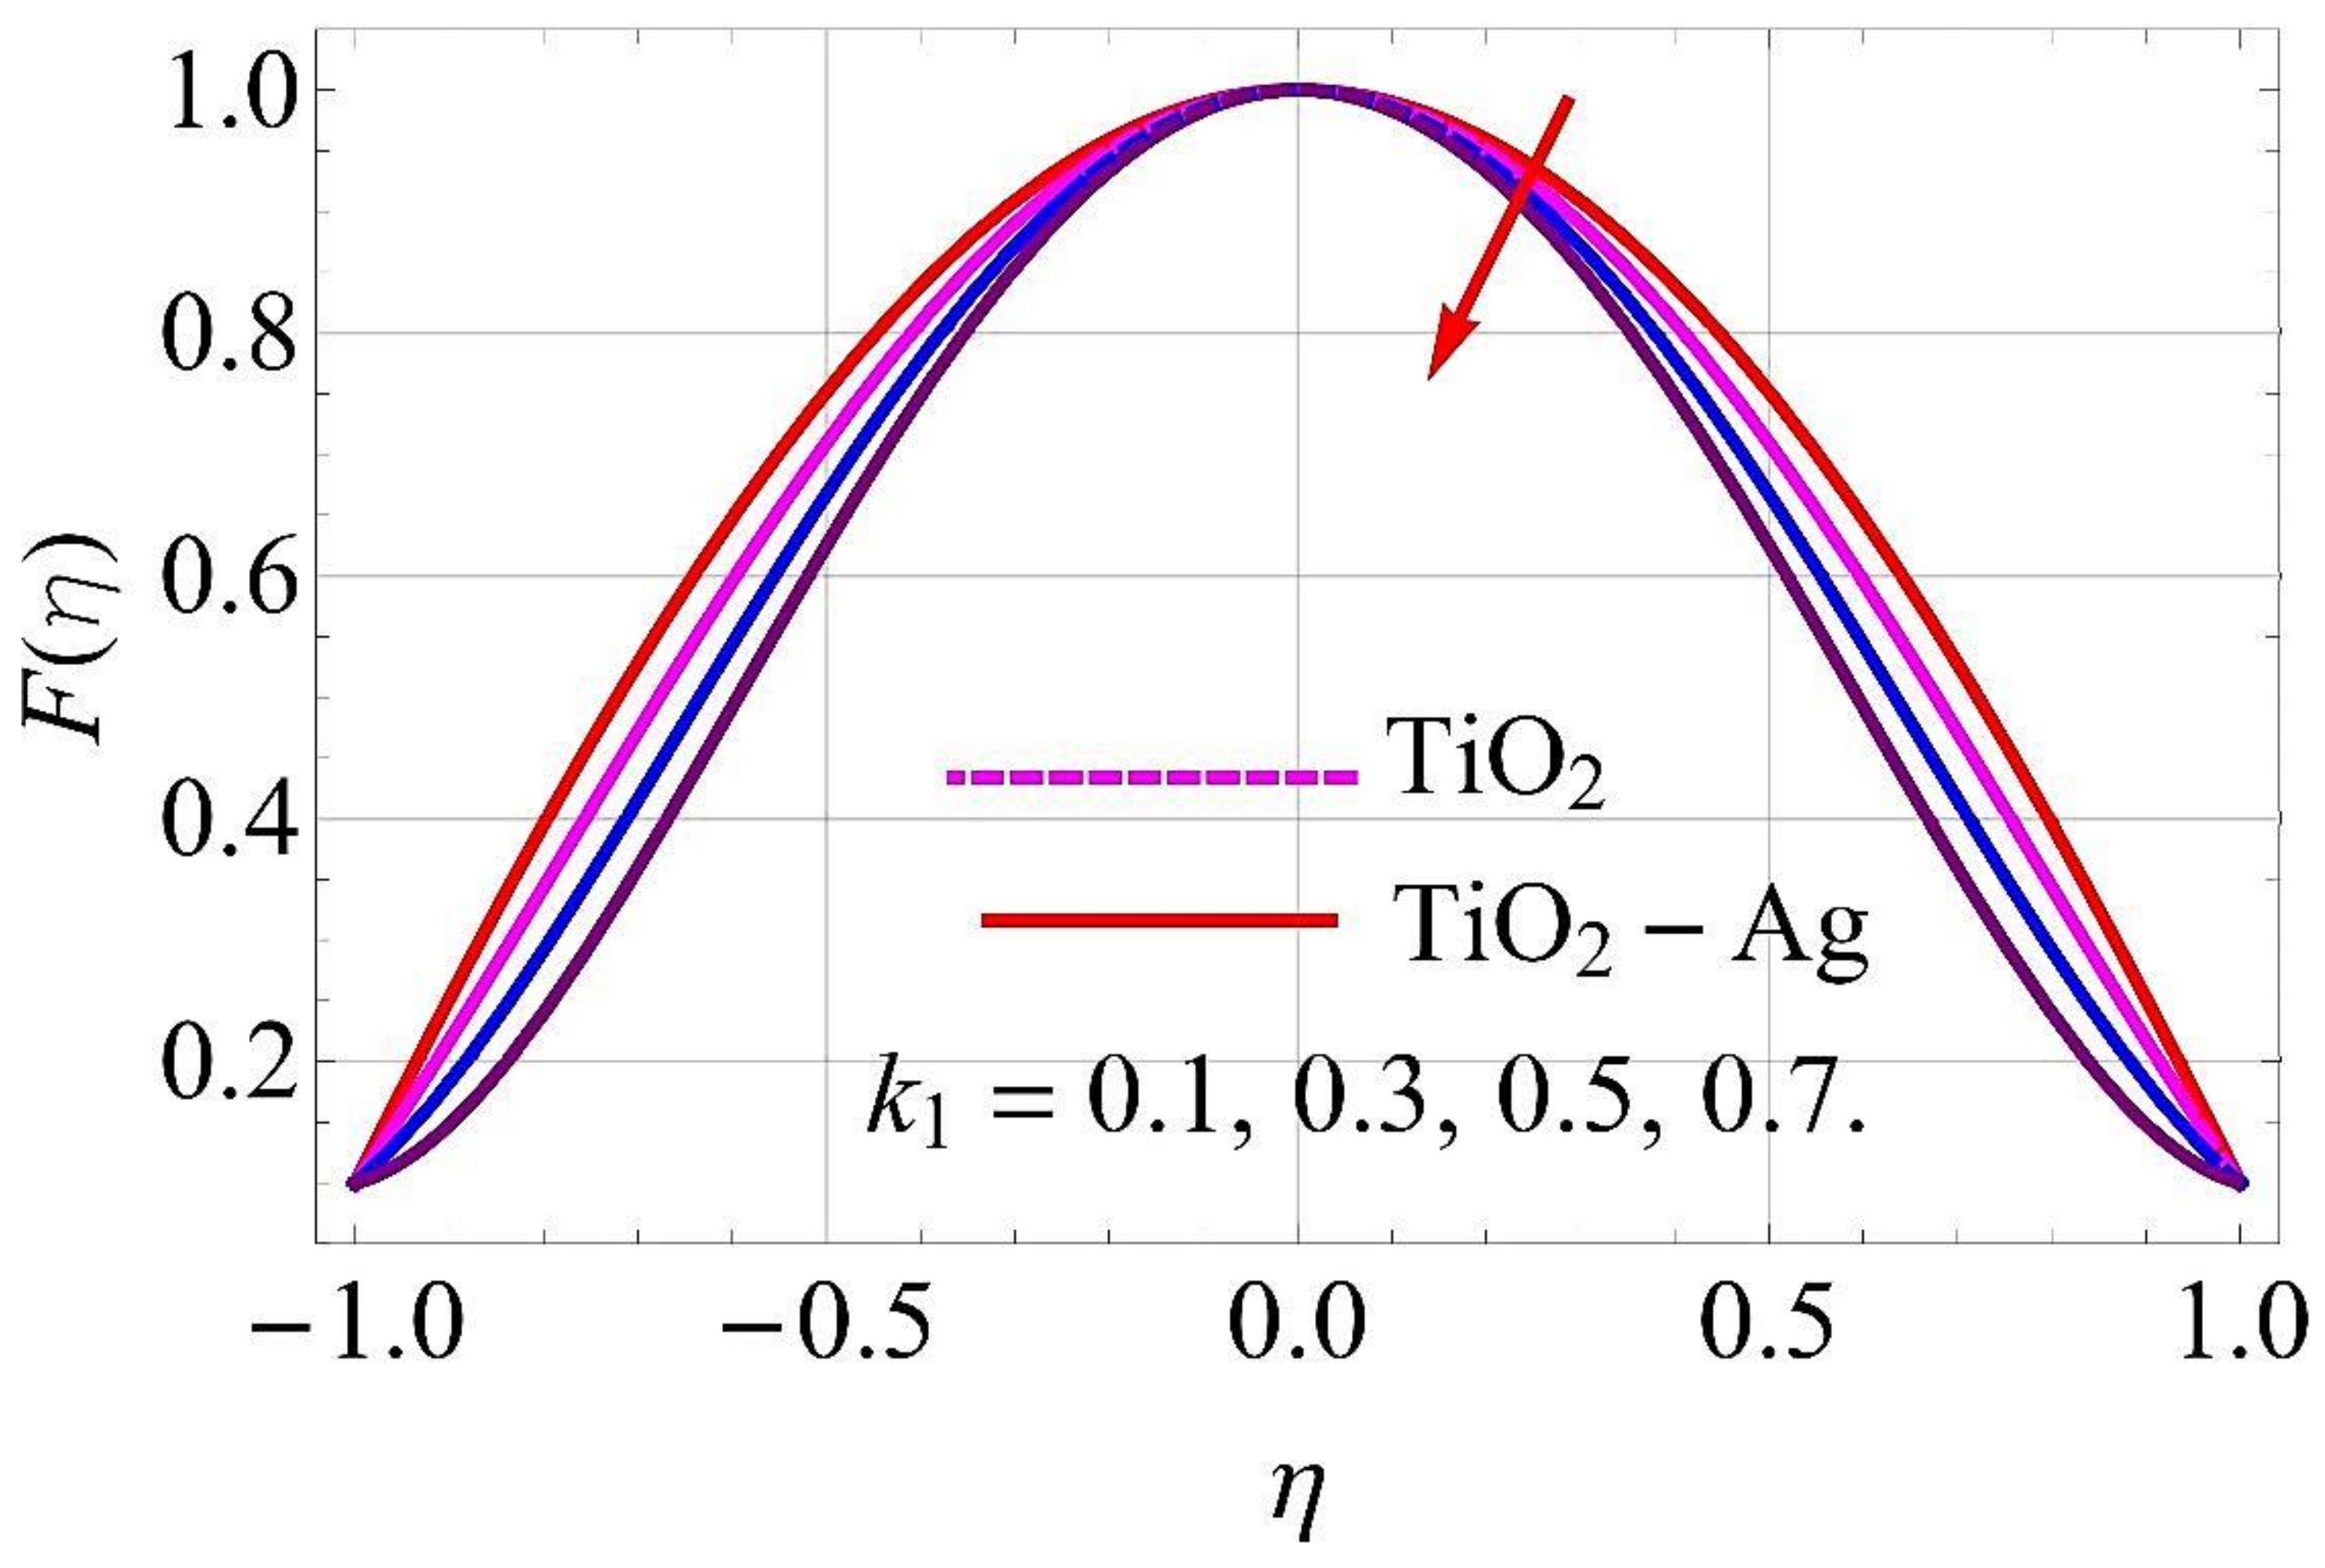
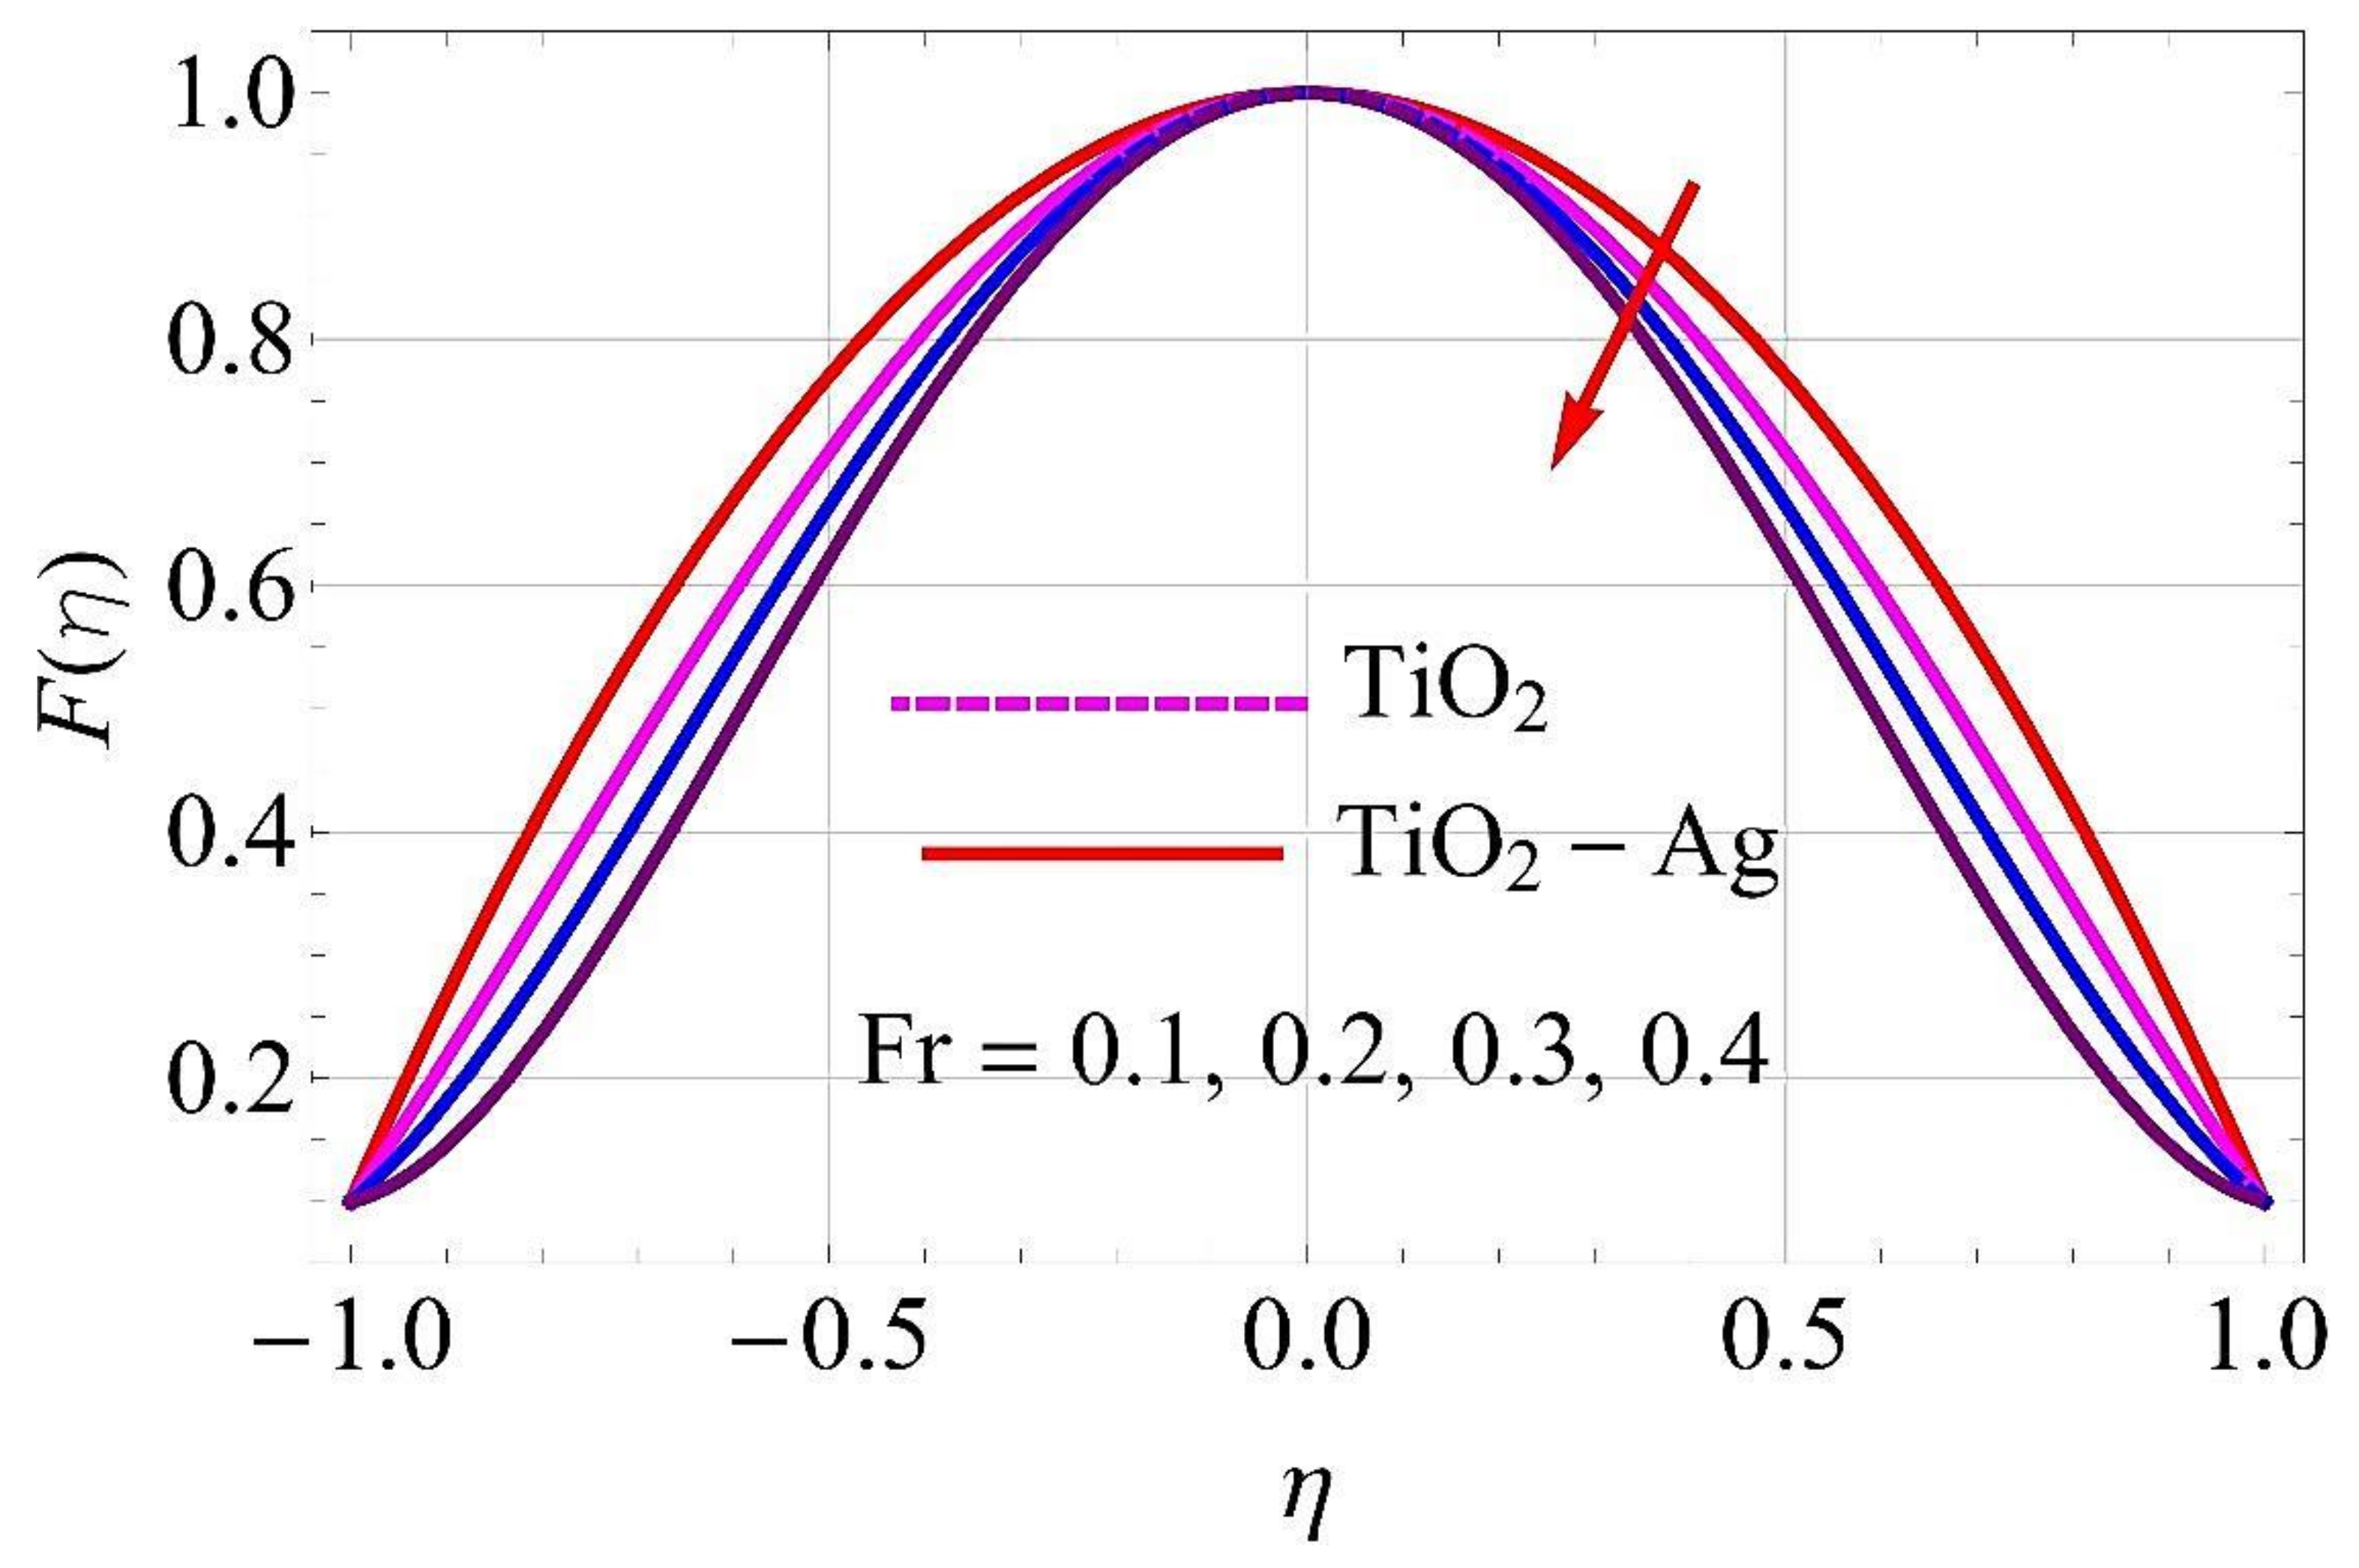
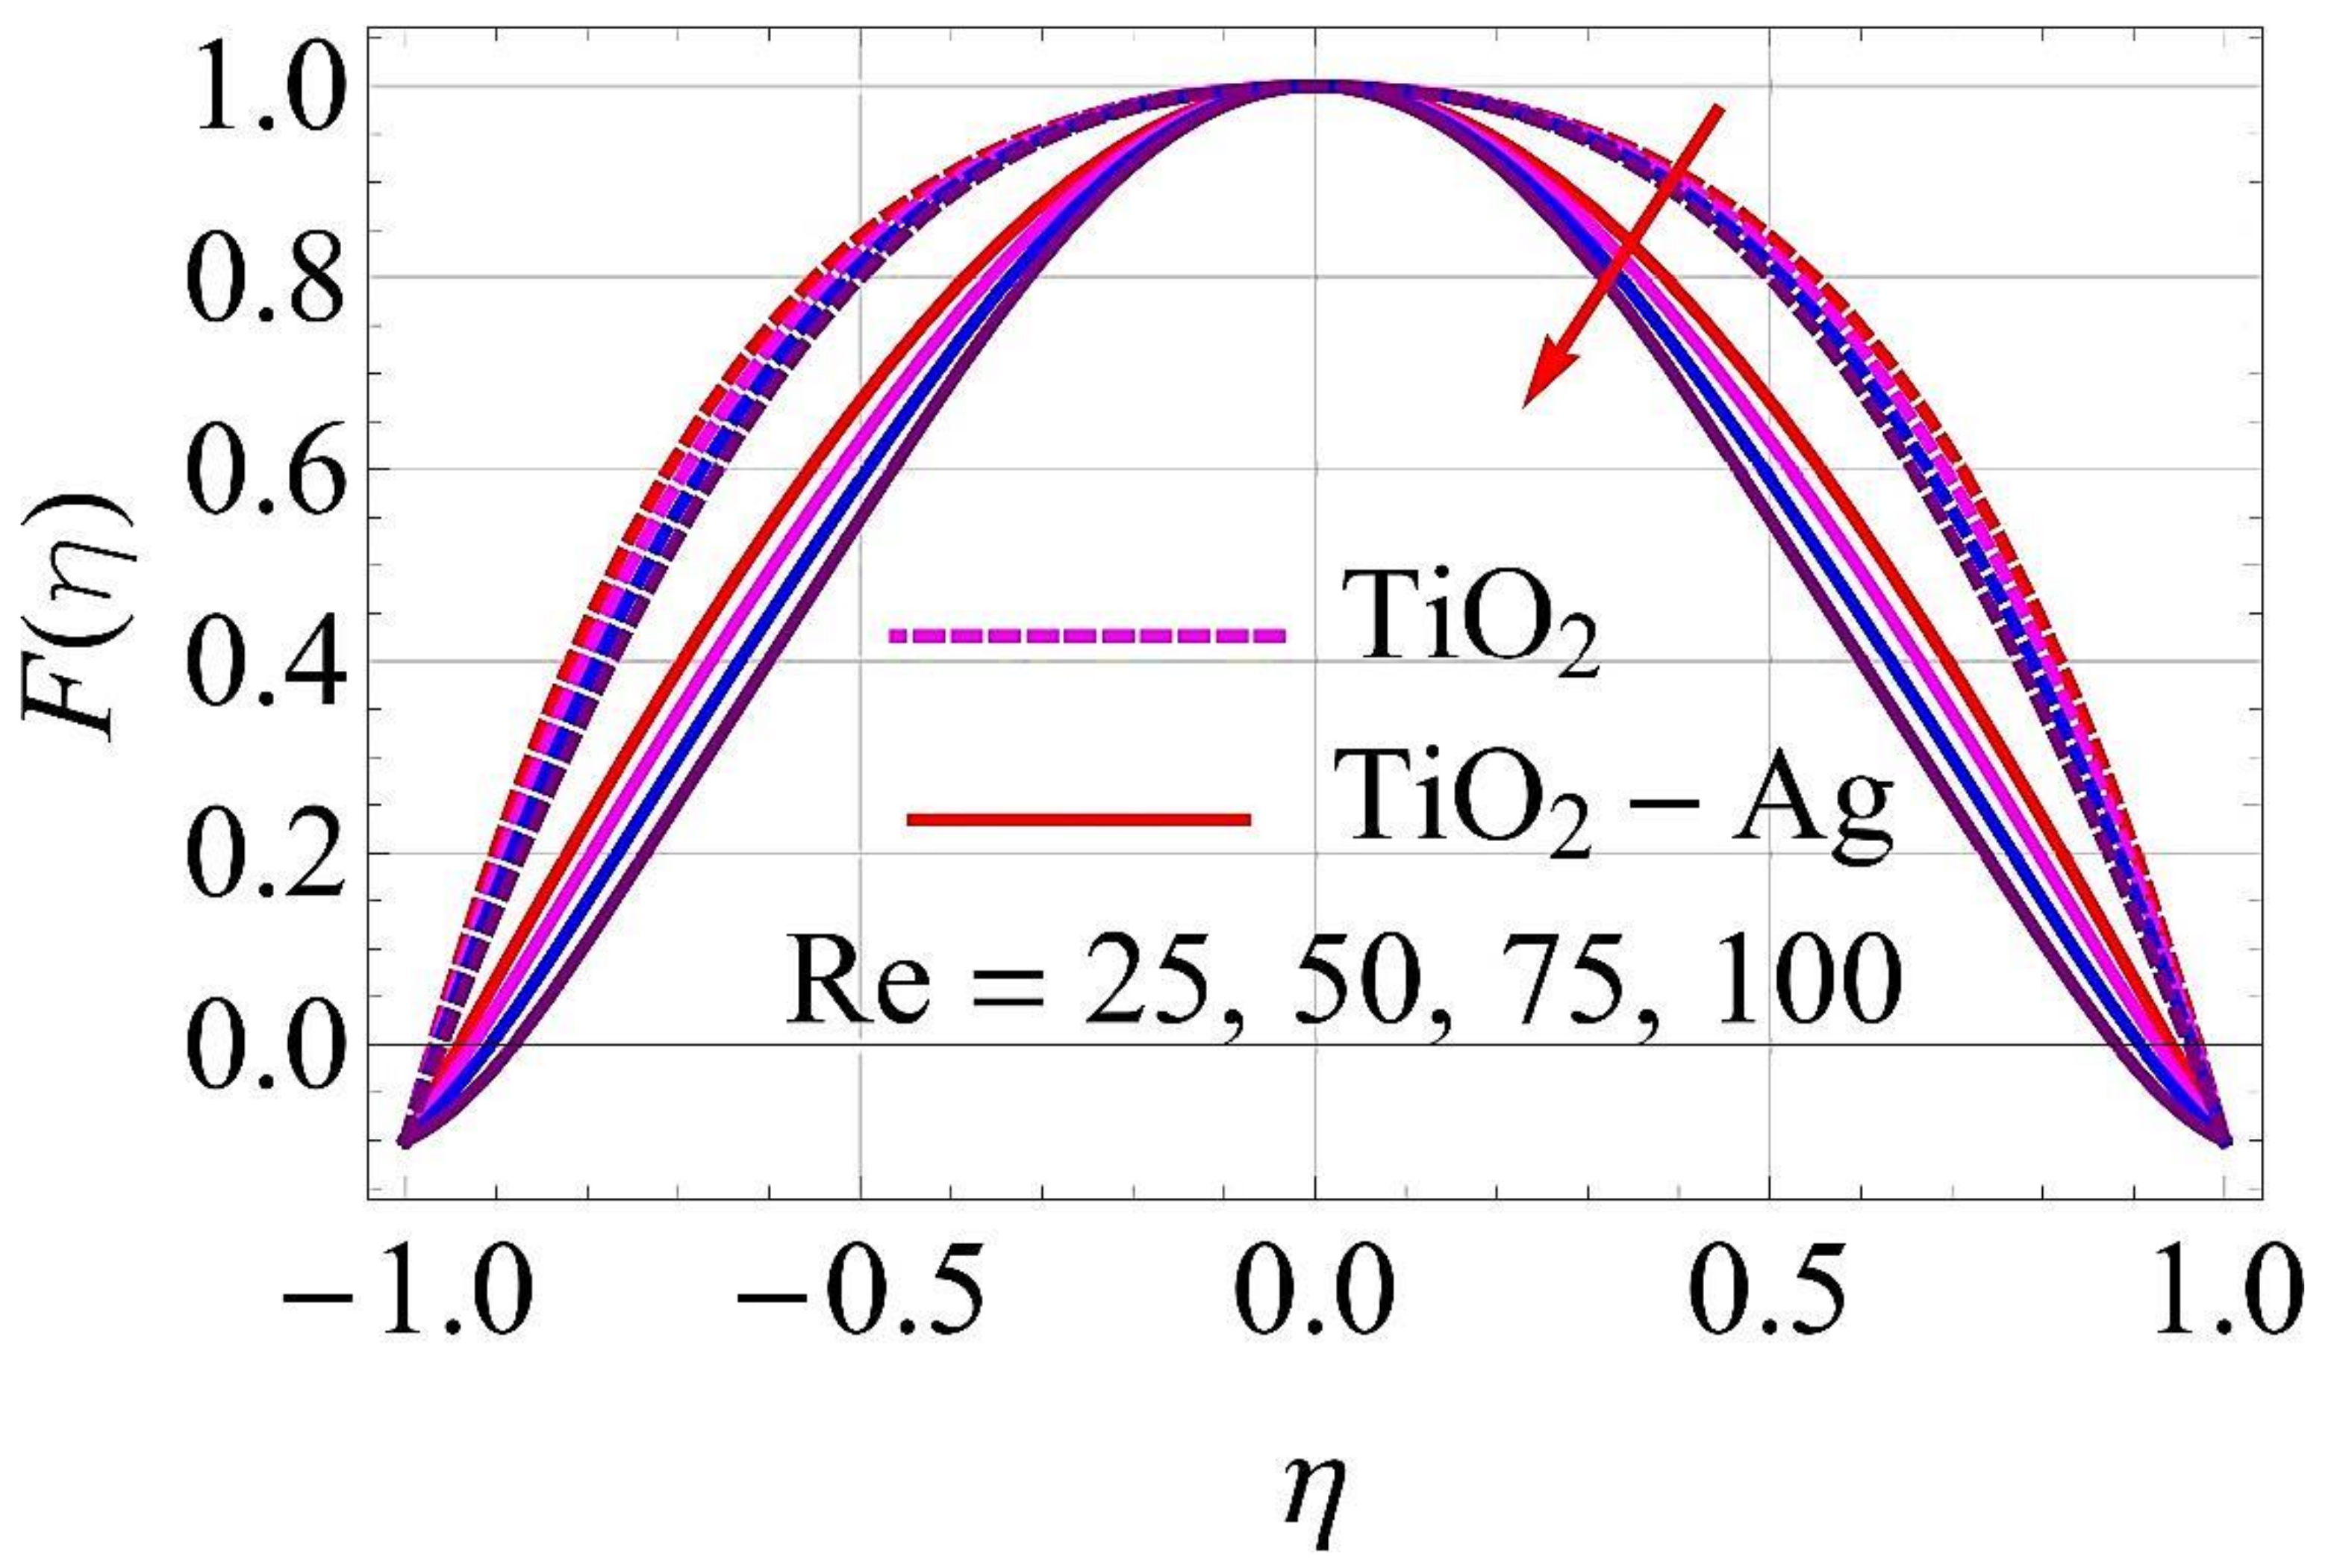
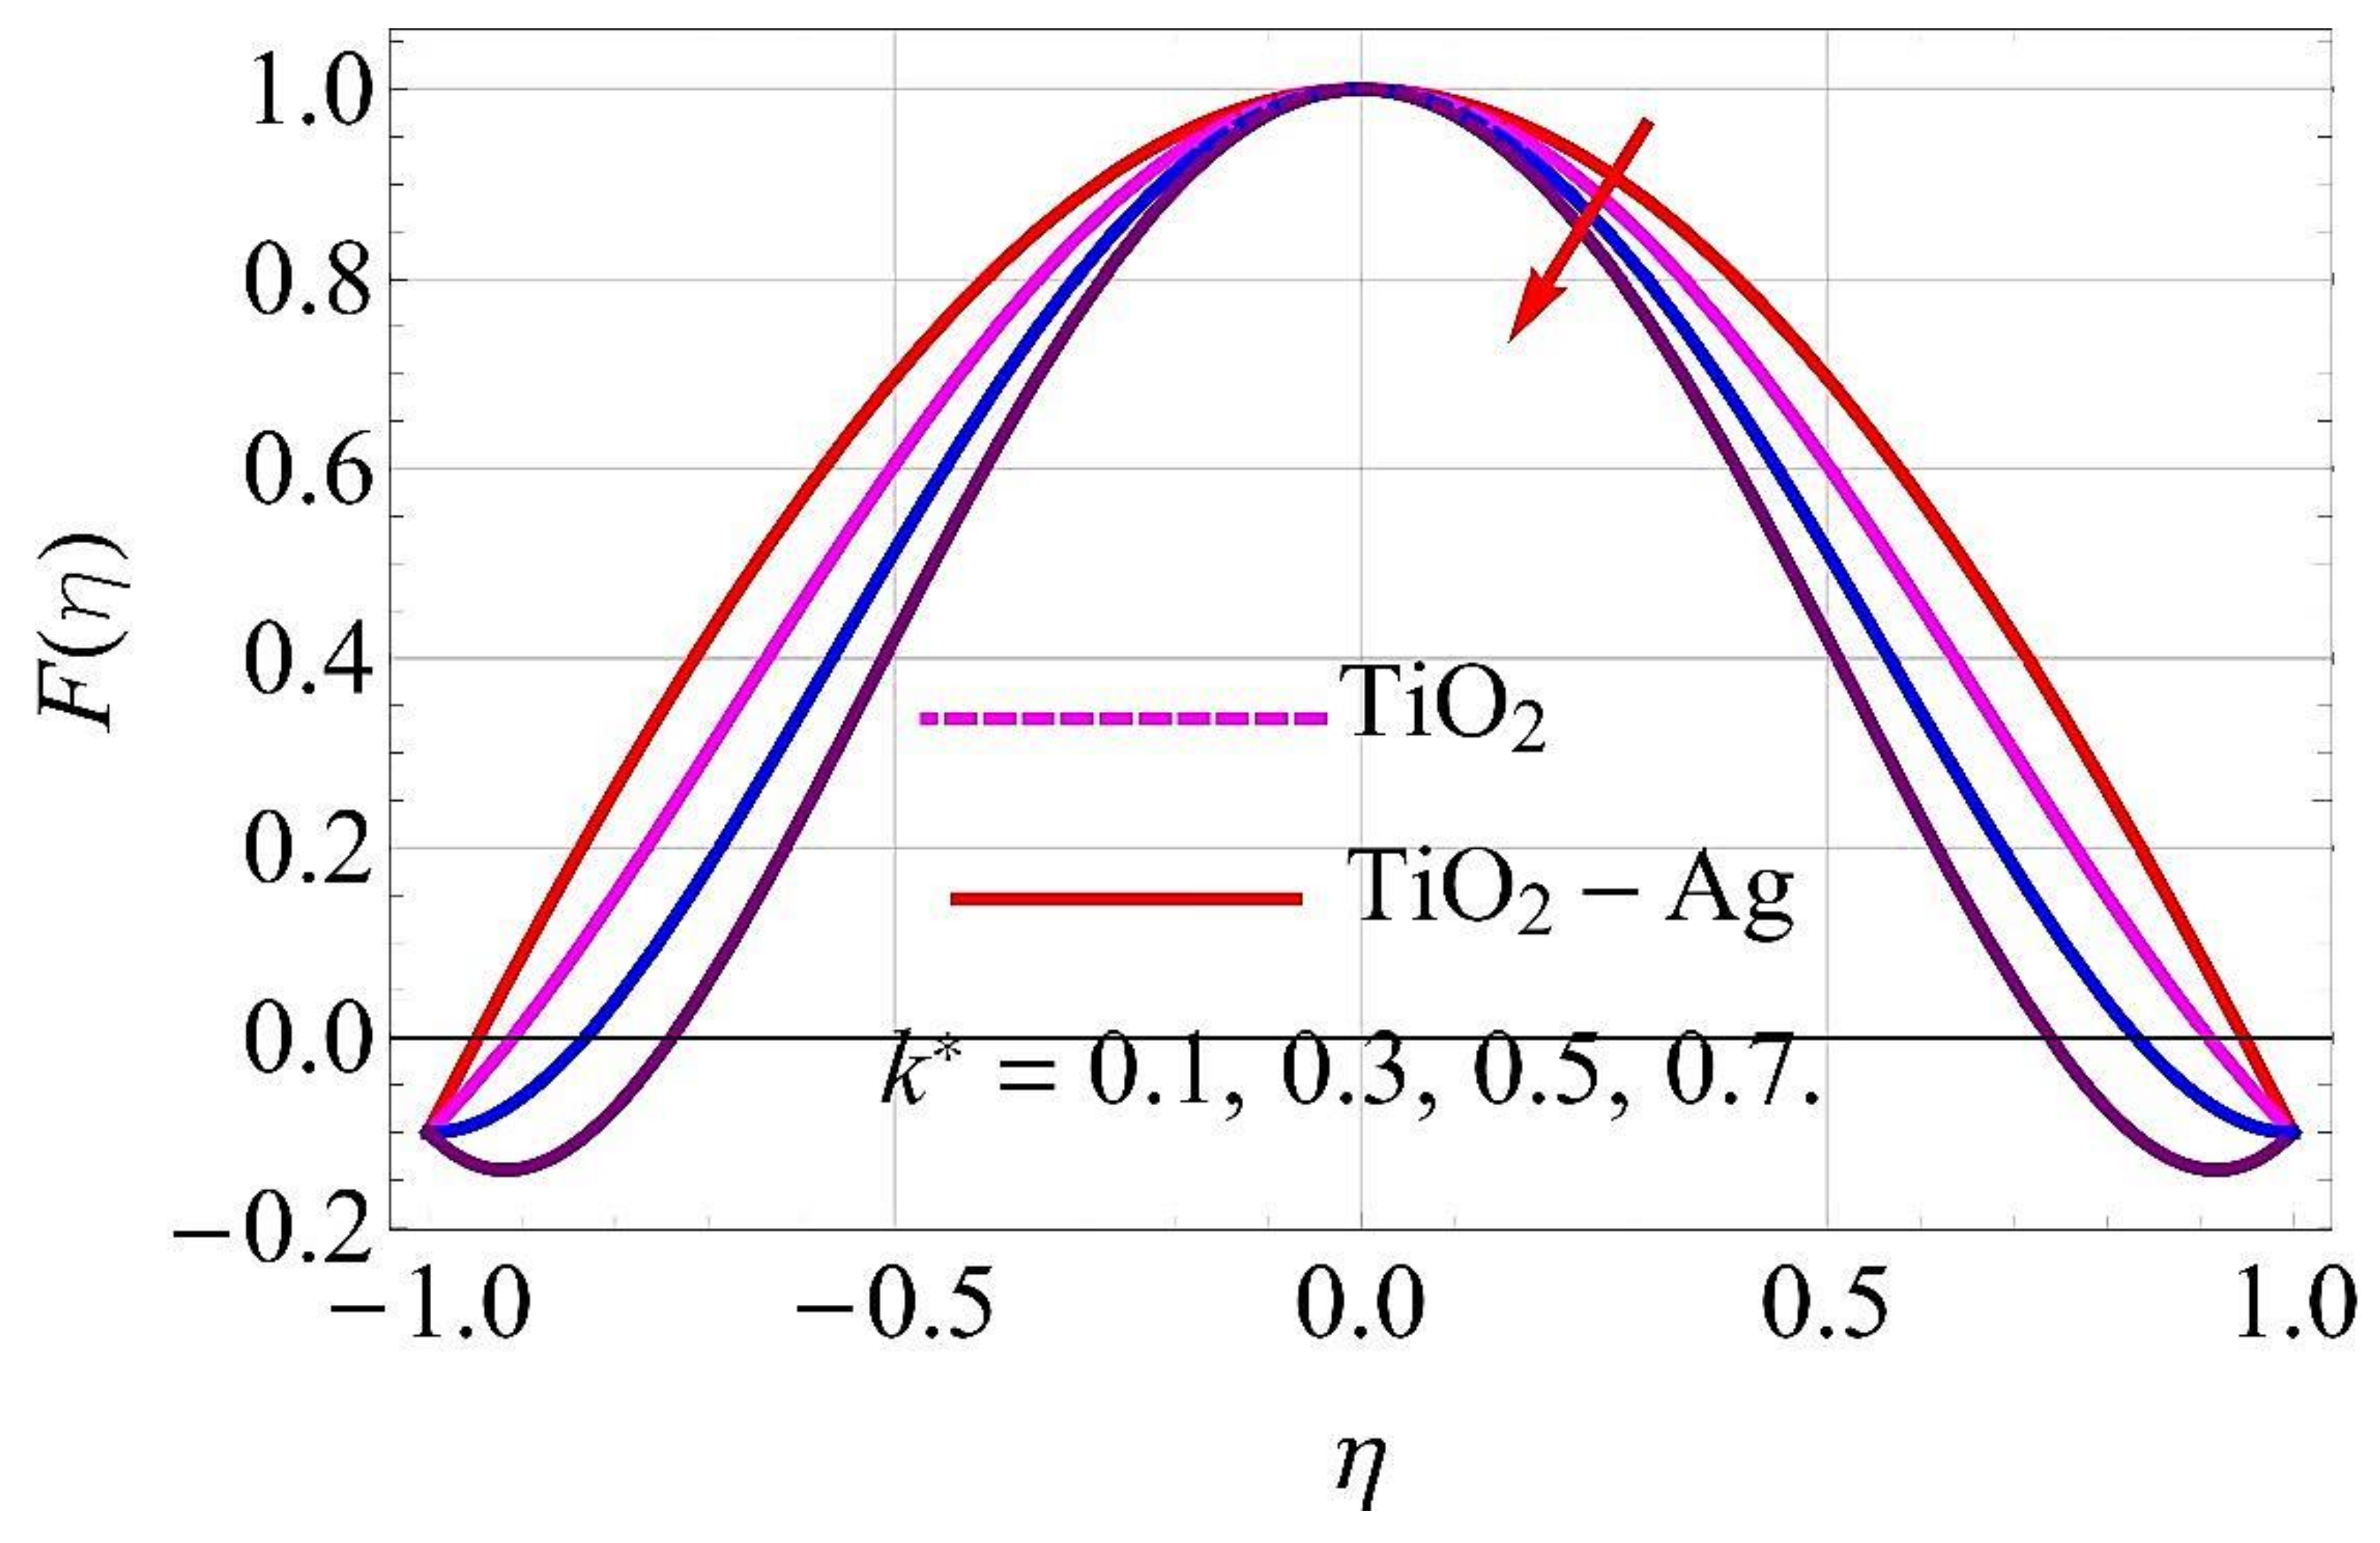
- The velocity field declines with the accumulative values of the parameters
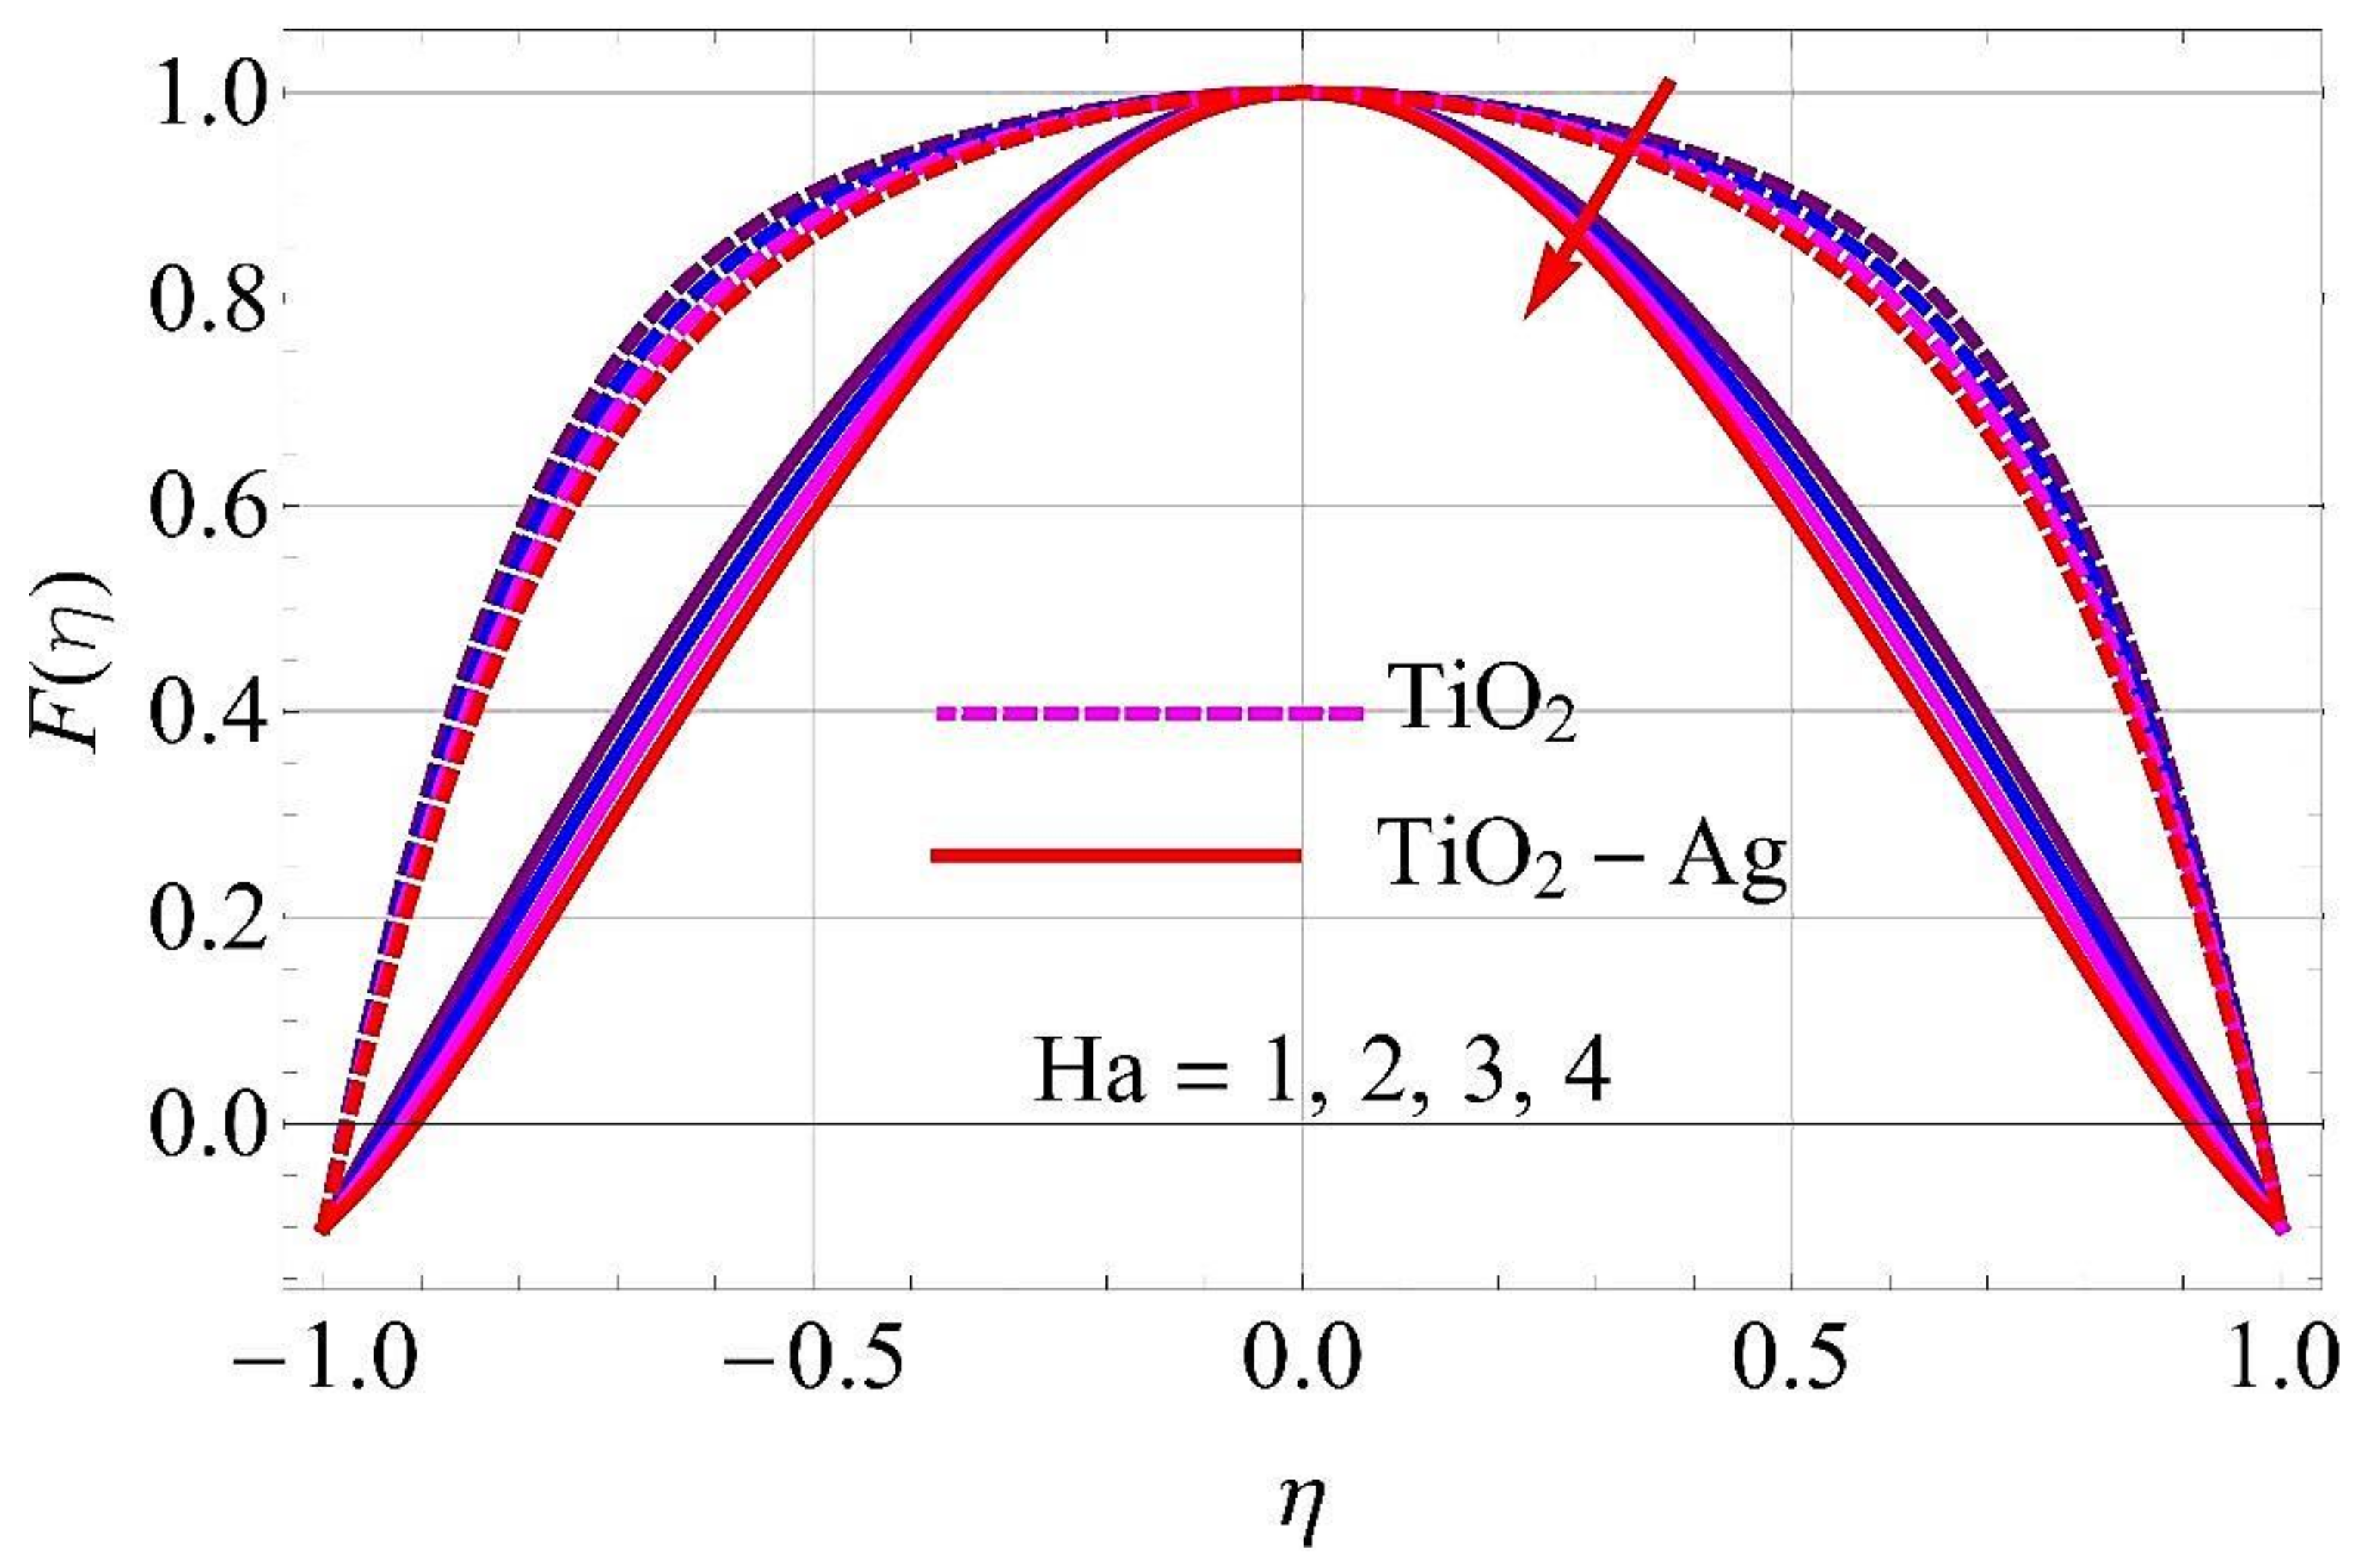
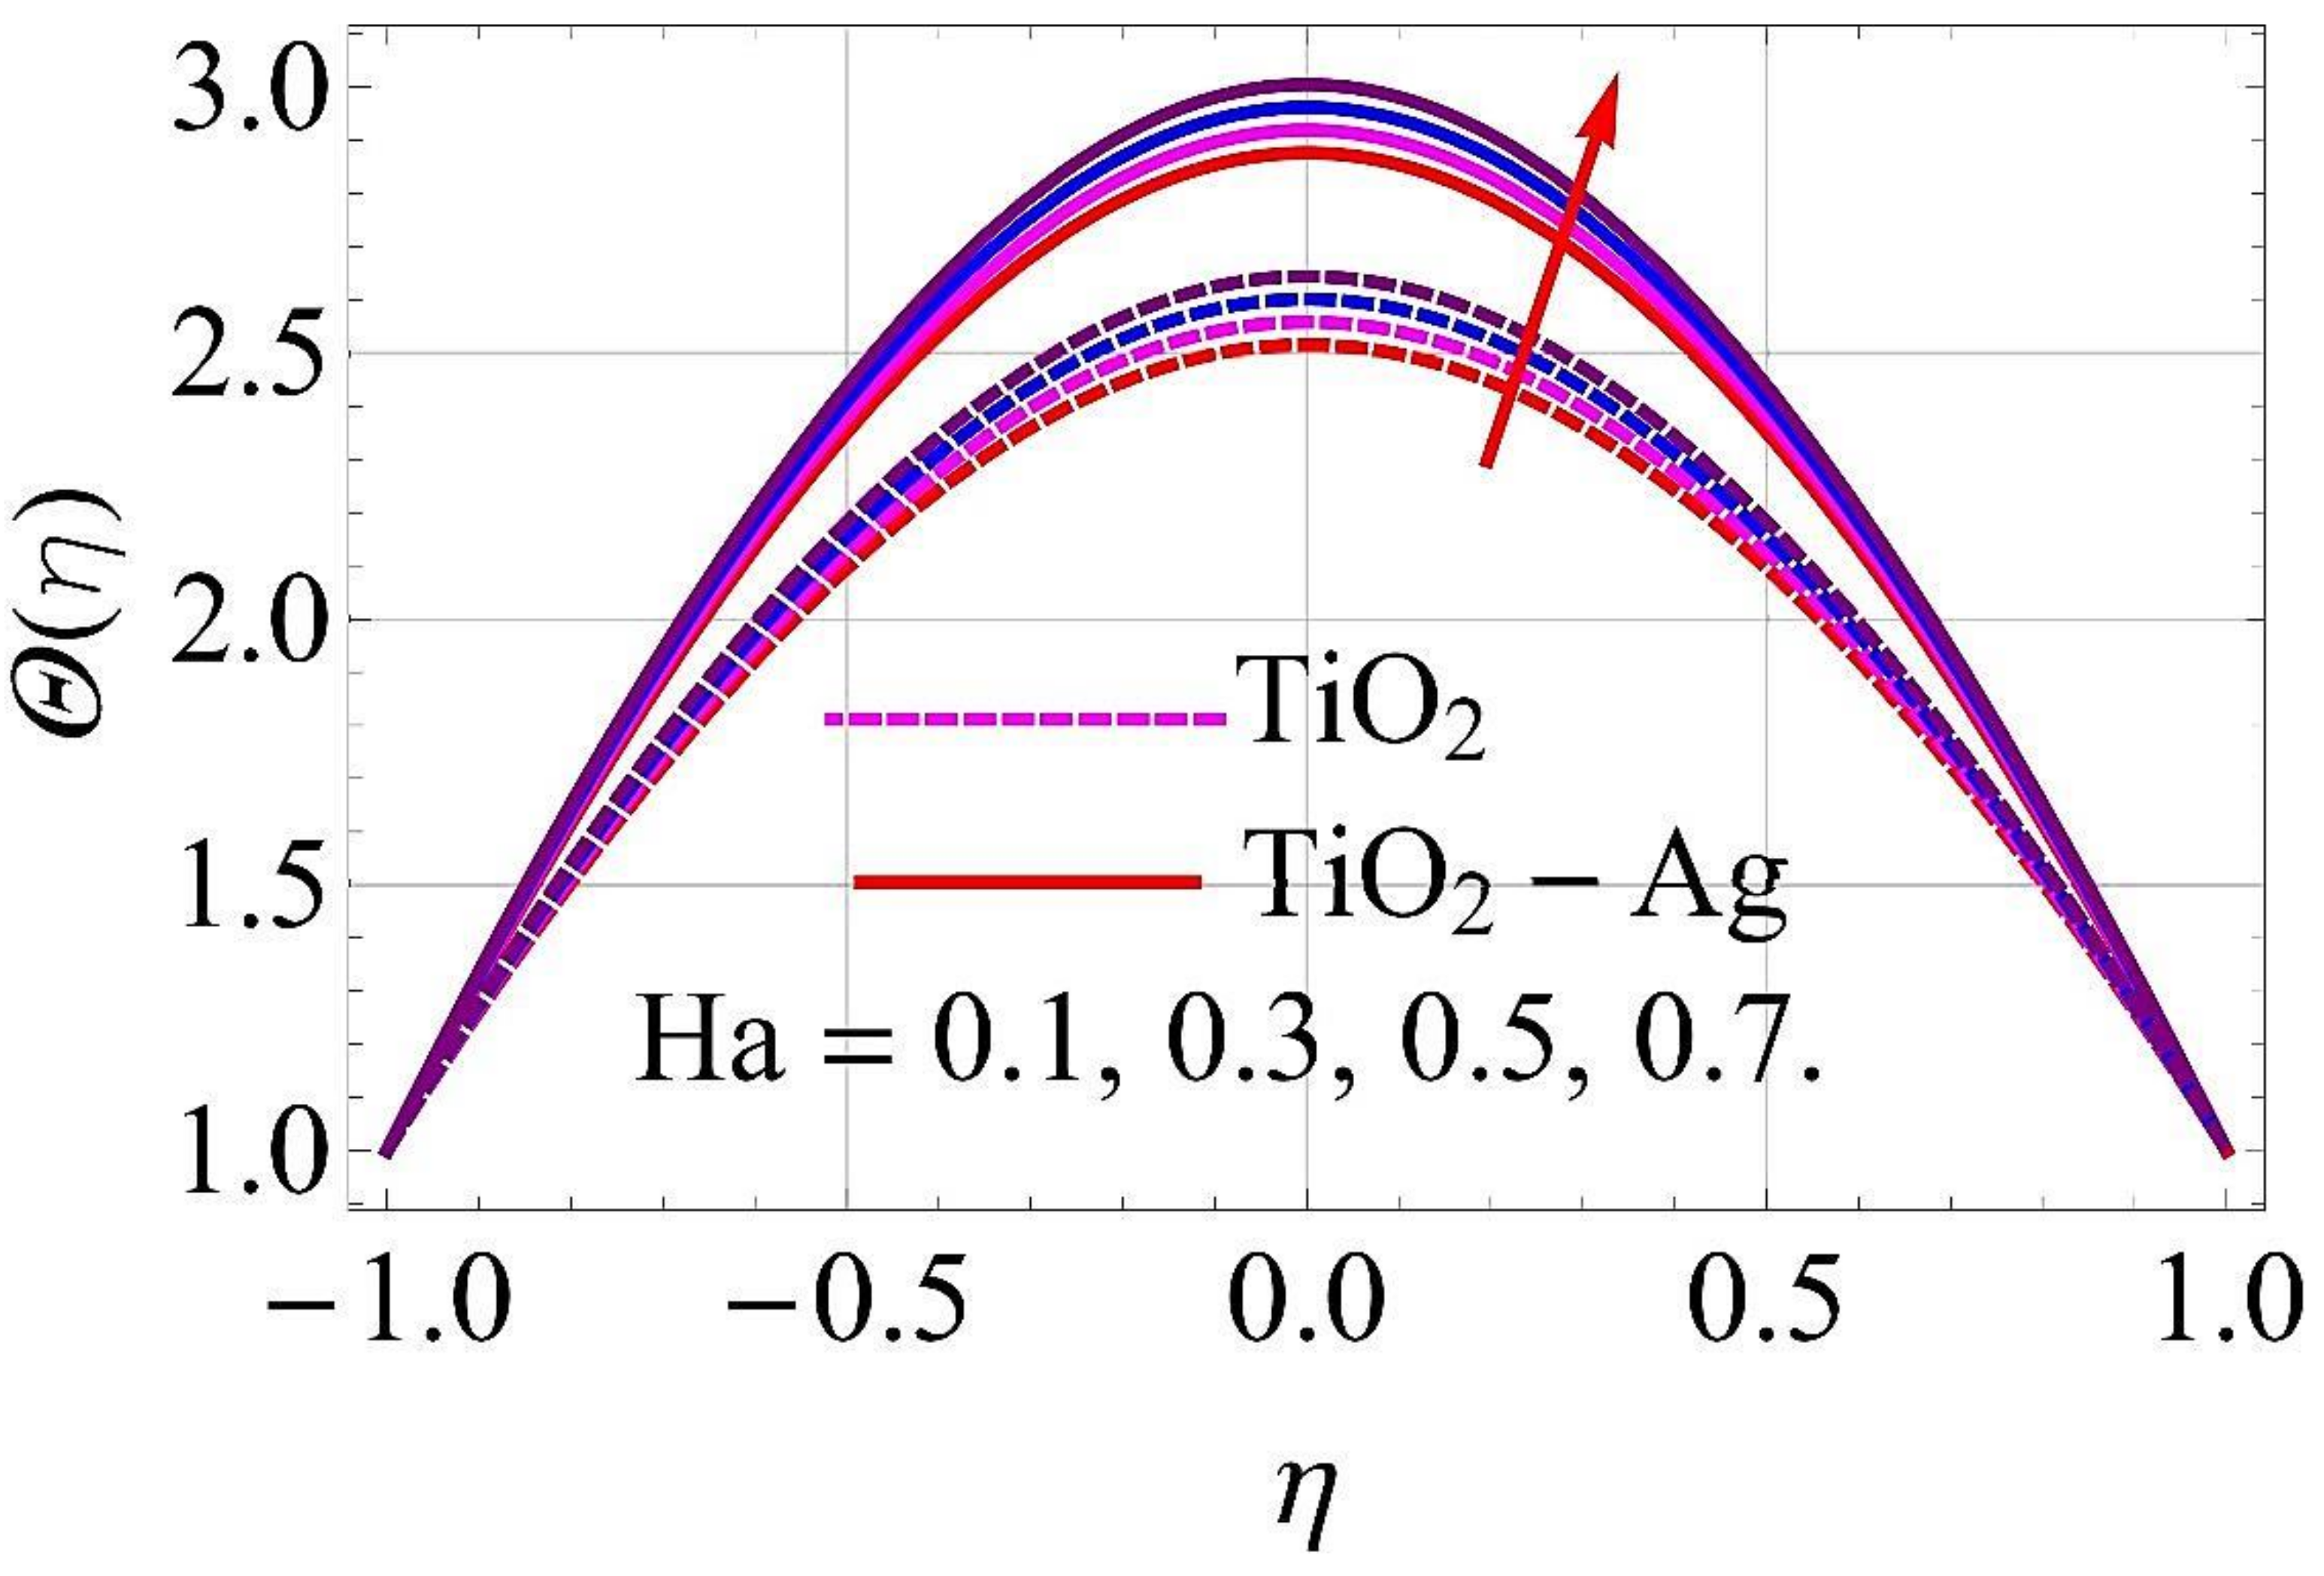
- The Hartmann number has a significant role in blood flow analysis. The strong magnetic field declines the hybrid nanofluid motion.
- hybrid nanofluids have an important role in Escherichia coli culture to evaluate their antibacterial strength.
- The electric conductivity and pH values improve with the increment in heat transfer. Therefore, the purpose of the recent study was to use the hybrid nanofluids for medication.
6. Future Suggestions
- The researcher can use the slip conditions for the same model.
- The current study could be extended to consider other nanoparticles and fluids for industrial uses.
- The same model could be extended to include concentration and bioconvection microorganisms.
- Other numerical and analytical methods can extend the present work by using the comparative analysis.
Author Contributions
Funding
Institutional Review Board Statement
Informed Consent Statement
Data Availability Statement
Acknowledgments
Conflicts of Interest
References
- Sheikholeslami, M.; Ganji, D.D.; Ashorynejad, H.R.; Rokni, H.B. Analytical investigation of Jeffery-Hamel flow with high magnetic field and nanoparticle by Adomian decomposition method. Appl. Math. Mech. 2012, 33, 25–36. [Google Scholar] [CrossRef]
- Turkyilmazoglu, M. Extending the traditional Jeffery-Hamel flow to stretchable convergent/divergent channels. Comput. Fluids 2014, 100, 196–203. [Google Scholar] [CrossRef]
- Dogonchi, A.S.; Ganji, D.D. Investigation of MHD nanofluid flow and heat transfer in a stretching/shrinking convergent/divergent channel considering thermal radiation. J. Mol. Liq. 2016, 220, 592–603. [Google Scholar] [CrossRef]
- Ahmed, N.; Abbasi, A.; Khan, U.; Mohyud-Din, S.T. Thermal radiation effects on flow of Jeffery fluid in converging and diverging stretchable channels. Neural Comput. Appl. 2018, 30, 2371–2379. [Google Scholar] [CrossRef]
- Mishra, A.; Pandey, A.K.; Chamkha, A.J.; Kumar, M. Roles of nanoparticles and heat generation/absorption on MHD flow of Ag–H 2 O nanofluid via porous stretching/shrinking convergent/divergent channel. J. Egypt. Math. Soc. 2020, 28, 1–18. [Google Scholar] [CrossRef]
- Gnaneswara Reddy, M.; Kumara, B.C.; Makinde, O.D. Cross diffusion impacts on hydromagnetic radiative peristaltic Carreau-Casson nanofluids flow in an irregular channel. Defect Diffus. Forum. 2017, 377, 62–83. [Google Scholar] [CrossRef]
- Moghimi, S.M.; Hunter, A.C.; Murray, J.C. Nanomedicine: Current status and future prospects. FASEB J. 2005, 19, 311–330. [Google Scholar] [CrossRef]
- Godin, B.; Sakamoto, J.H.; Serda, R.E.; Grattoni, A.; Bouamrani, A.; Ferrari, M. Emerging applications of nanomedicine for the diagnosis and treatment of cardiovascular diseases. Trends Pharm. Sci. 2010, 31, 199–205. [Google Scholar] [CrossRef] [PubMed]
- Reddy, M.G.; Makinde, O.D. Magnetohydrodynamic peristaltic transport of Jeffrey nanofluid in an asymmetric channel. J. Mol. Liq. 2016, 223, 1242–1248. [Google Scholar] [CrossRef]
- Shahzadi, I.; Bilal, S. A significant role of permeability on blood flow for hybrid nanofluid through bifurcated stenosed artery: Drug delivery application. Comput. Methods Programs Biomed. 2020, 187, 105248. [Google Scholar] [CrossRef]
- Choi, S.U.; Eastman, J.A. Enhancing Thermal Conductivity of Fluids with Nanoparticles; No. ANL/MSD/CP-84938; CONF-951135-29; Argonne National Lab.: Lemont, IL, USA, 1995.
- Nadeem, S.; Ijaz, S. Theoretical analysis of metallic nanoparticles on blood flow through stenosed artery with permeable walls. Phys. Lett. A 2015, 379, 542–554. [Google Scholar] [CrossRef]
- Ellahi, R.; Rahman, S.U.; Nadeem, S.; Akbar, N.S. Blood flow of nanofluid through an artery with composite stenosis and permeable walls. Appl. Nanosci. 2014, 4, 919–926. [Google Scholar] [CrossRef]
- Nadeem, S.; Ijaz, S. Theoretical examination of nanoparticles as a drug carrier with slip effects on the wall of stenosed arteries. Int. J. Heat Mass Transf. 2016, 93, 1137–1149. [Google Scholar] [CrossRef]
- Dinarvand, S.; Rostami, M.N.; Dinarvand, R.; Pop, I. Improvement of drug delivery micro-circulatory system with a novel pattern of CuO-Cu/blood hybrid nanofluid flow towards a porous stretching sheet. Int. J. Numer. Methods Heat Fluid Flow. 2019, 29, 4408–4429. [Google Scholar] [CrossRef]
- Bahrami, B.; Hojjat-Farsangi, M.; Mohammadi, H.; Anvari, E.; Ghalamfarsa, G.; Yousefi, M.; Jadidi-Niaragh, F. Nanoparticles and targeted drug delivery in cancer therapy. Immunol. Lett. 2017, 190, 64–83. [Google Scholar] [CrossRef]
- Liu, L.; Miao, P.; Xu, Y.; Tian, Z.; Zou, Z.; Li, G. Study of Pt/TiO2 nanocomposite for cancer-cell treatment. J. Photochem. Photobiol. B Biol. 2010, 98, 207–210. [Google Scholar] [CrossRef]
- Chahregh, H.S.; Dinarvand, S. TiO2-Ag/blood hybrid nanofluid flow through an artery with applications of drug delivery and blood circulation in the respiratory system. Int. J. Numer. Methods Heat Fluid Flow. 2020, 30, 4775–4796. [Google Scholar] [CrossRef]
- Misra, J.C.; Chandra, S. Effect of couple stresses on electrokinetic oscillatory flow of blood in the microcirculatory system. J. Mech. Med. Biol. 2018, 18, 1850035. [Google Scholar] [CrossRef]
- Kollin, A. Electromagnetic flowmeter: Principle of method and its application to blood flow measurement. Proc. Soc. Exp. Biol. Med. 1936, 35, 235–244. [Google Scholar]
- Korchevskii, E.M.; Marochnik, L.S. Magnetohydrodynamic version of movement of blood. Biophysics 1965, 10, 411–414. [Google Scholar]
- Rao, A.R.; Deshikachar, K.S. Physiological-type flow in a circular pipe in the presence of a transverse magnetic field. J. Indian Inst. Sci. 1988, 68, 247. [Google Scholar]
- Vardanyan, V.A. Effect of magnetic field on blood flow. Biofizika 1973, 18, 491–496. [Google Scholar]
- Bakhti, H.; Azrar, L. Steady flow of couple-stress fluid in constricted tapered artery: Effects of transverse magnetic field, moving catheter, and slip velocity. J. Appl. Math. 2016, 2016, 9289684. [Google Scholar] [CrossRef][Green Version]
- Freeman, N.E. The effect of temperature on the rate of blood flow in the normal and in the sympathectomized hand. Am. J. Physiol.-Leg. Content 1935, 113, 384–398. [Google Scholar] [CrossRef]
- Adams, T.; Spielman, W.S.; Holmes, K.R.; Heisey, S.R.; Chen, M.M. Proposed methods for the measurement of regional renal blood flow using heat transfer analysis. Ann. Biomed. Eng. 1985, 13, 237–258. [Google Scholar] [CrossRef]
- Kolios, M.C.; Worthington, A.E.; Holdsworth, D.W.; Sherar, M.D.; Hunt, J.W. An investigation of the flow dependence of temperature gradients near large vessels during steady state and transient tissue heating. Phys. Med. Biol. 1999, 44, 1479. [Google Scholar] [CrossRef]
- Chinyoka, T.; Makinde, O.D. Computational dynamics of arterial blood flow in the presence of magnetic field and thermal radiation therapy. Adv. Math. Phys. 2014, 2014, 915640. [Google Scholar] [CrossRef]
- Sinha, A.; Misra, J.C.; Shit, G.C. Effect of heat transfer on unsteady MHD flow of blood in a permeable vessel in the presence of non-uniform heat source. Alex. Eng. J. 2016, 55, 2023–2033. [Google Scholar] [CrossRef]
- Kumar, D.; Satyanarayana, B.; Kumar, R.; Kumar, S.; Deo, N. Application of Heat source and chemical reaction in MHD blood flow through permeable bifurcated arteries with inclined magnetic field in tumor treatments. Results Appl. Math. 2021, 10, 100151. [Google Scholar] [CrossRef]
- Saeed, A.; Tassaddiq, A.; Khan, A.; Jawad, M.; Deebani, W.; Shah, Z.; Islam, S. Darcy-Forchheimer MHD Hybrid Nanofluid Flow and Heat Transfer Analysis over a Porous Stretching Cylinder. Coatings 2020, 10, 391. [Google Scholar] [CrossRef]
- Devi, S.A.; Devi, S.S.U. Numerical investigation of hydromagnetic hybrid Cu–Al2O3/water nanofluid flow over a permeable stretching sheet with suction. Int. J. Non-Linear Sci. Num. Sim. 2016, 17, 249–257. [Google Scholar] [CrossRef]
- Liao, S.J. The Proposed Homotopy Analysis Technique for the Solution of Non-Linear Problems. Ph.D. Thesis, Shanghai Jiao Tong University, Shanghai, China, 1992. [Google Scholar]
- Liao, S.J. Explicit totally analytic approximate solution for blasius viscous flow problems. Int. J. Non-Linear Mech. 1999, 34, 759–778. [Google Scholar] [CrossRef]
- Liao, S.J. An optimal homotopyanalysis approach for strongly non-linear differential equations. Commun. Non-Linear Sci. Numer. Simul. 2010, 15, 2003–2016. [Google Scholar] [CrossRef]
- Gul, T.; Gul, R.S.; Noman, W.; Saeed, A.; Mukhtar, S.; Alghamdi, W.; Alrabaiah, H. CNTs-Nanofluid flow in a Rotating system between the gap of a disk and cone. Phys. Scr. 2020, 95, 125202. [Google Scholar] [CrossRef]
- Gul, T.; Ullah, M.Z.; Alzahrani, A.K.; Zaheer, Z.; Amiri, I.S. MHD thin film flow of kerosene oil based CNTs nanofluid under the Influence of Marangoni convection. Phys. Scr. 2019, 95, 015702. [Google Scholar] [CrossRef]
- Saeed, A.; Gul, T. Bioconvection Casson Nanofluid Flow Together with Darcy-Forchheimer Due to a Rotating Disk with Thermal Radiation and Arrhenius Activation Energy. SN Appl. Sci. 2021, 3, 1–19. [Google Scholar] [CrossRef]
- Khan, A.; Saeed, A.; Tassaddiq, A.; Gul, T.; Mukhtar, S.; Kumam, P.; Ali, I.; Kumam, W. Bio-convective micropolar nanofluid flow over thin moving needle subject to Arrhenius activation energy, viscous dissipation and binary chemical reaction. Case Stud. Therm. Eng. 2021, 25, 100989. [Google Scholar] [CrossRef]
- Ahmad, F.; Gul, T.; Khan, I.; Saeed, A.; Selim, M.M.; Kumam, P.; Ali, I. MHD thin film flow of the Oldroyd-B fluid together with bioconvection and activation energy. Case Stud. Therm. Eng. 2021, 27, 101218. [Google Scholar] [CrossRef]
- Alzahrani, A.K.; Zaka Ullah, M.; Alshomrani, S.A.; Gul, T. Hybrid nanofluid flow in a Darcy-Forchheimer Permeable Medium over a Flat Plate due to Solar Radiation. Case Stud. Therm. Eng. 2021, 26, 100955. [Google Scholar] [CrossRef]


| Viscosity | |
| Density | |
| Specific Heat | |
| Thermal Conductivity |
| Viscosity | |
| Density | |
| Specific Heat | |
| Thermal Conductivity |
| Solid Material and Base Fluid | |||
|---|---|---|---|
(Titanium Dioxide) | 686.2 | 8.954 | 4250 |
| Silver: | 235 | 429 | 10,500 |
| Blood | 3594 | 0.492 | 1063 |
| 1 | 1.8642 | 1.8643 | 1.8641 | 1.86401 | 0.7742 | 0.7743 | 0.7741 | 0.7740 |
| 2 | 1.8864 | 1.8865 | 1.8863 | 1.8861 | 0.7953 | 0.7954 | 0.7952 | 0.7952 |
| 3 | 1.90422 | 1.9043 | 1.9041 | 1.9040 | 0.8021 | 0.8022 | 0.8020 | 0.8020 |
| 0.01 | 0.1 | 0.1 | 0.1 | 0.1 | 0.1 | 0.392 | 0.371 | 1.292 | 1.273 |
| 0.02 | 0.416 | 0.404 | 1.268 | 1.243 | |||||
| 0.03 | 0.432 | 0.411 | 1.284 | 1.263 | |||||
| 0.3 | 0.532 | 0.512 | 1.421 | 1.402 | |||||
| 0.5 | 0.746 | 0.724 | 1.631 | 1.614 | |||||
| 0.3 | 0.435 | 0.413 | 1.324 | 1.303 | |||||
| 0.5 | 0.513 | 0.501 | 1.401 | 1.393 | |||||
| 0.3 | 0.494 | 0.472 | 1.383 | 1.361 | |||||
| 0.5 | 0.595 | 0.573 | 1.493 | 1.271 | |||||
| 0.3 | 0.464 | 0.442 | 1.353 | 1.127 | |||||
| 0.5 | 0.512 | 0.501 | 1.402 | 1.383 | |||||
| 0.3 | 0.422 | 0.401 | 1.311 | 1.301 | |||||
| 0.5 | 0.633 | 0.611 | 1.522 | 1.502 |
| 0.1 | 0.1 | 0.1 | 9.416 | 9.331 | 11.393 | 11.292 |
| 0.3 | 9.474 | 9.373 | 11.503 | 11.322 | ||
| 0.5 | 9.537 | 9.413 | 11.631 | 11.532 | ||
| 0.3 | 9.504 | 9.402 | 11.432 | 11.312 | ||
| 0.5 | 9.595 | 9.481 | 11.468 | 11.363 | ||
| 0.3 | 9.444 | 9.417 | 11.446 | 11.309 | ||
| 0.5 | 9.475 | 9.489 | 11.473 | 11.346 |
| 0.0 | 9.232 | …… | 9.232 | …… | 11.142 | …… | 11.142 | …… |
| 0.01 | 9.41571 | 1.995 | 9.33102 | 0.907 | 11.393 | 2.247 | 11.302 | 1.427 |
| 0.02 | 9.52103 | 3.136 | 9.42310 | 2.076 | 11.543 | 3.596 | 11.441 | 2.678 |
| 0.03 | 9.63142 | 4.332 | 9.50211 | 2.931 | 11.684 | 4.864 | 11.573 | 3.868 |
| 0.04 | 9.74532 | 5.566 | 9.61312 | 4.134 | 11.804 | 5.933 | 11.679 | 4.818 |
Publisher’s Note: MDPI stays neutral with regard to jurisdictional claims in published maps and institutional affiliations. |
© 2021 by the authors. Licensee MDPI, Basel, Switzerland. This article is an open access article distributed under the terms and conditions of the Creative Commons Attribution (CC BY) license (https://creativecommons.org/licenses/by/4.0/).
Share and Cite
Saeed, A.; Khan, N.; Gul, T.; Kumam, W.; Alghamdi, W.; Kumam, P. The Flow of Blood-Based Hybrid Nanofluids with Couple Stresses by the Convergent and Divergent Channel for the Applications of Drug Delivery. Molecules 2021, 26, 6330. https://doi.org/10.3390/molecules26216330
Saeed A, Khan N, Gul T, Kumam W, Alghamdi W, Kumam P. The Flow of Blood-Based Hybrid Nanofluids with Couple Stresses by the Convergent and Divergent Channel for the Applications of Drug Delivery. Molecules. 2021; 26(21):6330. https://doi.org/10.3390/molecules26216330
Chicago/Turabian StyleSaeed, Anwar, Niqab Khan, Taza Gul, Wiyada Kumam, Wajdi Alghamdi, and Poom Kumam. 2021. "The Flow of Blood-Based Hybrid Nanofluids with Couple Stresses by the Convergent and Divergent Channel for the Applications of Drug Delivery" Molecules 26, no. 21: 6330. https://doi.org/10.3390/molecules26216330
APA StyleSaeed, A., Khan, N., Gul, T., Kumam, W., Alghamdi, W., & Kumam, P. (2021). The Flow of Blood-Based Hybrid Nanofluids with Couple Stresses by the Convergent and Divergent Channel for the Applications of Drug Delivery. Molecules, 26(21), 6330. https://doi.org/10.3390/molecules26216330