Article

The Antimicrobial Activity of Origanum vulgare L. Correlated with the Gastrointestinal Perturbation in Patients with Metabolic Syndrome

by
Timea Claudia Ghitea
1,†,
Amina El-Kharoubi
2,†,
Mariana Ganea
1,†,
Erika Bimbo-Szuhai
3,
Tiberiu Sebastian Nemeth
1,
Gabriela Ciavoi
4,
Monica Foghis
1,
Luciana Dobjanschi
5,
Annamaria Pallag
1,*,† and
Otilia Micle
5,†
1
Department of Pharmacy, Faculty of Medicine and Pharmacy, University of Oradea, 1st December Square 10, 410068 Oradea, Romania
2
Department of Medical Disciplines, Faculty of Medicine and Pharmacy, University of Oradea, 1st December Square 10, 410068 Oradea, Romania
3
Department of Surgical Disciplines, Faculty of Medicine and Pharmacy, University of Oradea, 1st December Square 10, 410068 Oradea, Romania
4
Department of Dental Medicines, Faculty of Medicine and Pharmacy, University of Oradea, 1st December Square 10, 410068 Oradea, Romania
5
Department of Preclinical Disciplines, Faculty of Medicine and Pharmacy, University of Oradea, 1st December Square 10, 410068 Oradea, Romania
*
Author to whom correspondence should be addressed.
These authors contributed equally to this work.
Molecules 2021, 26(2), 283; https://doi.org/10.3390/molecules26020283
Submission received: 3 December 2020 / Revised: 4 January 2021 / Accepted: 5 January 2021 / Published: 8 January 2021

Abstract

:
(1) The metabolic syndrome (MS) promotes acute and chronic infections, due to the pro-inflammatory condition given by TNFα and IL6 or by affecting the microbiota. MS is also correlated with insulin resistance, causing inflammation and infections throughout the organism. (2) The purpose of this study was to track the effect of using the essential oil of Origanum vulgare L. (EOO) as an antibacterial treatment, compared to allopathic treatment with antibiotics in MS patients. A group of 106 people with MS was divided into four subgroups: L1—staphylococcal infection group, L2—Escherichia coli infection group, L3—streptococcal infection group with EOO treatment, and CG—control group without infection or treatment. (3) EOO is responsible for the antibacterial effect, and reduced minor uncomplicated infections. After a 10-day treatment, intestinal side effects were absent, improving the phase angle. (4) The results suggest that EOO may exhibit an antibacterial effect, similar to the antibiotic treatment, without promoting MS-specific dysbiosis, and it also improves the phase angle in patients, which is used as an index of health and cellular function.

Graphical Abstract

1. Introduction

In metabolic syndrome (MS), chronic inflammation is caused by the primary secretion of fat cells of TNFα, and IL6 [1,2]. This is due to the secondary activity of the intestinal mucosa when it comes into contact with foods that produce delayed reactions of type IgG [3]. This mechanism, as shown in Figure 1, activates an immune response from the T cell to the associated lymphoid tissue. Regulatory helper or T cells are associated with anti-inflammatory cytokines (IL10) [4] in their activation or inhibition, and are correlated with both food intolerance reactions and autoimmune diseases in MS. TH3 contributes to the maintenance of homeostasis at the intestinal level. Th1 is involved in cellular response against pathogens, being secreted by macrophages together with pro-inflammatory cytokines. In case of over activation, hypersensitivity occurs to the delayed allergic reaction. Diabetes mellitus, insulin resistance and MS are part of the diseases involved [5]. TH2 is involved in the immune response to an extracellular stimulus, like antibodies, complement proteins and certain antimicrobial peptides. These TH2 cells lead to the secretion of IL4, which in turn stimulates B cells to produce IgE antibodies that activate macrophages, histamine secretion and inflammation, and are correlated with dermatological allergic reactions [6]. The greater the inflammatory reaction, the more devastating the allopathic treatment of the cytotoxic bacteria not only at the pathogen level, in this case Staphylococcus aureus, Streptococcus pyogenes and Escherichia coli, respectively. At the microbiome level, the effects are even more devastating, leading to the worsening of the underlying disease, i.e., MS [7].
The use of broad-spectrum antibiotics leads to the development of bacterial resistance, especially to diseases where wound healing is delayed, and the risk of over-infection is high [8]. The aim of our study was to use the essential oil of Origanum vulgare L. (EOO) as an alternative treatment with natural antibiotic, effectively free of significant side effects, which brings great benefits to patients with MS, and doctors offer the possibility of finding diverse treatment variants for minor, uncomplicated acute infections in MS.
Essential oils are used in many natural anti-infectious, antimycotic disinfectant treatments, where they are found alongside EOO and thyme oil, or cloves. The antibacterial activity of natural extracts was studied in a 2020 study, following the expression of NFαB, and the cytokine response of IL6 and TNFα, where significant results were obtained [9]. The antibacterial as well as the antioxidant activity of plants has been highlighted in several studies, both in the case of Origanum vulgare L. and other plant species [10]. Our study followed a bacterial infection in the skin, throat and lower digestive tract, treated with EOO in patients with MS, where it was proven effective in reducing the infection, without affecting the intestinal flora.

Phase Angle

The total mass of the cells was directly proportional to the bio-impact phase or phase angle and is measured by the bioelectric impact cell analyzer. This is an indicator of the amount of electrical charge, based on a ratio between the strength and reaction of the body, which cell membranes can maintain, and are used as an index of health and cellular function. Tracking this parameter is useful as an indicator of catabolism in patients with MS and diabetes [11].
In normal and overweight adults, the phase angle is increased with increased BMI, but there was also a reverse association with a BMI > 40 kg/m2. The reference values used are German, where clinical trials were conducted on 15,605 children, adolescents and 21,732 adults, the reference values being established according to BMI, age, sex and health status [12]. In this study, a change in reference values was observed in case of serious diseases, e.g., the cirrhosis of the liver, where the phase angle is inversely proportional to the course of the disease. Several studies are concerned with verifying the prevalence of phase angle use as a predictor of health status, for example in people addicted to alcohol. Alcoholism has a direct link with MS and metabolic diseases due to damage to the mucosa of the small intestine, thus reducing the absorption of nutrients, vitamins and minerals. A pronounced decrease in phase angle was observed in these patients [13].

2. Results

2.1. Antibacterial Activity of EOO

This study followed the antibacterial activity of EOO on standardized cultures of Staphylococcus aureus (ATCC 25923), Escherichia coli (ATCC 25922), Streptococcus pyogenes (ATCC 19615), which can be traced in Figure 2. On microbial cultures were applied in four micro compresses with four different antibiotics and three different amounts of EOO: 0.2, 0.4 and 0.6 μL.
In the case of Staphylococcus aureus (ATCC 25923) cultures, the inhibition zone for azithromycin (15 μg) has a 25 mm diameter, for erythromycin (15 μg), a 32 mm diameter, for levofloxacin (5 μg), a 29 mm diameter and for tetracycline (30 μg), a 30 mm diameter. EOO was used in three different quantities: 0.2, 0.4, and 0.6 μL. A minimum diameter of the inhibition zone of 33 mm was obtained for all quantities used, as shown in Figure 3 and in Table 1.
In the case of Escherichia coli (ATCC 25922) cultures, the inhibition zone for azithromycin (15 μg) has a 23 mm diameter, for ampicillin (10 μg), a 24 mm diameter, for levofloxacin (5 μg), a 33 mm diameter and for tetracycline (30 μg), a 29 mm diameter. For EOO, a diameter of 33 mm was obtained for the inhibition zone for all quantities used.
In the case of Streptococcus pyogenes (ATCC 19615) cultures, the inhibition zone for ampicillin (10 μg) has a 27 mm diameter, for erythromycin (15 μg), a 30 mm diameter, for levofloxacin (5 μg), a 30 mm diameter, and for tetracycline (30 μg), a 31 mm diameter. For EOO, a minimum diameter of 31 mm was obtained for all quantities used, as shown in Figure 3 and Table 1. The results of this study show the pronounced antibacterial activity of EOO.
Three different amounts of EOO, 0.2, 0.4, and 0.6 μL, were used to determine the minimum inhibitory concentration (MIC). The 0.2 μL amount was the one which determined the diameter higher than that of the most sensitive antibiotic. In conclusion, we reported the antibacterial activity of EOO on bacterial cultures. We obtained the inhibition zone greater than 33 mm for 0.2 μL of EOO, exceeding the inhibition zone of the most sensitive antibiotic. Thus, the use of 0.2 μL of EOO was justified, because for this concentration, the inhibition zone on all bacterial cultures was higher than the inhibition zone of the most sensitive antibiotic.

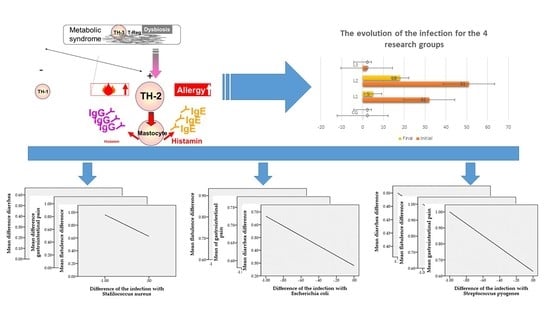
2.2. Study of Bacterial Infection Incidents in Patients with MS

Figure 3 and Table 2 present the results for the relationship between the pre-testing and the post-testing phase in the L1 group. We obtained a Pearson coefficient r = −0.268, p < 0.001, indicating a statistically significant relationship. At the end of the follow-up period, the number of infections was lower than what it was initially. This relationship results from the negative value of the Pearson coefficient, but also from the value of statistical significance less than 0.05. Regarding the relationship between the pre-testing and post-testing phase in the L2 group, we obtained a Pearson coefficient r = −0.208, p < 0.05, indicating a statistically significant relationship. At the end of the follow-up period, the number of infections was lower than what it was initially. This relationship results from the negative value of the Pearson coefficient, but also from the value of statistical significance less than 0.05. Following the relationship between the pre-testing and post-testing phase in the L3 group, we obtained a Pearson coefficient r = −0.207, p < 0.05, indicating a statistically significant relationship. At the end of the follow-up period, the number of infections was lower than what it was initially. This relationship results from the negative value of the Pearson coefficient, but also from the value of statistical significance less than 0.05.

2.3. The Status of the Evolution of Gastrointestinal Parameters in Correlation with EOO Therapy

We studied the gastrointestinal parameters using three variables: diarrhea, gastrointestinal pain, flatulence. We used the Pearson statistical analysis.
In the case of diarrhea, as it is shown in Figure 4a, after the treatment of Staphylococcus aureus infection, we can observe at the end of the therapeutic period with EOO a decreasing trend. The correlation of the two parameters is also reflected by Pearson statistical analysis, where we obtained a coefficient r = −0.277 (p = 0.007). These results indicate a strong relationship between the Staphylococcus aureus infection decreases, at the end of the therapeutic period, along with the incidence of diarrhea. In the case of gastrointestinal pain related to staphylococcic infections, shown in Figure 4b, and treated with EOO, a directly proportional correlation can be observed at the end of the treatment (Pearson coefficient r = −0.292, p = 0.002), i.e., once the staphylococcus infection decreases so does the gastrointestinal pain. This result can be explained with the positive properties of EOO, which do not destroy the intestinal flora, but regulate it. From the correlation between the difference of Staphylococcus aureus infection and the difference in flatulence, as outlined in Figure 4c, we obtained a Pearson coefficient r = −0.302 (p < 0.001), with statistical significance, which shows a strong link, as the two parameters are directly proportionally correlated.
Following the incidence of diarrhea after the treatment of Escherichia coli infection, it is shown in Figure 5a, that at the end of the therapeutic period with EOO both Escherichia coli infection and diarrhea tend towards “0”. The correlation of the two parameters is reflected by the Pearson statistical analysis. We obtained a coefficient r = −0.366 (p = 0.001), which indicates a strong relationship between the E. coli infection decrease at the end of the therapeutic period and the incidence of diarrhea. EOO, as a natural treatment in E. coli infections, has been shown to be effective, with no negative effects on the microbiome, assessing gastrointestinal pain, according to the graph shown in Figure 5b and flatulence, in Figure 5c. Following the statistical analysis, we obtained a Pearson coefficient r = −0.174, p = 0.06, for gastrointestinal pain and r = −0.224 (p = 0.01) for flatulence, the last reflecting a strong positive statistical significance.
The incidence of diarrhea after the treatment of Streptococcus pyogenes infection is shown in Figure 6a, where at the end of the therapeutic period with EOO, both Streptococcus pyogenes infection and diarrhea were tending towards “0”. The correlation between the two parameters is also reflected by Pearson statistical analysis, where we obtained a coefficient r = 0.135 (p > 0.05), which indicates a positive relationship, but without statistical significance, although all infections have ameliorated with EOO treatment. This result can be explained with insufficient incidence tested (two initial cases). Figure 6b presents the relation between the gastrointestinal pain in the case of Streptococcus pyogenes infection, and EOO treatment obtaining a Pearson coefficient of r = −0.224, p = 0.01 that shows a strongly positive, statistically significant relationship. In the case of flatulence related to the difference in infection with Streptococcus pyogenes, as shown in Figure 6c, a directly proportional relationship can be observed, but one that does not reach the significant threshold, the Pearson coefficient being r = 0.21, p > 0.05.

2.4. Changes in the Phase Angle

After the initial and final evaluation of the patients, a statistically significant improvement of the phase angle can be observed. The coefficient of the Student t test for comparing two independent samples (initial and final evaluation) is t = −8.108, p < 0.001. Significance thresholds indicate an increase in the phase angle for all patients, as seen in Figure 7. For the individual groups analyzed, the following can be observed:
-
No changes were recorded for the control group (t = 1000, p = 0.330);
-
For L1 an improvement t = −10.020, p < 0.01 is recorded;
-
For group L2 a significant improvement reflected from the value t = −8.099, p < 0.01 can be observed;
-
For group L3 t = −6.205, p < 0.01, indicating a statistically significant change.

3. Discussion

Microbiota plays an important role not only in the management of MS and chronic inflammation but has a direct connection with the immune and neuroendocrine system, as well as with the autonomic and central nervous system [7]. The risks associated with MS of cardiovascular disease, type 2 diabetes, as well as the development of bacterial resistance in infections increase the risk of mortality [14]. Numerous studies follow the evolution of patients with MS, due to the increasing trend of cases, in terms of associated diseases [15], abdominal obesity [16], or the correlation of nutritional status with hepatic steatosis [17]. Some plants promote obesity, resulting from the study published in 2019, but do not influence the development of insulin resistance, when administered for 6 weeks, in rats [18]. There are many studies that highlight the rebalancing effect of the EOO at the intestinal level [18]. Our study had an impact on the treatment of minor infections with EOO instead of allopathic treatment, so it did not worsen flatulence, gastrointestinal pain, or diarrhea, which are signs of destruction of the intestinal microflora. An important role in the defense of the organism against infection has lymphoid tissue associated in the intestinal immunity, which is called innate immunity [19]. Regarding the oxidative stress in metabolic syndrome and diabetes, we can also intervene with the help of plants [20]. In 2016, Andersen et al. highlighted the effect of obesity on the immune response to pathogens, as well as a disruption of the function of associated lymphoid tissue due to fat tissue [21]. Reduced neutrophil activity due to MS and obesity increases susceptibility to Staphylococcus aureus infections [22,23,24]. We obtained a comparable result in treatment with EOO instead of antibiotics, in minor infections with Staphylococcus sp. It allowed the normal function of the immune system in the intestinal tract. MS being correlated with hyper coagulation has a decisive role in the management of infections with Streptococcus pyogenes, through the formation of fibrin [25]. Infections with Streptococcus pyogenes are in smaller numbers, which is reflected in the number of patients included in the study with this infection. However, the results are encouraging, and allow us to propose longer studies, regarding a greater group of patients. E. coli infections have been a major problem, especially in the last decade. The persons concerned are those who have a lower immunity [26], including those with MS, due to impaired lymphoid tissue. Treating infections in the early stages with natural antibiotics, and in the case of L2, with E. coli infections, these have proven effective, also having lower cytotoxicity than allopathic treatment.
EOO is used for its multiple beneficial effects on human health [21], but also as a prophylactic treatment with high potential [27] in the agro-food industry, replacing the antibiotics used in birds with EOO. Studies in 2019, following infections with Staphylococcus aureus, the resistant form, observed an inhibitory activity of EOO. In patients with MS, the effective minimum dose reduces side effects, and interactions with drugs. Carvacrol, being one of the main components of EOO, activates the potential transient receptor (TRP) channels TRPA1 and TRPV3 [28], and produces endothelial vasodilation. This cardioprotective effect increases the value of use in people with MS. EOO in Streptococcus pyogenes infections has been shown to be effective in treating pharyngitis [29]. Effective minimum concentrations for the destruction of the bacterial wall are followed in several follicles of pathogens, as an activity of the essential oils [30]. The treatment applied to patients with minor infections, was tracked and evaluated, not only from a symptomatological point of view, but also from its correlation with the side effects of antibiotics in people with MS [31]. Alternative treatments from the class of cefmetazole cephalosporins have been studied, phosphomycin being compared to ciprofloxacin [32], but the side effects of antibiotics increase along with the spectrum of activity and bacterial resistance. Urinary and vaginal infections caused by Escherichia coli were successfully treated with EOO [33]. In patients with MS in the current study, EOO inhibited the development of Escherichia coli, improving gastrointestinal health, which cannot be obtained with allopathic treatment [34]. In the case of the correlation of gastrointestinal problems with the treatment for E. coli infections, a strong, statistically significant correlation was found, which can also be explained by the large number of participants in the L2 group. The improved but statistically insignificant results in L3 can be explained with the small number of participants in the study, but the positive results encourage us to expand the study in the future.
The phase angle, being a component of health tracking during convalescence, is an important predictor [35], but also an indicator of catabolism in type 2 diabetes [9]. MS is correlated with insulin resistance [36] in obese people. In our study, we can follow the positive evolution of the phase angle in all three research groups. This determination of the phase angle has a special importance, in the pursuit of cellular functions. Firstly, because it can be determined non-invasively, and secondly, we can observe cellular decline before reaching a critical threshold.

4. Materials and Methods

4.1. Ethics

This study was carried out in agreement with the research ethics commission within the Faculty of Medicine and Pharmacy, University of Oradea, no. 12/01.04.2019. Before enrolling a patient in the study, the researcher explained the study design to each candidate patient using a brochure and an informed consent form. Written informed consent was given by each patient prior to study participation.

4.2. The EOO Obtaining

The medicinal plant species Origanum vulgare L. (family Lamiaceae) were used in our study. The plant samples came from unpolluted areas of cultivated flora in Oradea (Oradea, Bihor County, Romania) and were carefully collected and selected in 2018. A specimen of the species is kept in the Oradea Pharmacy Herbarium, code: UOP 05045, (Department of Pharmacy, University of Oradea, Faculty of Medicine and Pharmacy.
The volatile oil was obtained by the hydro-distillation method. The process consists of the following operations: the dried plant material (25 g) is brought together with the water in the distillation flask, the bottom of the vessel is heated directly at the heat source, and the mixture of oil and water vapor is collected by condensation in a system for cooling. The distillate is then passed into a collecting vessel. Phase separation was observed, from where the essential oil (4–5 mL) was collected by settling, as shown in Figure 8 [37].
EOO, obtained from the Origanum vulgare L., by hydro-distillation, was diluted with Oleum Helianti 1:1, to reduce the cytotoxicity to the lowest effective level [38].
The verification of the percentage composition of the EOO was performed with a gas chromatograph coupled with mass spectrometry. The ability and high resolution to provide precise and accurate qualitative and quantitative data established gas-chromatography (GC) coupled with mass spectrometry (MS), i.e., GC–MS analyses as a valuable means for the taxonomic research of plants. The relative amounts of individual components of the volatiles of the two samples were expressed as percentages of the peak area relative to the total peak area. Relative percentage amounts were calculated from the TIC by the computer.
The neutral molecules elute from the analytical column and are ionized in the ion source to produce molecular ions which can degrade into fragment ions. The fragment and molecular ions are then separated in the mass analyzer by their mass: charge (m/z) ratio and are detected. This method is used to identify unknown analytes and to determine the structural and chemical properties of molecules, as well as the chromatogram that can be used for qualitative and quantitative analysis.
The GC–MS analysis of various organic crude extracts isolated from leaves of Origanum vulgare L. was performed using a Thermo GC–MS (Model Trace 1310 ISQ 7000) equipped with an HP−5MS capillary column (30 m length × 0.32 mm internal diameter × 0.25 µm film thickness). GC–MS spectroscopic detection, an electron ionization system with an ionization energy of 70 eV was used. Helium was used as a carrier gas at 30 cm s−1, and the injection volume was 1 µL. The mass transfer line and injector temperature were set at 220 °C and 290 °C, respectively. The oven temperature was programmed at 45 °C for 1 min, raised to 250 °C at 5 °C min−1, and maintained at 250 °C for 5 min. Diluted samples (1/100, v/v, in dichloromethane) of 1 µL was injected in the split mode with a split ratio of 120:1. The relative percentage of the chemical constituents in the dried extracts of Origanum vulgare L. was expressed as the percentage by peak area normalization.
Qualitative and semi-quantitative analysis was applied to the oil obtained and was calculated the retention indices Kovats. Retention indices also find applications in the characterization of the selectivity of stationary phases, in structural analysis, and in studies of physico-chemical properties of stationary phases and analytes. Relationships between Kovats indices and thermodynamic properties are used for the determination of vapor pressures, entropies of adsorption, enthalpies and the vaporization of different analytes. Following the analysis, the result was obtained, which is detailed in Table 3. According to the results presented in Table 3, the presence of carvacrol of 29.22% is observed as the main substance.
Kovats retention indices (RI) formula IS:
RI = 100 ( n )   +   100 ( m n ) t r i t r n t r m t r n
where:
  • RI = retention indices of “i”;
  • i = constituent of essential oil that is being analyzed;
  • n = carbon number of the alkane which elutes before “i”;
  • m = number of carbons of the alkane which elutes after “i”;
  • tri = retention time of “i”;
  • trn = retention time of the alkane which elutes before “i”;
  • trm = retention time of the alkane which elutes after “i”.

4.3. Antimicrobial Activity

The antimicrobial activity of the essential oil of Origanum vulgare L. was evaluated by the disc diffusion method using the standard methodology [39] and by determining the minimum inhibitory concentrations (MICs). In our study, we used the following bacterial cultures, reference microbial strains: Staphylococcus aureus (ATCC 25923), Streptococcus pyogenes (ATCC 19615), and Escherichia coli (ATCC 25922), (Microbiologicals, St. Cloud, MI, USA).
Kirby–Bauer Disk Diffusion test: for Staphylococcus aureus and Escherichia coli, Mueller–Hinton Agar (Oxoid) was used, and for Streptococcus pyogenes, the medium Mueller–Hinton 2 agar + 5% sheep blood (BioMerieux, Marcy l‘Etoile, France) was used.
  • The culture medium is a solid Mueller–Hinton agar medium in a uniform layer of 4 mm (stored at 4 °C, for a maximum of 7 days) sown with a bacterial culture;
  • The discs with AB are placed on the surface of the medium;
  • AB will diffuse into the environment, showing a constant decrease in the concentration gradient from the edge of the disc to the periphery;
  • After incubation, two distinct areas are delimited: an area where bacterial growth is inhibited by AB concentration and a growth area where AB concentration is too low to inhibit growth;
  • The larger the diameter of the inhibition zone, the more sensitive the bacteria (MIC is smaller).
Each strain was placed on the appropriate culture medium with a sterile cotton swab and the flat swab, and the plates were dried for 10–15 min.
The extracted oil was diluted 1:1 with Oleum Helianti (sunflower oil) (HiMedia Laboratories, Einhausen Germany) and with a micropipette, 0.2, 0.4, and 0.6 μL, of EOO mixture were added, placed on inoculated plates.
After overnight incubation at 37 °C, the diameters of the inhibition zone were measured in millimeters. The microtablets with standard antibiotics were used for each strain as positive controls: for Staphylococcus aureus, azithromycin (15 μg), erythromycin (15 μg), levofloxacin (5 μg) and tetracycline (30 μg) were used; for Escherichia coli, azithromycin (15 μg), ampicillin (10 μg) levofloxacin (5 μg) and tetracycline (30 μg) were used; and for Streptococcus pyogenes, ampicillin (10 μg), erythromycin (15 μg), levofloxacin (5 μg) and tetracycline (30 μg) were used. Each test was performed in triplicate and the mean values were selected.
Minimum inhibitory concentration (MIC) is defined as the lowest concentration of a drug that will inhibit the natural growth of an organism after overnight incubation. Three different amounts of EOO—0.2, 0.4, 0.6 μL—were used to determine the minimum inhibitory concentration.
We evaluated the largest diameter of the most sensitive antibiotic in order to stabilize the lowest efficiency of EOO with MIC [40].

4.4. Clinical Trials

The study was performed on 106 patients, aged over 18 years, the average age being 37.42 years (±14.12), divided into 4 groups:
-
CG = patients in control group without infection (n = 20);
-
L1 = patients with Staphylococcus infection (n = 32);
-
L2 = patients with Escherichia coli infection (n = 51);
-
L3 = patients with Streptococcus infection (n = 2).
All patients were diagnosed with MS without CG infections, and without minor, uncomplicated infections with Staphylococcus aureus (L1), Escherichia coli (L2), Streptococcus pyogenes (L3), which were the inclusion criterion.
The exclusion criteria were people who presented infections by other strains than the studied three, and/or who presented other major or complicated infections.
All patients included in the study agreed with the natural treatment without allopathic treatment. They received 0.8 mL (2 drops) EOO twice a day, for ten days, as treatment.

4.5. Enrolled Patients and Anthropometry

We conducted a cross-sectional study on MS patients that were enrolled in a cohort study, to obtain the clinical characteristics of MS patients and adapted the diet therapy for each patient. The clinical evaluation was performed with the Tanita MC780MA bioelectric impedance body analyzer (Tokyo, Japan) [41], and the results were evaluated using GMON 3.4.1 medical software (Chemnitz, Germany). BIA type body analyzers are devices accepted by the WPHNA (World Public Health Nutrition Association) and were used to determine body composition with high accuracy. The margin of error was 0.1 kg. We followed the evaluation of the affinity for diet therapy with the non-invasive medical device Cnoga MTX(Or-Akiva, Israel), which helped to follow the changes of the clinical parameters as a whole, checking the oxygen saturation, the blood pressure, and the blood pH.
We followed the variations in the four independent groups, depending on sex, age, rural/urban environment, clinical parameters such as BAM, weight status, fat mass, visceral fat, hydration status (ECW/TBW), sarcophagi index, phase angle, basal metabolism (BMR), and pH, followed by MS.
The completion of the evaluation sheets of the patients included in the research study took place at the beginning and at the end of the study period by the participants.

4.6. Tracking Metabolic Parameters, Phase Angle

The total mass of the cells was directly proportional to the bioimpedance phase or phase angle and is measured by the bioelectric impedance body analyzer. Patients were evaluated at the beginning and the end of the treatment with this device. With bare feet, they climbed on the base of the scale and held two electrodes in their hands. The measurements lasted up to 10 s after which the results were evaluated. According to the results, we could see their improvement or deterioration, and when analyzed in the statistical program SPSS 22 (New York, NY, USA), we could follow both the final result compared to the initial values and the possible correlations between health (measured by phase angle) and the healing of infections in patients with MS.

4.7. Tracking the Status of the Evolution of Gastrointestinal Parameters

To assess gastrointestinal status for diarrhea, flatulence, and gastrointestinal pain, patients completed an evaluation form at the beginning and at the end of the study period. On the sheet with “0”, the symptoms absence was noted and with “1” their presence was noted.

4.7.1. Tracking Diarrhea Status

Diarrhea was followed during treatment as a sign of dysbiosis, which is correlated with the use of antibiotics; it was noted in patients if they had 3 consecutive stools of soft consistency. This was followed throughout the treatment with EOO.

4.7.2. Tracking the Flatulence

Flatulence, present as an associated problem of MS, was monitored if it was different from that before the start of treatment, or if it occurred during this period. We also followed the flatulence of MS by completing the evaluation form at the beginning and at the end of the therapy, marking with “0” the absence of symptoms and with “1” their presence.

4.7.3. Tracking Gastrointestinal Pain

Gastrointestinal pain was evaluated with adapted scales (visual analogue scale (VAS), numerical rating scale (NRS), and verbal rating scale (VRS) [42]) during treatment, as a sign of dysbiosis, which is correlated with the use of antibiotics. During treatment with EOO, the study sheet was completed at the beginning and at the end of therapy with “0” marking symptomatic absence and “1” marking the presence of pain.

4.8. Statistical Analysis

The exit rate of the people in the study was 0.00%, so we obtained, with the Chi-Square test, the lots with statistical significance Asymp. Sig. < 0.05. SPSS Statistics 22 was used to perform the statistical analysis [43]. All parameters’ mean values, frequency intervals and standard deviations, as well as tests of statistical significance, were calculated using the Student t test. The lots were distributed similarly to the normal one, using assumptions involving numerical data.
The Bravais–Pearson correlation coefficient was used to calculate an independent indicator of the units of measurement of the two variables. The value of p < 0.05 was assigned to ANOVA statistical significance, as well as p < 0.01 indicating high level statistical significance. Bonferroni post hoc analysis was used to analyze the differences between groups, as an additional analysis of subgroups.

5. Conclusions

EOO is active on bacteria such as Staphylococcus aureus, Escherichia coli and Streptococcus aureus, the minimum concentration of inhibition having no cytotoxic effects, so it can be recommended for minor infections in patients with MS.
With the EOO natural treatment, the results of patients with MS and minor infections with Staphylococcus aureus, Streptococcus pyogenes and Escherichia coli improved, without significant damage to the intestinal microbiome. Assessing diarrhea, gastrointestinal pain and flatulence, we found that almost every parameter improved in a statistically significant way. With the EOO treatment, in the case of minor infections in patients with MS, the phase has also improved, indicating an increase in health and an improvement in cellular functions. However, further studies, longer study periods and a larger number of patients are needed in order to determine the exact mechanisms underlying the effects of EOO.

Author Contributions

T.C.G. and A.E.-K. conceptualized and planned the study; A.P., O.M., T.S.N. and L.D. developed the methodology of the study; T.S.N., A.P. and M.G. devised the methodology for the preparation of EOO; T.C.G., L.D. and O.M. designed and performed the biochemical analysis; A.E.-K., M.G. and O.M. designed and performed the antimicrobial activity analysis; T.C.G., A.E.-K., M.G. and A.P. designed and carried out the metabolic parameters investigations, the implementation of this research, the study status of the evolution of gastrointestinal parameters and processed the results; T.C.G., T.S.N. and G.C. performed the statistical calculations; T.S.N., M.F., E.B.-S. and G.C. contributed to the design of the figures; T.C.G., A.E.-K., A.P., M.G. and E.B.-S. contributed to the writing of the first draft of the manuscript; A.E.-K., G.C. and O.M. contributed to writing the Introduction section; T.C.G., T.S.N., M.F. and L.D. contributed to writing the Materials and Methods section. All of the authors contributed to the interpretation and discussion of the results and to drawing the final conclusions; T.C.G., A.E.-K., G.C., A.P. and M.G. revised and edited the final version of the manuscript. All authors have read and agreed to the published version of the manuscript.

Funding

This research received no external funding.

Conflicts of Interest

The authors declare that the research was conducted in the absence of any commercial or financial relationship that could be construed as a potential conflict of interests.

Sample Availability

Samples are not available from the authors.

References

  1. Sommer, P.; Sweeney, G. Functional and Mechanistic Integration of Infection and the Metabolic Syndrome. Korean Diabetes J. 2010, 34, 71–76. [Google Scholar] [CrossRef] [PubMed]
  2. Weisberg, S.P.; McCann, D.; Desai, M.; Rosenbaum, M.; Leibel, R.L.; Ferrante, A.W., Jr. Obesity is associated with macrophage accumulation in adipose tissue. J. Clin. Investig. 2003, 112, 1796–1808. [Google Scholar] [CrossRef] [PubMed]
  3. Caffarelli, C.; Di Mauro, D.; Mastrorilli, C.; Bottau, P.; Cipriani, F.; Ricci, G. Solid Food Introduction and the Development of Food Allergies. Nutrients 2018, 10, 1790. [Google Scholar] [CrossRef] [PubMed] [Green Version]
  4. Choi, K.M.; Ryu, O.; Lee, K.; Kim, H.; Seo, J.; Kim, S.G.; Kim, N.; Choi, D.; Baik, S. Serum adiponectin, interleukin-10 levels and inflammatory markers in the metabolic syndrome. Diabetes Res. Clin. Pr. 2007, 75, 235–240. [Google Scholar] [CrossRef] [PubMed]
  5. Surendar, J.; Mohan, V.; Rao, M.M.; Babu, S.; Aravindhan, V. Increased Levels of Both Th1 and Th2 Cytokines in Subjects with Metabolic Syndrome (CURES-103). Diabetes Technol. Ther. 2011, 13, 477–482. [Google Scholar] [CrossRef]
  6. Brandt, E.B. Th2 Cytokines and Atopic Dermatitis. J. Clin. Cell. Immunol. 2011, 2, 110. [Google Scholar] [CrossRef]
  7. Halmos, T.; Suba, I. A bélbakterióta élettani jellemzői és a dysbacteriosis szerepe az elhízásban, inzulinrezisztenciában, diabetesben és metabolikus szindrómában. Orvosi Hetil. 2016, 157, 13–22. [Google Scholar] [CrossRef] [Green Version]
  8. Simirgiotis, M.; Burton, D.; Parra, F.; López, J.; Muñoz, P.; Araya, H.E.; Parra, C. Antioxidant and Antibacterial Capacities of Origanum vulgare L. Essential Oil from the Arid Andean Region of Chile and its Chemical Characterization by GC-MS. Metabolites 2020, 10, 414. [Google Scholar] [CrossRef]
  9. Jurca, T.; Baldea, I.; Filip, G.A.; Olteanu, D.; Clichici, S.; Pallag, A.; Vicaș, L.; Marian, E.; Micle, O.; Crivii, C.B.; et al. A Phytocomplex Consisting of Tropaeolum majus L. and Salvia officinalis L. Extracts Alleviates the Inflammatory Response of Dermal Fibroblasts to Bacterial Lipopolysaccharides. Oxidative Med. Cell. Longev. 2020, 2020, 8516153. [Google Scholar] [CrossRef]
  10. Jurca, T.; Pallag, A.; Marian, E.; Mureșan, M.E.; Stan, R.L.; Vicaș, L.G. The histo-anatomical investigation and the polyphenolic profile of antioxidant complex active ingredients from three Viola species. Farm. J. 2019, 67, 634–640. [Google Scholar] [CrossRef]
  11. Dittmar, M.; Reber, H.; Kahaly, G.J. Bioimpedance phase angle indicates catabolism in Type 2 diabetes. Diabet. Med. 2015, 32, 1177–1185. [Google Scholar] [CrossRef]
  12. Bosy-Westphal, A.; Danielzik, S.; Dörhöfer, R.-P.; Later, W.; Wiese, S.; Müller, M.J. Phase Angle from Bioelectrical Impedance Analysis: Population Reference Values by Age, Sex, and Body Mass Index. J. Parenter. Enter. Nutr. 2006, 30, 309–316. [Google Scholar] [CrossRef]
  13. Coelho, M.P.P.; Diniz, K.G.D.; Bering, T.; Ferreira, L.D.S.A.; Vieira, D.A.; Castro, M.R.C.; Correia, M.I.T.; Rocha, G.A.; Teixeira, R.; Garcia, F.D.; et al. Skeletal muscle mass index and phase angle are decreased in individuals with dependence on alcohol and other substances. Nutrition 2020, 71, 110614. [Google Scholar] [CrossRef] [PubMed]
  14. Liou, J.-M.; Chen, C.-C.; Chang, C.-M.; Fang, Y.-J.; Bair, M.-J.; Chen, P.-Y.; Chang, C.-Y.; Hsu, Y.-C.; Chen, M.-J.; Chen, C.-C.; et al. Long-term changes of gut microbiota, antibiotic resistance, and metabolic parameters after Helicobacter pylori eradication: A multicentre, open-label, randomised trial. Lancet Infect. Dis. 2019, 19, 1109–1120. [Google Scholar] [CrossRef]
  15. Mendrick, D.L.; Diehl, A.M.; Topor, L.S.; Dietert, R.R.; Will, Y.; La Merrill, M.A.; Bouret, S.; Varma, V.; Hastings, K.L.; Schug, T.T.; et al. Metabolic Syndrome and Associated Diseases: From the Bench to the Clinic. Toxicol. Sci. 2018, 162, 36–42. [Google Scholar] [CrossRef] [PubMed] [Green Version]
  16. Després, J.-P.; Lemieux, I. Abdominal obesity and metabolic syndrome. Nat. Cell Biol. 2006, 444, 881–887. [Google Scholar] [CrossRef]
  17. Hoza, A.; Moldovan, C.; Fărcaș, D.M.; Pallag, A.; Nemeth, S.; Felicia, M. Comparative study of oral antidiabetic therapy and insulin therapy on hepatic steatosis in patients with type 2 diabetes mellitus. Farm. J. 2018, 4, 652–657. [Google Scholar] [CrossRef]
  18. Badale, A.; Pallag, A.; Kozma, M.; Hegedus, C.; Kovacs, D.; Gulyas, H.; Zdrinca, M.; Magyar, I.; Marc, F.; Nemeth, S.; et al. Fenugreek seed and its active agent diosgenin treatment effects on different metabolic parameters in rats. Farm. J. 2019, 67, 92–98. [Google Scholar] [CrossRef]
  19. Thaiss, C.A.; Zmora, N.; Levy, M.; Elinav, E. The microbiome and innate immunity. Nat. Cell Biol. 2016, 535, 65–74. [Google Scholar] [CrossRef]
  20. Hegedűs, C.; Mureșan, M.; Badale, A.; Juhász, B.; Varga, B.; Szilágyi, A.; Sinka, D.; Bácskay, I.; Popoviciu, M.; Magyar, I.; et al. SIRT1 Activation by Equisetum arvense L. (Horsetail) Modulates Insulin Sensitivity in Streptozotocin Induced Diabetic Rats. Molecules 2020, 25, 2541. [Google Scholar] [CrossRef]
  21. Andersen, C.J.; Murphy, K.E.; Fernandez, M.L. Impact of Obesity and Metabolic Syndrome on Immunity. Adv. Nutr. 2016, 7, 66–75. [Google Scholar] [CrossRef] [Green Version]
  22. Scully, I.L.; McNeil, L.K.; Pathirana, S.; Singer, C.L.; Liu, Y.; Mullen, S.; Girgenti, D.; Gurtman, A.; Pride, M.W.; Jansen, K.U.; et al. Neutrophil killing of Staphylococcus aureus in diabetes, obesity and metabolic syndrome: A prospective cellular surveillance study. Diabetol. Metab. Syndr. 2017, 9, 76. [Google Scholar] [CrossRef] [PubMed] [Green Version]
  23. Ghitea, T.C.; Bungau, S.; Tit, D.M.; Purza, L.; Otrisal, P.; Aleya, L.; Cioca, G.; Pantis, C.; Lazar, L. The Effects of Oregano Oil on Fungal Infections Associated with Metabolic Syndrome. Rev. Chim. 2020, 71, 335–341. [Google Scholar] [CrossRef]
  24. Proestos, C.; Lytoudi, K.; Mavromelanidou, O.K.; Zoumpoulakis, P.; Sinanoglou, V.J. Antioxidant Capacity of Selected Plant Extracts and Their Essential Oils. Antioxidants 2013, 2, 11–22. [Google Scholar] [CrossRef] [PubMed]
  25. Loof, T.G.; Edeicke, C.; Medina, E. The role of coagulation/fibrinolysis during Streptococcus pyogenes infection. Front. Cell. Infect. Microbiol. 2014, 4, 128. [Google Scholar] [CrossRef] [Green Version]
  26. Biran, D.; Ron, E. Extraintestinal Pathogenic Escherichia coli. Curr. Top. Microbiol. Immunol. 2018, 416, 149–161. [Google Scholar] [CrossRef]
  27. Bauer, B.W.; Radovanovic, A.; Willson, N.-L.; Bajagai, Y.S.; Van, T.T.H.; Moore, R.J.; Stanley, D. Oregano: A potential prophylactic treatment for the intestinal microbiota. Heliyon 2019, 5, e02625. [Google Scholar] [CrossRef] [Green Version]
  28. Earley, S.; Gonzales, A.L.; Garcia, Z.I. A Dietary Agonist of Transient Receptor Potential Cation Channel V3 Elicits Endothelium-Dependent Vasodilation. Mol. Pharmacol. 2010, 77, 612–620. [Google Scholar] [CrossRef] [Green Version]
  29. Wijesundara, N.M.; Rupasinghe, H.P.V. Essential oils from Origanum vulgare and Salvia officinalis exhibit antibacterial and anti-biofilm activities against Streptococcus pyogenes. Microb. Pathog. 2018, 117, 118–127. [Google Scholar] [CrossRef]
  30. Man, A.; Santacroce, L.; Iacob, R.; Mare, A.; Man, L. Antimicrobial Activity of Six Essential Oils Against a Group of Human Pathogens: A Comparative Study. Pathogens 2019, 8, 15. [Google Scholar] [CrossRef] [Green Version]
  31. Paitan, Y. Current Trends in Antimicrobial Resistance of Escherichia coli. Curr. Top. Microbiol. Immunol. 2018, 416, 181–211. [Google Scholar] [CrossRef]
  32. Doesschate, T.T.; Van Mens, S.P.; Van Nieuwkoop, C.; Geerlings, S.; Hoepelman, A.I.M.; Bonten, M.J.M. Oral fosfomycin versus ciprofloxacin in women with E.coli febrile urinary tract infection, a double-blind placebo-controlled randomized controlled non-inferiority trial (FORECAST). BMC Infect. Dis. 2018, 18, 626. [Google Scholar] [CrossRef] [PubMed]
  33. Lagha, R.; Ben Abdallah, F.; Al-Sarhan, B.O.; Al-Sodany, Y.M. Antibacterial and Biofilm Inhibitory Activity of Medicinal Plant Essential Oils Against Escherichia coli Isolated from UTI Patients. Molecules 2019, 24, 1161. [Google Scholar] [CrossRef] [Green Version]
  34. Veenstra, J.P.; Johnson, J.J. Oregano (Origanium Vulgare) Extract for Food Preservation and Improving Gastrointestinal Health. Int. J. Nutr. 2019, 3, 43–52. [Google Scholar] [CrossRef] [PubMed] [Green Version]
  35. Selberg, O.; Selberg, D. Norms and correlates of bioimpedance phase angle in healthy human subjects, hospitalized patients, and patients with liver cirrhosis. Graefe’s Arch. Clin. Exp. Ophthalmol. 2002, 86, 509–516. [Google Scholar] [CrossRef] [PubMed] [Green Version]
  36. Goossens, G.H. The role of adipose tissue dysfunction in the pathogenesis of obesity-related insulin resistance. Physiol. Behav. 2008, 94, 206–218. [Google Scholar] [CrossRef] [PubMed]
  37. Nascimento, R.V.; Alves, M.D.S.; Pinto, T.D.O.; Menezes, R.D.S.; Junior, P.C.D.; Chaves, D.S.; De Sousa, M.A.A. Hydrodistillation Extraction Kinetics of Volatile Oils from Varronia curassavica and Laurus nobilis. Rev. Bras. Farm. 2020, 30, 503–509. [Google Scholar] [CrossRef]
  38. Olmedo, R.; Ribotta, P.; Grosso, N.R. Decrease of chemical and volatile oxidation indicators using oregano essential oil combined with BHT in sunflower oil under accelerated storage conditions. J. Food Sci. Technol. 2019, 56, 2522–2535. [Google Scholar] [CrossRef]
  39. Patel, J.B.; Weinstein, M.P.; Eliopoulos, G.M.; Jenkins, S.G.; Lewis, J.S.; Limbago, B.; Mathers, A.J.; Mazzulli, T.; Patel, R.; Richter, S.S.; et al. Performance Standards for Antimicrobial Susceptibility Testing; Clinical and Laboratory Standards Institute: Wayne, PA, USA, 2017; Volume 37. [Google Scholar]
  40. Lambert, R.; Skandamis, P.; Coote, P.; Nychas, G.-J. A study of the minimum inhibitory concentration and mode of action of oregano essential oil, thymol and carvacrol. J. Appl. Microbiol. 2001, 91, 453–462. [Google Scholar] [CrossRef] [Green Version]
  41. Jabłonowska-Lietz, B.; Wrzosek, M.; Włodarczyk, M.; Nowicka, G. New indexes of body fat distribution, visceral adiposity index, body adiposity index, waist-to-height ratio, and metabolic disturbances in the obese. Kardiol. Pol. 2017, 75, 1185–1191. [Google Scholar] [CrossRef] [Green Version]
  42. Ferreira-Valente, A.; Pais-Ribeiro, J.L.; Jensen, M.P. Validity of four pain intensity rating scales. Pain 2011, 152, 2399–2404. [Google Scholar] [CrossRef] [PubMed]
  43. Hickey, G.L.; Grant, S.W.; Dunning, J.; Siepe, M. Statistical primer: Sample size and power calculations—Why, when and how? Eur. J. Cardiothorac. Surg. 2018, 54, 4–9. [Google Scholar] [CrossRef] [PubMed]
Figure 1. T cell immune response mechanism.
Molecules 26 00283 g001
Figure 2. Antibiograms on the cultures of S. aureus (a = azithromycin 15 μg, b = erythromycin 15 μg, c = levofloxacin 5 μg, d = tetracycline 30 μg, e = Origanum vulgare L. (EOO) 0.2 μL, f = EOO 0.4 μL, g = EOO 0.6 μL), E. coli (a = tetracycline 30 μg, b = ampicillin 10 μg, c = levofloxacin 5 μg, d = azithromycin 15 μg, e = EOO 0.2 μL, f = EOO 0.4 μL, g = EOO 0.6 μL) and S. pyogenes (a = ampicillin 10 μg, b = erythromycin 15 μg, c = levofloxacin 5 μg, d = tetracycline 30 μg, e = EOO 0.2 μL, f = EOO 0.4 μL, g = EOO 0.6 μL).
Molecules 26 00283 g002
Figure 3. Evolution of the number of infections in the 4 research groups (CG = 20 patients with 0 initial infection, L1 = 32 patients with 32 initial infections, L2 = 51 patients with 51 initial infections, L3 = 2 patients with 2 initial infection).
Molecules 26 00283 g003
Figure 4. Correlation between gastrointestinal incident and Staphylococcus aureus infection at the end of the treatment period where “1” are noted as the presence and “0” are noted as absence of conditions. (a) = mean difference diarrhea, (b) = mean difference gastrointestinal pain, (c) = mean difference flatulence.
Molecules 26 00283 g004
Figure 5. Correlation between the incidence of gastrointestinal symptoms and Escherichia coli infection at the end of the treatment period where “1” are noted as the presence and “0” are noted as absence of conditions.; (a) = mean difference diarrhea, (b) = mean difference gastrointestinal pain, (c) = mean difference flatulence.
Molecules 26 00283 g005aMolecules 26 00283 g005b
Figure 6. Correlation on gastrointestinal incidence and infection with Streptococcus pyogenes at the end of the treatment period where “1” are noted as the presence and “0” are noted as absence of conditions.; (a) = mean difference diarrhea, (b) = mean difference gastrointestinal pain, (c) = mean difference flatulence.
Molecules 26 00283 g006aMolecules 26 00283 g006b
Figure 7. Evolution of the phase angle from the beginning to the end of the treatment period at L1, L2 and L3 measured in degrees (50 kHz).
Molecules 26 00283 g007
Figure 8. EOO obtained with hydro-distillation extraction.
Molecules 26 00283 g008
Table 1. Diameter obtained from the EOO antibiotic in the 3 research groups (in millimeters).
Staphylococcus aureusEscherichia coliStreptococcus pyogenes
AntibioticsDiameter (mm)AntibioticsDiameter (mm)AntibioticsDiameter (mm)
Azithromycin25Azithromycin23Ampicillin27
Erythromycin32Ampicillin24Erythromycin30
Levofloxacin29Levofloxacin33Levofloxacin30
Tetracycline30Tetracycline29Tetracycline31
EOO 0.2 μL33EOO 0.2 μL34EOO 0.2 μL32
EOO 0.4 μL35EOO 0.4 μL35EOO 0.4 μL33
EOO 0.6 μL36EOO 0.6 μL36EOO 0.6 μL34
Table 2. Pearson correlation on the difference between the pathogen lots and the research variables. Statistical significance.
Research VariablesDifference in Infection with Staphylococcus aureusDifference in Infection with Escherichia coliDifference in Infection with Streptococcus pyogenes
Pearson coefficientGroup 106 patients
Diarrhea−0.277 **−0.366 **0.132
Gastrointestinal pain−0.292 **−0.174 *−0.224 **
Flatulence−0.302 **−0.224 **0.021
* Pearson coefficient r < 0.40 with statistical significance p < 0.05. ** Pearson coefficient r < 0.40 with statistical significance p < 0.01.
Table 3. Gas chromatograph report (g × 100 g−1 DW) for the extract of EOO in percentage composition.
Compound NameRetention TimeRelative Area %Kovats Retention Indices (RI)
α-Pinene6.0740.23713
1-Octen-3-ol6.7100.77966
Bicyclo[2.2.1]heptan, 2,2-dimethyl-3-methylene-, (1S)-6.3230.161055
endo-Borneol9.7373.391214
2-Furanmethanol, 5-eteniltetrahydro-
α,α,5-trimethyl-, cis-
8.2480.231239
2-Methyl-5-(propan-2-yliden)cyclohexan-1,4-diol11.8770.981244
o-Cymene7.4890.441251
p-Cymene-2-ol-methyl-ether10.7900.181256
cis-Linalool oxide8.4960.161265
Thymol11.4453.621268
Carvacrol11.67029.221292
Carvone11.1180.611299
(R)-lavandulyl acetate12.4140.171341
4,4-Dimethylpent-2-enal11.9690.191369
Terpineol10.2101.061381
R-(-)-p-Menth-l-en-4-ol9.8902.891409
α-Cadinol15.9970.021500
3-Octanol6.9690.191601
Eucaliptol7.6220.401670
.tau.-Cadinol15.9890.571804
(-)-Spatulenol15.3020.461829
Linalool8.65911.181861
o-lzopropilphenethol12.0330.271895
Phenol, 2-methil-5-(1-methyletil)-, acetate12.5740.321953
Caryophyllene13.3561.441962
β-Bisabolene14.3492.652264
2,7-Dimethyloctadiin-3,5-diol-2,713.7340.522288
S-lndacen-l-(2H)-ona, 3,5,6,7-tetrahydro-3,3,5,5-tetramethyl-8-(3-methilbutil)21.5080.203101
3-Trifluoroacetate ester pregnenolone21.1070.463162
Caryophyllene oxide15.3971.013669
Geranyl acetate12.6560.234360
Publisher’s Note: MDPI stays neutral with regard to jurisdictional claims in published maps and institutional affiliations.

