
Validation of an HPLC–MS/MS Method for the Determination of Plasma Ticagrelor and Its Active Metabolite Useful for Research and Clinical Practice


Abstract
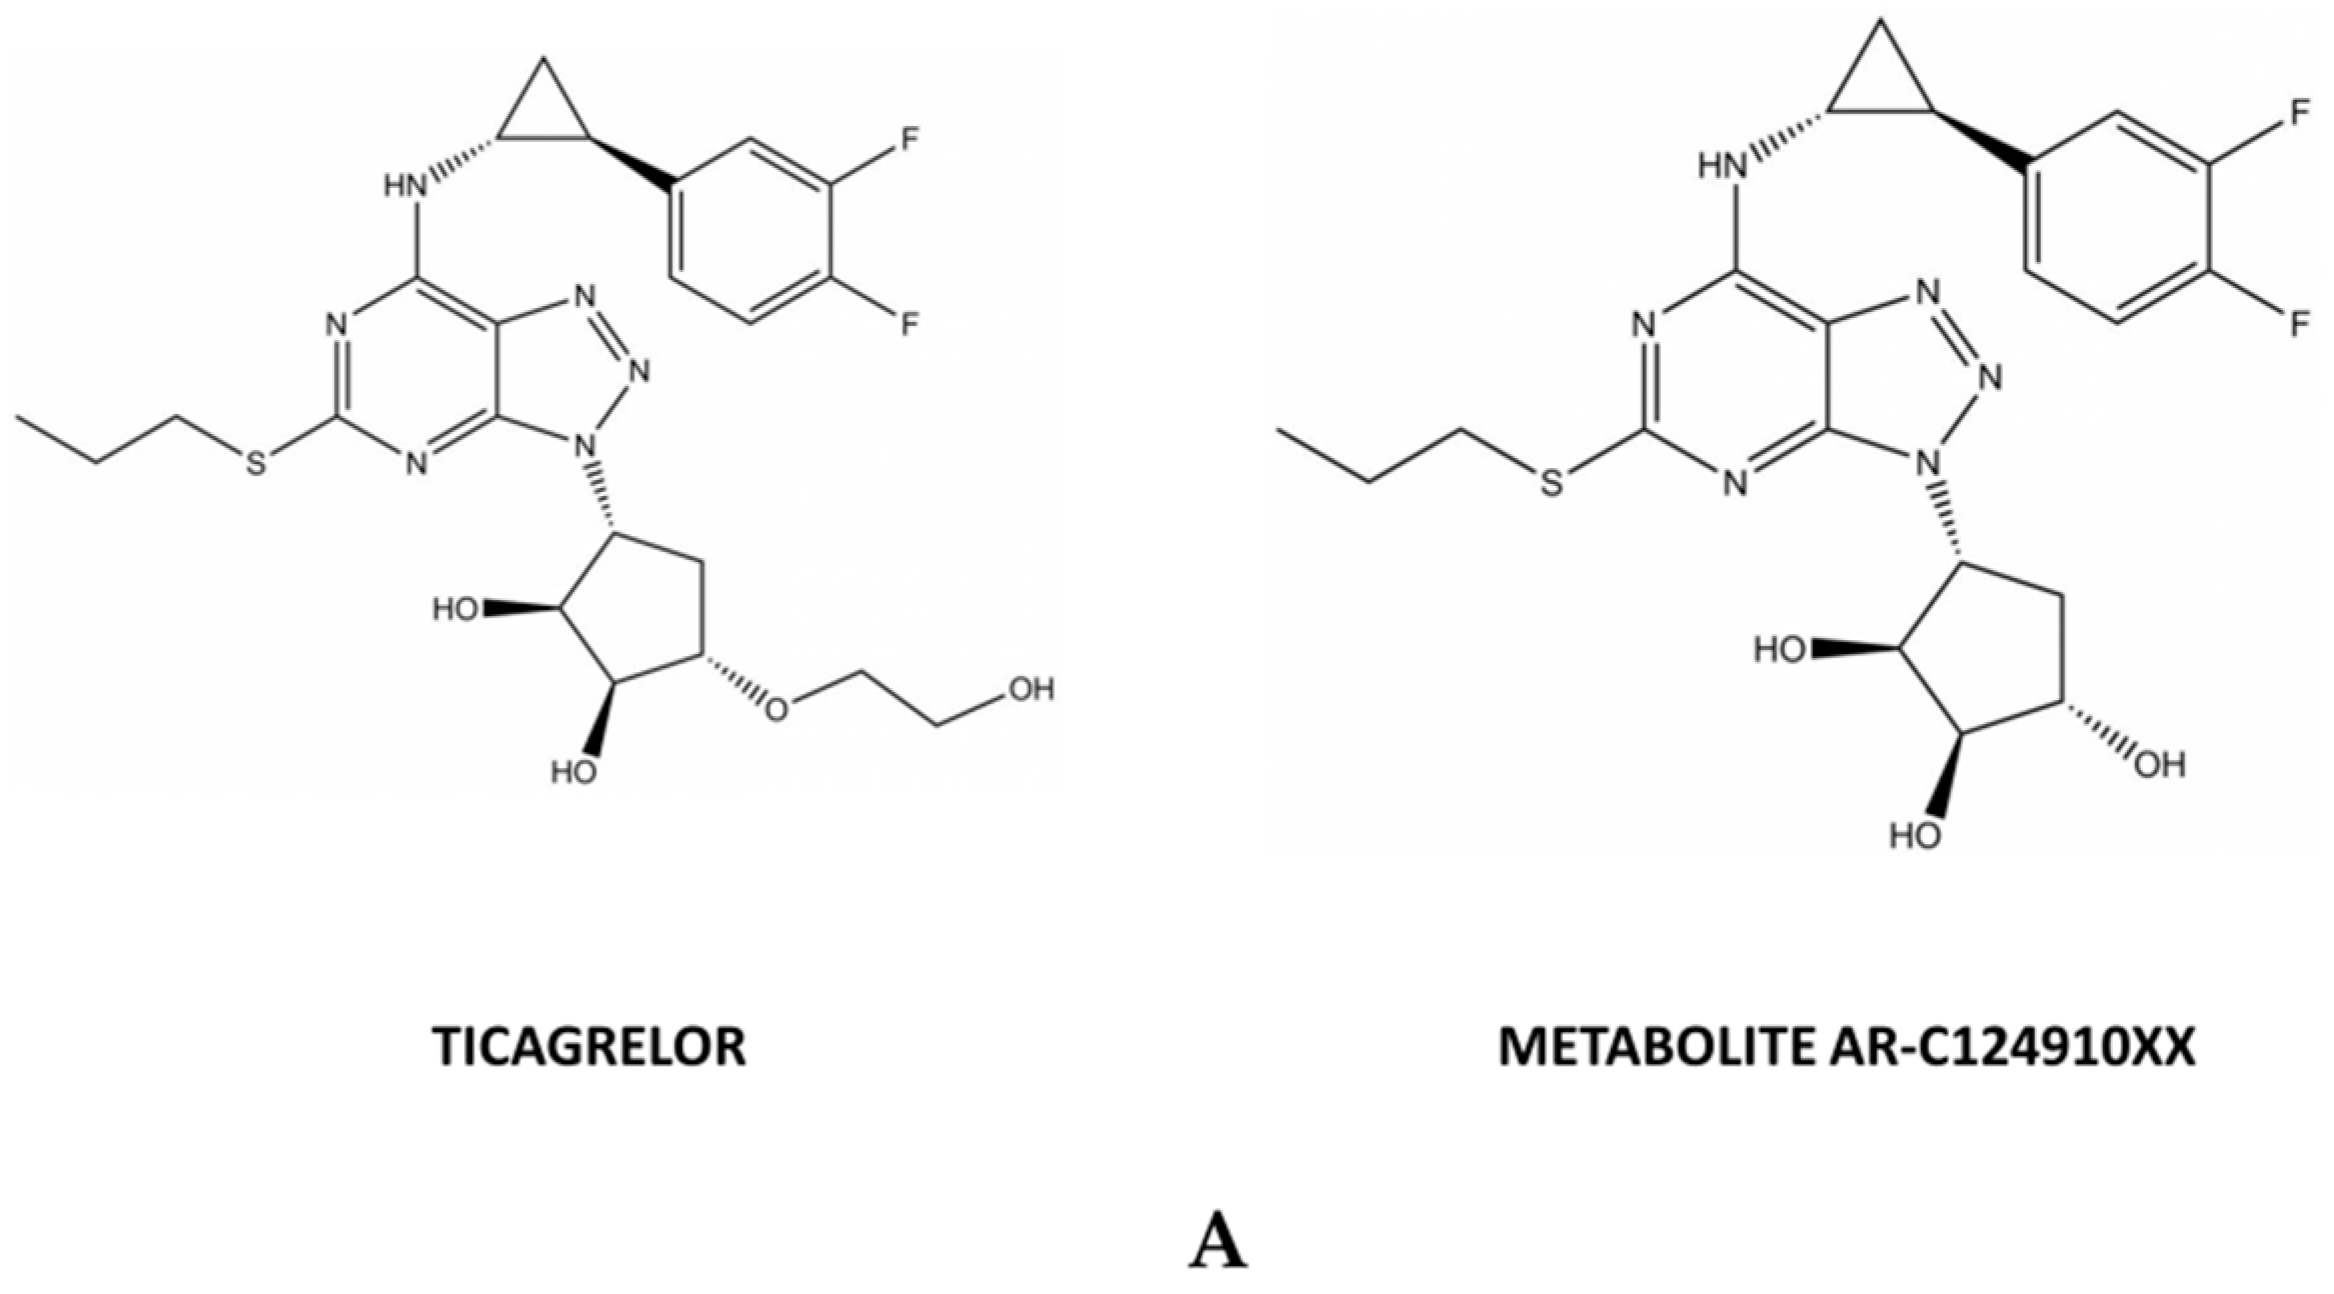
1. Introduction
2. Results
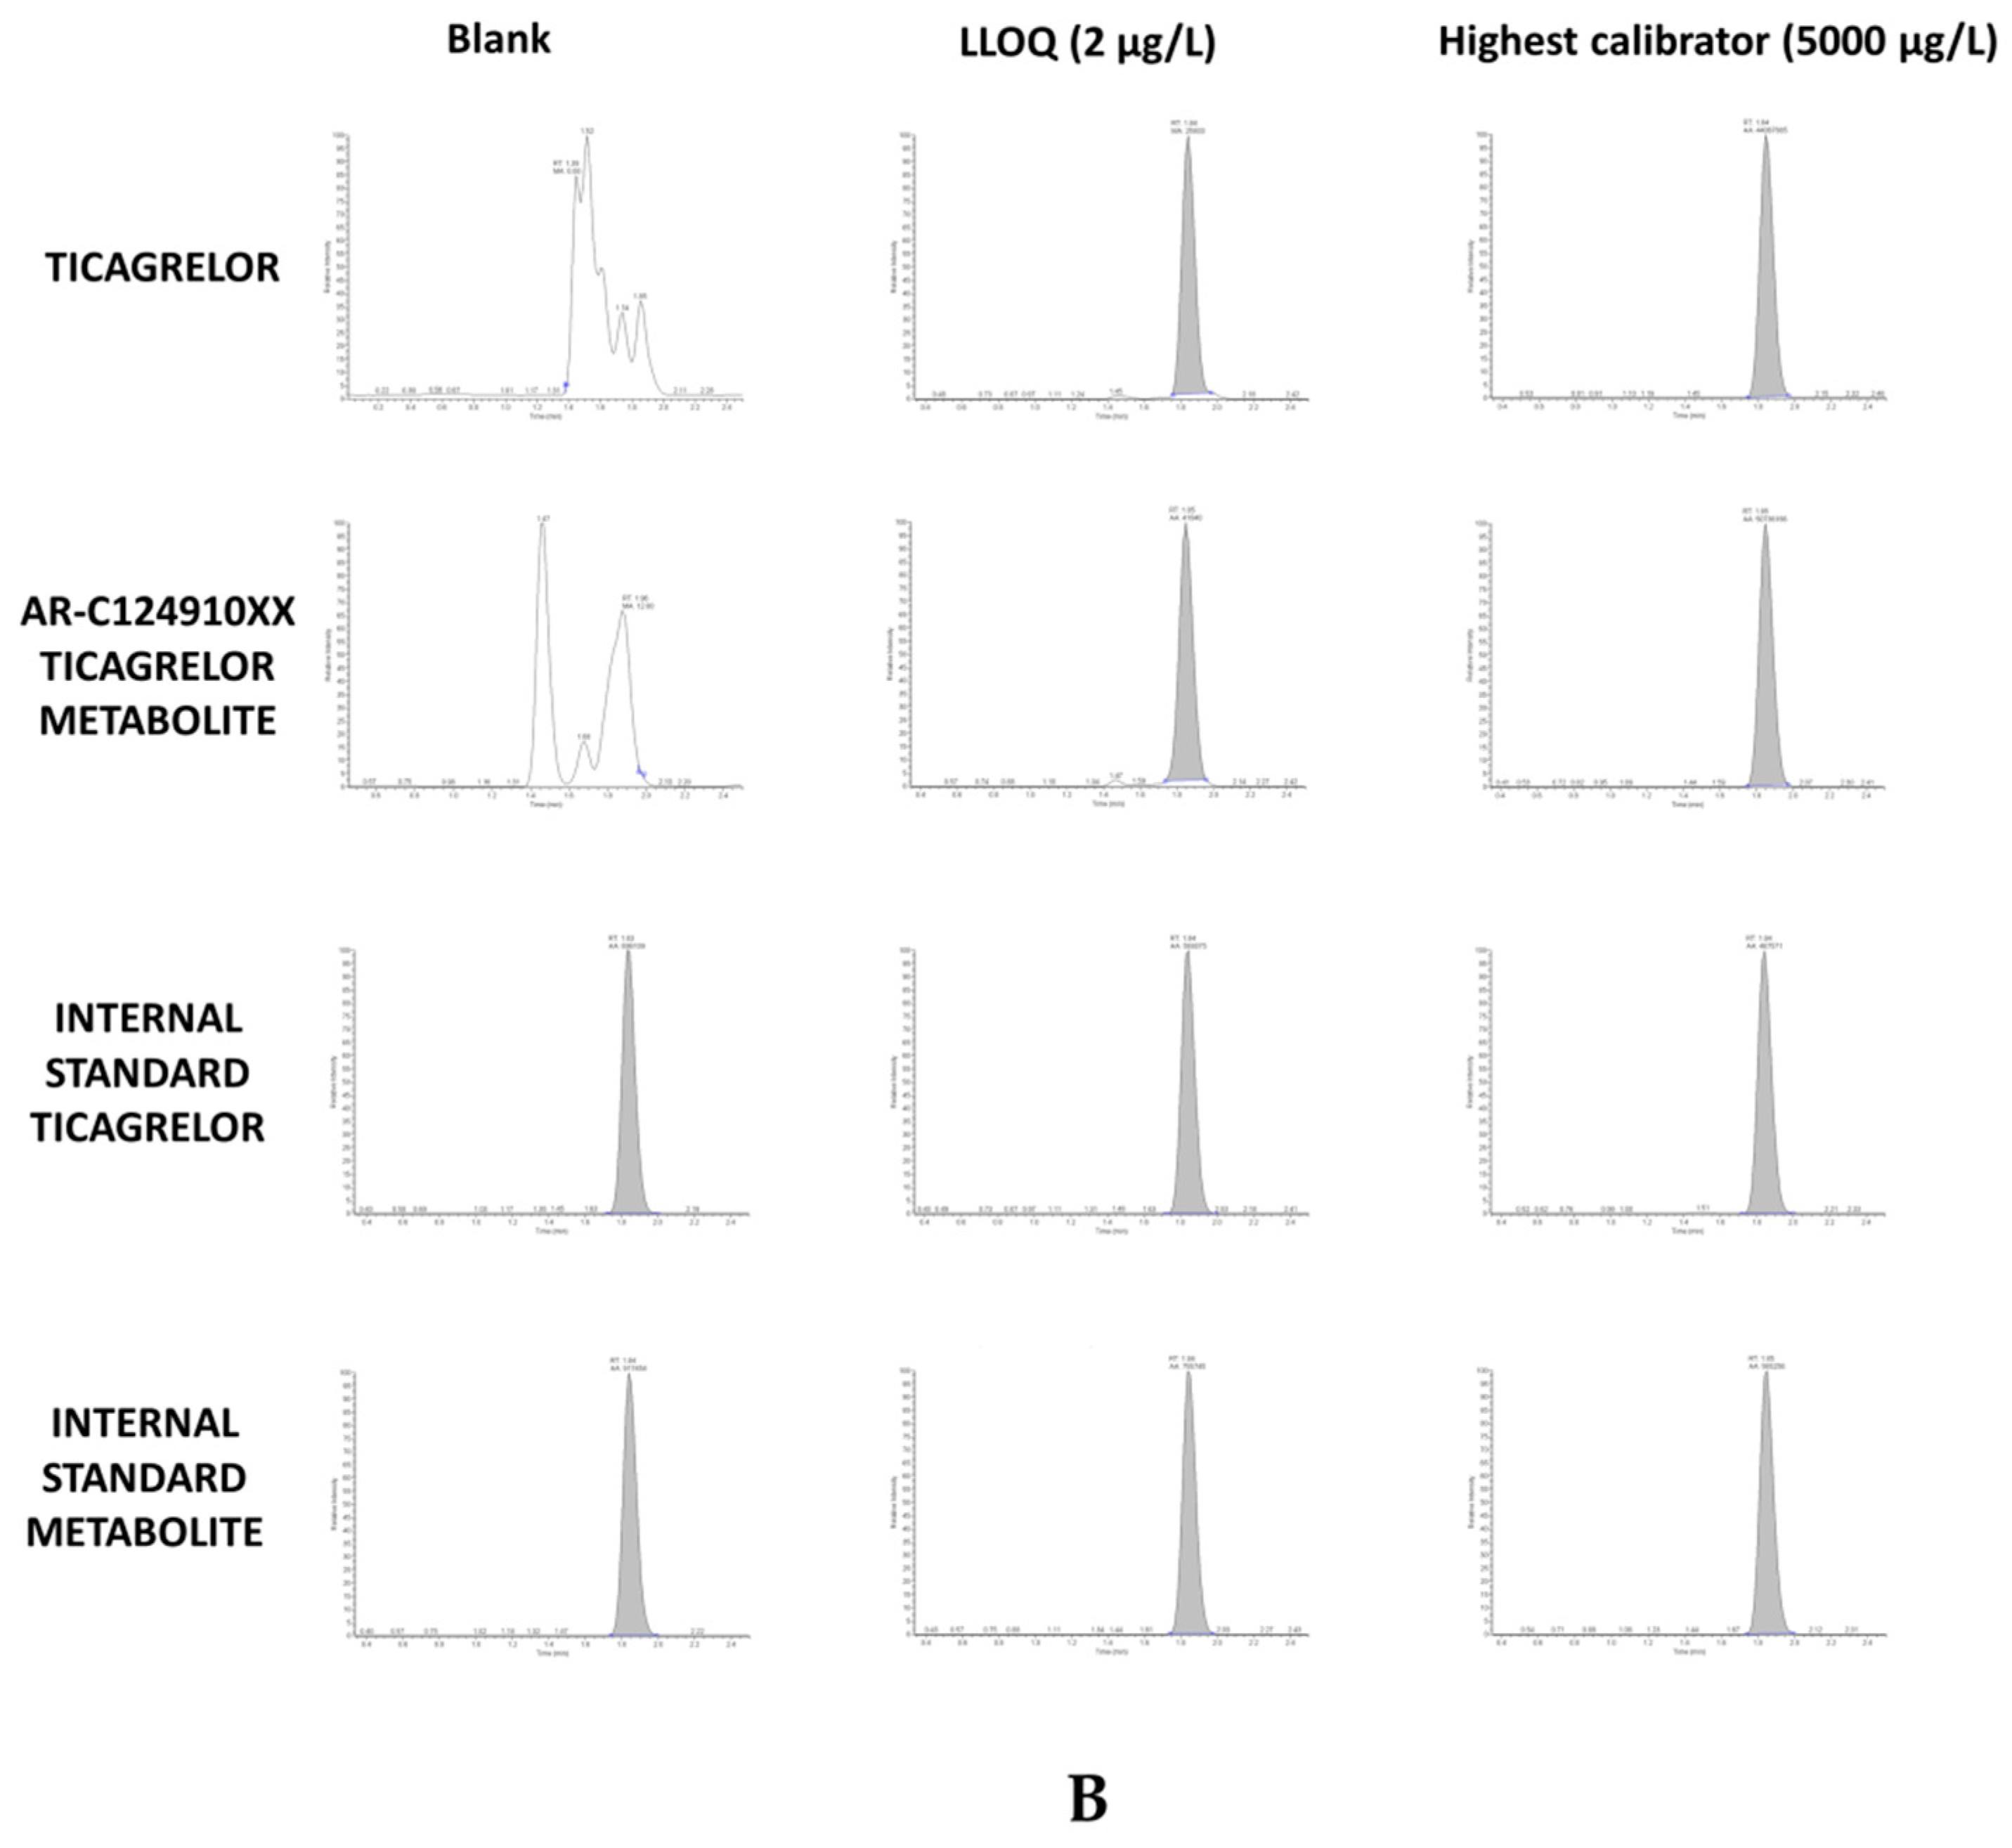
2.1. Chromatogram and Retention Times
2.2. Selectivity
2.3. Lower Limit of Quantification, Calibration Curve, and Linearity
2.4. Accuracy and Precision
2.5. Recovery and Matrix Effect
2.6. Stability
2.7. Contamination
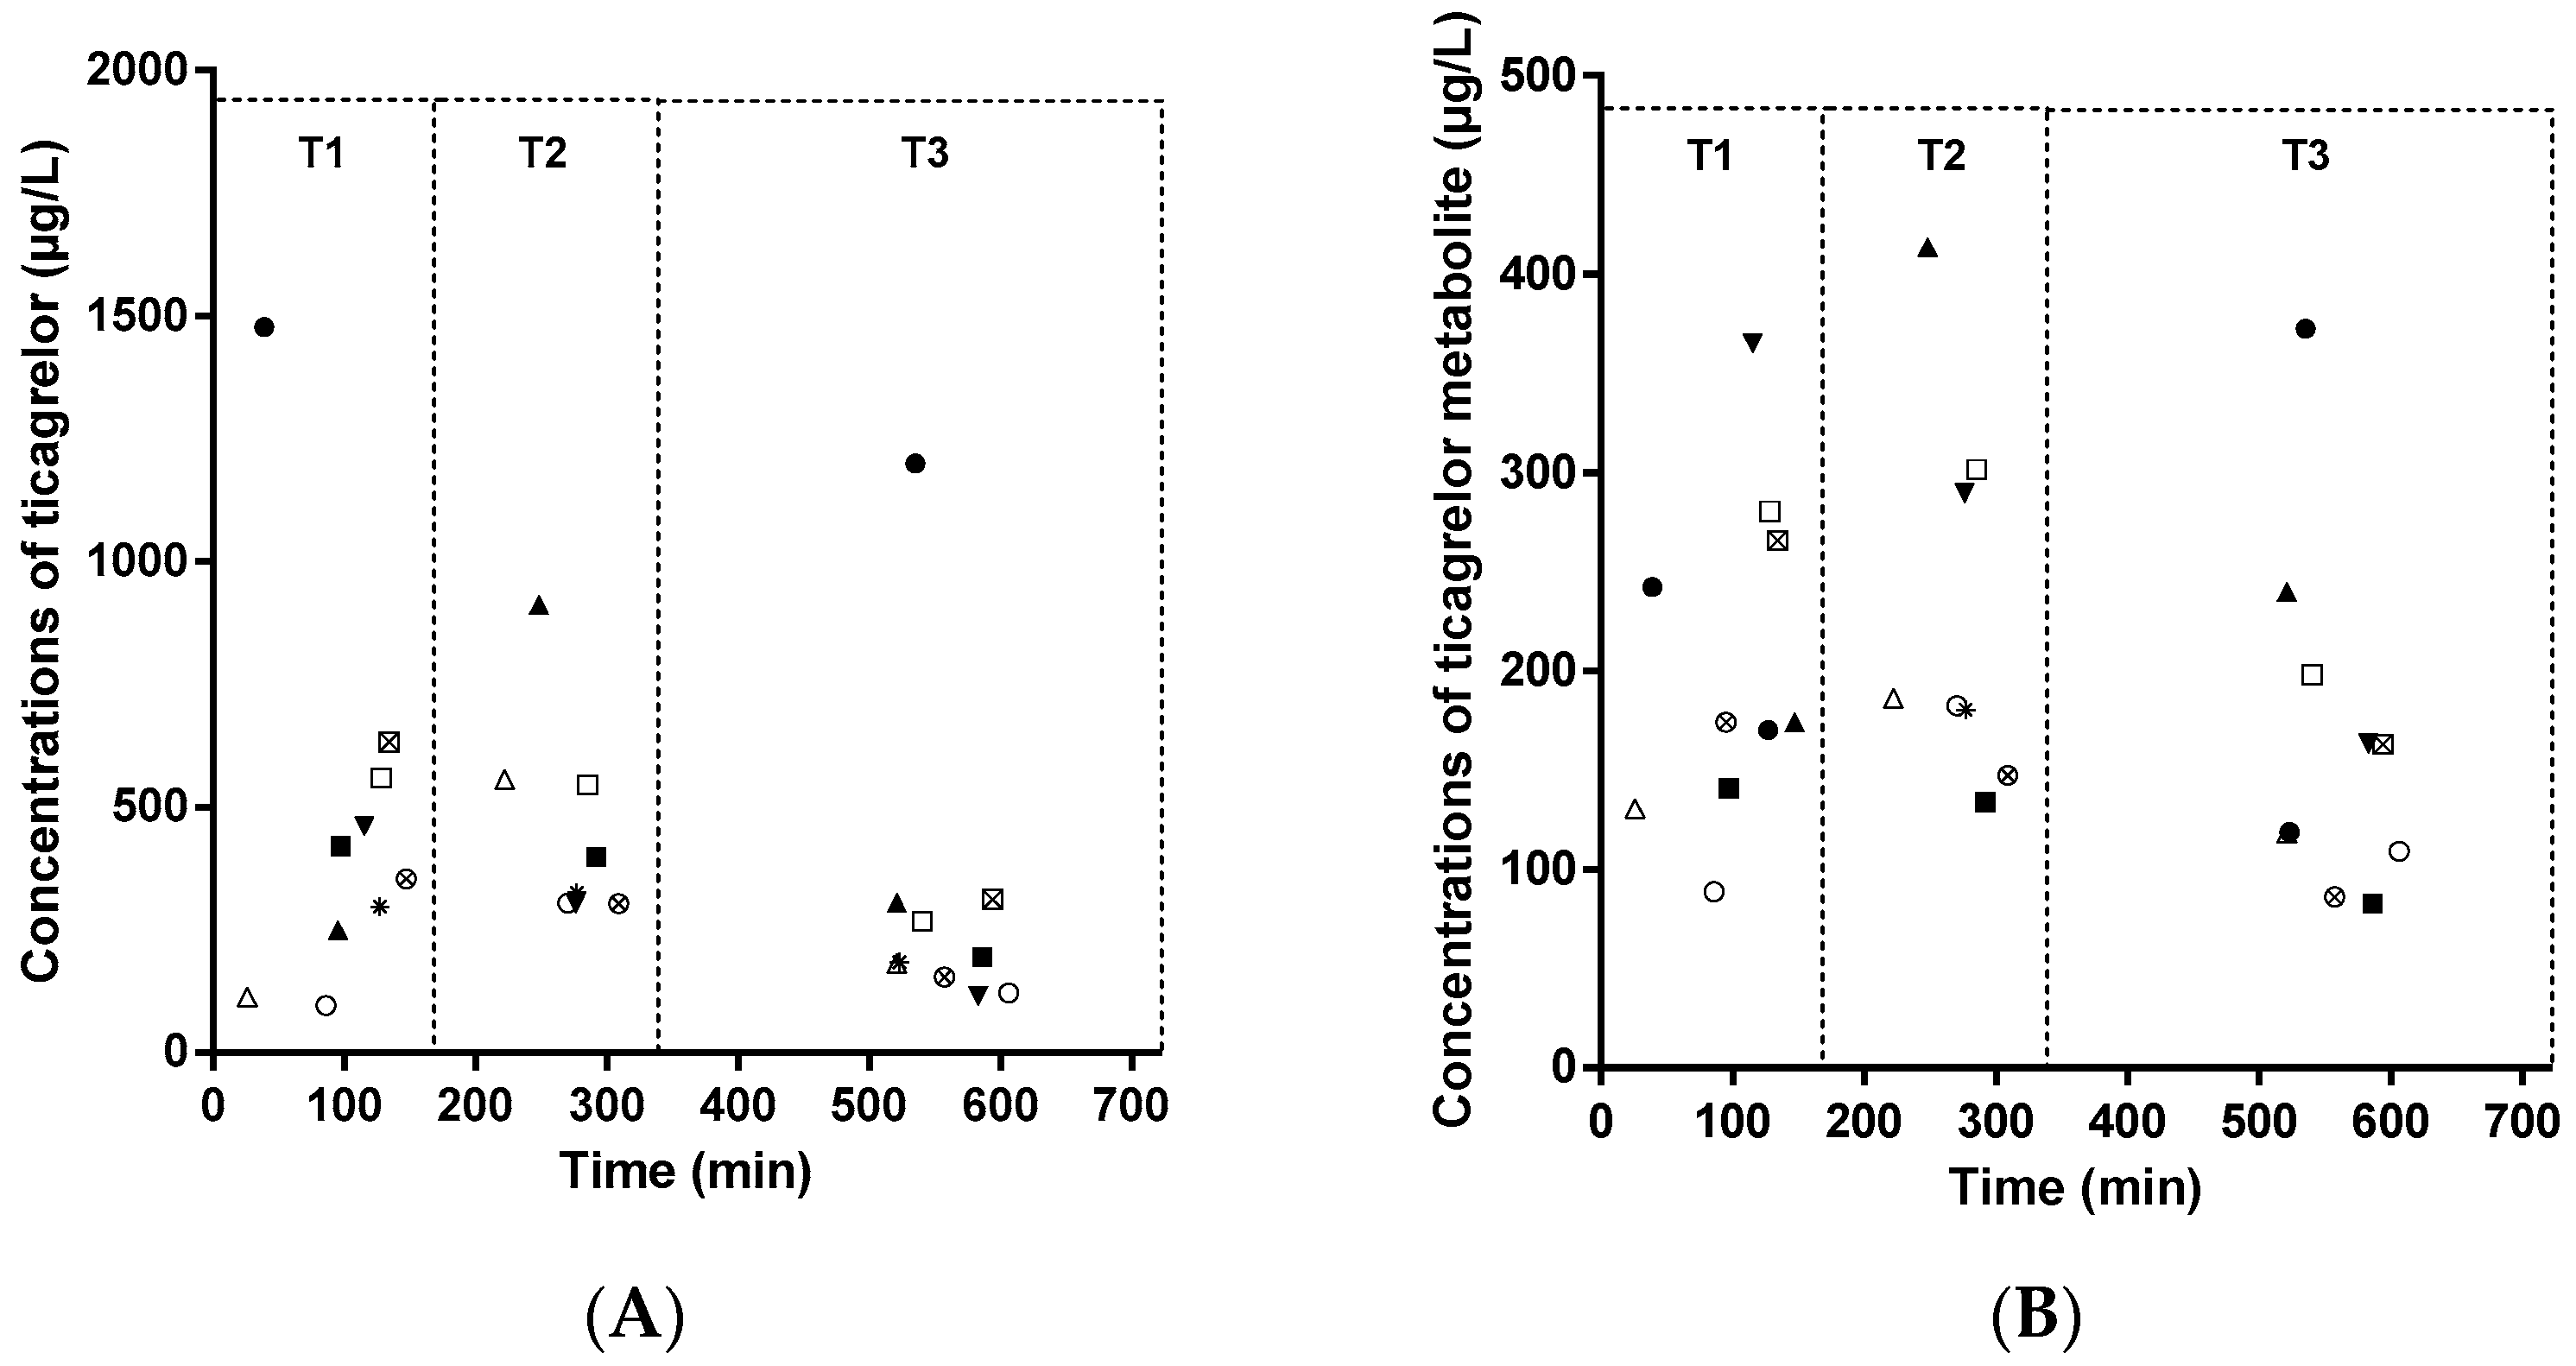
2.8. Application to Pharmacokinetics Study
3. Discussion
4. Materials and Methods
4.1. Chemical and Reagents
4.2. Standard and Quality Control Sample Preparation
4.3. Sample Extraction
4.4. Instrument and Analytical Conditions
4.5. Analytical Data Processing
4.6. Validation Procedure
4.6.1. Selectivity
4.6.2. Calibration Curves
4.6.3. Determination of the Lower Limit of Quantification
4.6.4. Accuracy and Precision
4.6.5. Recovery and Matrix Effect
4.6.6. Stability
4.6.7. Contamination
4.6.8. Application to Pharmacokinetics Study
5. Conclusions
Author Contributions
Funding
Institutional Review Board Statement
Informed Consent Statement
Data Availability Statement
Acknowledgments
Conflicts of Interest
Abbreviations
| ADP | Adenosine diphosphate |
| COFRAC | French Accreditation Committee |
| EMA | European Medicines Agency |
| FDA | Food and Drug Administration |
| LC–MS/MS | Liquid chromatography–mass tandem spectrometry |
| LLOQ | Lower limit of quantification |
| QC | Quality control |
| RE | Relative error |
| RSD | Relative standard deviation |
| RT | Retention time |
References
- Teng, R.; Oliver, S.; Hayes, M.A.; Butler, K. Absorption, Distribution, Metabolism, and Excretion of Ticagrelor in Healthy Subjects. Drug Metab. Dispos. 2010, 38, 1514–1521. [Google Scholar] [CrossRef] [PubMed]
- Dobesh, P.P.; Oestreich, J.H. Ticagrelor: Pharmacokinetics, Pharmacodynamics, Clinical Efficacy, and Safety. Pharmacotherapy 2014, 34, 1077–1090. [Google Scholar] [CrossRef] [PubMed]
- VAN Giezen, J.J.J.; Nilsson, L.; Berntsson, P.; Wissing, B.-M.; Giordanetto, F.; Tomlinson, W.; Greasley, P.J. Ticagrelor Binds to Human P2Y(12) Independently from ADP but Antagonizes ADP-Induced Receptor Signaling and Platelet Aggregation. J. Thromb. Haemost. 2009, 7, 1556–1565. [Google Scholar] [CrossRef] [PubMed]
- Armstrong, D.; Summers, C.; Ewart, L.; Nylander, S.; Sidaway, J.E.; Giezen, J.J.J. Characterization of the Adenosine Pharmacology of Ticagrelor Reveals Therapeutically Relevant Inhibition of Equilibrative Nucleoside Transporter 1. J. Cardiovasc. Pharmacol. Ther. 2014, 19, 209–219. [Google Scholar] [CrossRef] [PubMed]
- Lariccia, V.; Macrì, M.L.; Matteucci, A.; Maiolino, M.; Amoroso, S.; Magi, S. Effects of ticagrelor on the sodium/calcium exchanger 1 (NCX1) in cardiac derived H9c2 cells. Eur. J. Pharmacol. 2019, 850, 158–166. [Google Scholar] [CrossRef] [PubMed]
- Ortega-Paz, L.; Brugaletta, S.; Ariotti, S.; Akkerhuis, K.M.; Karagiannis, A.; Windecker, S.; Valgimigli, M. HI-TECH Investigators, Adenosine and Ticagrelor Plasma Levels in Patients with and Without Ticagrelor-Related Dyspnea. Circulation 2018, 138, 646–648. [Google Scholar] [CrossRef] [PubMed]
- Giannoni, A.; Emdin, M.; Passino, C. Cheyne-Stokes Respiration, Chemoreflex, and Ticagrelor-Related Dyspnea. N. Engl. J. Med. 2016, 375, 1004–1006. [Google Scholar] [CrossRef] [PubMed]
- Sillén, H.; Cook, M.; Davis, P. Determination of Unbound Ticagrelor and Its Active Metabolite (AR-C124910XX) in Human Plasma by Equilibrium Dialysis and LC-MS/MS. J. Chromatogr. B Analyt. Technol. Biomed. Life Sci. 2011, 879, 2315–2322. [Google Scholar] [CrossRef] [PubMed]
- Xu, X.; Ding, X.; Yuan, B.; Li, W.; Wang, Y.; Jin, Y.; Xu, H. Validated Liquid Chromatography-Tandem Mass Spectrometry Method for Quantification of Ticagrelor and Its Active Metabolite in Human Plasma. Biomed. Chromatogr. BMC 2019, 4498. [Google Scholar] [CrossRef] [PubMed]
- Chae, S.-I.; Yoo, H.J.; Lee, S.-Y.; Chung, E.K.; Shim, W.-S.; Lee, K.-T. Development and Validation of Simple LC-MS-MS Assay for the Quantitative Determination of Ticagrelor in Human Plasma: Its Application to a Bioequivalence Study. J. Chromatogr. Sci. 2019, 57, 331–338. [Google Scholar] [CrossRef] [PubMed]
- Center for Drug Evaluation and Research, Center for Veterinary Medicine. Food and Drug Administration, Bioanalytical Method Validation Guidance for Industry; Center for Drug Evaluation and Research, Center for Veterinary Medicine: Silver Spring, MD, USA, 2018.
- Sillén, H.; Cook, M.; Davis, P. Determination of Ticagrelor and Two Metabolites in Plasma Samples by Liquid Chromatography and Mass Spectrometry. J. Chromatogr. B Analyt. Technol. Biomed. Life Sci. 2010, 878, 2299–2306. [Google Scholar] [CrossRef] [PubMed]
- Jeon, H.-S.; Kim, M.-J.; Choi, H.-Y.; Kim, Y.-H.; Kim, E.-H.; Kim, A.-R.; Park, H.-J.; Bae, K.-S.; Lim, H.-S. Pharmacokinetics and Pharmacodynamics of Ticagrelor and Prasugrel in Healthy Male Korean Volunteers. Clin. Ther. 2015, 37, 563–573. [Google Scholar] [CrossRef]
- Hobl, E.-L.; Reiter, B.; Schoergenhofer, C.; Schwameis, M.; Derhaschnig, U.; Kubica, J.; Stimpfl, T.; Jilma, B. Morphine Decreases Ticagrelor Concentrations but Not Its Antiplatelet Effects: A Randomized Trial in Healthy Volunteers. Eur. J. Clin. Investig. 2016, 46, 7–14. [Google Scholar] [CrossRef] [PubMed]
- Wang, Z.-Y.; Chen, M.; Zhu, L.-L.; Yu, L.-S.; Zeng, S.; Xiang, M.-X.; Zhou, Q. Pharmacokinetic Drug Interactions with Clopidogrel: Updated Review and Risk Management in Combination Therapy. Ther. Clin. Risk Manag. 2015, 11, 449–467. [Google Scholar] [CrossRef]
- Danielak, D.; Gorzycka, P.; Kruszyna, Ł.; Karaźniewicz-Łada, M.; Główka, F. Development of an LC-MS/MS Method for Simultaneous Determination of Ticagrelor and Its Active Metabolite during Concomitant Treatment with Atorvastatin. J. Chromatogr. B Analyt. Technol. Biomed. Life Sci. 2019, 1105, 113–119. [Google Scholar] [CrossRef] [PubMed]
- Li, M.; Hu, Y.; Li, H.; Wen, Z.; Hu, X.; Zhang, D.; Zhang, Y.; Xiao, J.; Tang, J.; Chen, X. No Effect of SLCO1B1 and CYP3A4/5 Polymorphisms on the Pharmacokinetics and Pharmacodynamics of Ticagrelor in Healthy Chinese Male Subjects. Biol. Pharm. Bull. 2017, 40, 88–96. [Google Scholar] [CrossRef]
- Zhong, W.; Wang, X.; Tang, L.; Mai, L.; Chen, X.-P.; He, G.; Zheng, Z.; Zhong, S. Simultaneous Determination of Ticagrelor and Its Metabolites in Human Plasma and Urine Using Liquid Chromatography-Tandem Mass Spectrometry. J. Anal. Toxicol. 2016, 40, 445–453. [Google Scholar] [CrossRef]
- Sloten, T.T.; Klaver, P.A.G.; Wall Bake, A.W.L. Co-Administration of Cyclosporine and Ticagrelor May Lead to a Higher Exposure to Cyclosporine: A Case Report of a 49-Year-Old Man. Br. J. Clin. Pharmacol. 2018, 84, 208–210. [Google Scholar] [CrossRef] [PubMed]


| Intra-Assay | Inter-Assay | ||||||
|---|---|---|---|---|---|---|---|
| Molecules | Spiked Concentration (µg/L) | Nominal Concentration (µg/L) | Precision (%, RSD) | Accuracy (%, RE) | Precision (%, RSD) | Accuracy (%, RE) | |
| Ticagrelor | LLOQ | 1.8 | 2 | 13.4 | −8 | 19.9 | −11.5 |
| QC1 | 7.9 | 8 | 5.4 | −4.5 | 9.9 | −1.6 | |
| QC2 | 768.5 | 800 | 3 | −2.8 | 4.9 | −3.9 | |
| QC3 | 3313.2 | 3500 | 4.5 | −4 | 4.6 | −5.3 | |
| Active Metabolite AR-C124910XX | LLOQ | 1.8 | 2 | 14 | 4.5 | 19.4 | −12 |
| QC1 | 8.3 | 8 | 2.3 | 8.4 | 5.9 | 3.6 | |
| QC2 | 780 | 800 | 4.2 | −3.7 | 4 | −2.5 | |
| QC3 | 3396.7 | 3500 | 6.7 | −0.9 | 6.1 | −3 | |
| Molecules | Storage Condition | Type of Samples | RSD (%) | RE (%) |
|---|---|---|---|---|
| Ticagrelor | Whole blood at room temperature for 3 h | Low level | 0.4 | −3 |
| High level | 7 | 0.2 | ||
| Whole blood at room temperature for 6 h | Low level | 48.3 | −1.5 | |
| High level | 1.8 | 22 | ||
| Whole blood at room temperature for 24 h | Low level | 3.9 | −16.1 | |
| High level | 14.4 | −20.6 | ||
| Whole blood at 4 °C for 3 h | Low level | 4.9 | 5.4 | |
| High level | 5.7 | 10.9 | ||
| Whole blood at 4 °C for 6 h | Low level | 4.5 | −14.2 | |
| High level | 27.6 | −14.9 | ||
| Whole blood at 4 °C for 24 h | Low level | 4.5 | 23.3 | |
| High level | 0.3 | 27.4 | ||
| Three freeze-thaw cycles at −20 °C | QC1 | 4.6 | 4 | |
| QC3 | 2.6 | −4.2 | ||
| Plasma on bench-top at room temperature for 24 h | QC1 | 5.2 | 6.2 | |
| QC3 | 1.4 | −3.2 | ||
| Processed samples at 4 °C for 72 h after extraction | 28 samples | NA | 3.7 | |
| Active Metabolite AR-C124910XX | Whole blood at room temperature for 3 h | Low level | 1.4 | 1.8 |
| High level | 3.7 | −0.3 | ||
| Whole blood at room temperature for 6 h | Low level | 60.2 | 4.6 | |
| High level | 12.2 | 29.8 | ||
| Whole blood at room temperature for 24 h | Low level | 2 | −18.9 | |
| High level | 9.6 | −19.6 | ||
| Whole blood at 4 °C for 3 h | Low level | 3.9 | 5 | |
| High level | 0.9 | −0.9 | ||
| Whole blood at 4 °C for 6 h | Low level | 2.4 | −23.3 | |
| High level | 12.5 | −13.1 | ||
| Whole blood at 4 °C for 24 h | Low level | 11.7 | 1.4 | |
| High level | 0.1 | 7 | ||
| Three freeze-thaw cycles at −20 °C | QC1 | 5.1 | −14 | |
| QC3 | 3 | 0.03 | ||
| Plasma on bench-top at room temperature for 24 h | QC1 | 7.7 | −19.2 | |
| QC3 | 8.4 | −1.9 | ||
| Processed samples at 4 °C for 72 h after extraction | 28 samples | NA | 13.8 |
| Compound | Parent Ion (m/z) | Product Ion (m/z) | Collision Energy (eV) | Tube Lens Voltage (V) |
|---|---|---|---|---|
| Ticagrelor | 523.225 | 152.960 * | 35 | 95.36 |
| 132.94 | 35 | 95.36 | ||
| AR-C124910XX | 479.192 | 132.970 * | 44 | 151.66 |
| 479.192 | 59 | 151.66 | ||
| [2H7]-ticagrelor | 530.283 | 133.1 | 62 | 115.38 |
| [2H7]-AR-C124910XX | 486.238 | 133.01 | 47 | 86.85 |
Sample Availability: Samples of the compounds are not available from the authors. |
Publisher’s Note: MDPI stays neutral with regard to jurisdictional claims in published maps and institutional affiliations. |
© 2021 by the authors. Licensee MDPI, Basel, Switzerland. This article is an open access article distributed under the terms and conditions of the Creative Commons Attribution (CC BY) license (http://creativecommons.org/licenses/by/4.0/).
Share and Cite
Lagoutte-Renosi, J.; Royer, B.; Rabani, V.; Davani, S. Validation of an HPLC–MS/MS Method for the Determination of Plasma Ticagrelor and Its Active Metabolite Useful for Research and Clinical Practice. Molecules 2021, 26, 278. https://doi.org/10.3390/molecules26020278
Lagoutte-Renosi J, Royer B, Rabani V, Davani S. Validation of an HPLC–MS/MS Method for the Determination of Plasma Ticagrelor and Its Active Metabolite Useful for Research and Clinical Practice. Molecules. 2021; 26(2):278. https://doi.org/10.3390/molecules26020278
Chicago/Turabian StyleLagoutte-Renosi, Jennifer, Bernard Royer, Vahideh Rabani, and Siamak Davani. 2021. "Validation of an HPLC–MS/MS Method for the Determination of Plasma Ticagrelor and Its Active Metabolite Useful for Research and Clinical Practice" Molecules 26, no. 2: 278. https://doi.org/10.3390/molecules26020278
APA StyleLagoutte-Renosi, J., Royer, B., Rabani, V., & Davani, S. (2021). Validation of an HPLC–MS/MS Method for the Determination of Plasma Ticagrelor and Its Active Metabolite Useful for Research and Clinical Practice. Molecules, 26(2), 278. https://doi.org/10.3390/molecules26020278