Article

1H NMR Study of the HCa2Nb3O10 Photocatalyst with Different Hydration Levels

by
Marina G. Shelyapina
1,*,
Oleg I. Silyukov
2,
Elizaveta A. Andronova
1,
Denis Y. Nefedov
1,
Anastasiia O. Antonenko
1,
Alexander Missyul
3,
Sergei A. Kurnosenko
2 and
Irina A. Zvereva
2
1
Faculty of Physics, Saint Petersburg State University, 7/9 Universitetskaya nab., 199034 Saint Petersburg, Russia
2
Institute of Chemistry, Saint Petersburg State University, 7/9 Universitetskaya nab., 199034 Saint Petersburg, Russia
3
CELLS-ALBA Synchrotron, 08290 Cerdanyola del Vallès, Barcelona, Spain
*
Author to whom correspondence should be addressed.
Molecules 2021, 26(19), 5943; https://doi.org/10.3390/molecules26195943
Submission received: 30 August 2021 / Revised: 14 September 2021 / Accepted: 28 September 2021 / Published: 30 September 2021
(This article belongs to the Special Issue Practical Applications of NMR to Solve Real-World Problems)

Abstract

:
The photocatalytic activity of layered perovskite-like oxides in water splitting reaction is dependent on the hydration level and species located in the interlayer slab: simple or complex cations as well as hydrogen-bonded or non-hydrogen-bonded H2O. To study proton localization and dynamics in the HCa2Nb3O10·yH2O photocatalyst with different hydration levels (hydrated—α-form, dehydrated—γ-form, and intermediate—β-form), complementary Nuclear Magnetic Resonance (NMR) techniques were applied. 1H Magic Angle Spinning NMR evidences the presence of different proton containing species in the interlayer slab depending on the hydration level. For α-form, HCa2Nb3O10·1.6H2O, 1H MAS NMR spectra reveal H3O+. Its molecular motion parameters were determined from 1H spin-lattice relaxation time in the rotating frame (T) using the Kohlrausch-Williams-Watts (KWW) correlation function with stretching exponent β = 0.28: E a = 0.210 2 eV, τ 0 = 9.0 1   ×   10 12 s. For the β-form, HCa2Nb3O10·0.8H2O, the only 1H NMR line is the result of an exchange between lattice and non-hydrogen-bonded water protons. T(1/T) indicates the presence of two characteristic points (224 and 176 K), at which proton dynamics change. The γ-form, HCa2Nb3O10·0.1H2O, contains bulk water and interlayer H+ in regular sites. 1H NMR spectra suggest two inequivalent cation positions. The parameters of the proton motion, found within the KWW model, are as follows: E a = 0.217 8 eV, τ 0 = 8.2 9   ×   10 10 s.

1. Introduction

In recent years, layered perovskite-like oxides have attracted much attention because of their outstanding physical and chemical properties, including high-temperature superconductivity [1,2], colossal magnetoresistance [3], the capability of photocatalytic water decomposition under sunlight irradiation for further hydrogen storage [4,5], and ionic conductivity due to high mobility of interlayer cations [6,7]. The majority of ion-exchangeable layered perovskite-like oxides can be converted into their protonated forms, which, besides being proton conductors [6,8] and photocatalysts for water splitting [9,10,11], exhibit the ability to intercalate water [10,11,12,13,14] and other molecules [15,16] and/or to form graft derivatives [16,17,18,19] susceptible to further exfoliation [10,20,21].
The hydrated form of HCa2Nb3O10 (usually referred to as HCa2Nb3O10·1.5H2O in the literature) belongs to the Dion-Jacobson phase and can be obtained from KCa2Nb3O10 oxide by ion-exchange in acid solutions [22]. It was shown that HCa2Nb3O10∙1.5H2O enables the intercalation of amines by an acid-base mechanism [23] and may be later exfoliated into nanolayers [24,25]. Both KCa2Nb3O10 and HCa2Nb3O10∙1.5H2O, as well as their exfoliated and restacked forms, exhibit photocatalytic properties [26,27,28]. Along with this form, there may be others with a lower water content. The ability to intercalate water molecules often plays a crucial role in other intercalation reactions and photocatalysis [9,29,30,31]. Hydrated protonated forms may comprise protons [13,30] or charged complexes like H+n·H2O in their interlayer slab [32,33,34]. Obviously, water content and its state and localization should affect both the pathway and efficiency of chemical or photocatalytic reactions. From this perspective, an identification of proton-containing species and a comprehensive study of their motion in the interlayer slab is required.
Proton Nuclear Magnetic Resonance (NMR) is one of the most versatile experimental methods. It enables the identification of the proton-containing species and provides insight on the local structure [13,32,35,36,37] and information at the microscopic level on the dynamics of intercalated species [13,16,32,35,36,38]. In particular, by using 1H NMR, it was shown that both the local environment and the dynamics of hydrogen in these materials are affected by the stacking sequence of the perovskite-like slabs [39].
Here, we report on the results of the proton NMR spectroscopy and relaxation studies of the layered perovskite-like niobate HCa2Nb3O10 with different hydration levels: hydrated—α-form, dehydrated—γ-form, and intermediate—β-form. The details of their synthesis can be found in Section 3.

2. Results and Discussion

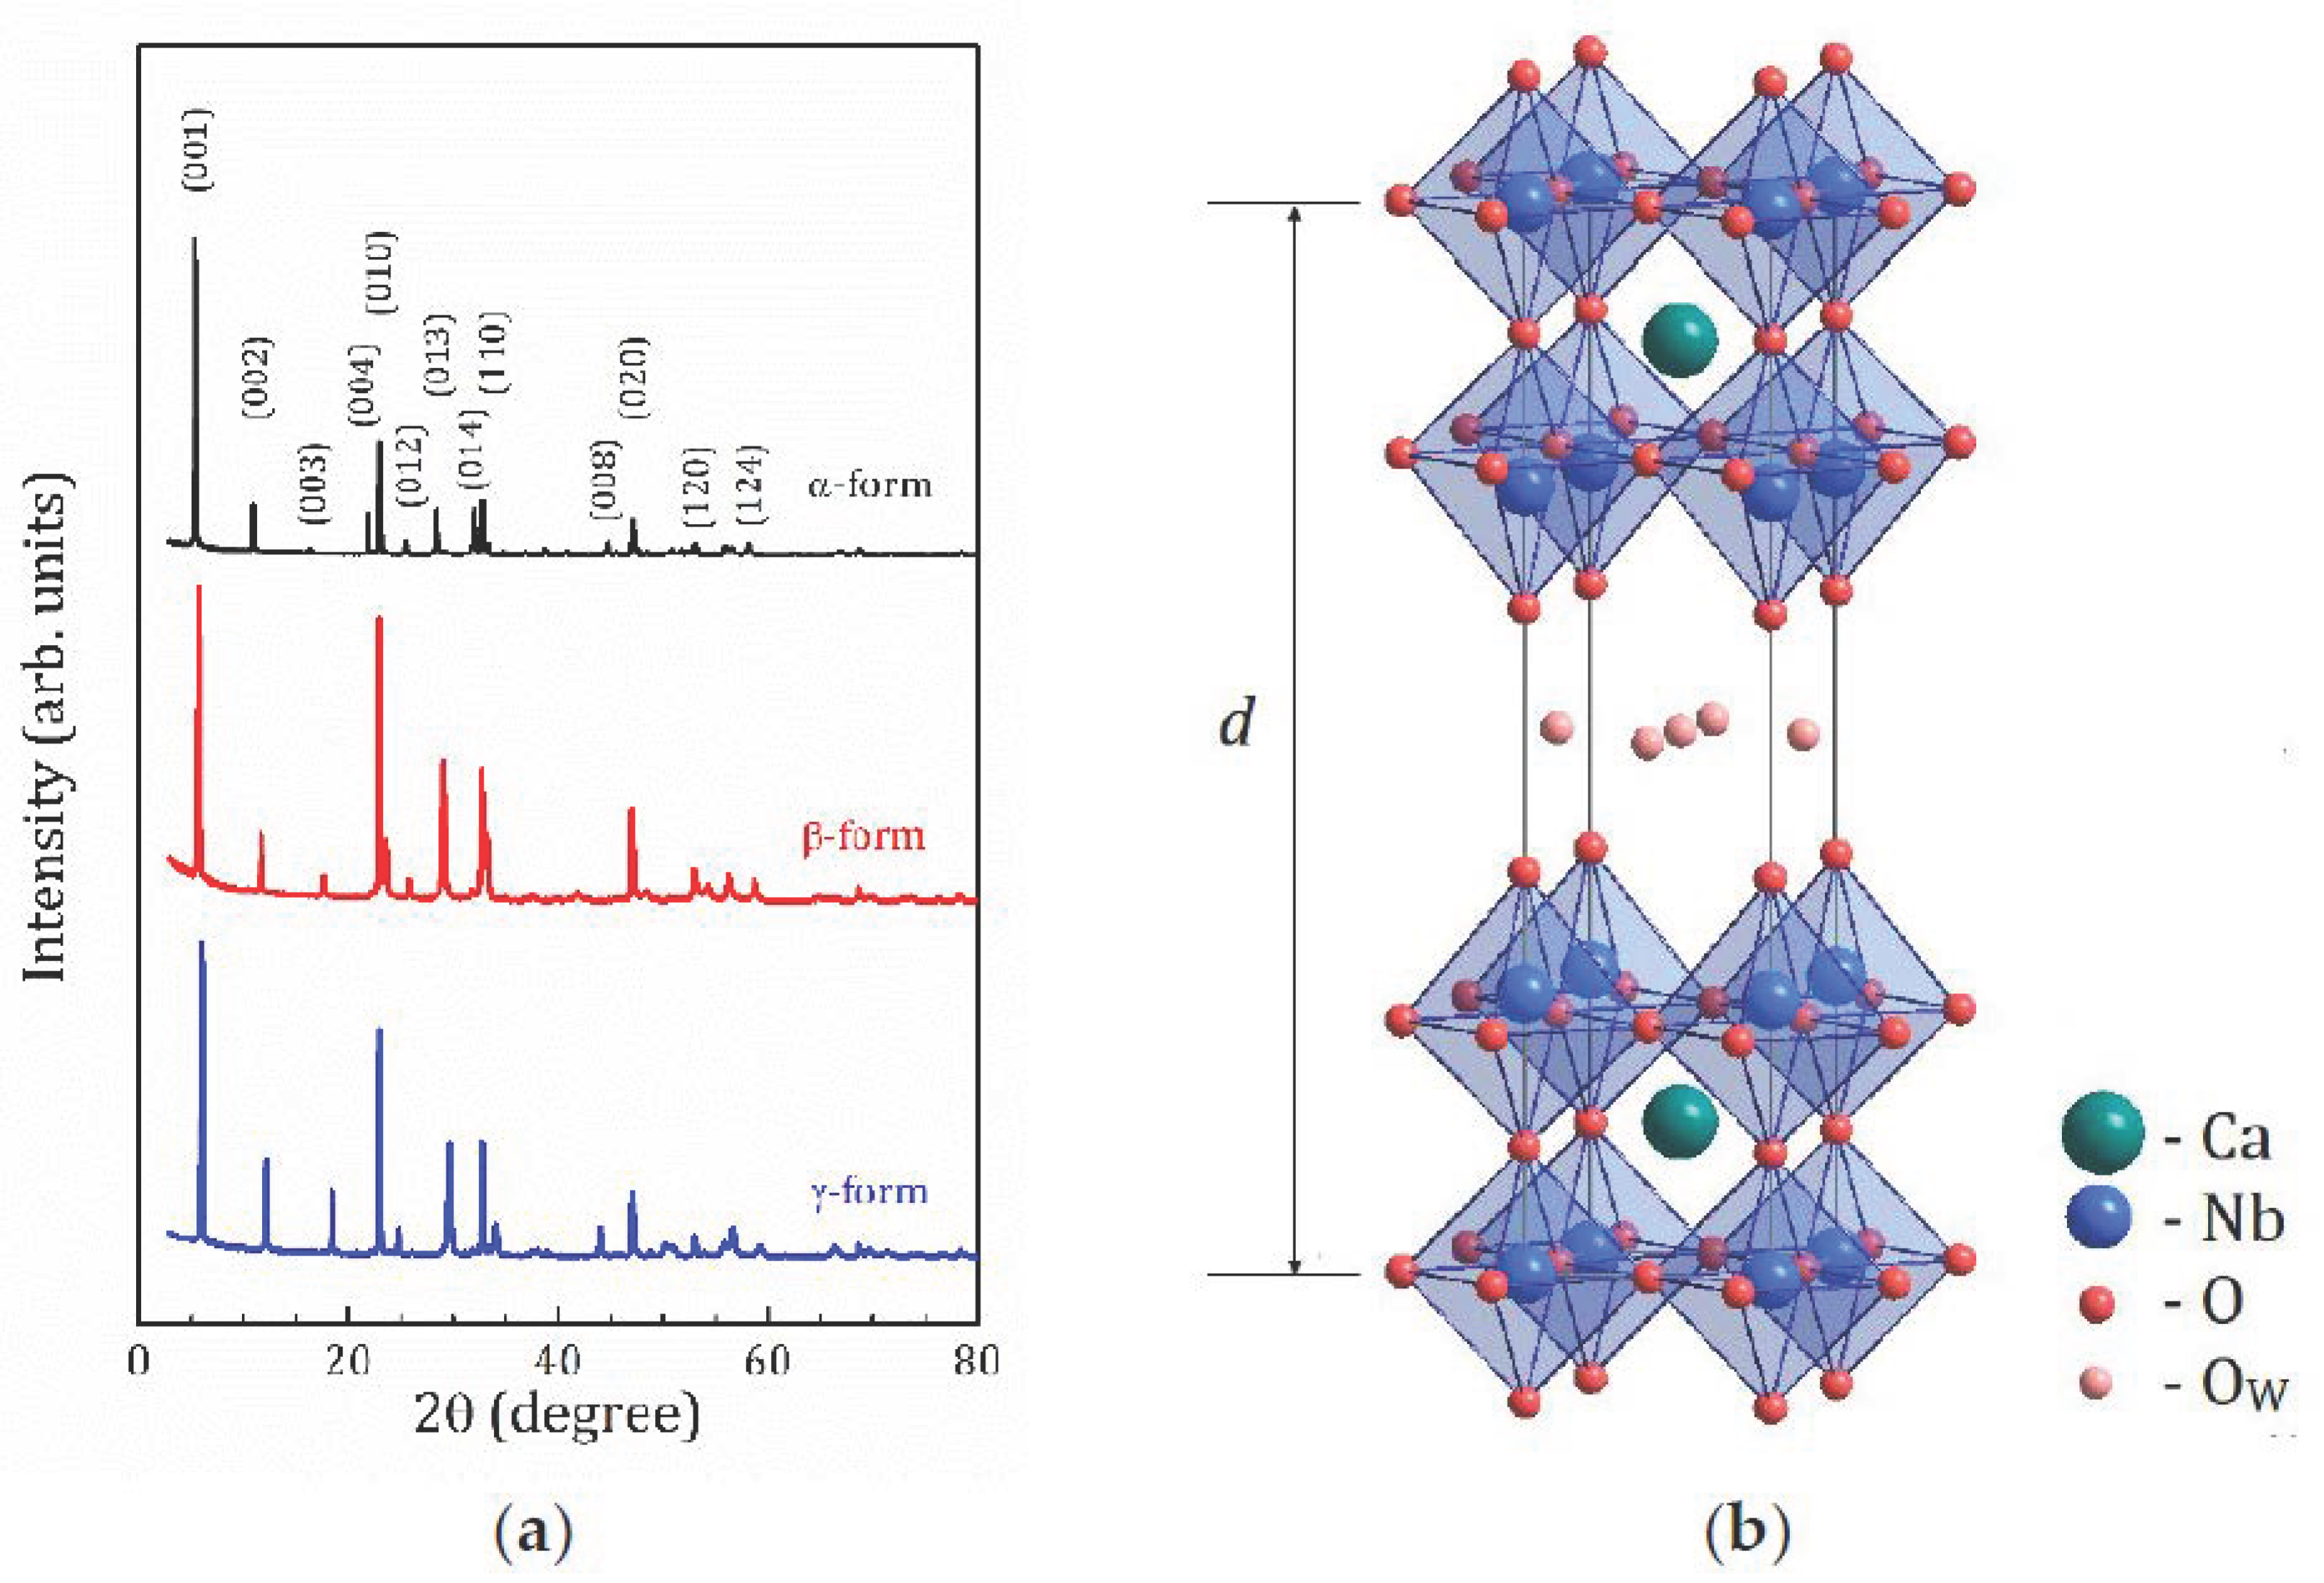
2.1. X-ray and TG Analysis

Figure 1a shows the X-ray Diffraction (XRD) patterns of the studied HCa2Nb3O10·yH2O samples with different hydration levels. The XRD shows that the samples are practically monophase. All the samples can be described by the P4/mmm space group. The unit cell is shown in Figure 1b. The lattice parameters are listed in Table 1.
The thermogravimetric (TG) curves that represent the mass decay due to the water release are shown in Figure 2a. As can be seen from the thermogravimetric curves, α-HCa2Nb3O10·yH2O exhibits behavior typical for a low-stable highly hydrated protonated form. Its thermal decomposition proceeds in two main steps, which is typical of protonated layered perovskite-like oxides [40,41,42]. The first step (T < 373 K) is associated with the release of the intercalated water and the formation of a dehydrated protonated compound:
HCa2Nb3O10·yH2O → HCa2Nb3O10 + yH2O.
The second step of the mass loss that occurs at about 525 ÷ 550 K is related with thermal degradation, or so-called topochemical condensation:
HCa2Nb3O10 → Ca2Nb3O9.5 + 0.5H2O.
The thermal decomposition of the γ-form demonstrates similar trends, but the mass loss at the first step is essentially low due to the much lower content of the intercalated water. Thermolysis of the β-form appears to be a more complex process, including gradual evolution of interlayer water in the temperature range of 373 ÷ 525 K, with the subsequent topochemical condensation of the protonated compound. The absence of the mass loss for the β-form at the beginning part of the TG curve indicates its greater thermal stability in comparison with the α-form.
According to the TG analysis, all the studied forms are fully protonated compounds with a substitution degree of K+ cations for protons H+ close to 100%. The water content as determined from TG curves results in 1.6, 0.8, and 0.1 H2O molecules per formula unit for α-, β-, and γ-forms, respectively. When describing layered structures, an important parameter is the interlayer distance d, the distance between the center of the adjacent perovskite slabs. For the studied structures, d = c; Figure 1b and Figure 2b show the correlation between the d parameter and the water content, which confirms that water molecules are located within the interlayer space.

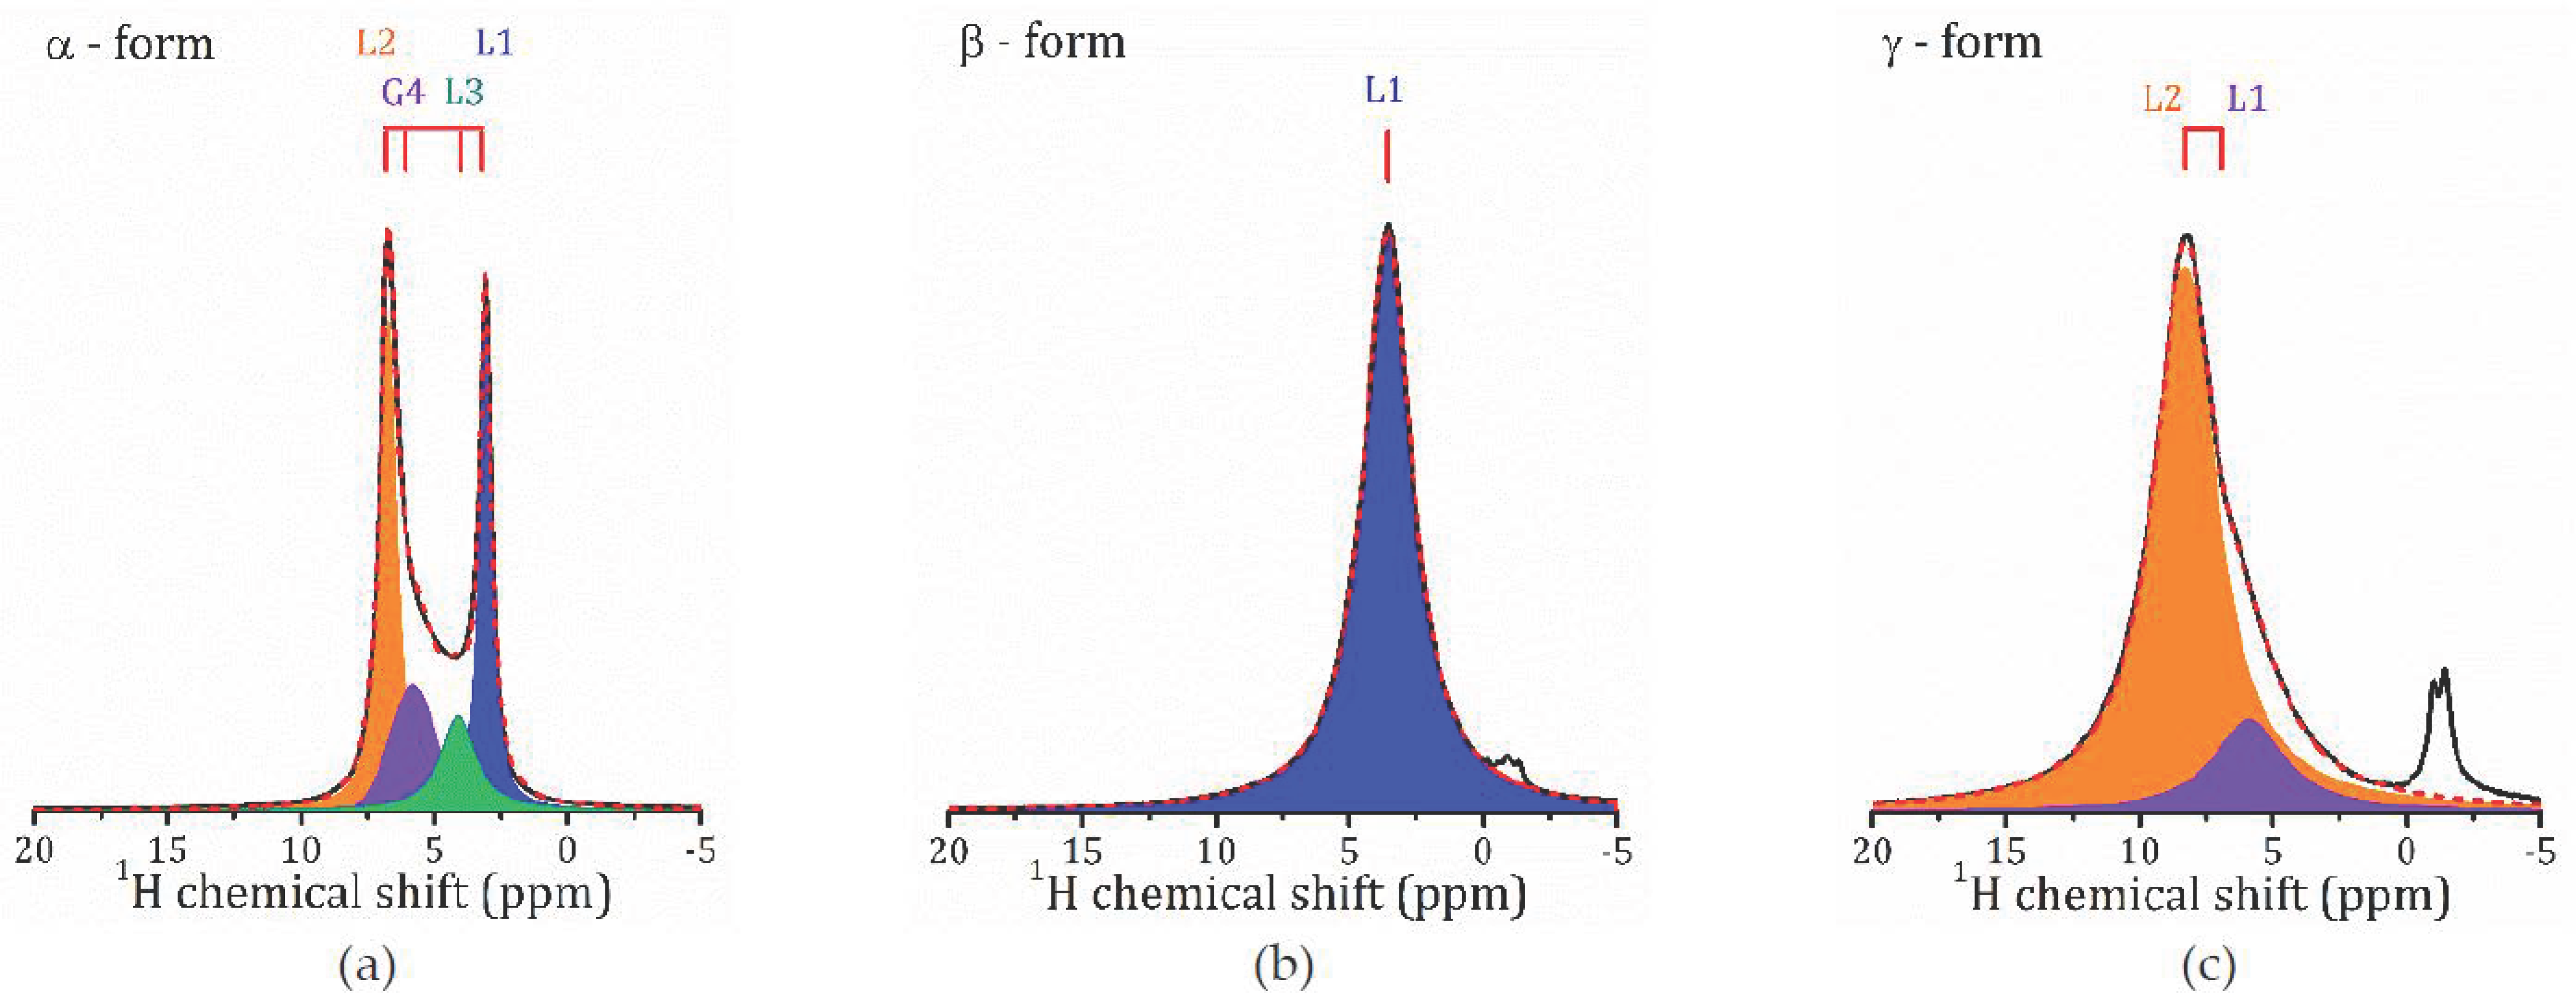
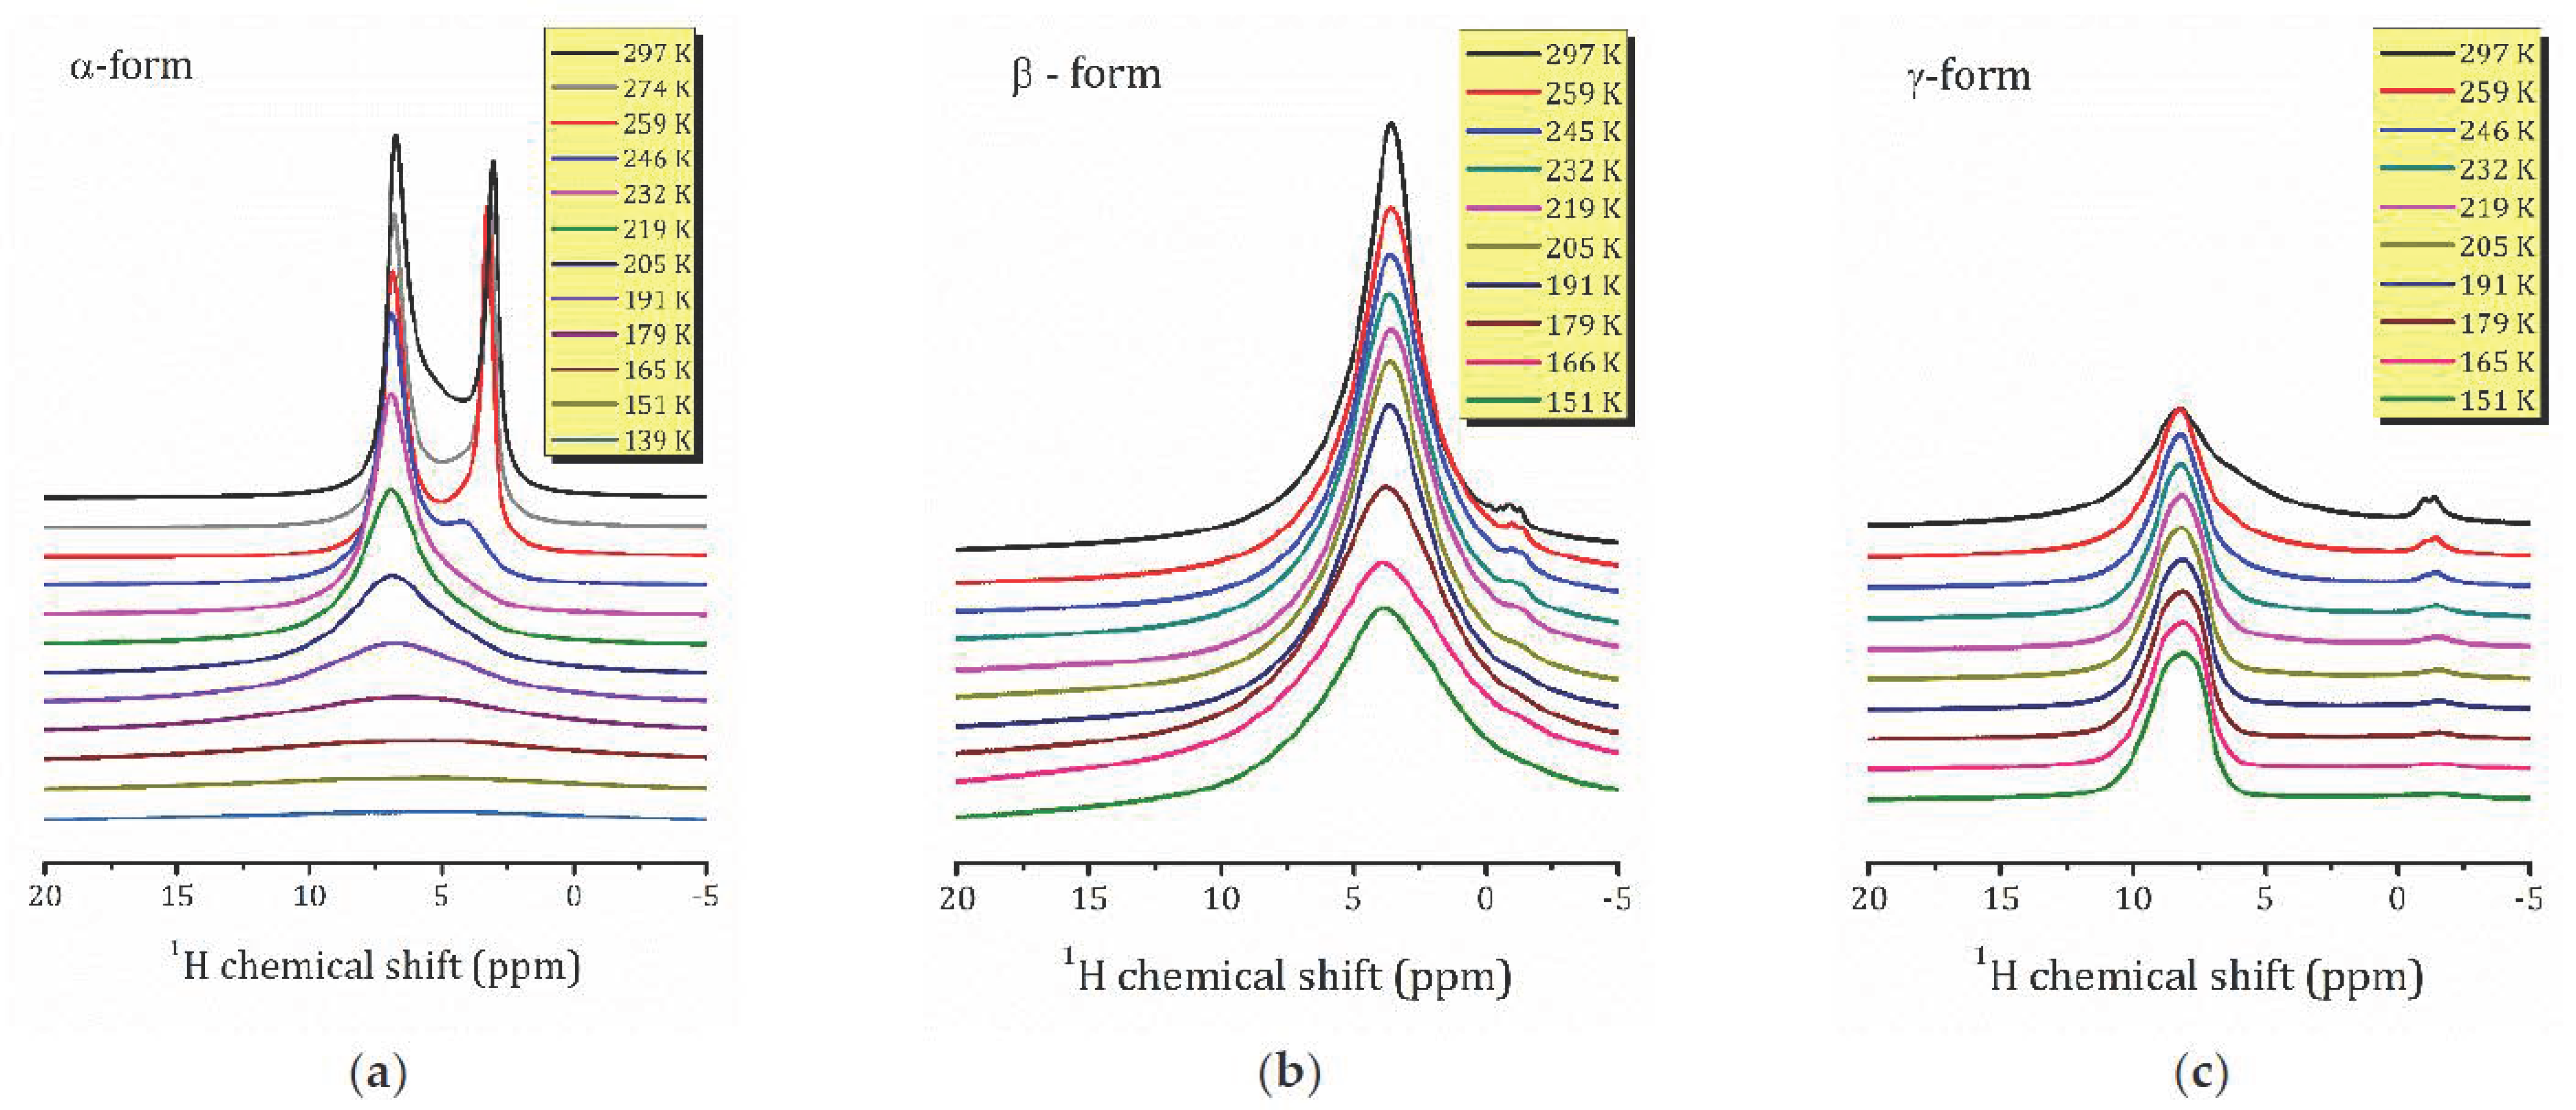
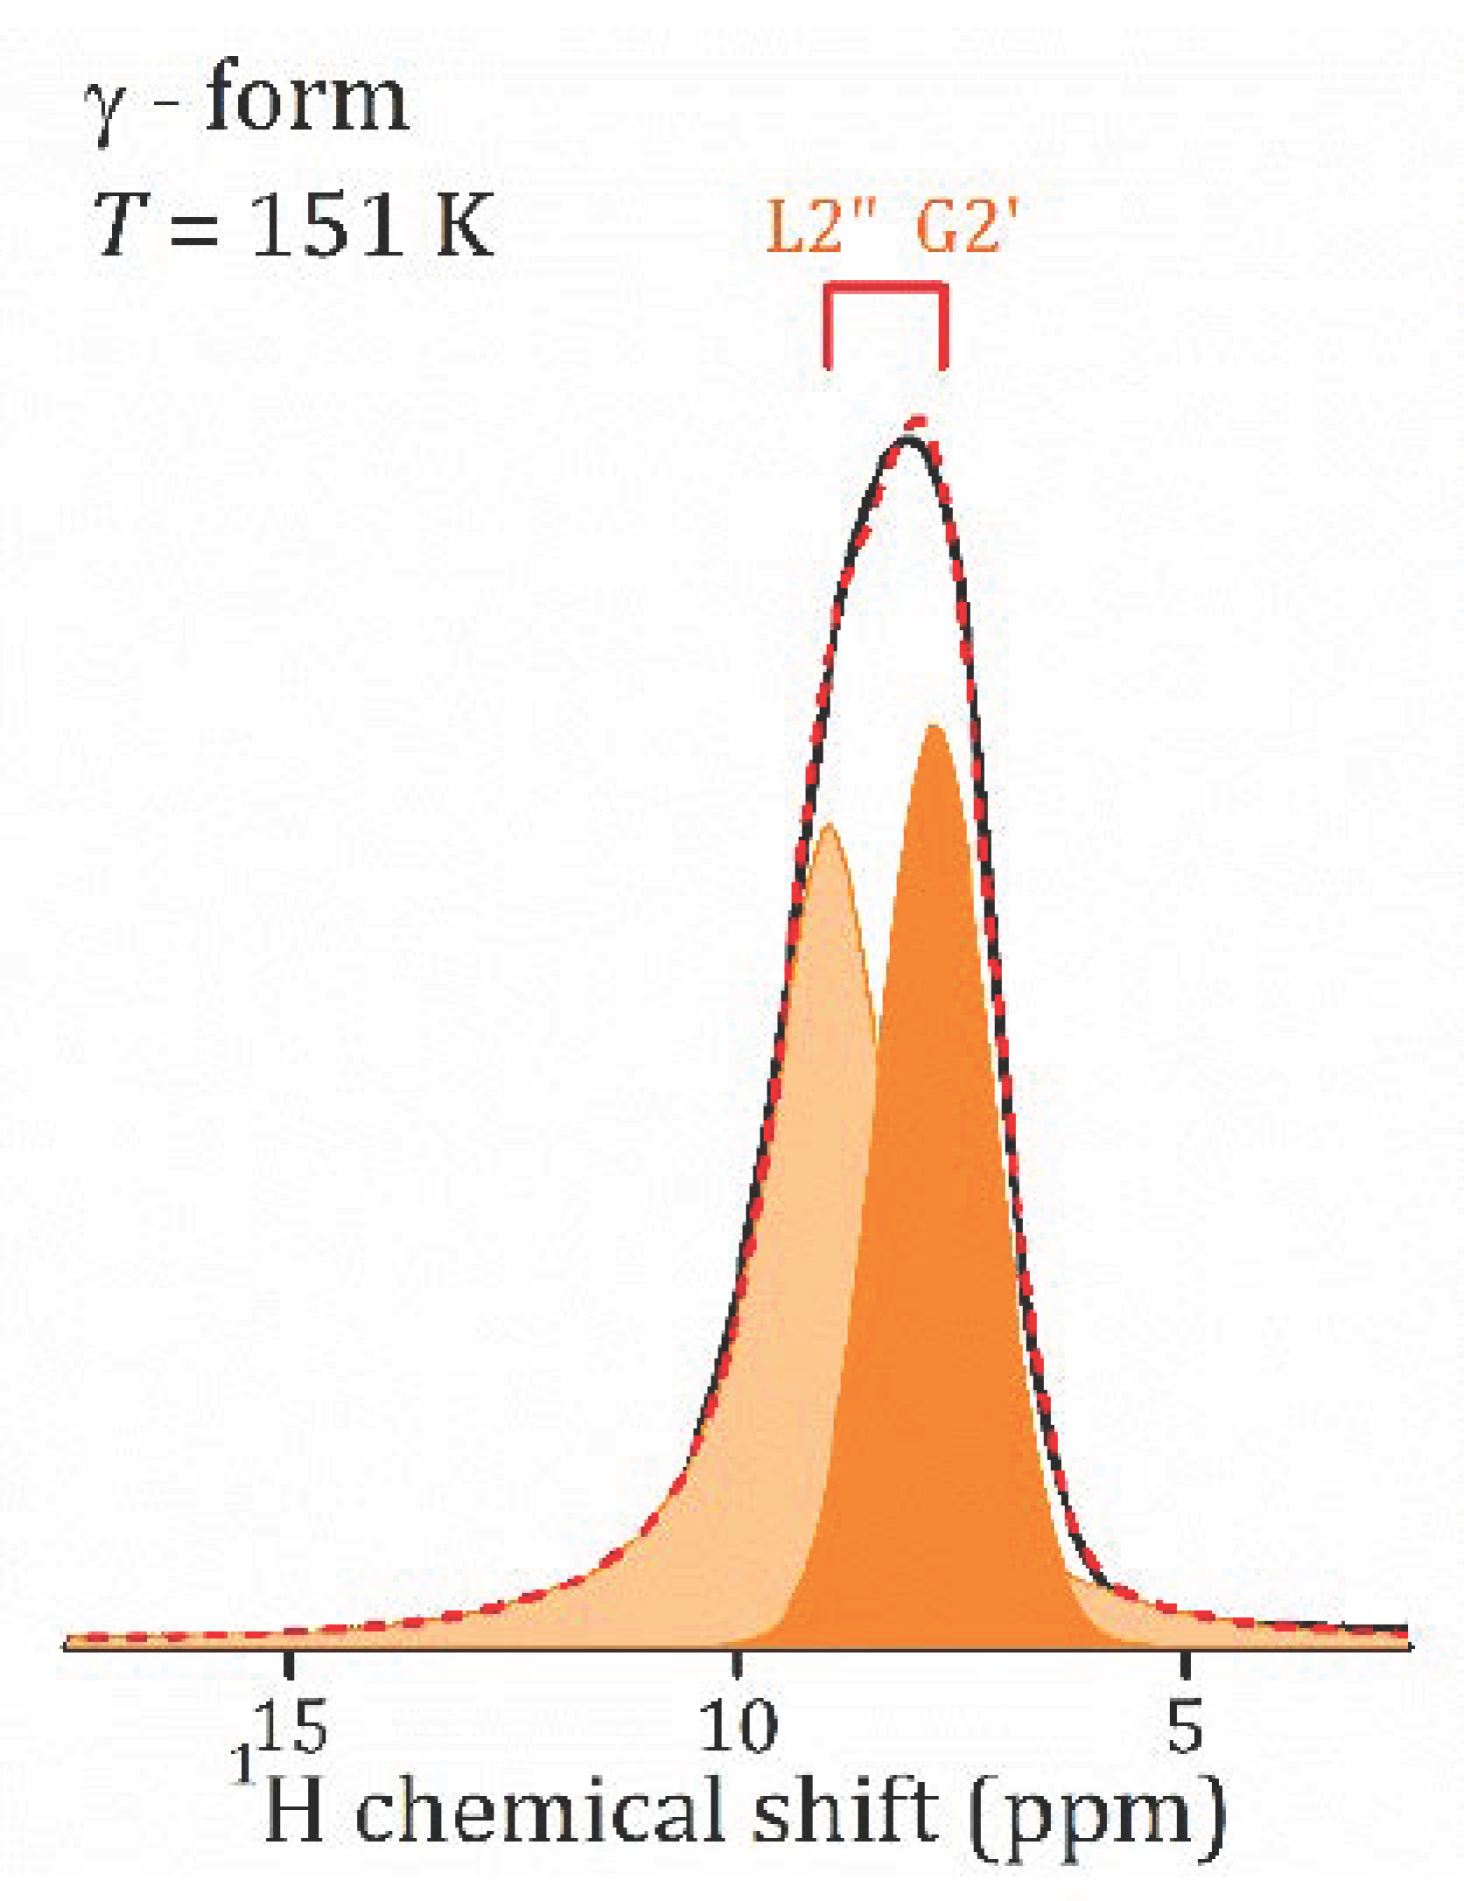
2.2. 1H MAS NMR Study

Figure 3 shows the 1H MAS NMR spectra for the studied forms of HCa2Nb3O10·yH2O acquired at 259 K. As one can see, depending on the hydration level of HCa2Nb3O10·yH2O, the spectra differ from each other by the number of spectral lines, their position, and the linewidths. This shows the presence of different proton-containing species in the α-, β-, and γ-forms and their different mobilities.
At room temperature (297 K), the 1H spectrum of α-HCa2Nb3O10 (Figure 3a) consists of two narrow intense Lorentzian lines at 3.1 and 6.8 ppm, L1 and L2, respectively, and two lines of lower intensities: Lorentzian line L3 at about 4.1 ppm and Gaussian line G4 at 6.0 ppm. For β-HCa2Nb3O10 (Figure 3b), it consists of only one rather broad Lorentzian line at 3.6 ppm, whereas for γ-HCa2Nb3O10 (Figure 3c), the main signal is observed at 8.2 ppm (L2), with a shoulder at 5.9 ppm (L1) (a signal at about −2 ppm can be associated with surface defects and is not discussed further).
To assign the spectral lines to the H-containing species, the evolution of the proton spectra with the temperature decreasing was studied; see Figure 4. As temperature decreases, the spectral lines broaden, and a redistribution of line intensities occurs. Let us first discuss the temperature evolution of the 1H MAS NMR spectrum of γ-form, HCa2Nb3O10·0.1H2O, which is characterized by the lowest water content. At room temperature, the contribution of the L2 line dominates, the relative intensity of L1 is of about 10%, and with sample cooling the line broadens and then disappears. Below 259 K, only the L2 line presents, and with the temperature further decreasing it splits into two lines: Lorentzian type at 8.9 ppm and Gaussian type at 7.8 ppm; see Figure 5. The temperature evolution of the spectral line parameters, namely the isotropic chemical shift (δiso), the full width at half maximum (Δν1/2), and the relative integral intensities are shown in Figure 6a–c, respectively.
Based on the TG analysis, one can attribute L1 line to the bulk water. Normally its signal is expected at 5.5 ppm [22], but in a charged nanoconfinement it can be shifted towards a higher frequency. Its contribution is low with the temperature decreasing because of the slowing down of the molecular motion; thus, the line becomes too broad to be resolved. The most intensive line, L2, at about 8 ppm can be associated with the lattice protons in regular sites; e.g., in Ruddlesden–Popper phase H2La2Ti3O10·0.13H2O, the signal of isolated H+ was reported at 11–13 ppm [13,37]. The splitting of the line at low temperatures may point to two inequivalent cation positions. It is worth noting that down to 151 K, the linewidth of the spectral lines is almost unchanged. This indicates that within the studied temperature range, the proton mobility (translational diffusion) does not change significantly.
The 1H spectra of α-HCa2Nb3O10 exhibits the most dramatic changes with temperature: the high field part of the spectrum rapidly disappears with cooling; see Figure 4a. The temperature changes of the spectral parameters are plotted in Figure 6a. As one can see, with the temperature decreasing, the intensities of the spectral lines L1 and G1 rapidly drop, and after cooling down below 245 K, only L2 and L3 remain. Below 200 K, only the L2 peak is visible. Such a complex temperature behavior of the 1H MAS NMR spectrum of the α-form, as well as its structure, reflect (i) the variety of types of interlayer proton-containing species due to the high content of intercalated water in comparison with the other studied forms, and (ii) the non-obvious mechanisms of interaction between them in a charged environment. Interestingly, in α-form there is no signal associated with isolated protons. Moreover, despite a rather high water content, the only signal that can be associated with the bulk water, the line G4 at 6.1 ppm, has a very low intensity and, similar to the γ-form, rapidly disappears with cooling. Altogether, this suggests the presence of charged water complexed like H+xH2O.
According to Ref. [43], the 1H chemical shift of H3O+ (x = 1), calculated for water solutions of mineral acids, is expected at 13.3 ppm. With x increasing, the 1H chemical shift decreases, e.g., for H+2H2O it was predicted at 8.0 ppm. Our calculations carried out for isolated complexes give 7.3 and 4.6 (17.5) ppm for the isotropic chemical shift for free H3O+ and H5O2+ clusters, respectively (the number in parenthesis corresponds to the central proton). These calculations are supported by several experimental studies of hydrated layered oxides, in which the signal at 8–11 ppm was assigned to the H3O+ [32,36,44,45,46]. Hence, following both theoretical and experimental studies of other complex layered oxides, and accounting that for α-form of HCa2Nb3O10·yH2O there are 1.6 H2O molecules and one interlayer proton per one formula, it can be suggested that one water molecule participates in the formation of H3O+, the signal L2 at about 7 ppm, whereas other signals correspond to water molecules that are localized in different sites of the charged interlayer space or are part of the more extended charged complexes, like H+2H2O.
The temperature behavior of the L2 linewidth, Figure 6a, is typical for solids [13,47,48] and reflects the slowing down of the molecular motion. Using the onset temperature of motional narrowing, TMN = 150 K, one can estimate the activation energy of the line narrowing process within the semi-empirical Waugh-Fedin expression [49]:
E a eV     1.61   ×   10 3   ·   T MN K .
This results in E a 0.24(2) eV.
The 1H MAS NMR spectrum of the β-form consists of one line centered at about 3.6 ppm, which almost does not shift within the studied temperature range; see Figure 5. Taking into account that, according to the TG analysis, the β-form contains 0.8 H2O molecules per formula unit, and hence per interlayer cation H+, and no signal from H3O+ or H+ is observed, one can suppose that this line is the result of an exchange between the lattice protons (an expected signal at about 8 ppm as in the γ-form) and the non-hydrogen-bounded water (an expected signal at about 0.8 ppm).

2.3. 1H T Study

To elucidate dynamic processes for all the studied compounds, the temperature dependencies of spin lattice relaxation times in the rotating frame, T were measured. Relaxation measurements are more sensitive to changes in molecule dynamics than spectroscopic ones [47,50]. For the studied systems, the NMR relaxation is issued mainly by fluctuating strengths of 1H–1H dipole coupling. The latter, being dependent on the relative position of the interacting nuclear spins, is altered by motional processes. As a result, this leads to fluctuations of the Larmor frequency. This process can be described through a correlation function, G t :
G t   =   Δ ω 0   ·   Δ ω t   =   G 0   ·   g t
where the brackets represent the ensemble average; g t contains information about dynamic processes, and its exact expression depends on the spin interaction and diffusion mechanism; G 0 is determined by the mutual nuclear spin arrangement.
Commonly, to describe relaxation processes one uses a spectral relaxation function j ω , which is a Fourier-transformed correlation function, g t . In terms of j ω , the dipole contribution to NMR spin-lattice relaxation time T 1 , a characteristic time for magnetization recovery after a perturbating pulse, can be written as follows:
1 / T 1 = G 0   ·   1 3 j ω 0   +   4 3 j 2 ω 0 ,
where ω 0 is the 1H NMR frequency. By analyzing the temperature dependence of spin lattice relaxation within an appropriate model, one can extract parameters of molecular motion, such as activation energies and correlation times. However, solids normally exhibit slower dynamics as compared to liquids. For such systems, the spin-locking technique is much more fruitful: by applying a locking field ω 1 , one can shift the minimum of the temperature dependence of the spin-lattice relaxation time towards the lower temperature in such a way that it falls within the measured temperature range [51,52,53,54,55]. More details can be found in Ref. [13]. At condition ω 1 ω 0 , the relaxation time can be written as
1 / T 1 ρ = G 0   ·   1 2 j 2 ω 1   +   5 6 j ω 0   +   1 3 j 2 ω 0 .
For HCa2Nb3O10·yH2O, the upper limit of temperature is restricted by the water desorption, which according to the TG analysis (Figure 2a) occurs at T > 300 K. Application of the spin-locking technique helps to determine the spin motion parameters in a more accurate way.
The relaxation times T for the studied forms of HCa2Nb3O10·yH2O plotted versus inverse temperature are shown in Figure 7a–c. It should be noted that for all the studied forms within the experimental temperature range, the magnetization recovery is mainly described by a two-exponential function, with characteristic spin-lattice relaxation times T’, T’’ differing from each other in one order of magnitude, except α-form, in which a mono-exponential behavior was observed above 200 K. Examples of the magnetization recovery curves (mono and two-exponential) are shown in Figure 8.
As it is clearly seen from Figure 7, depending on the hydration level, HCa2Nb3O10·yH2O demonstrates rather different T(1/T) behaviors. Let us first discuss the γ-form. The temperature dependence of T for the least hydrated form of HCa2Nb3O10·yH2O exhibits features similar to H1.83K0.17La2Ti3O10·0.17H2O [13]. However, it should be noted that the applied locking field was not sufficient to displace the minimum in the middle of the studied temperature range. This complicates the analysis of the experimental data, but the higher pulse power would heat the system excessively.
To determine the proton motion parameters, we used the Kohlrausch-Williams-Watts (KWW) model [56,57,58] successfully applied to H1.83K0.17La2Ti3O10·0.17H2O [13]. Commonly, the relaxation in isotropic systems like liquids is described by the well-known Bloembergen-Purcell-Pound (BPP) model [59], which supposes that the exponential function g t is as follows:
g t   =   e t / τ c
and that the correlation time τ c obeys the Arrhenius law: τ c = τ 0 exp E a k B T . Here E a is the activation energy of hydrogen motion, k B is the Boltzmann constant, and τ 0 is a pre-exponential factor. The function in Equation (7) results in the following form of the spectral density:
j ω   =   2 τ c 1 + ω τ c 2 .
This model can be applied to solids, e.g., to describe the translational motion of hydrogen in metallic lattice, but requires some corrections to account for activation energy distribution [47,48], contribution of conduction electrons [60,61,62], and an exchange between different fractions [48,61,63].
In anisotropic systems, such as ionic conductors, the T1(1/T) dependence is asymmetric, and a stretched exponential KWW correlation function g t   =   e t / τ s β is more appropriate for its description. This means that the motion is correlated. These cooperative effects, similar to conduction electrons, contribute mainly at low temperatures, and the corresponding slope is reduced by β [55,56,57,58,64]. The spectral density function in this case can be written as
j ω   =   2 τ c 1 + ω τ c 1 + β ,
with the stretching exponent β ranging from 0 to 1.
As was mentioned above, due to the system limitations for the γ-form of HCa2Nb3O10·yH2O, one cannot observe the high temperature slope of the T(1/T) (Figure 7c), and hence one cannot determine correctly the stretching exponent. That is why to estimate the activation energy we used the parameter β = 0.28, as determined for H1.83K0.17La2Ti3O10·0.17H2O [13].
As seen from Figure 7c, the fast (T′) and slow (T″) components of T exhibit very similar temperature dependencies. Moreover, within the studied temperature range, their contributions are almost tantamount. The fitting within the KWW model results in the very close values of E a and τ 0 : { E a = 0.223 2 eV, τ 0 = 8.8 5   ×   10 10 s} and { E a = 0.213 4 eV, τ 0 = 7.8 3   ×   10 10 s} for the slow and fast components, respectively. Accounting for the 1H MAS NMR data, one can suggest that these lines correspond to the isolated interlayer H+ ions or those in the vicinity of the water molecules.
For the most hydrated α-form above 200 K, the magnetization recovery is described by a single exponent, and the relaxation time T rapidly decreases with temperature decreasing; see Figure 7a. However, as was mentioned above, below 200 K the character of the magnetization recovery changes, and a second exponent with a longer relaxation time appears. With further temperature decreases, the values of the both short (T′) and slow (T″) components do not change much; nevertheless, the contribution of the T″ component becomes more important and achieves about 44% at 145 K; see Figure 7d. It should be noted that, according to 1H MAS NMR spectra (Figure 5a), below 200 K there is only one spectral line at about 7 ppm. Such temperature dependencies of the both relaxation times and spectral parameters implicitly show the changes in dynamics of proton-containing species at 200 K. To estimate parameters of the proton motion in α-form, we applied the abovementioned KWW model to the high temperature branch of the T′(1/T). This results in the parameters E a = 0.210 2 eV, τ 0 = 9.0 1   ×   10 12 s, which can be associated with the translational motion of H3O+. Although above 200 K the magnetization recovery curve is described by a single exponential decay, 1H MAS NMR spectra exhibit the existence of different hydrogen-containing species in α-HCa2Nb3O10·yH2O (H3O+, H2O and other); see Figure 6a. This suggests a fast exchange between the species involved in the translational motion. Below 200 K, with the slowing down of the translation, other types of motion (e.g., reorientation) became more important.
The relaxation times for the β-form of HCa2Nb3O10·yH2O, Figure 7b, show a complex temperature dependence: within the studied temperature range there are at least two characteristic points (224 and 176 K) at which the proton dynamics change. These changes can also be observed in the temperature dependence of the proton linewidth, but they are less significant.
Therefore, the state of protons and water molecules located in the interlayer space, as well as their dynamics, are determined by the level of hydration. It is noteworthy that the formation of H3O+ is confirmed for the most hydrated α-form only, in which it is quite mobile even at low temperatures. For the γ-form, water molecules are not involved in the formation of hydronium ions; protons, behaving as lattice cations, can occupy at least two nonequivalent positions and participate in translational motion. The β-form is the most mysterious. The isotropic chemical shift of only the 1H spectral line indicates an exchange between different species, but it is not possible to unambiguously identify these species from the data obtained. The presence of two characteristic points on the temperature dependence of the proton relaxation time indicates that the mechanism of this exchange is temperature-dependent.

3. Materials and Methods

KCa2Nb3O10, a precursor for further synthesis of the protonic form, was synthesized by the standard ceramic method at normal conditions (air atmosphere and pressure) using CaO, Nb2O5, and K2CO3 as parent materials. CaO and Nb2O5 were taken in amounts to satisfy the stoichiometry of the reaction:
4 CaO   + 3 Nb 2 O 5 +   K 2 CO 3 = 2 KCa 2 Nb 3 O 10 +   CO 2   .
To compensate for losses during calcination, potassium carbonate was taken with a 30% excess. All the components were mixed and ground in a planetary ball mill in n-heptane. The obtained powder was pelletized and then calcined at 800 °C for 12 h. After that, it was ground in an agate mortar, pelletized again, and calcined at 1100 °C for 24 h.
The first hydrated protonated form of KCa2Nb3O10, named as α-form of HCa2Nb3O10·yH2O, was prepared by acid processing of KCa2Nb3O10, with an excess of 12 M HNO3 (50 mL per 2.5 g of the oxide), at room temperature for 24 h. The product was centrifuged, washed with 50 mL of water three times to remove acid residues, and dried over CaO for 24 h. Subsequently, it was stored in a humid air atmosphere.
The second hydrated protonated form of KCa2Nb3O10, named as β-form of HCa2Nb3O10·yH2O, was prepared by hydrothermal treatment of the α- form. For this, 0.5 g of the latter was placed in the laboratory autoclave with 35 mL of water (volume filling approximately 80%) and processed at 150 °C for 7 d. The product obtained was centrifuged and dried over CaO for 24 h.
To obtain the dehydrated protonated form of KCa2Nb3O10, named as γ-form of HCa2Nb3O10·yH2O, the α-form was dried in a desiccator with a vacuum pump (about 1 × 10⁻⁴ atm) for 24 h.
Powder XRD analysis was done on a Rigaku Miniflex II diffractometer using monochromatic CuKα radiation (λ = 0.154056 nm). Diffractograms were recorded in the 2θ range of 3–120° (step width 0.02°). The lattice parameters were calculated in the tetragonal system on the basis of all the reflections observed using DiffracPlus Topas 4.2 software.
TG analysis was carried out using a Netzsch TG 209 F1 Libra thermobalance. Analysis of samples was carried out in the temperature range 30–900 °C at a heating rate of 10 °C/min in an argon stream at a rate of 90 mL/min.
1H NMR experiments were done using a Bruker Avance IIITM 400 MHz solid-state NMR spectrometer (operating with Topspin version 3.2) using a double-resonance 4 mm low-temperature MAS probe. The temperature was changed within a temperature range of 139 to 297 K and controlled with an accuracy of 0.5 K. 1H NMR MAS spectra were recorded at rotor frequency 12 kHz. To measure T1 relaxation times, the spin-locking technique was applied, with the rf frequency of the locking pulse equal to 40 kHz. Tetramethylsilane (TMS) was used as an external standard.
The 1H magnetic shielding tensor for H2O, H3O+, and H5O2+ was calculated using the Gauge-Independent Atomic Orbital (GIAO) method [65] for the geometries optimized at the B3LYP/6-311G level of theory, as implemented in Gaussian 09 [66]. The theoretical isotropic chemical shift was estimated relative to the magnetic shielding tensor in TMS, calculated at the same level of theory.

4. Conclusions

The results of a comprehensive 1H NMR study of three different forms of the layered perovskite-like niobate HCa2Nb3O10·yH2O can be summarized as follows:
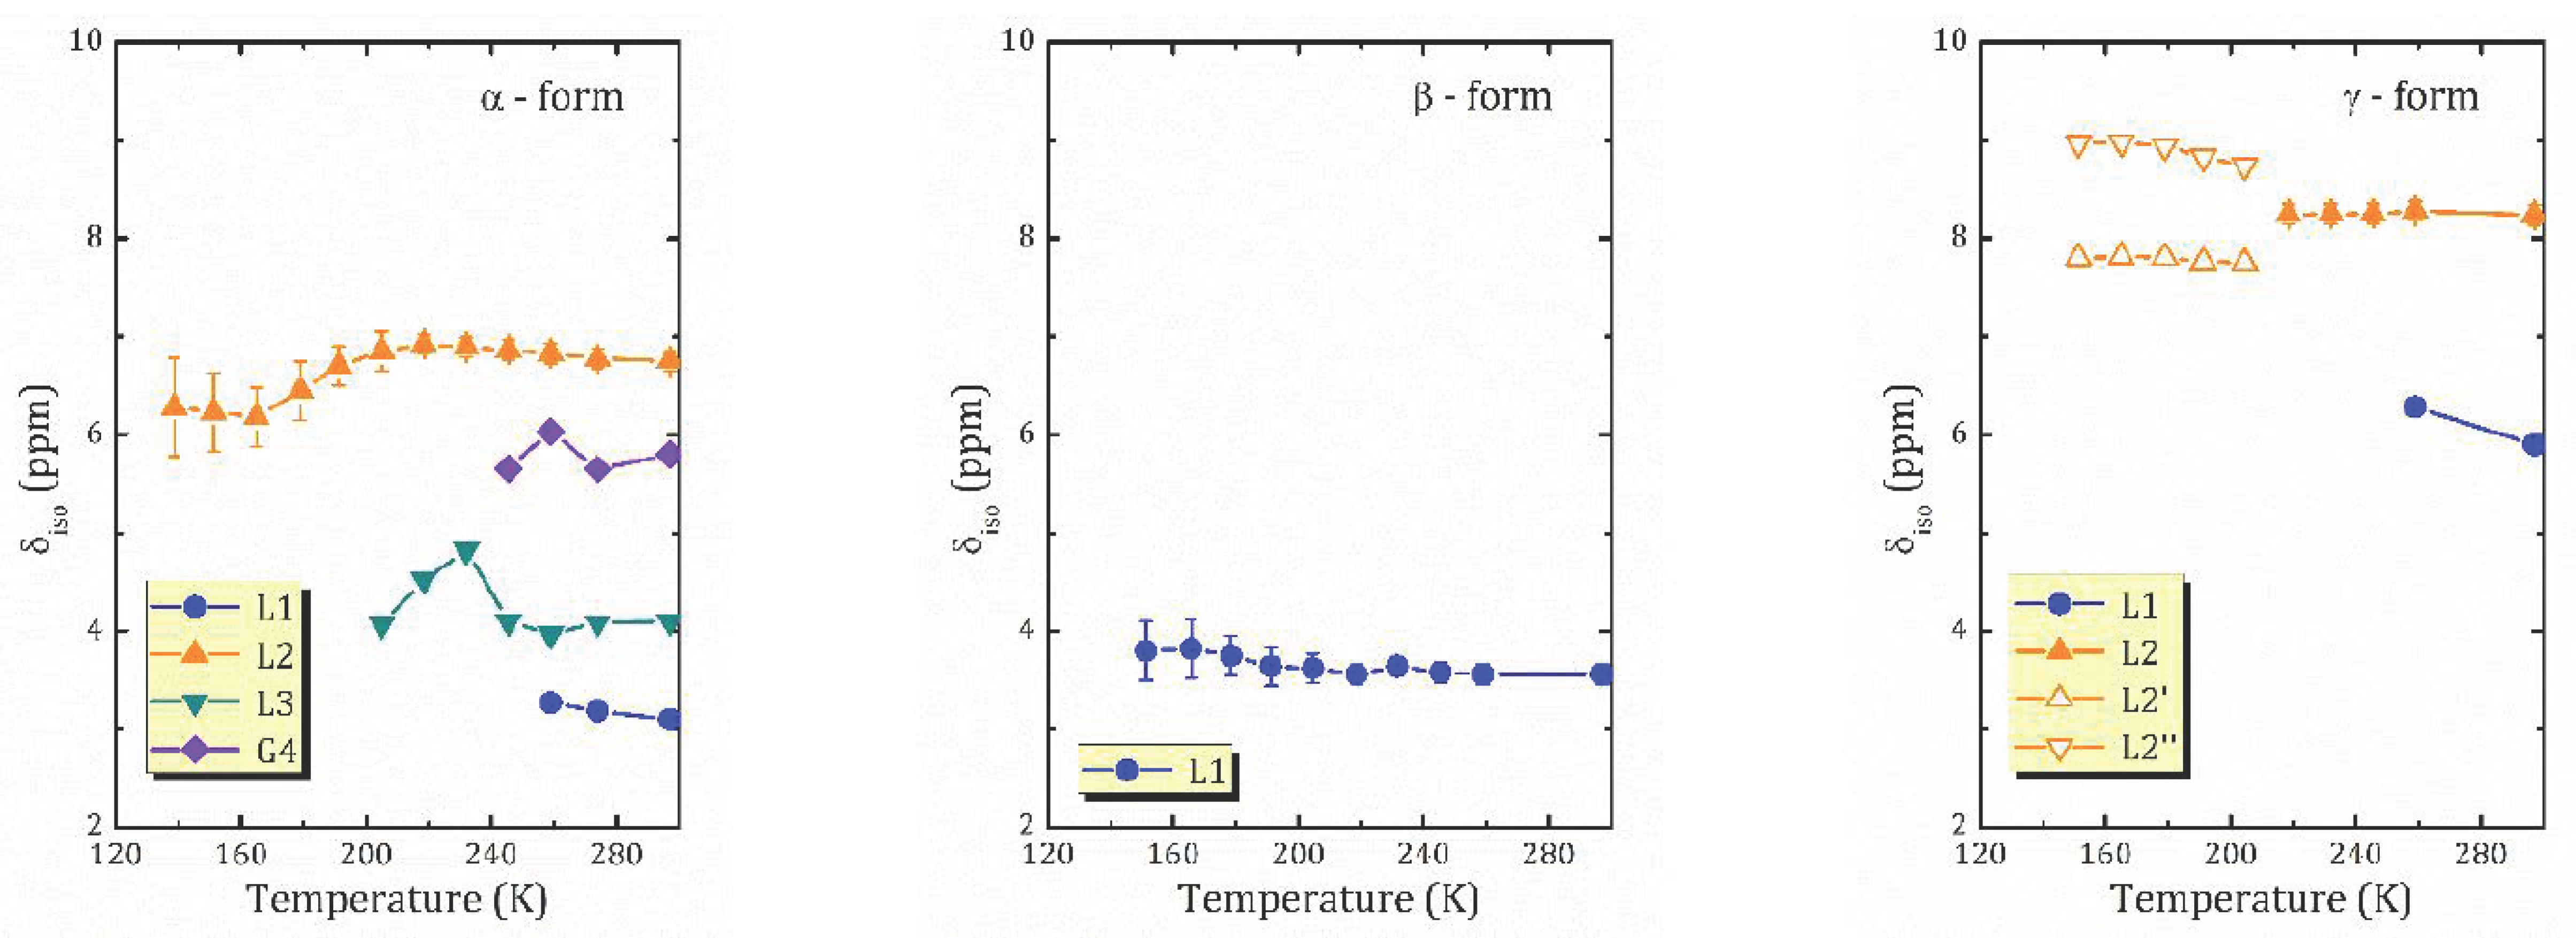
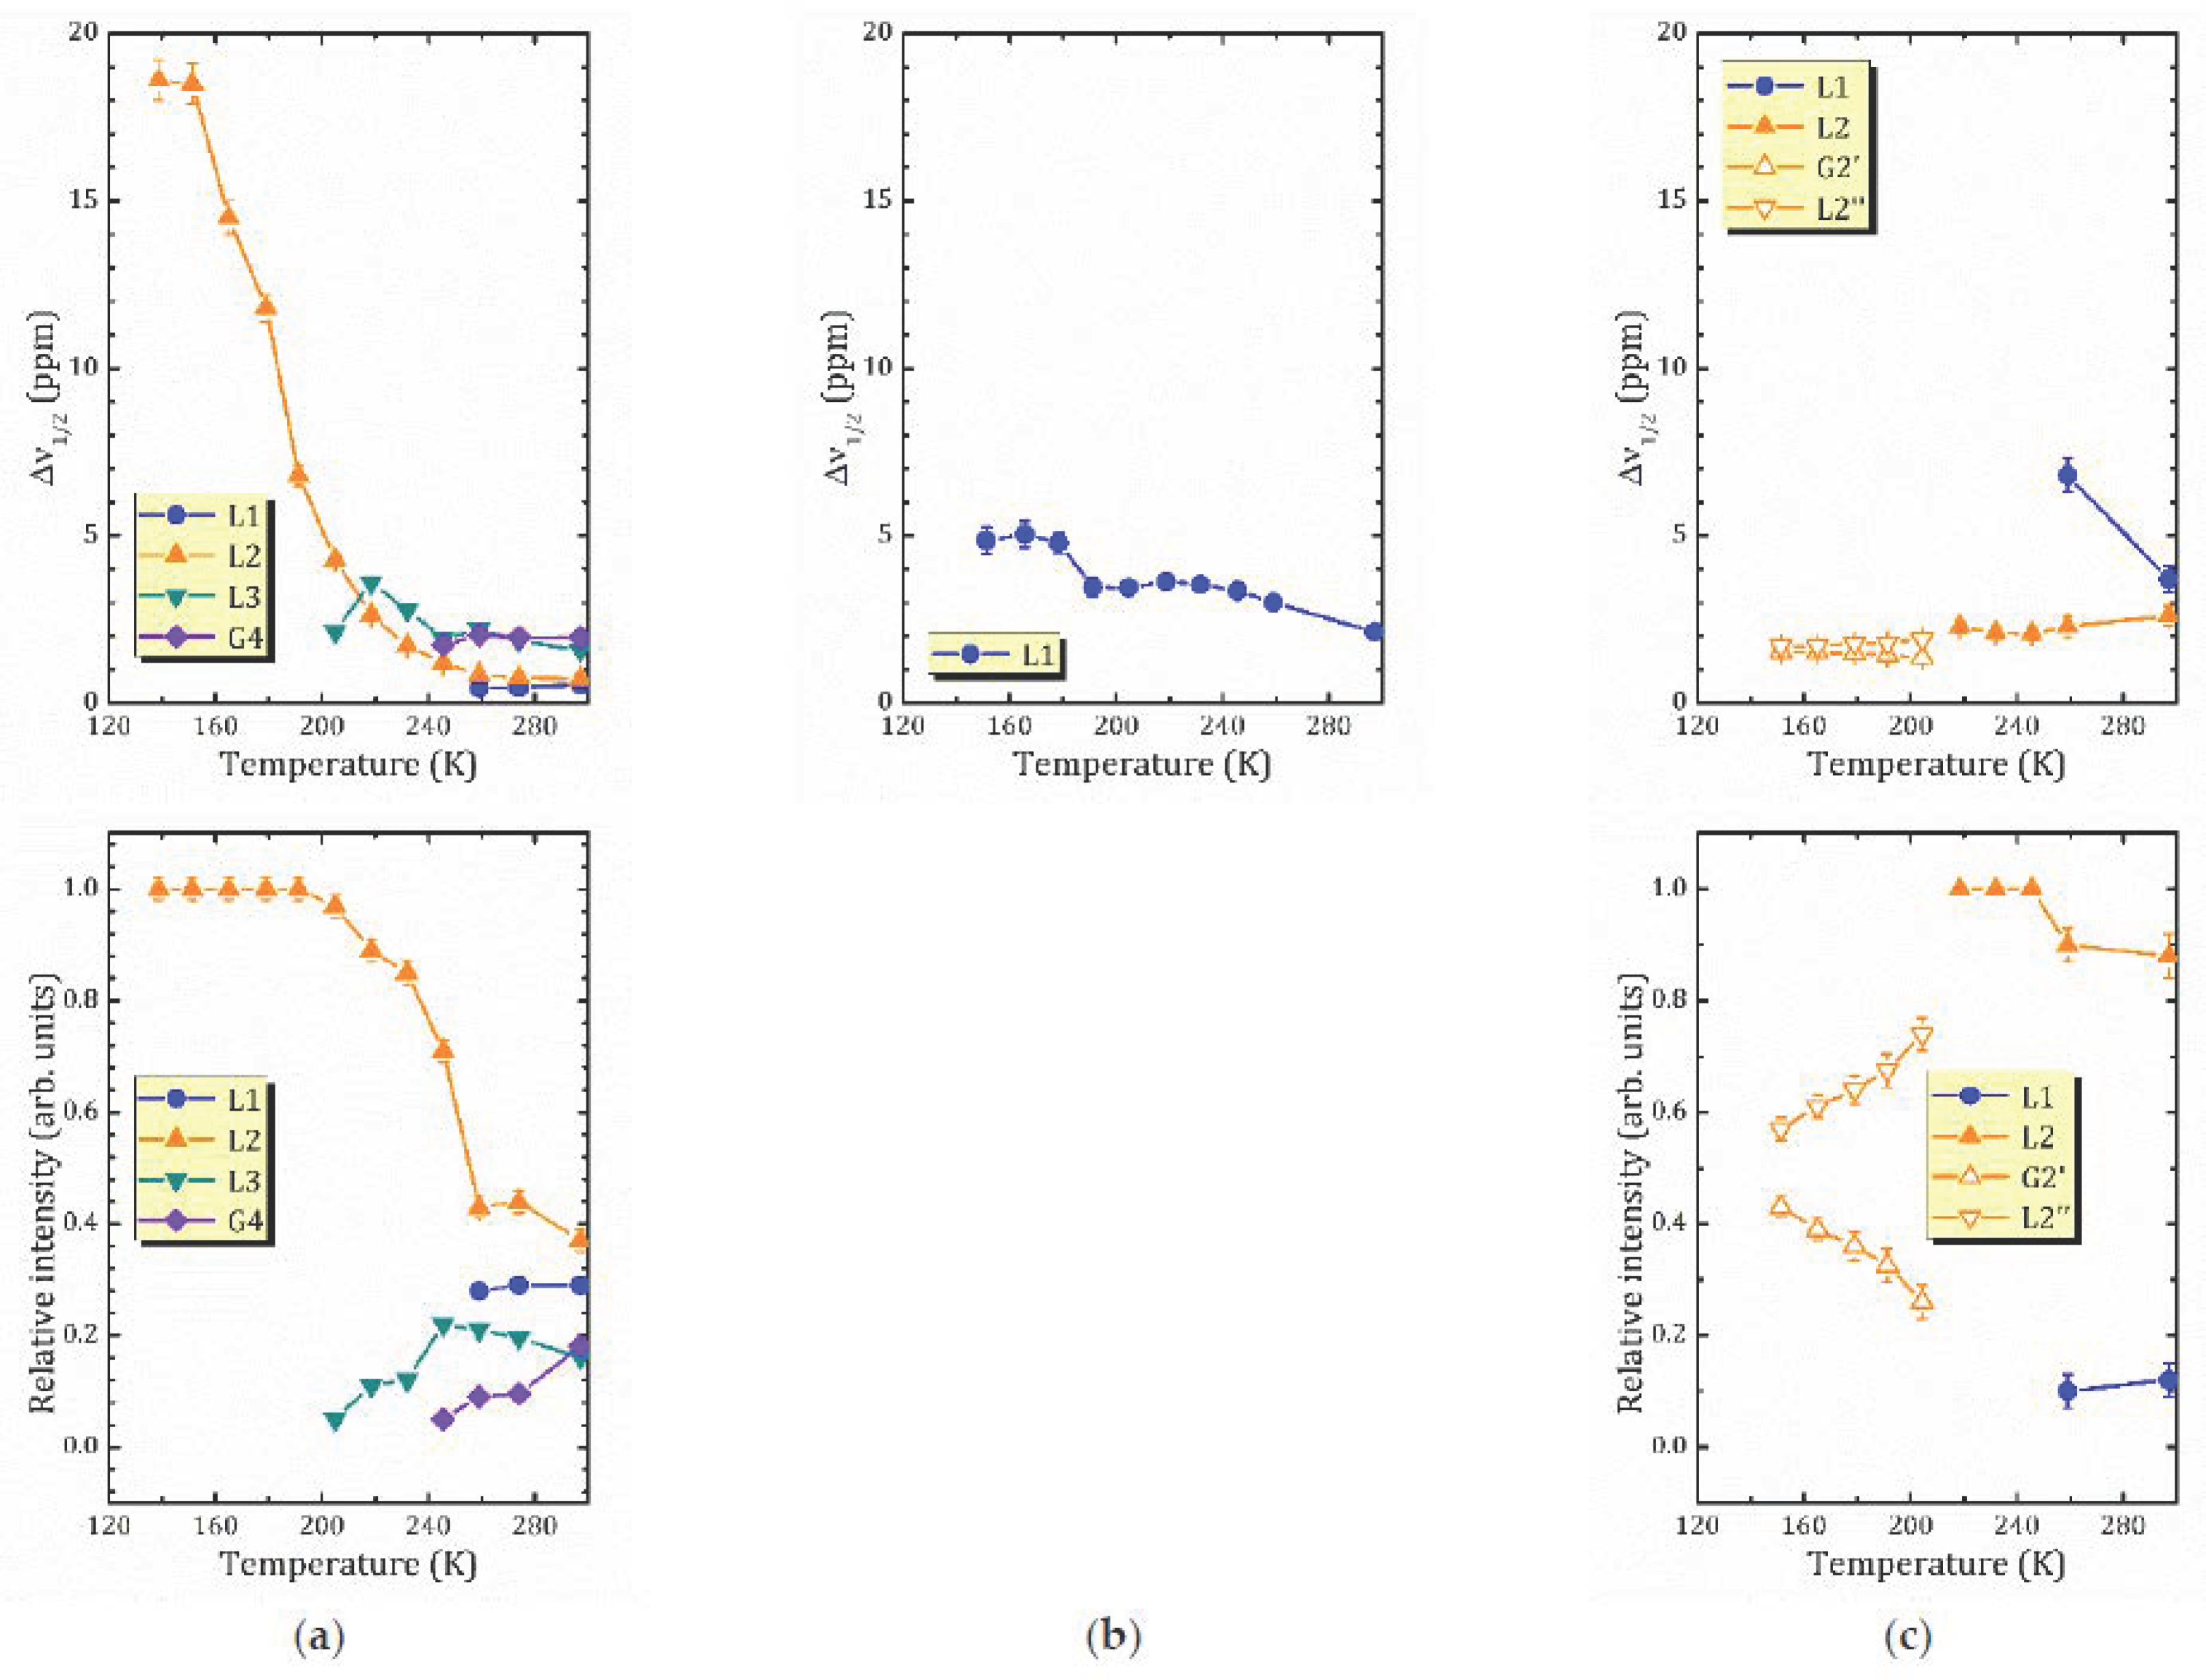
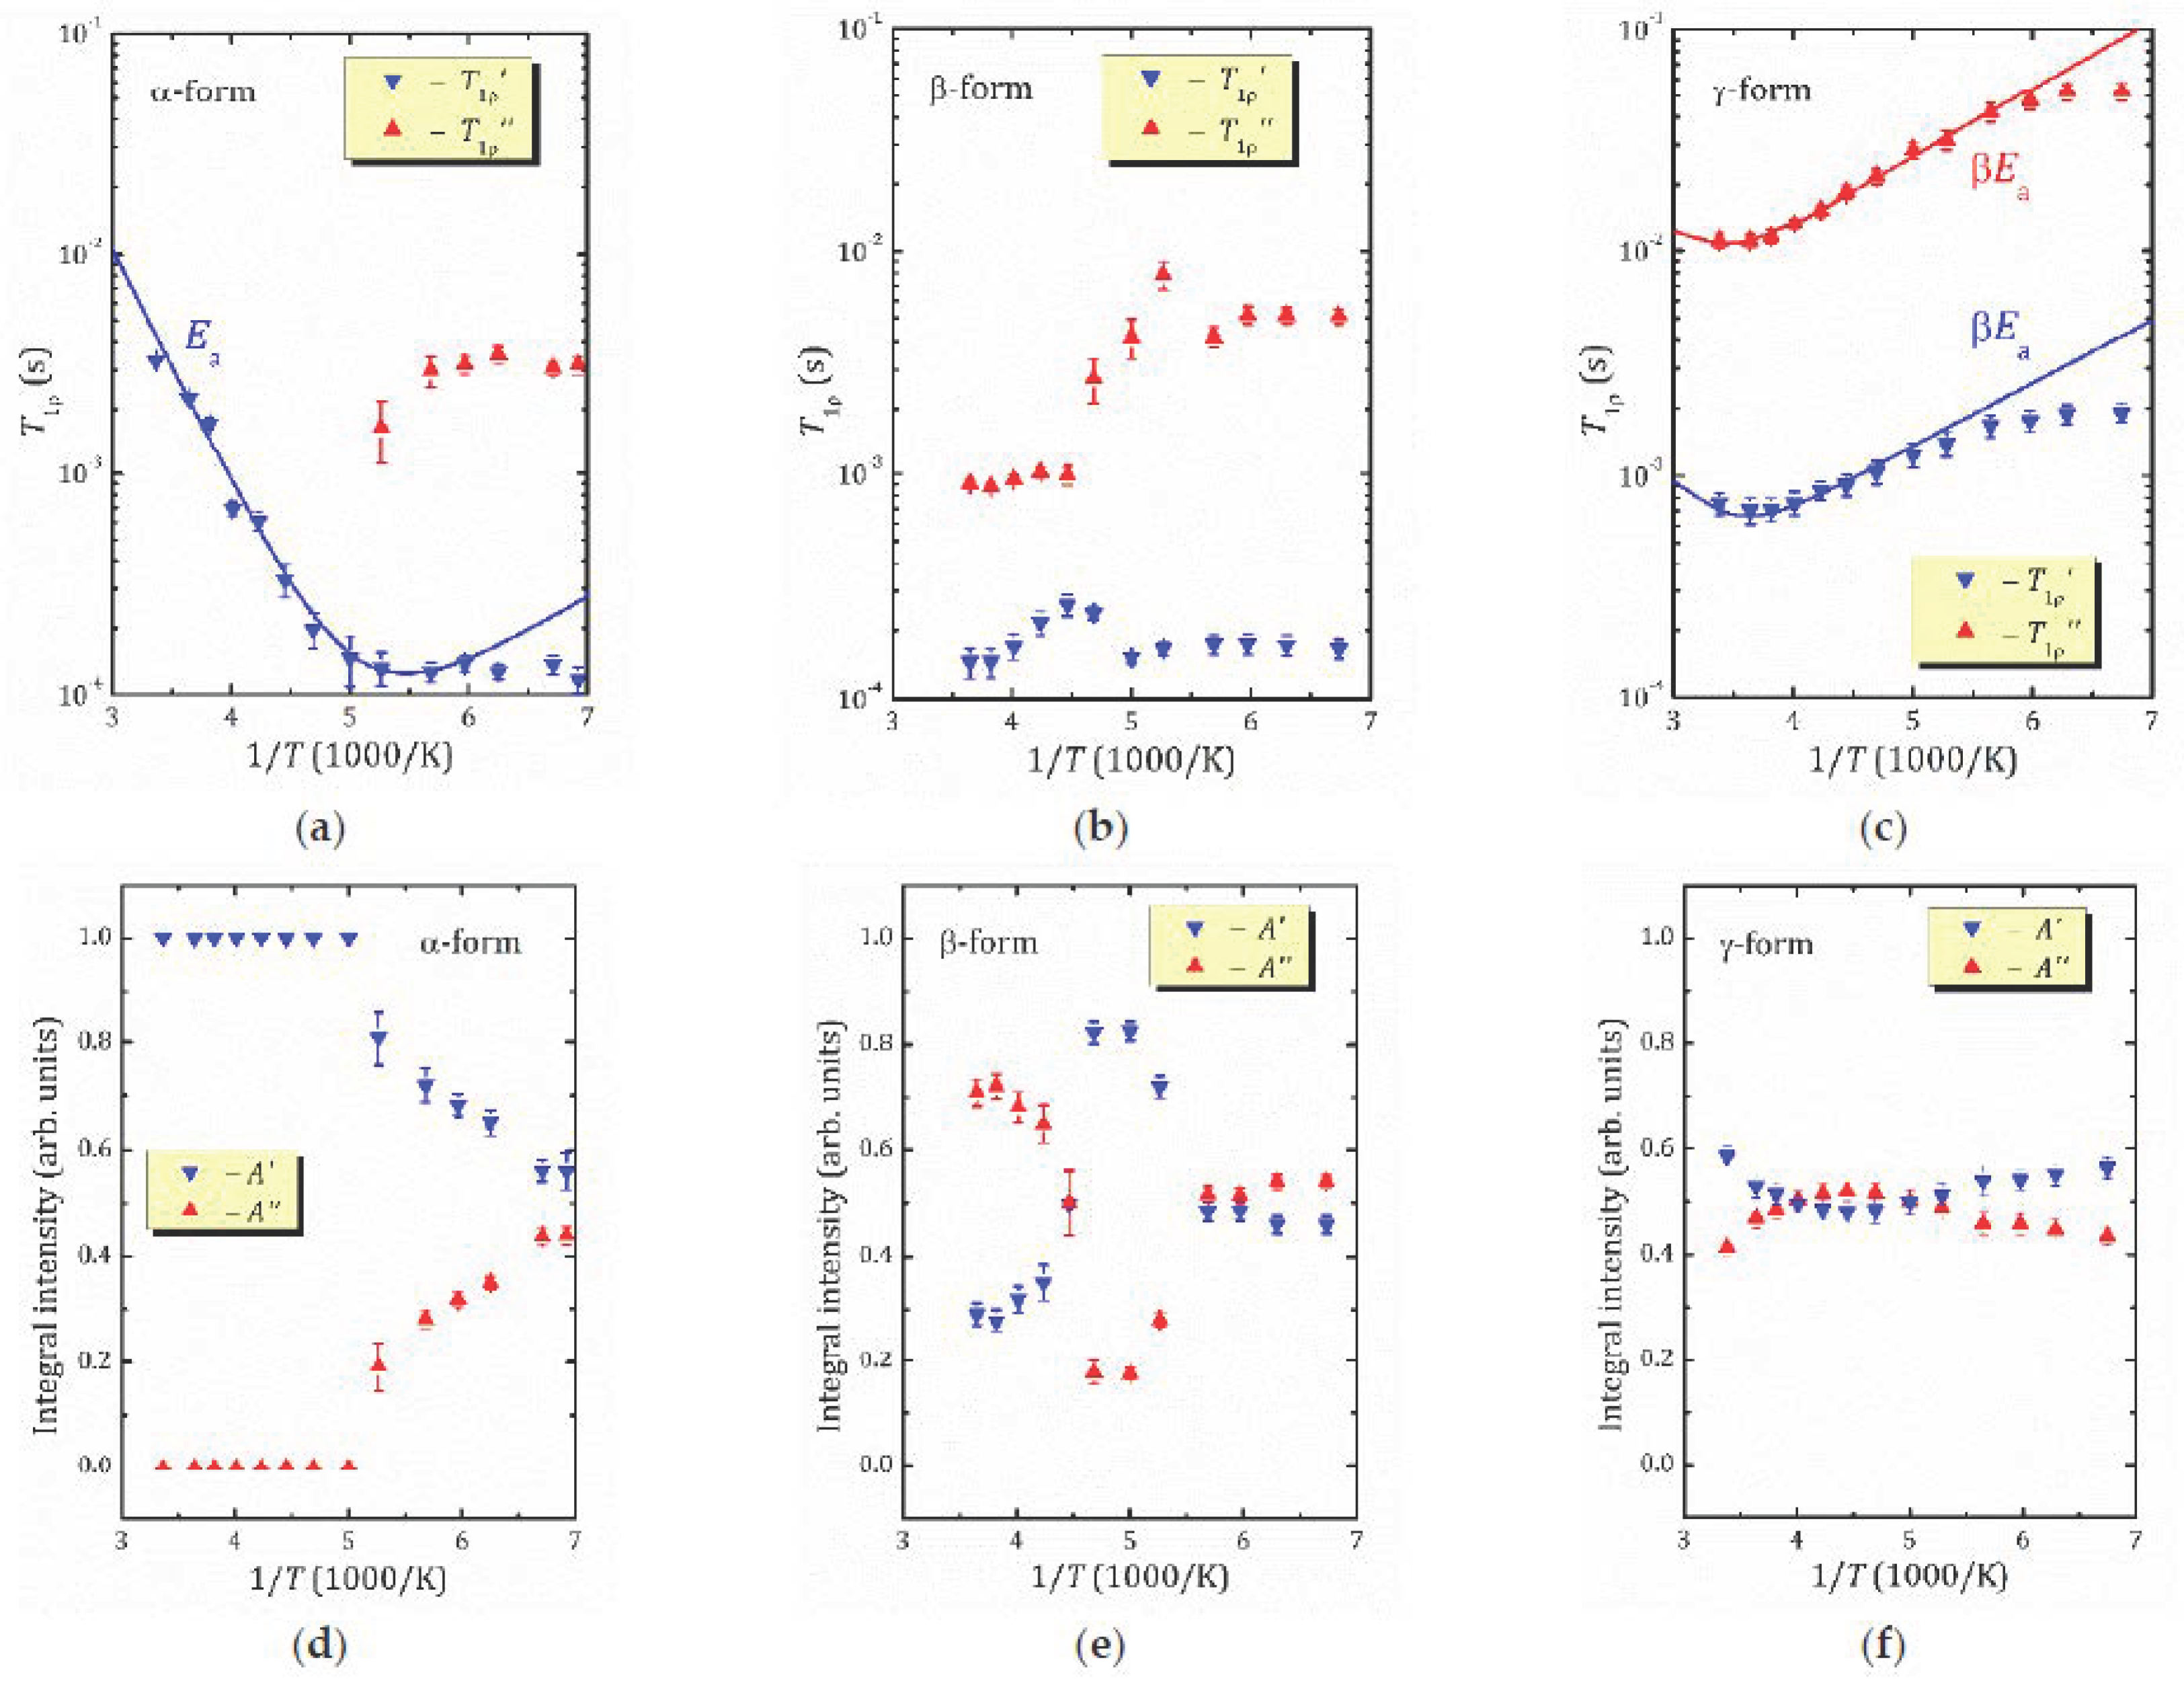
  • For the most hydrated α-form, HCa2Nb3O10·1.6H2O, 1H MAS NMR spectra reveal the presence of different proton-containing species: H3O+, which comprises all the lattice protons (there is no signal that can be associated with H+ in regular sites), and water molecules that are localized in different sites of the interlayer slab and supposedly participate in the formation of charged complexes like H+2H2O. With the temperature decreasing, the signal from the water proton is so broad that it is undetectable; the only detectable signal is from H3O+. The activation energy determined from the onset temperature of motional narrowing of 0.24(2) eV is in fair agreement with the relaxation data. Application of the KWW model with the stretching exponent β = 0.28 to the T(1/T) experimental dependence results in the following molecular motion parameters, which can be associated with the translational diffusion of H3O+: E a = 0.210 2 eV, τ 0 = 9.0 1   ×   10 12 s. Below 200 K, with the slowing down of the translational motion, other types of motion, such as reorientation, became more important.
  • 1H MAS NMR spectrum of the β-form, HCa2Nb3O10·0.8H2O, within the studied temperature range consists of one line centered at about 3.6 ppm, which is the result of an exchange between lattice protons and the non-hydrogen-bounded water protons. The temperature dependence of the relaxation time evidences the presence of two characteristic points (224 and 176 K), at which proton dynamics changes.
  • The proton NMR spectroscopy study of the γ-form, HCa2Nb3O10·0.1H2O, which is characterized by the lowest water content, reveals the presence of bulk water and interlayer H+ in two inequivalent positions. The temperature dependencies of the spin-lattice relaxation time in the rotating frame treated withing the KWW model with β = 0.28 results in the following parameters of the proton motion: E a = 0.217 8 eV, τ 0 = 8.2 9   ×   10 10 s.
We expect that the results obtained will clarify the relationship between the hydration level (and hence the type and, possibly, localization of hydrogen-containing species) and the photocatalytic activity of this class of layered materials. Currently, studies of the photocatalytic activity of the different forms of HCa2Nb3O10·yH2O are under evaluation.

Author Contributions

Conceptualization, M.G.S., O.I.S. and I.A.Z.; methodology, M.G.S. and O.I.S.; investigation, D.Y.N., A.O.A., O.I.S., S.A.K. and A.M.; data curation, M.G.S., O.I.S. and E.A.A.; writing—original draft preparation, M.G.S., O.I.S. and E.A.A.; writing—review and editing, M.G.S., O.I.S. and I.A.Z.; visualization, M.G.S. and E.A.A.; supervision, I.A.Z.; funding acquisition, M.G.S., O.I.S. and I.A.Z. All authors have read and agreed to the published version of the manuscript.

Funding

The study was financially supported by Russian Science Foundation (NMR study of hydrated forms was carried out within the framework of the project No. 19-13-00184, synthesis of a number of hydrated compounds, and their basic characterization was carried out within the framework of the project No. 20-73-00027).

Institutional Review Board Statement

Not applicable.

Informed Consent Statement

Not applicable.

Data Availability Statement

The data presented in this study are available on request from the corresponding author.

Acknowledgments

The samples were studied at the Research Park of Saint Petersburg State University, Centre for X-ray Diffraction Studies, Centre of Thermal Analysis and Calorimetry and Interdisciplinary Resource Centre for Nanotechnology, and Centre for Diagnostics of Functional Materials for Medicine, Pharmacology and Nanoelectronics.

Conflicts of Interest

The authors declare no conflict of interest.

Sample Availability

Samples of the compounds are not available from the authors.

References

  1. Liu, Y.; Mao, Z.-Q. Unconventional superconductivity in Sr2RuO4. Phys. C Supercond. Its Appl. 2015, 514, 339–353. [Google Scholar] [CrossRef] [Green Version]
  2. Ogino, H.; Sato, S.; Kishio, K.; Shimoyama, J. Relationship between crystal structures and physical properties in iron arsenides with perovskite-type layers. Phys. Procedia 2012, 36, 722–726. [Google Scholar] [CrossRef] [Green Version]
  3. Moritomo, Y.; Asamitsu, A.; Kuwahara, H.; Tokura, Y. Giant magnetoresistance of manganese oxides with a layered perovskite structure. Nature 1996, 380, 141–144. [Google Scholar] [CrossRef]
  4. Domen, K.; Kondo, J.N.; Hara, M.; Takata, T. Photo- and mechano-catalytic overall water splitting reactions to form hydrogen and oxygen on heterogeneous catalysts. Bull. Chem. Soc. Jpn. 2000, 73, 1307–1331. [Google Scholar] [CrossRef]
  5. Wang, X.; Maeda, K.; Thomas, A.; Takanabe, K.; Xin, G.; Carlsson, J.M.; Domen, K.; Antonietti, M. A metal-free polymeric photocatalyst for hydrogen production from water under visible light. Nat. Mater. 2009, 8, 76–80. [Google Scholar] [CrossRef]
  6. Toda, K.; Kameo, Y.; Kurita, S.; Sato, M. Crystal structure determination and ionic conductivity of layered perovskite compounds NaLnTiO4 (Ln = rare earth). J. Alloys Compd. 1996, 234, 19–25. [Google Scholar] [CrossRef]
  7. Petrov, A.A.; Melnikova, N.A.; Petrov, A.V.; Silyukov, O.I.; Murin, I.V.; Zvereva, I.A. Experimental investigation and modelling of the Na+ mobility in NaLnTiO4 (Ln = La, Nd) ceramics. Ceram. Int. 2017, 43, 10861–10865. [Google Scholar] [CrossRef]
  8. Thangadurai, V.; Shukla, A.; Gopalakrishnan, J. Proton conduction in layered perovskite oxides. Solid State Ion. 1994, 73, 9–14. [Google Scholar] [CrossRef]
  9. Kudo, A.; Miseki, Y. Heterogeneous photocatalyst materials for water splitting. Chem. Soc. Rev. 2009, 38, 253–278. [Google Scholar] [CrossRef]
  10. Rodionov, I.A.; Zvereva, I.A. Photocatalytic activity of layered perovskite-like oxides in practically valuable chemical reactions. Russ. Chem. Rev. 2016, 85, 248–279. [Google Scholar] [CrossRef]
  11. Minich, I.A.; Silyukov, O.I.; Kulish, L.D.; Zvereva, I.A. Study on thermolysis process of a new hydrated and protonated perovskite-like oxides H2K0.5Bi2.5Ti4O13·yH2O. Ceram. Int. 2019, 45, 2704–2709. [Google Scholar] [CrossRef]
  12. Silyukov, O.I.; Minich, I.A.; Zvereva, I.A. Synthesis of protonated derivatives of layered perovskite-like bismuth titanates. Glas. Phys. Chem. 2018, 44, 115–119. [Google Scholar] [CrossRef]
  13. Shelyapina, M.G.; Nefedov, D.Y.; Kostromin, A.V.; Silyukov, O.I.; Zvereva, I.A. Proton mobility in Ruddlesden–Popper phase H2La2Ti3O10 studied by 1H NMR. Ceram. Int. 2019, 45, 5788–5795. [Google Scholar] [CrossRef]
  14. Chen, Y.; Zhao, X.; Ma, H.; Ma, S.; Huang, G.; Makita, Y.; Bai, X.; Yang, X. Structure and dehydration of layered perovskite niobate with bilayer hydrates prepared by exfoliation/self-assembly process. J. Solid State Chem. 2008, 181, 1684–1694. [Google Scholar] [CrossRef]
  15. Guo, T.; Wang, L.; Evans, D.G.; Yang, W. Synthesis and photocatalytic properties of a pPolyaniline-intercalated layered protonic titanate nanocomposite with a p−n heterojunction structure. J. Phys. Chem. C 2010, 114, 4765–4772. [Google Scholar] [CrossRef]
  16. Shelyapina, M.G.; Silyukov, O.I.; Lushpinskaia, I.P.; Kurnosenko, S.A.; Mazur, A.S.; Shenderovich, I.G.; Zvereva, I.A. NMR study of intercalates and grafted organic derivatives of H2La2Ti3O10. Molecules 2020, 25, 5229. [Google Scholar] [CrossRef]
  17. Wang, Y.; Wang, C.; Wang, L.; Hao, Q.; Zhu, X.; Chen, X.; Tang, K. Preparation of interlayer surface tailored protonated double-layered perovskite H2CaTa2O7 with n-alcohols, and their photocatalytic activity. RSC Adv. 2014, 4, 4047–4054. [Google Scholar] [CrossRef]
  18. Shelyapina, M.G.; Lushpinskaya, I.P.; Kurnosenko, S.A.; Silyukov, O.I.; Zvereva, I.A. Identification of intercalates and grafted organic derivatives of H2La2Ti3O10 by multinuclear NMR. Russ. J. Gen. Chem. 2020, 90, 760–761. [Google Scholar] [CrossRef]
  19. Voytovich, V.; Kurnosenko, S.; Silyukov, O.; Rodionov, I.; Bugrov, A.; Minich, I.; Malygina, E.; Zvereva, I. Synthesis of n-alkoxy derivatives of layered perovskite-like niobate HCa2Nb3O10 and study of their photocatalytic activity for hydrogen production from an aqueous solution of methanol. Catalysts 2021, 11, 897. [Google Scholar] [CrossRef]
  20. Asai, Y.; Ariake, Y.; Saito, H.; Idota, N.; Matsukawa, K.; Nishino, T.; Sugahara, Y. Layered perovskite nanosheets bearing fluoroalkoxy groups: Their preparation and application in epoxy-based hybrids. RSC Adv. 2014, 4, 26932–26939. [Google Scholar] [CrossRef]
  21. Hojamberdiev, M.; Bekheet, M.F.; Zahedi, E.; Wagata, H.; Kamei, Y.; Yubuta, K.; Gurlo, A.; Matsushita, N.; Domen, K.; Teshima, K. New Dion-Jacobson phase three-layer perovskite CsBa2Ta3O10 and its conversion to nitrided Ba2Ta3O10 nanosheets via a nitridation-protonation-intercalation-exfoliation route for water splitt. Cryst. Growth Des. 2016, 16, 2302–2308. [Google Scholar] [CrossRef]
  22. Jacobson, A.J.; Lewandowski, J.T.; Johnson, J.W. Ion exchange of the layered perovskite KCa2Nb3O10 by protons. J. Less Common Met. 1986, 116, 137–146. [Google Scholar] [CrossRef]
  23. Jacobson, A.J.; Johnson, J.W.; Lewandowski, J.T. Intercalation of the layered solid acid HCa2Nb3O10 by organic amines. Mater. Res. Bull. 1987, 22, 45–51. [Google Scholar] [CrossRef]
  24. Jacobson, A.J.; Johnson, J.W.; Lewandowski, J.T. Interlayer chemistry between thick transition-metal oxide layers: Synthesis and intercalation reactions of K[Ca2Nan−3NbnO3n+1] (3.ltoreq. n.ltoreq. 7). Inorg. Chem. 1985, 24, 3727–3729. [Google Scholar] [CrossRef]
  25. Schaak, R.E.; Mallouk, T.E. Prying apart Ruddlesden-Popper phases: Exfoliation into sheets and nanotubes for assembly of perovskite thin films for assembly of perovskite thin films. Chem. Mater. 2000, 3427–3434. [Google Scholar] [CrossRef]
  26. Domen, K.; Yoshimura, J.; Sekine, T.; Kondo, J.; Tanaka, A.; Maruya, K.; Onishi, T. A novel series of photocatalysts with an ion-exchangeable layered structure of niobate. Catal. Lett. 1993, 75, 2159–2162. [Google Scholar] [CrossRef]
  27. Oshima, T.; Ishitani, O.; Maeda, K. Non-sacrificial water photo-oxidation activity of lamellar calcium niobate induced by exfoliation. Adv. Mater. Interfaces 2014, 1, 2–5. [Google Scholar] [CrossRef]
  28. Sabio, E.M.; Chamousis, R.L.; Browning, N.D.; Osterloh, F.E. Photocatalytic water splitting with suspended calcium niobium oxides: Why nanoscale is better than bulk—A kinetic analysis. J. Phys. Chem. C 2012, 116, 3161–3170. [Google Scholar] [CrossRef]
  29. Takata, T.; Furumi, Y.; Shinohara, K.; Tanaka, A.; Hara, M.; Kondo, J.N.; Domen, K. Photocatalytic decomposition of water on spontaneously hydrated layered perovskites. Chem. Mater. 1997, 9, 1063–1064. [Google Scholar] [CrossRef]
  30. Wang, T.H.; Henderson, C.N.; Draskovic, T.I.; Mallouk, T.E. Synthesis, exfoliation, and electronic/protonic conductivity of the Dion-Jacobson phase layer perovsikite HLa2TiTa2O10. Chem. Mater. 2014, 26, 898–906. [Google Scholar] [CrossRef]
  31. Oshima, T.; Yokoi, T.; Eguchi, M.; Maeda, K. Synthesis and photocatalytic activity of K2CaNaNb3O10, a new Ruddlesden-Popper phase layered perovskite. Dalt. Trans. 2017, 46, 10594–10601. [Google Scholar] [CrossRef]
  32. Essayem, N.; Tong, Y.Y.; Jobic, H.; Vedrine, J.C. Characterization of protonic sites in H3PW12O40 and Cs1.9H1.1PW12O40: A solid-state 1H, 2H, 31P MAS-NMR and inelastic neutron scattering study on. Appl. Catal. A Gen. 2000, 194, 109–122. [Google Scholar] [CrossRef]
  33. Raciulete, M.; Papa, F.; Negrila, C.; Bratan, V.; Munteanu, C.; Pandele-Cusu, J.; Culita, D.C.; Atkinson, I.; Balint, I. Strategy for modifying layered perovskites toward efficient solar light-driven photocatalysts for removal of chlorinated pollutants. Catalysts 2020, 10, 637. [Google Scholar] [CrossRef]
  34. Arribart, H.; Piffard, Y. Indication from NMR of Grotthuss mechanism for proton conduction in H2Sb4O11·nH2O. Solid State Commun. 1983, 45, 571–575. [Google Scholar] [CrossRef]
  35. Shelyapina, M.G.; Yocupicio-Gaxiola, R.I.; Zhelezniak, I.V.; Chislov, M.V.; Antúnez-García, J.; Murrieta-Rico, F.N.; Galván, D.H.; Petranovskii, V.; Fuentes-Moyado, S. Local structures of two-dimensional zeolites—Mordenite and ZSM-5—Probed by multinuclear NMR. Molecules 2020, 25, 4678. [Google Scholar] [CrossRef]
  36. Shimizu, T.; Nakai, T.; Deguchi, K.; Yamada, K.; Yue, B.; Ye, J. A visible-light-responsive photocatalyst of nitrogen-doped solid-acid HNb3O8-N studied by ultrahigh-field 1 H MAS NMR and 1H93Nb/1H15N HETCOR NMR in solids. Chem. Lett. 2014, 43, 80–82. [Google Scholar] [CrossRef]
  37. Cattaneo, A.S.A.S.; Ferrara, C.; Marculescu, A.M.A.M.; Giannici, F.; Martorana, A.; Mustarelli, P.; Tealdi, C. Solid-state NMR characterization of the structure and thermal stability of hybrid organic-inorganic compounds based on a HLaNb2O7 Dion-Jacobson layered perovskite. Phys. Chem. Chem. Phys. 2016, 18, 21903–21912. [Google Scholar] [CrossRef] [Green Version]
  38. Krylova, E.A.; Shelyapina, M.G.; Nowak, P.; Harańczyk, H.; Chislov, M.; Zvereva, I.A.; Privalov, A.F.; Becker, M.; Vogel, M.; Petranovskii, V. Mobility of water molecules in sodium- and copper-exchanged mordenites: Thermal analysis and 1H NMR. Microporous Mesoporous Mater. 2018, 265, 132–142. [Google Scholar] [CrossRef]
  39. Tani, S.; Komori, Y.; Hayashi, S.; Sugahara, Y. Local environments and dynamics of hydrogen atoms in protonated forms of ion-exchangeable layered perovskites estimated by solid-state 1H NMR. J. Solid State Chem. 2006, 179, 3357–3364. [Google Scholar] [CrossRef]
  40. Silyukov, O.; Chislov, M.; Burovikhina, A.; Utkina, T.; Zvereva, I. Thermogravimetry study of ion exchange and hydration in layered oxide materials. J. Therm. Anal. Calorim. 2012, 110, 187–192. [Google Scholar] [CrossRef]
  41. Utkina, T.; Chislov, M.; Silyukov, O.; Burovikhina, A.; Zvereva, I.A. TG and DSC investigation of water intercalation and protonation processes in perovskite-like layered structure of titanate K2Nd2Ti3O10. J. Therm. Anal. Calorim. 2016, 125, 281–287. [Google Scholar] [CrossRef]
  42. Zvereva, I.A.; Silyukov, O.I.; Chislov, M.V. Ion-exchange reactions in the structure of perovskite-like layered oxides: I. Protonation of NaNdTiO4 complex oxide. Russ. J. Gen. Chem. 2011, 81, 1434–1441. [Google Scholar] [CrossRef]
  43. Mäemets, V.; Koppel, I. 17O and 1H NMR chemical shifts of hydroxide and hydronium ion in aqueous solutions of strong electrolytes. J. Chem. Soc. Faraday Trans. 1997, 93, 1539–1542. [Google Scholar] [CrossRef]
  44. Takagaki, A.; Sugisawa, M.; Lu, D.; Kondo, J.N.; Hara, M.; Domen, K.; Hayashi, S. Exfoliated nanosheets as a new strong solid acid catalyst. J. Am. Chem. Soc. 2003, 125, 5479–5485. [Google Scholar] [CrossRef] [PubMed]
  45. Jeanneau, E.; Le Floch, M.; Bureau, B.; Audebrand, N.; Louër, D. X-ray diffraction, 133Cs and 1H NMR and thermal studies of CdZrCs1.5(H3O)0.5(C2O4)4·xH2O displaying Cs and water dynamic behavior. J. Phys. Chem. Solids 2004, 65, 1213–1221. [Google Scholar] [CrossRef]
  46. Grube, E.; Lipton, A.S.; Nielsen, U.G. Identification of hydrogen species in alunite-type minerals by multi-nuclear solid-state NMR spectroscopy. Phys. Chem. Miner. 2019, 46, 299–309. [Google Scholar] [CrossRef] [Green Version]
  47. Skripov, A.V.; Shelyapina, M.G. Nuclear magnetic resonance. In Neutron Scattering and Other Nuclear Techniques for Hydrogen in Materials; Fritzsche, H., Huot, J., Fruchart, D., Eds.; Springer International Publishing: Cham, Switzerland, 2016; pp. 337–376. ISBN 978-3-319-22792-4. [Google Scholar]
  48. Shelyapina, M.G.; Skryabina, N.E.; Surova, L.S.; Dost, A.; Ievlev, A.V.; Privalov, A.F.; Fruchart, D. Proton NMR study of hydrogen mobility in (TiCr1.8)1-xVx hydrides. J. Alloys Compd. 2019, 778, 962–971. [Google Scholar] [CrossRef]
  49. Waugh, J.S.; Fedin, E.I. Determination of hindered-rotation barriers in solids. Sov. Phys. Solid State 1963, 4, 1633–1636. [Google Scholar]
  50. Chizhik, V.I.; Chernyshev, Y.S.; Donets, A.V.; Frolov, V.V.; Komolkin, A.V.; Shelyapina, M.G. Magnetic Resonance and Its Applications; Springer International Publishing: Cham, Switzerland, 2014; ISBN 9783319052984. [Google Scholar]
  51. Ailion, D.; Slichter, C.P. Study of ultraslow atomic motions by magnetic resonance. Phys. Rev. Lett. 1964, 12, 168–171. [Google Scholar] [CrossRef]
  52. Slichter, C.P.; Ailion, D. Low-field relaxation and the study of ultraslow atomic motions by magnetic resonance. Phys. Rev. 1964, 135, A1099–A1110. [Google Scholar] [CrossRef]
  53. Look, D.C.; Lowe, I.J. Nuclear magnetic dipole-dipole relaxation along the static and rotating magnetic fields: Application to gypsum. J. Chem. Phys. 1966, 44, 2995–3000. [Google Scholar] [CrossRef]
  54. Wolf, D. Effect of correlated self-diffusion on the low-field nuclear-spin relaxation in the rotating reference frame. Phys. Rev. B 1974, 10, 2724–2732. [Google Scholar] [CrossRef]
  55. Kuhn, A.; Kunze, M.; Sreeraj, P.; Wiemhöfer, H.D.; Thangadurai, V.; Wilkening, M.; Heitjans, P. NMR relaxometry as a versatile tool to study Li ion dynamics in potential battery materials. Solid State Nucl. Magn. Reson. 2012, 42, 2–8. [Google Scholar] [CrossRef]
  56. Kohlrausch, R. Theorie des elektrischen Rückstandes in der Leidener Flasche. Ann. Phys. 1854, 167, 179–214. [Google Scholar] [CrossRef] [Green Version]
  57. Williams, G.; Watts, D. Non-symmetrical dielectric relaxation behaviour arising from a simple empirical decay function. Trans. Faraday Soc. 1970, 66, 80–85. [Google Scholar] [CrossRef]
  58. Williams, G.; Watts, D.C.; Dev, S.B.; North, A. Further considerations of non symmetrical dielectric relaxation behaviour arising from a simple empirical decay function. Trans. Faraday Soc. 1971, 67, 1323–1335. [Google Scholar] [CrossRef]
  59. Bloembergen, N.; Purcell, E.M.; Pound, R.V. Relaxation effects in nuclear magnetic resonance absorption. Phys. Rev. 1948, 73, 679–712. [Google Scholar] [CrossRef]
  60. Kasperovich, V.S.; Shelyapina, M.G.; Khar’Kov, B.; Rykov, I.; Osipov, V.; Kurenkova, E.; Ievlev, A.V.; Skryabina, N.E.; Fruchart, D.; Miraglia, S.; et al. NMR study of metal-hydrogen systems for hydrogen storage. J. Alloys Compd. 2011, 509, S804–S808. [Google Scholar] [CrossRef]
  61. Chizhik, V.I.; Kasperovich, V.S.; Shelyapina, M.G.; Chernyshev, Y.S. Exchange model for proton relaxation in disordered metallic hydrides. Int. J. Hydrogen Energy 2011, 36, 1601–1605. [Google Scholar] [CrossRef]
  62. Shelyapina, M.G.; Vyvodtceva, A.V.; Klyukin, K.A.; Bavrina, O.O.; Chernyshev, Y.S.; Privalov, A.F.; Fruchart, D. Hydrogen diffusion in metal-hydrogen systems via NMR and DFT. Int. J. Hydrogen Energy 2015, 40, 17038–17050. [Google Scholar] [CrossRef]
  63. Chizhik, V.I.; Rykov, I.A.; Shelyapina, M.G.; Fruchart, D. Proton relaxation and hydrogen mobility in Ti-V-Cr alloys: Improved exchange model. Int. J. Hydrogen Energy 2014, 39, 17416–17421. [Google Scholar] [CrossRef]
  64. Cardona, M.; Chamberlin, R.V.; Marx, W. The history of the stretched exponential function. Ann. Phys. 2007, 16, 842–845. [Google Scholar] [CrossRef]
  65. Ditchfield, R. Self-consistent perturbation theory of diamagnetism I. A gauge-invariant LCAO method for N.M.R. Chemical shifts. Mol. Phys. 1974, 27, 789–807. [Google Scholar] [CrossRef]
  66. Frisch, M.J.; Trucks, G.W.; Schlegel, H.B.; Scuseria, G.E.; Robb, M.A.; Cheeseman, J.R.; Scalmani, G.; Barone, V.; Mennucci, B.; Petersson, G.A.; et al. Gaussian 09; Gaussian, Inc.: Wallingford, CT, USA, 2009. [Google Scholar]
Figure 1. XRD powder patterns for the studied forms of HCa2Nb3O10·yH2O with different hydration levels (a) and the unit cell of HCa2Nb3O10·yH2O (b) with possible sites for the water oxygen Ow.
Molecules 26 05943 g001
Figure 2. (a) TG curves for the studied forms of HCa2Nb3O10·yH2O with different hydration levels; (b) number of H2O molecules per formula units (y) versus the interlayer space (d).
Molecules 26 05943 g002
Figure 3. 1H MAS NMR spectra in the α- (a), β- (b), and γ-forms (c) of HCa2Nb3O10·yH2O at 297 K.
Molecules 26 05943 g003
Figure 4. 1H MAS NMR spectra in the α- (a), β- (b), and γ-forms (c) of HCa2Nb3O10·yH2O with the temperature decreasing.
Molecules 26 05943 g004
Figure 5. 1H MAS NMR spectra at 151 K in γ-HCa2Nb3O10·yH2O and its decomposition.
Molecules 26 05943 g005
Figure 6. Temperature dependencies of the 1H isotropic chemical shift (the upper row), the line width at half maximum (the middle row), and the integral intensities (the bottom row) for the α- (a), β- (b), and γ- (c) forms of HCa2Nb3O10·yH2O.
Molecules 26 05943 g006aMolecules 26 05943 g006b
Figure 7. 1H relaxation times T’, T’’ (ac) and their relative contributions A’, A’’ to the magnetization recovery (df) for α- (a,d), β- (b,e), and γ- (c,f) forms of HCa2Nb3O10·yH2O versus inverse temperature. The solid lines show the fitting using the KWW correlation function.
Molecules 26 05943 g007
Figure 8. 1H magnetization recovery curves for the α-form of HCa2Nb3O10·yH2O at 297 and 167 K with the exponential fit (solid lines); for 167 K the line corresponds to the slow component only.
Molecules 26 05943 g008
Table 1. Lattice parameters (a, c) and unit cell volume (V) for the studied forms of HCa2Nb3O10·yH2O.
Parametersα-Formβ-Formγ-Form
a (Å)3.86517(3)3.86550(9)3.89267(8)
c (Å)16.2627(2)15.1125(7)14.5254(4)
V3)242.957(6)225.812(18)220.102(14)
Publisher’s Note: MDPI stays neutral with regard to jurisdictional claims in published maps and institutional affiliations.

