Article

Fluorescein Hydrazide-Appended Metal–Organic Framework as a Chromogenic and Fluorogenic Chemosensor for Mercury Ions

1
Center of Research Excellence in Nanotechnology (CENT), King Fahd University of Petroleum and Minerals (KFUPM), Dhahran 31261, Saudi Arabia
2
Department of Chemistry, King Fahd University of Petroleum and Minerals, Dhahran 31261, Saudi Arabia
3
Interdisciplinary Research Center for Renewable Energy and Power Systems, King Fahd University of Petroleum and Minerals (KFUPM), Dhahran 31261, Saudi Arabia
*
Author to whom correspondence should be addressed.
Molecules 2021, 26(19), 5773; https://doi.org/10.3390/molecules26195773
Submission received: 1 September 2021 / Revised: 18 September 2021 / Accepted: 19 September 2021 / Published: 23 September 2021
(This article belongs to the Special Issue Preparation and Application of MOF Materials)

Abstract

:
In this work, we prepared a fluorescein hydrazide-appended Ni(MOF) (Metal–Organic Framework) [Ni3(BTC)2(H2O)3]·(DMF)3(H2O)3 composite, FH@Ni(MOF). This composite was well-characterized by PXRD (powder X-ray diffraction), FT-IR (Fourier transform infrared spectroscopy), N2 adsorption isotherm, TGA (thermogravimetric analysis), XPS (X-ray photoelectron spectroscopy), and FESEM (field emission scanning electron microscopy). This composite was then tested with different heavy metals and was found to act as a highly selective and sensitive optical sensor for the Hg2+ ion. It was found that the aqueous emulsion of this composite produces a new peak in absorption at 583 nm, with a chromogenic change to a pink color visible to the naked eye upon binding with Hg2+ ions. In emission, it enhances fluorescence with a fluorogenic change to green fluorescence upon complexation with the Hg2+ ion. The binding constant was found to be 9.4 × 10⁵ M−1, with a detection limit of 0.02 μM or 5 ppb. This sensor was also found to be reversible and could be used for seven consecutive cycles. It was also tested for Hg2+ ion detection in practical water samples from ground water, tap water, and drinking water.

1. Introduction

Mercury is considered to be a highly toxic heavy metal and non-biodegradable pollutant [1]. As an environmental pollutant, it exists in three primary forms in the environment: inorganic mercury (Hg2+), elemental mercury (Hg0), and organic mercury (such as methylmercury, ethylmercury, and phenylmercury) [2]. Among these, the most common and stable form of mercury is Hg2+. This is highly soluble in water and causes severe health problems [3,4]. The principal sources of this metal ion are natural, such as volcanic emissions, and anthropogenic, such as industrial waste from metal finishing, paint production, electronic devices, batteries, electroplating, mine drainage, and the metallurgical alloy industry [5]. The mercury ion is bio-accumulated throughout the food chain due to its water stability, non-degradability, and physiological toxicity. The noxious nature of Hg2+ is due to the high binding affinity for the amino (-NH2) and thiol (-SH) groups of proteins, which have antagonistic effects on the immune system, digestive system, chromosomes, kidney function, pulmonary system, and central nervous system [6,7,8,9]. The excessive accumulation of mercury can lead to further diseases, such as Minamata, Acrodynia, and several other gastrointestinal tract diseases [10]. Several analytical techniques are available for the detection of mercury, such as atomic absorption spectroscopy (AAS), inductively coupled plasma atomic emission spectrometry (ICP-AES), and inductively coupled plasma mass spectrometry (ICP-MS). However, these methods are expensive, involving complex instruments with well-established infrastructures, and require pervasive sample pretreatment that is laborious, time consuming, and associated with a high risk of contamination and sample loss. Thus, these methods are not suitable for in situ or instant analysis during field studies [11,12,13]. Several sensors based on organic compounds [14,15], nanoparticles [16,17], polymeric materials [18], proteins [19,20], magnetic nanocomposite s [21], and DNA-functionalized hydrogels [22,23] have been used for the detection of mercury. However, these materials have several disadvantages pertaining to their thermal and chemical stability, multistep synthesis, selectivity, and sensitivity.
Metal–Organic Frameworks are extended porous crystalline structures that have been used extensively by chemists and material engineers. Due to their crystalline nature, high porosity, tunable pores (microporous and mesoporous), and moderately high stability, they represent significant materials in the field of gas adsorption and separation [24], catalysis [25], photocatalysis [26], biological applications [27], electrochemical applications [28], and sensing [29]. Luminescent MOFs have been extensively used as fluorescent chemosensors for the detection of different analytes. The pervasive surface area and open channels in MOFs permit definitive analytes’ fast diffusion for highly sensitive fluorescence detection. These pores can be efficiently functionalized to cater for readily available interactional sites and confined environments for the highly selective detection of specific analytes [30,31]. Moreover, the crystalline nature of the MOF helps in the interpretation of the host–guest interaction and its photophysical nature [32].
MOFs have been extensively used in dye adsorption due to their modifiable porous structure [33,34,35,36]. Furthermore, dye-incorporated MOFs have often been used for white light emission [37], the detection of nitro explosives [38], metal ions [39], organic molecules [40], photocatalysis [41], two-photon-pumped lasing [42], and solar cell manufacturing [43]. The xanthene-based fluorescein dye has been most extensively used, as it has a bright signal with a high quantum yield and is nontoxic. In addition, excitation and emission wavelengths occur in the visible region of the spectrum, and these wavelengths have multiple reactive sites in their skeletons [44]. The functionalization of the carboxylic acid is the most common factor that results in the formation of spirolactam-based chemosensors, which, upon the ring opening, form highly emissive probes [45].
In this paper, we report the preparation of a composite of fluorescein hydrazide that has been coordinately bonded to the nickel SBU of a nickel-based MOF [Ni(MOF)] [Ni3(BTC)2(H2O)3]·(DMF)3(H2O)3 [46]. This composite was then used for the optical detection of heavy metals. The composite was well-characterized by PXRD, nitrogen adsorption isotherm, FTIR, TGA, FESEM, and XPS. We also studied its photophysical properties, which indicated that it could act as a chromogenic and fluorogenic sensor for the detection of mercury.

2. Results and Discussions

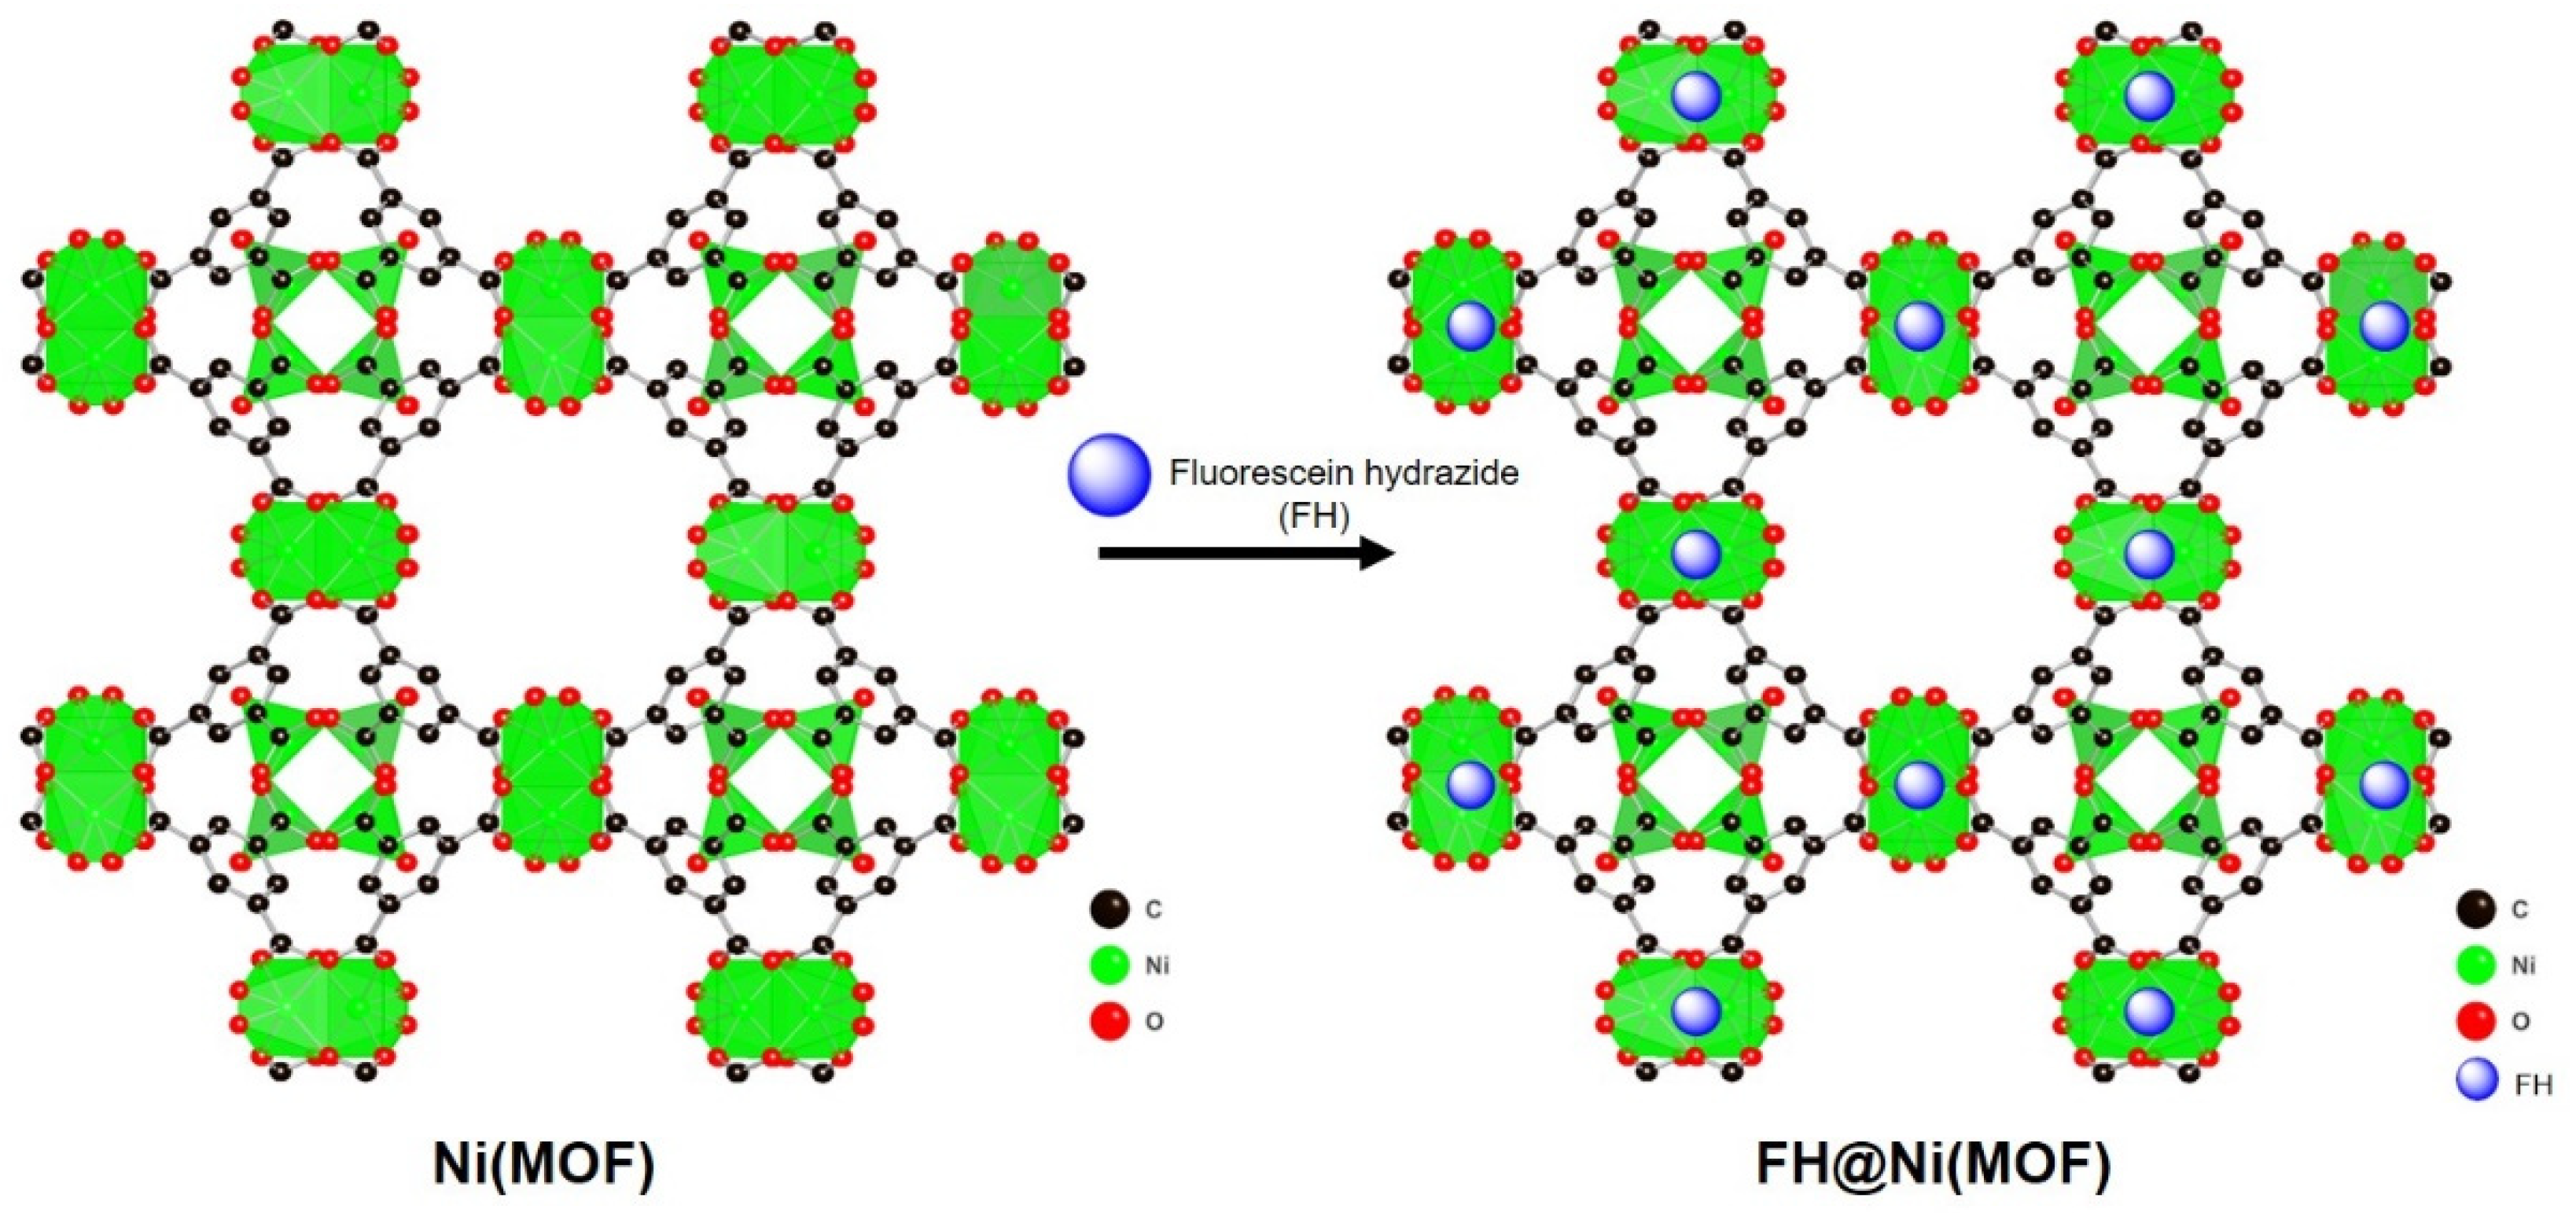
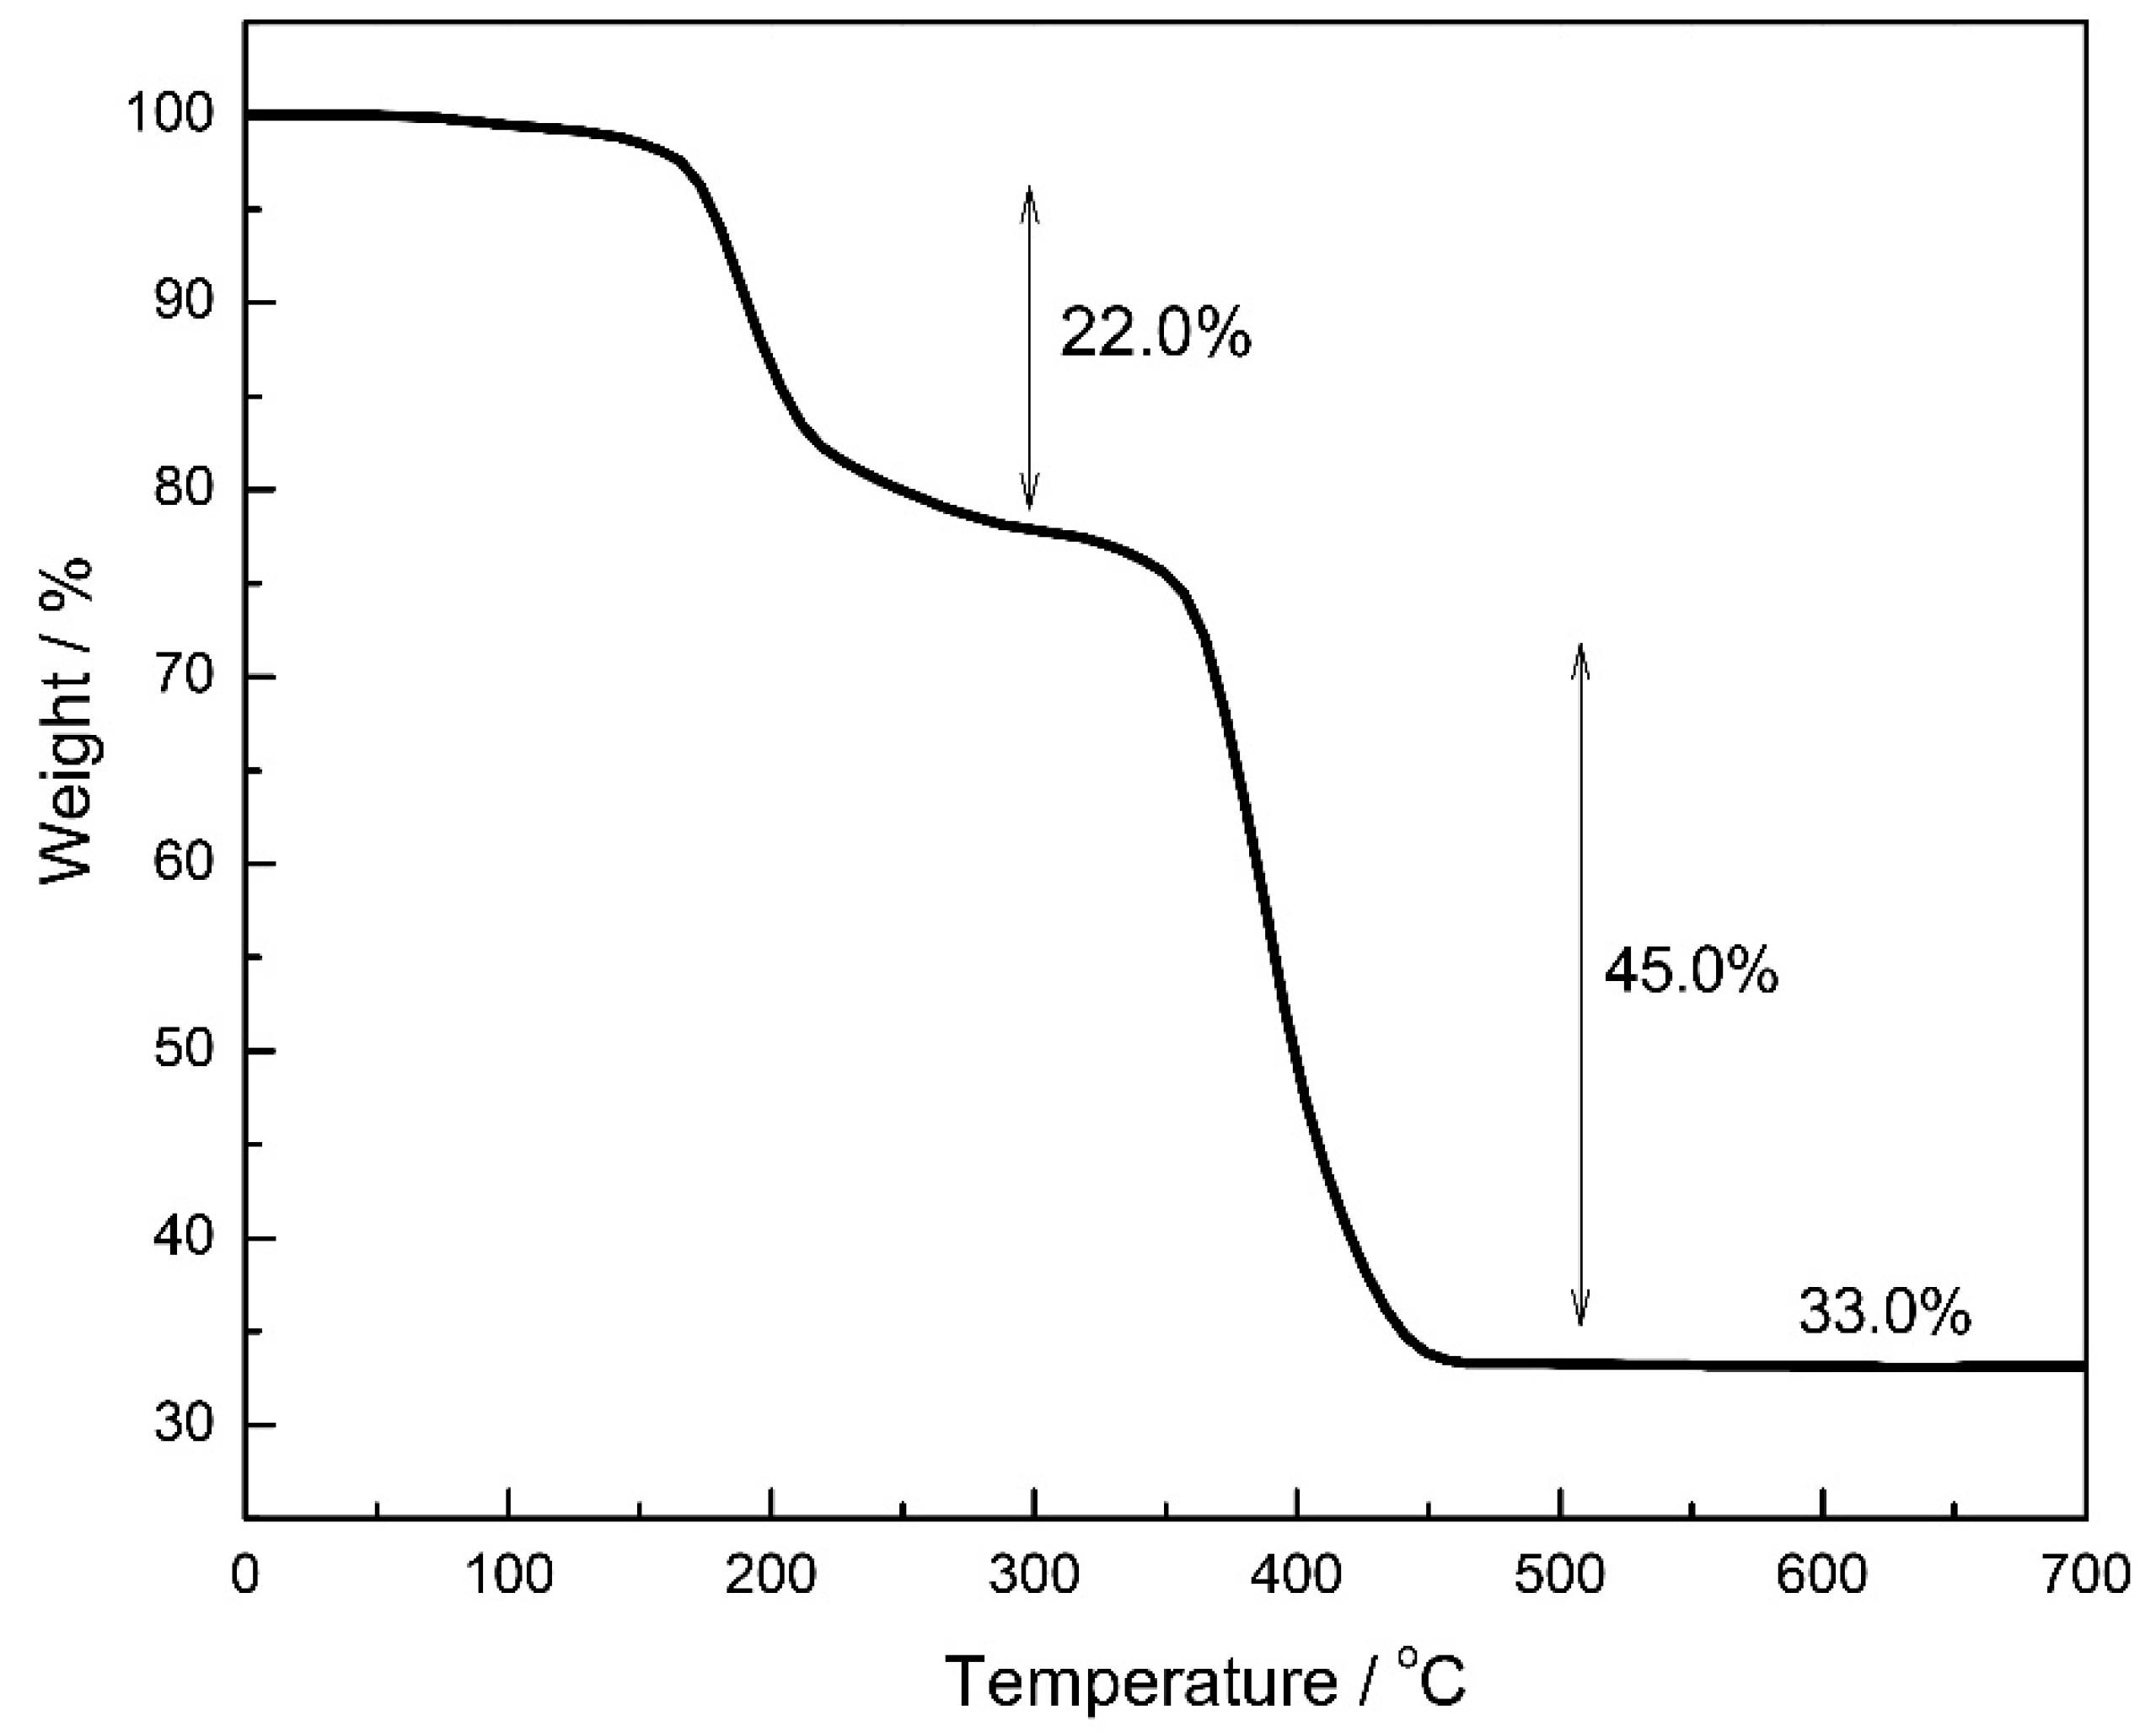
2.1. Synthesis and Characterization of FH@Ni(MOF)

The fluorescein hydrazide was synthesized using the methods given in the literature and characterized by the 1H and 13C NMR (Scheme 1) (Figures S1 and S2). The Ni(MOF) was prepared according to the method followed in the literature [46]. Then, it was activated by evacuation at a high temperature to de-coordinate the aqua ligands from the nickel clusters and generate coordinately unsaturated sites (CUS). Upon interaction with the fluorescein hydrazide, the CUS are coordinately occupied with the lone pair electrons of the nitrogen in fluorescein hydrazide to give the composite FH@Ni(MOF) (Scheme 2).
The structural characterization of the composite was carried out using the PXRD, which confirmed that the consistency in the crystallinity and phase purity was well retained in the as-synthesized Ni(MOF), activated Ni(MOF), and FH-appended FH@Ni(MOF) (Figure 1). In the FTIR spectrum (Figure S3) of the FH@Ni(MOF), the bands at 701 cm−1 and 754 cm−1 correspond to the out-of-plane aromatic C-H bending modes of the benzene ring of the linker, while the band at 936 cm−1 is due to the bending mode of the aromatic C-H of the fluorescein hydrazide. The band at 1111 cm−1 is designated to the C-H in-plane bending of the benzene ring, while the band at 1185 cm−1 is assigned to the fluorescein hydrazide’s N-N stretching. The symmetric and asymmetric stretching modes of the carbonyl moiety in the COO group are represented by the strong bands at 1378 and 1439 cm−1 and 1579 and 1629 cm−1, respectively. The bands at 1499 cm−1 and 1680 cm−1 are likely due to the in-plane bending of the H-N-N and C=O stretching of the fluorescein hydrazide, respectively. The small band at the 3415 cm−1 corresponds to the O-H stretching vibration of the fluorescein hydrazide. The simultaneous presence of both the IR bands from the Ni(MOF) and fluorescein hydrazide in FH@Ni(MOF) illustrates the formation of the composite. In order to study the thermal stability of the composite FH@Ni(MOF), we carried out a thermogravimetric analysis. From Figure 2, it can be observed that weight loss occurred in two stages: (a) In the first step, there was a weight loss of 22.0% at 150 °C, which corresponds to the decomposition of the fluorescein hydrazide. (b) The second step showed a sudden weight loss of about 45.0% at 375–450 °C due to the thermal disintegration of the framework. The final silt of 33.0% can be ascribed to the nickel oxide formed after decomposition. The N2 adsorption isotherm of the FH@Ni(MOF) indicates that it is microporous, with a characteristic Type I isotherm (Figure 3). The Brunauer–Emmett–Teller surface area was calculated to be 380 m2/g. The surface area of FH@Ni(MOF) was much abated compared to the pristine Ni(MOF) due to the presence of the fluorescein hydrazide occupying the pores of the MOF. The XPS (Figure S4) spectra of Ni(MOF) and FH@Ni(MOF) were recorded; both the spectra had peaks at 856.1 eV and 873.3 eV, corresponding to Ni 2p3/2 and 2p1/2, indicating that nickel mainly exists as Ni2+. The peak at 397.2 eV is also attributed to Ni 1s. In both the spectra, the peaks at 284.1 eV (C 1s) and 531.9 eV (O 1s) resemble the characteristic peaks for C and O, respectively. These peaks’ intensities in the case of FH@Ni(MOF) are much higher than those for the pristine Ni(MOF), indicating the presence of fluorescein hydrazide. Furthermore, the presence of an additional peak at 401.6 eV in the case of FH@Ni(MOF) indicates the presence of N 1s from the fluorescein hydrazide. The scanning electron microscopy (SEM) images of the microcrystalline composite FH@Ni(MOF) show a uniform morphology of rod-shaped structures assembled into sheets (Figure S5).
The amount of fluorescein hydrazide appended in the FH@Ni(MOF), as calculated by the alkaline digestion, was found to be approximately 0.211 g g−1 (0.61 mmole.g−1) of FH@Ni(MOF).

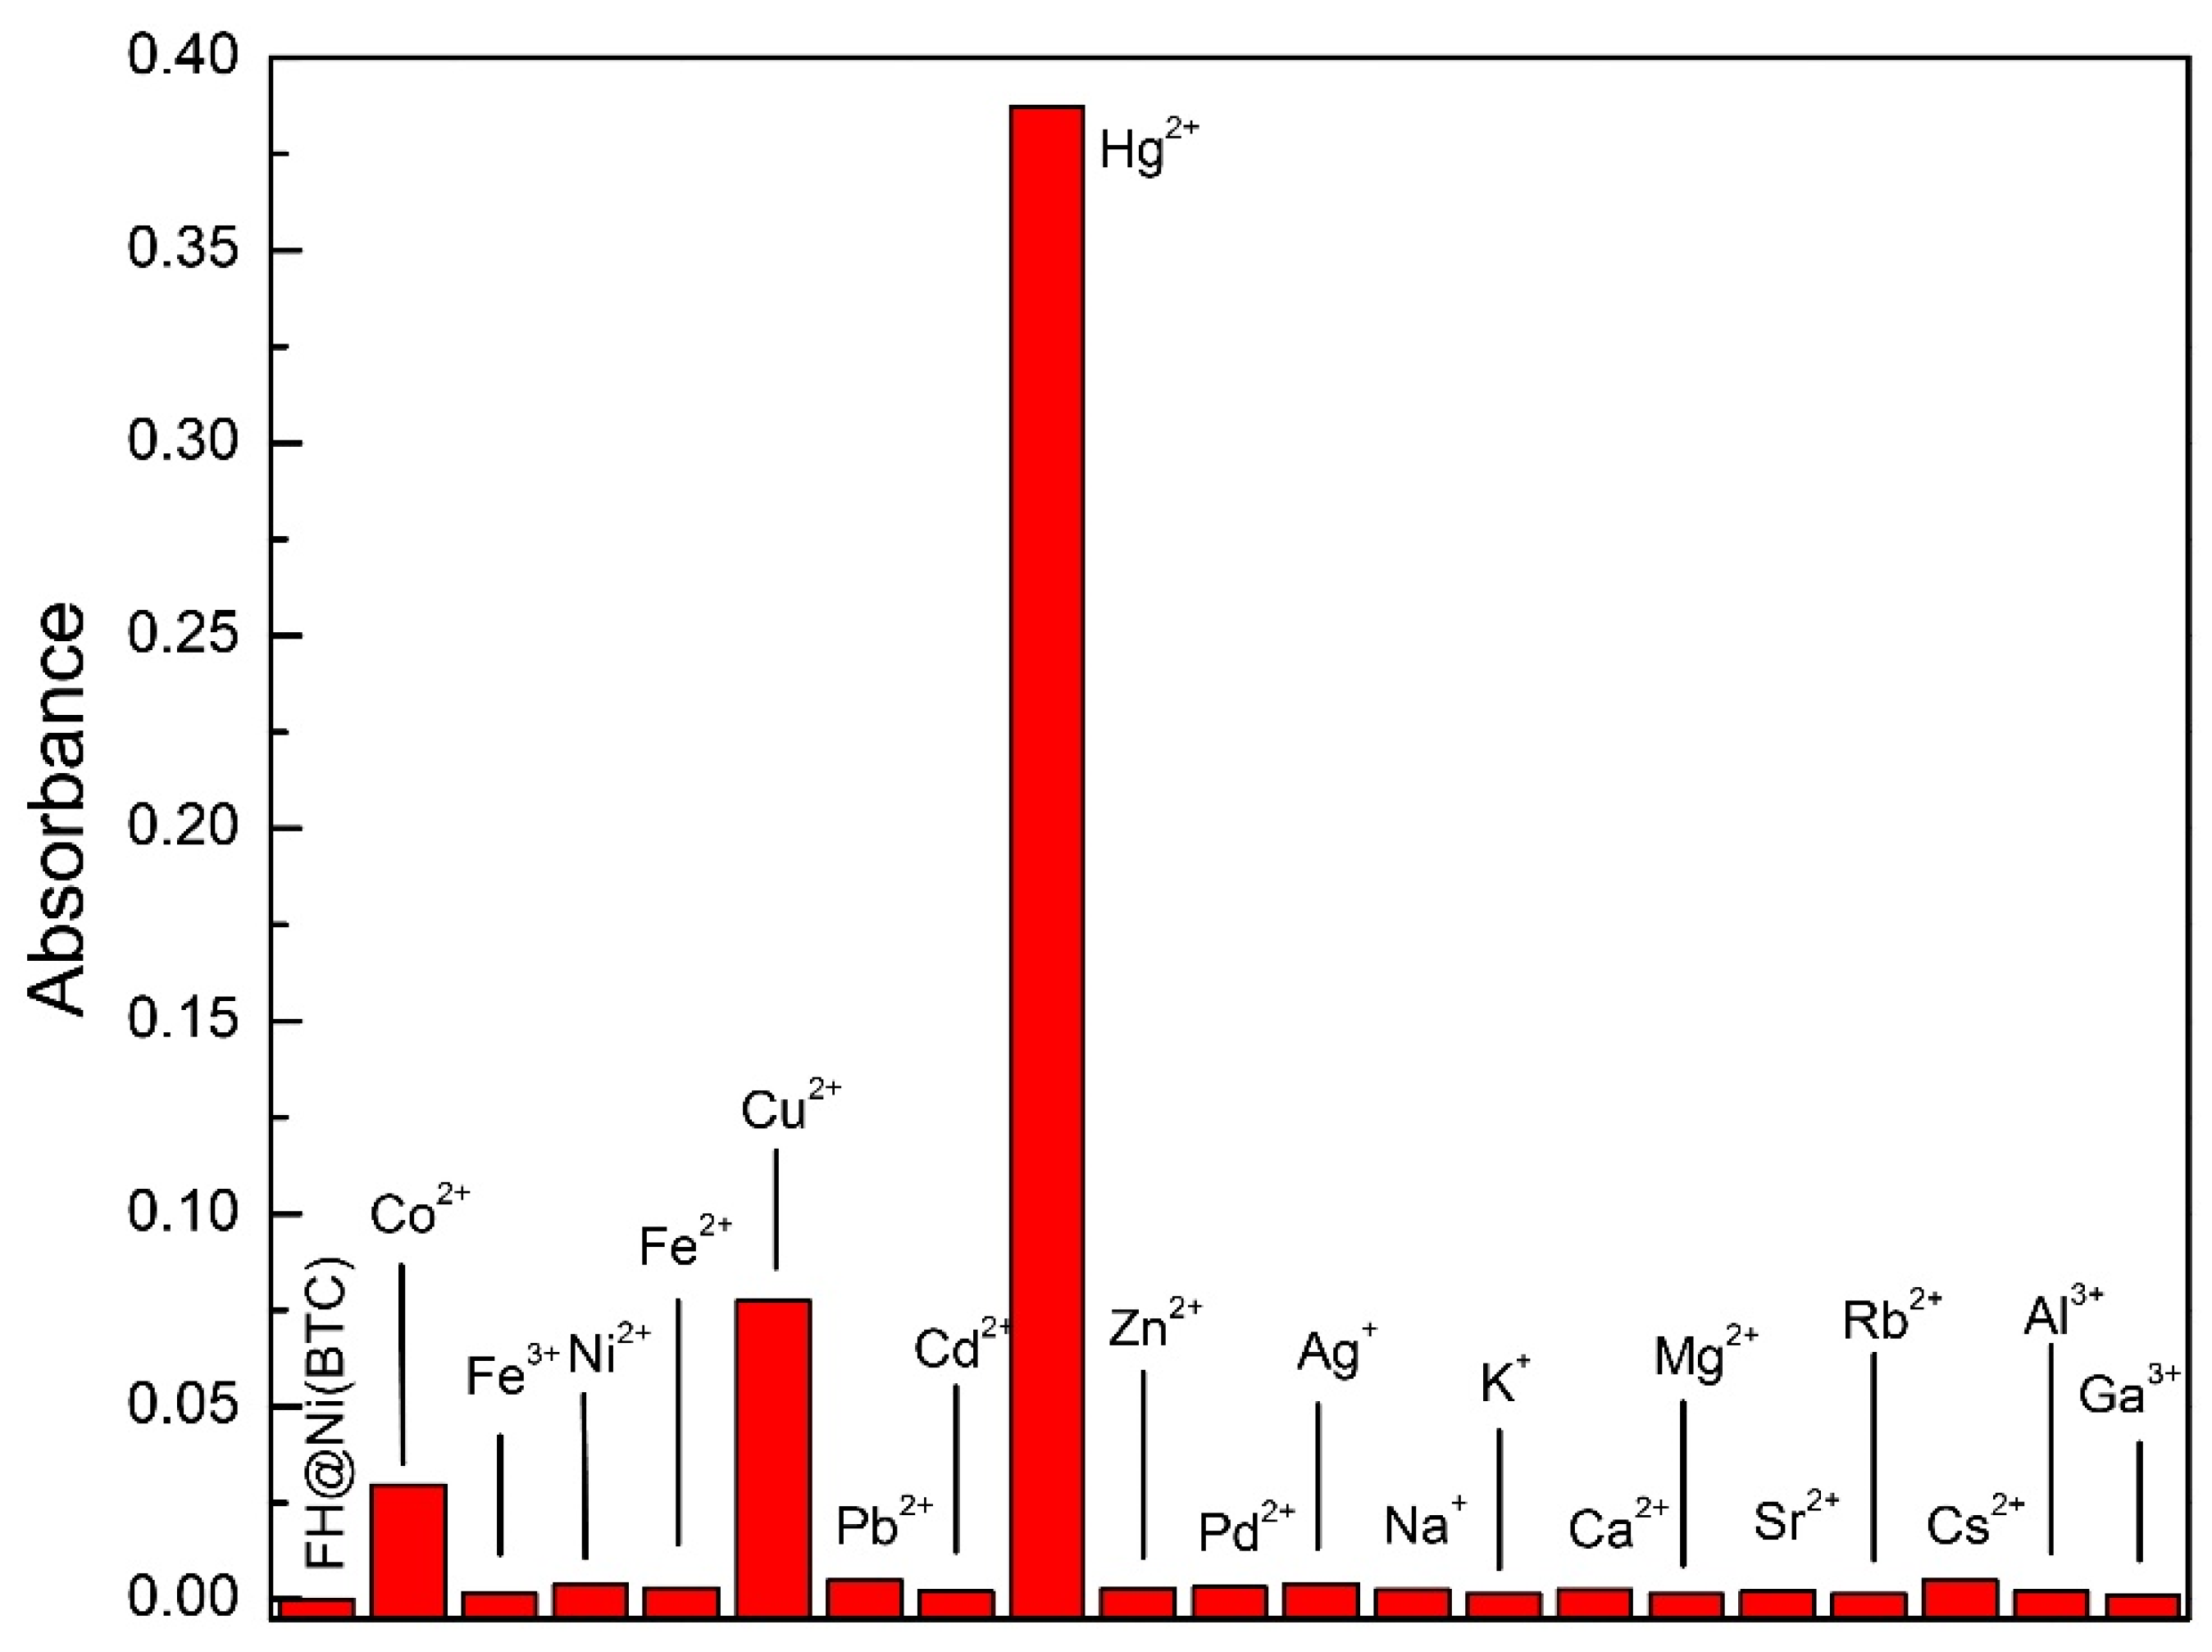
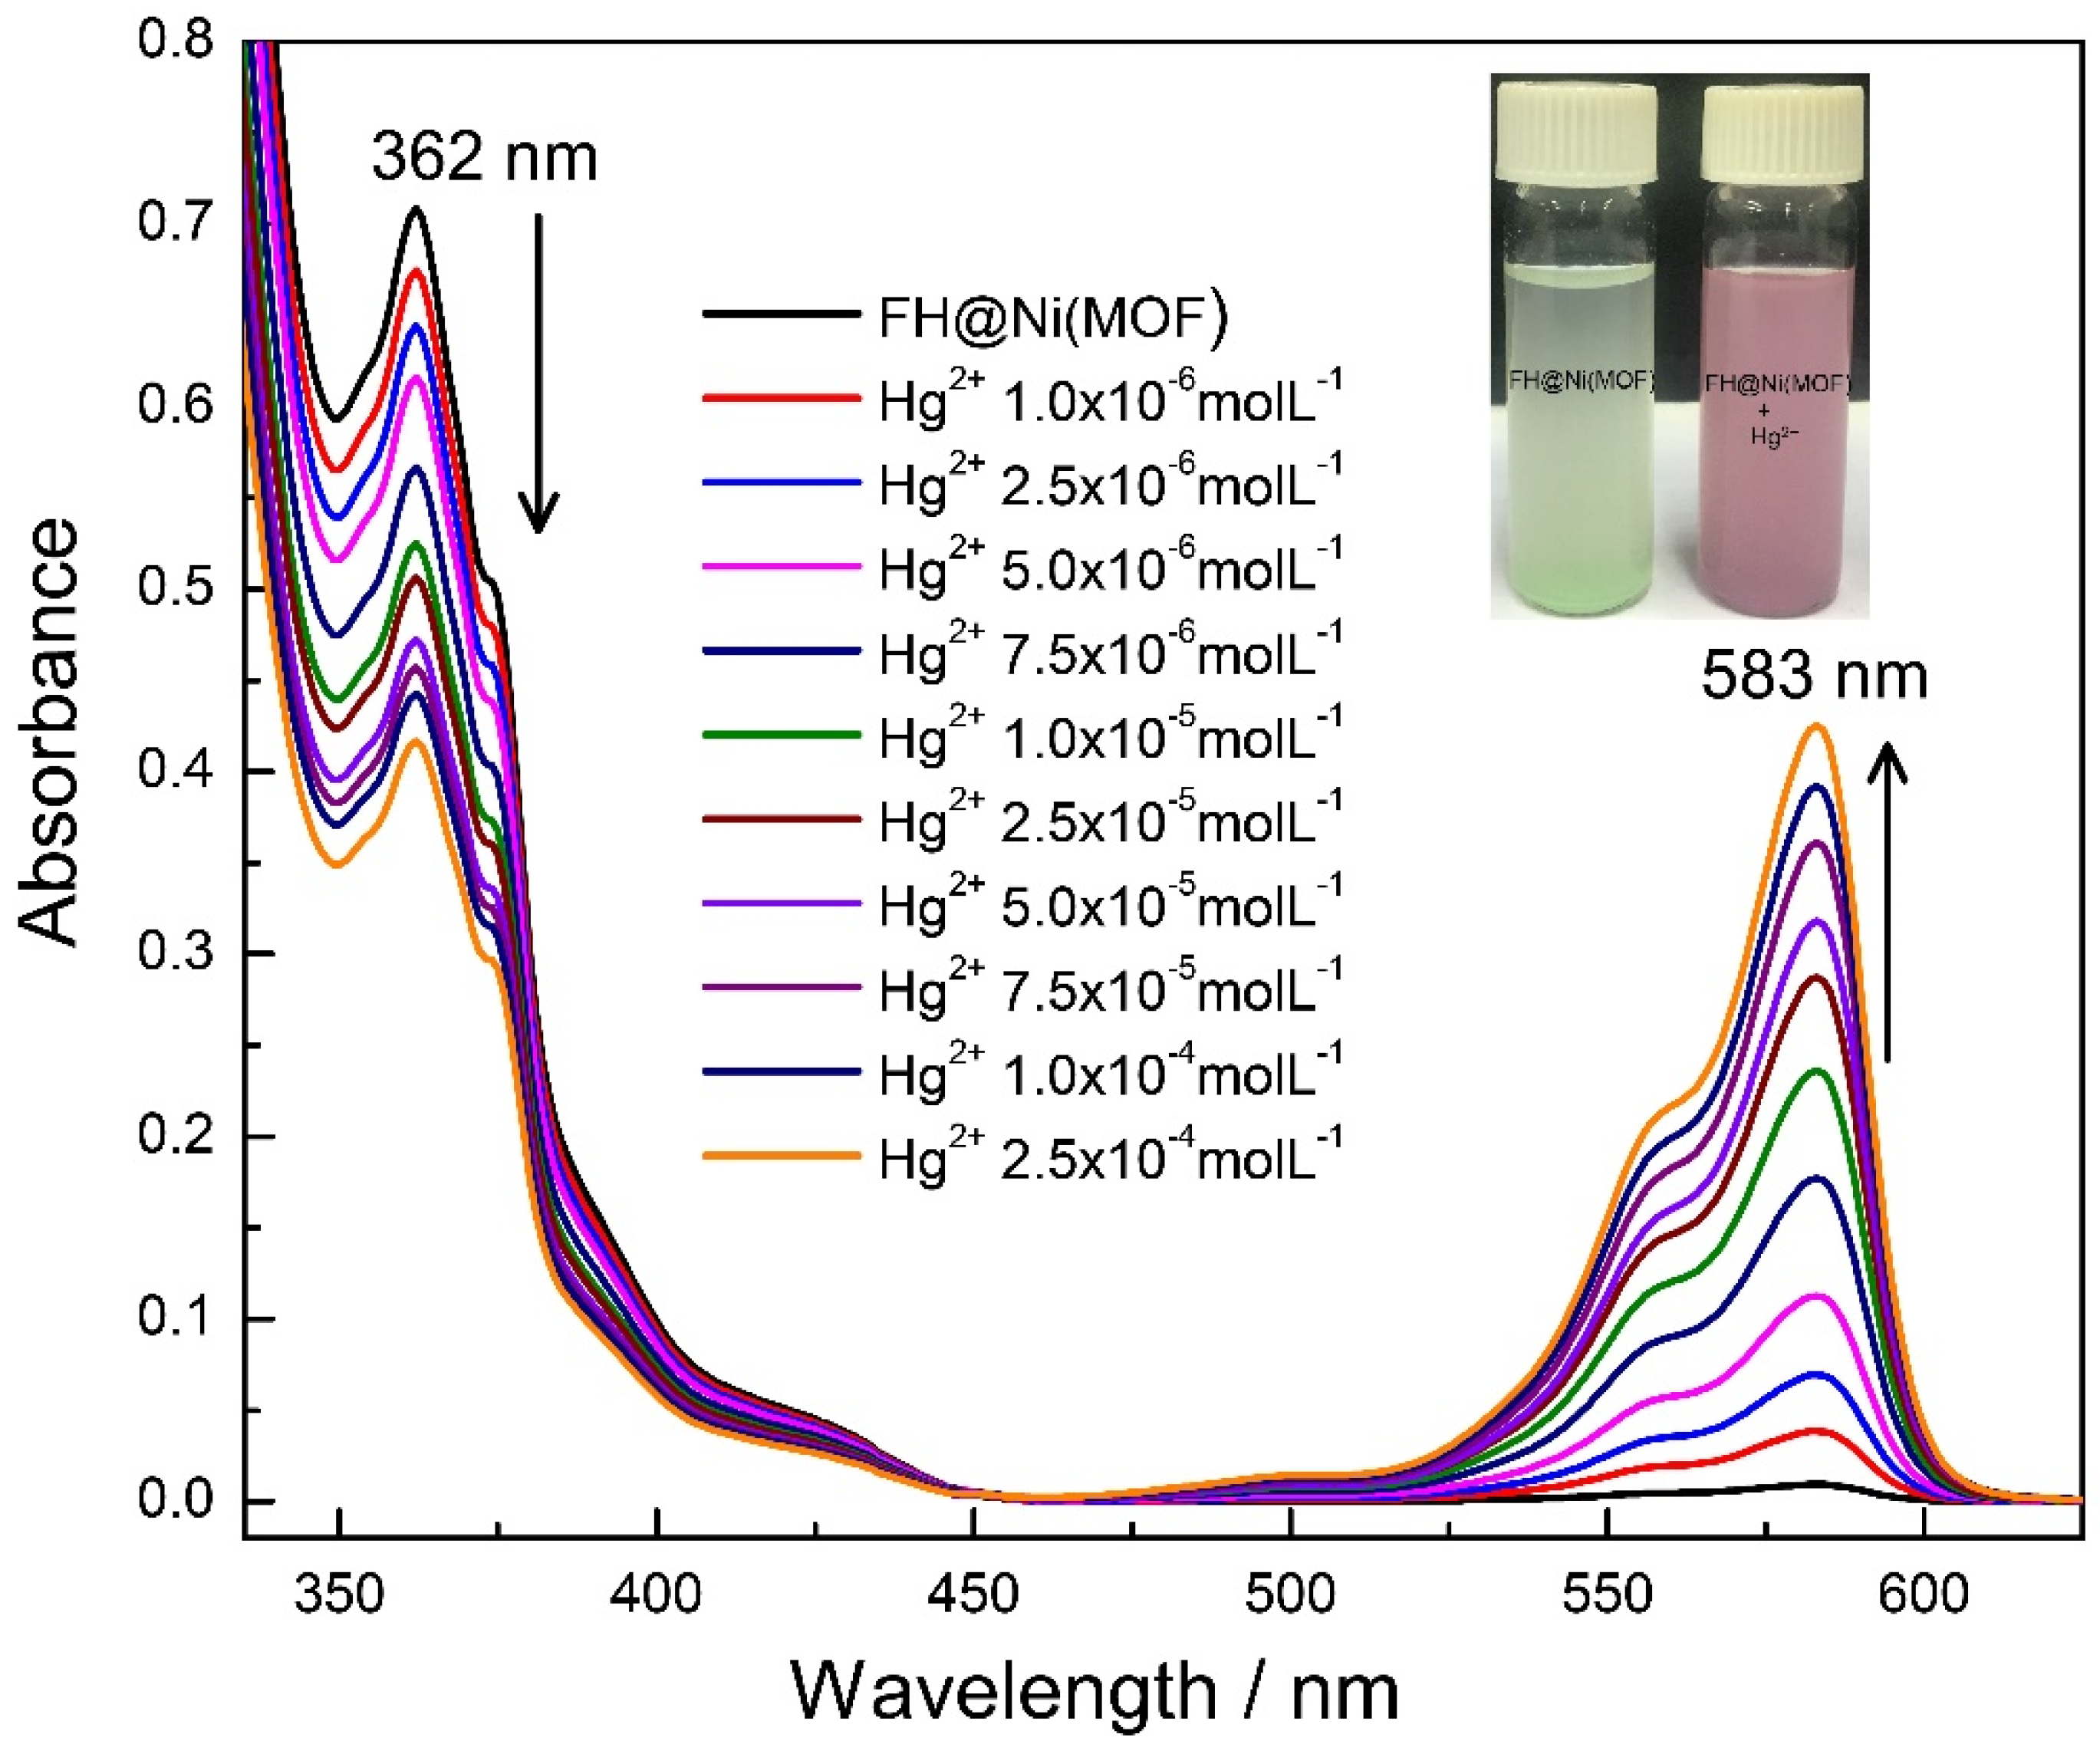
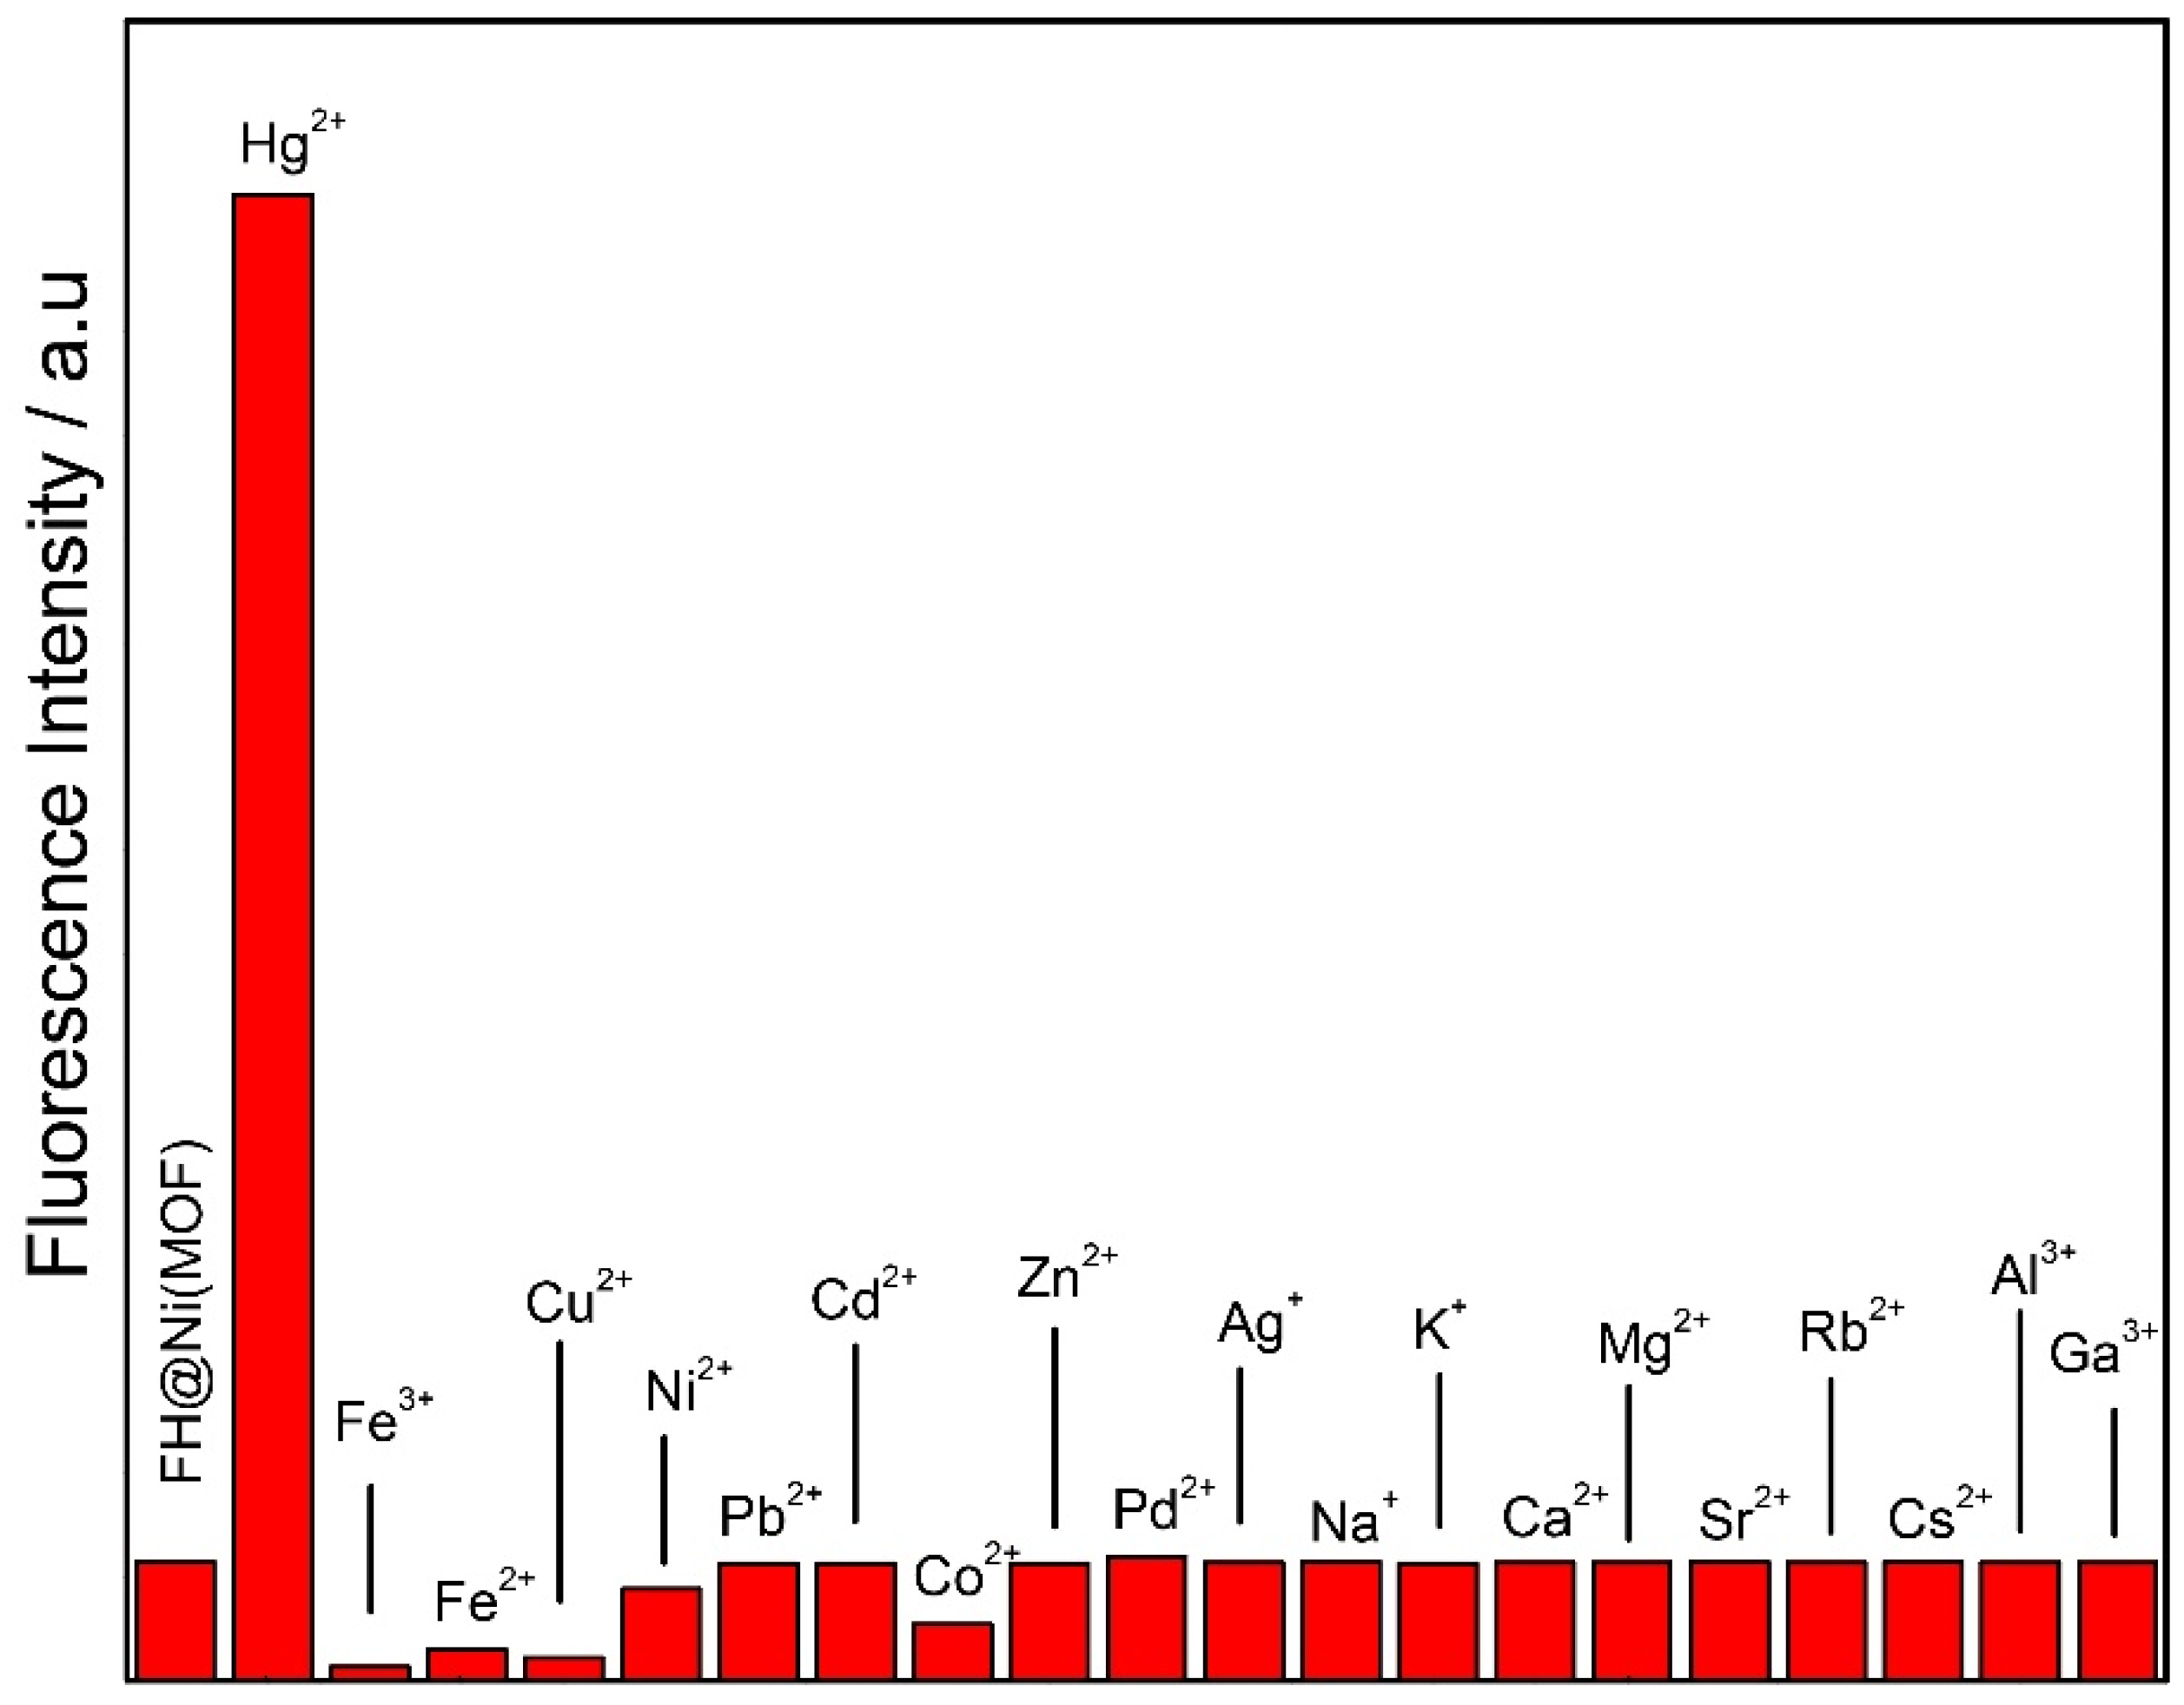
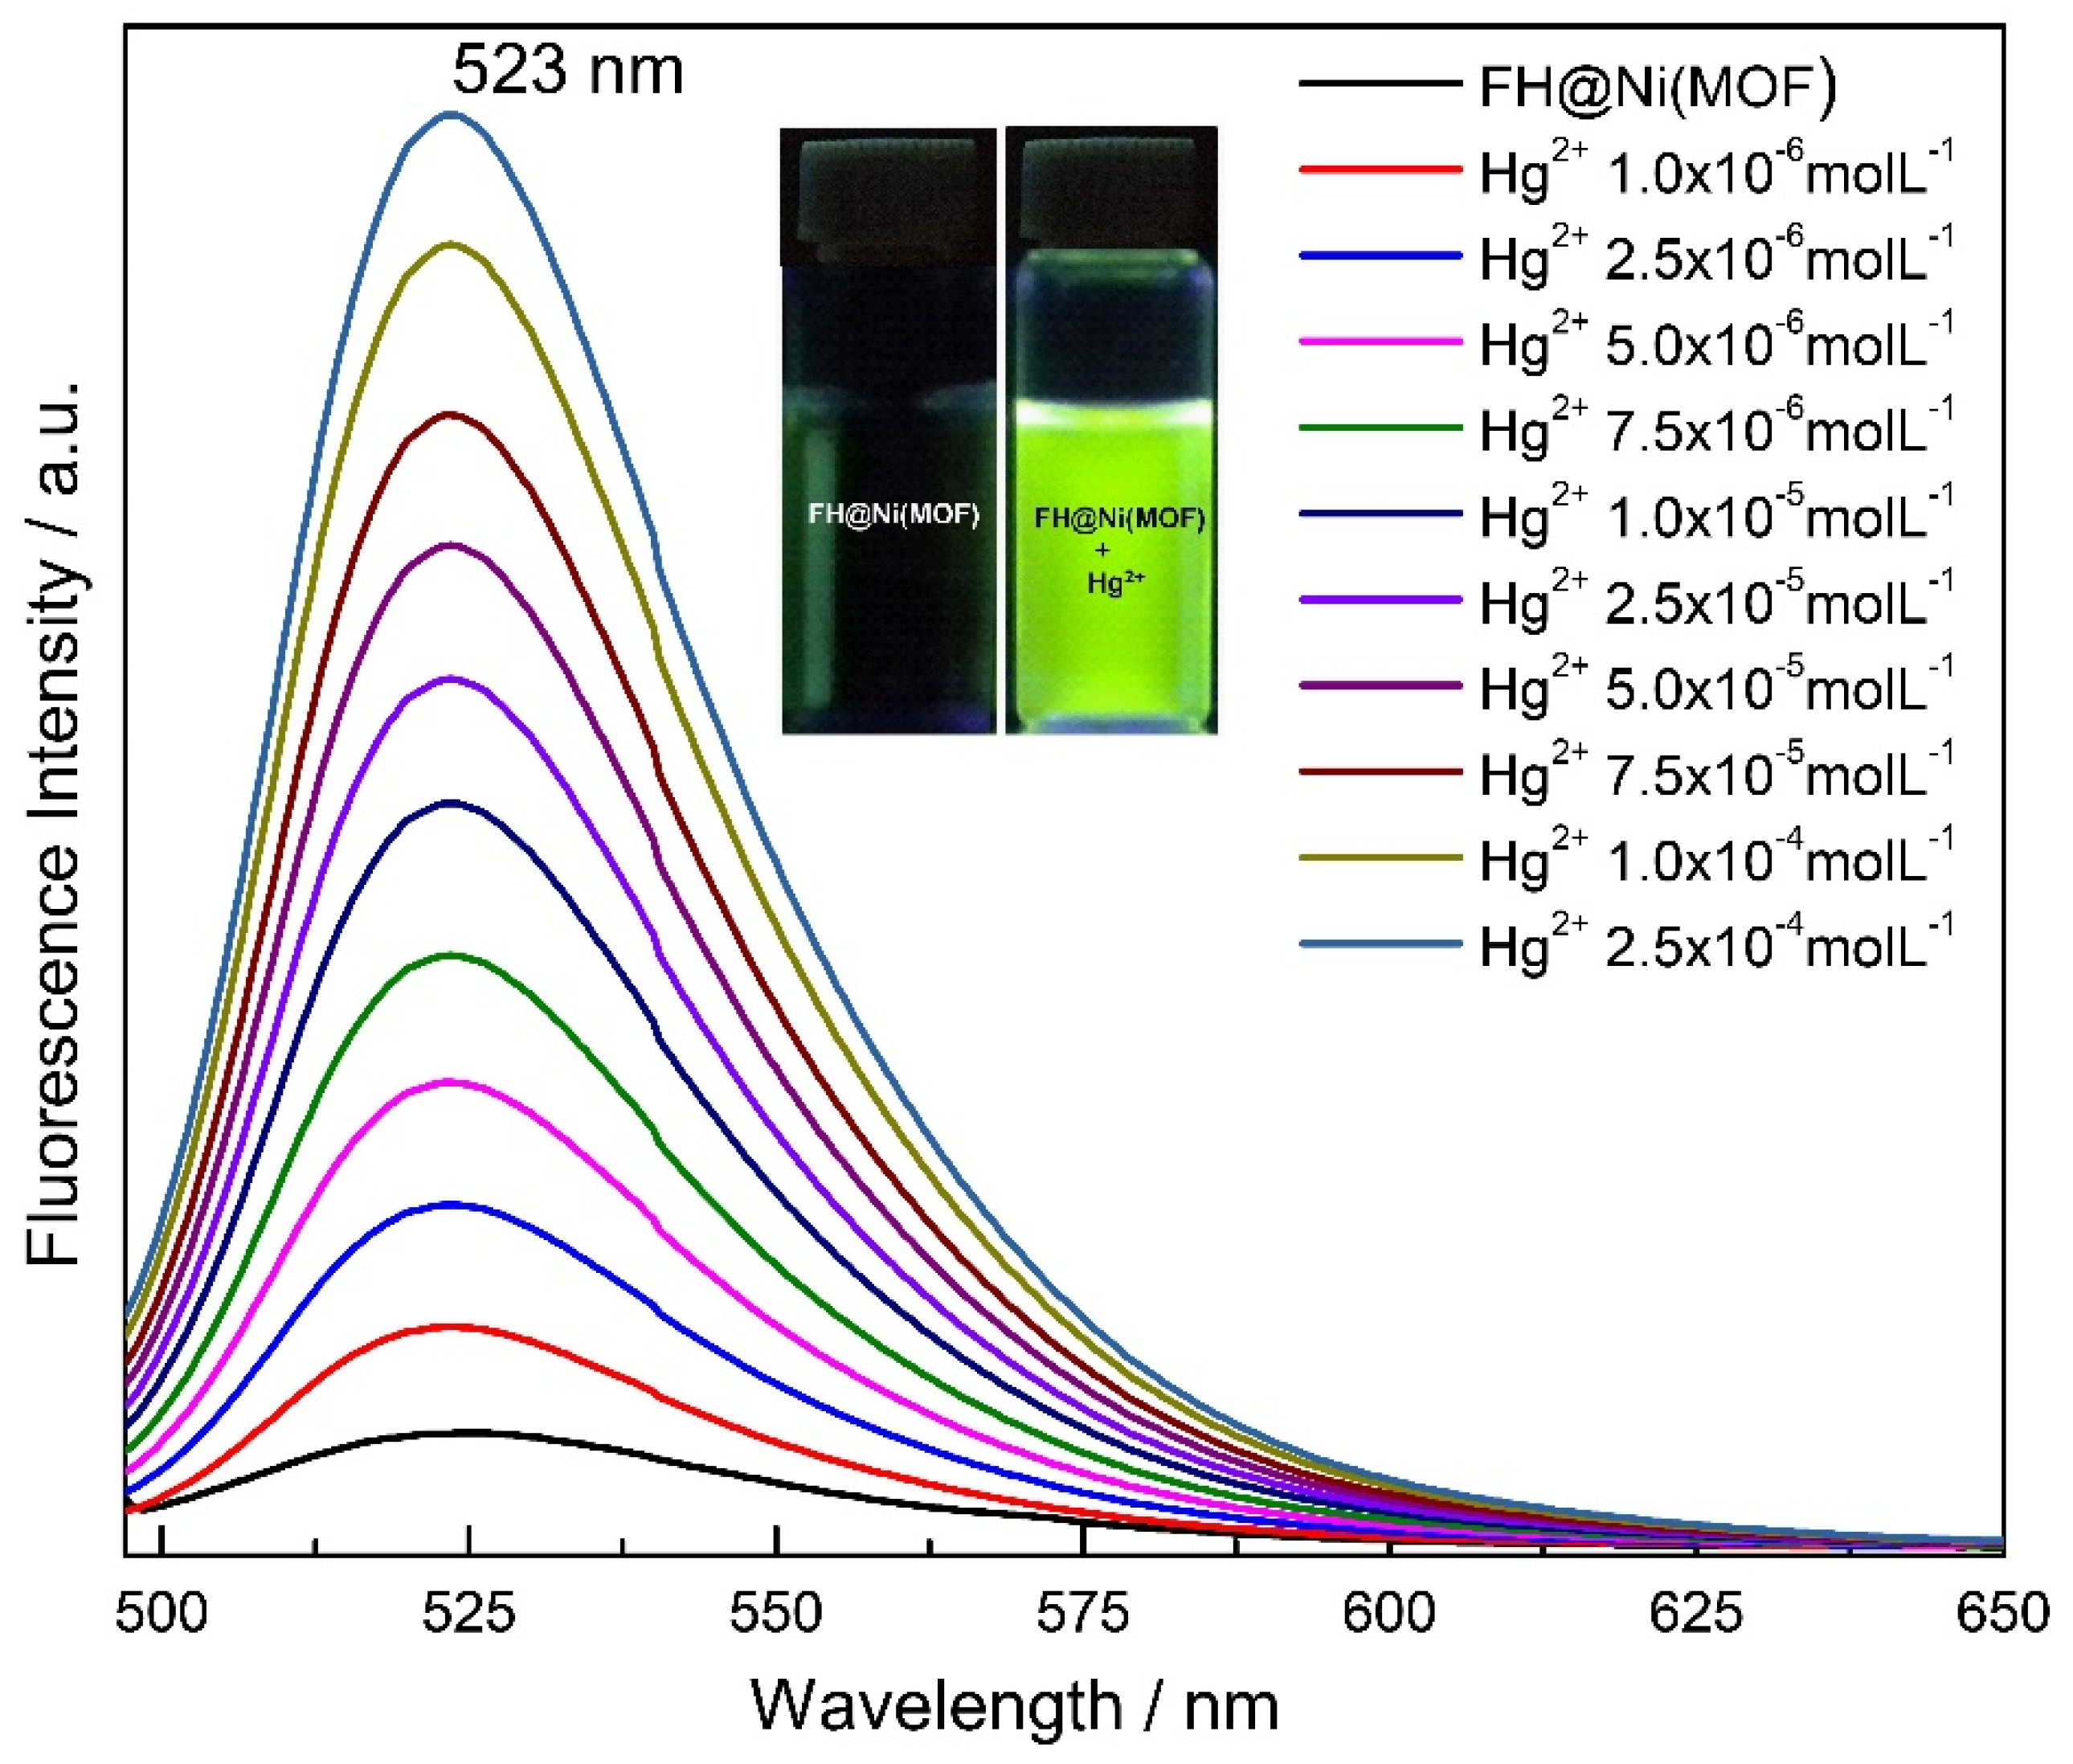
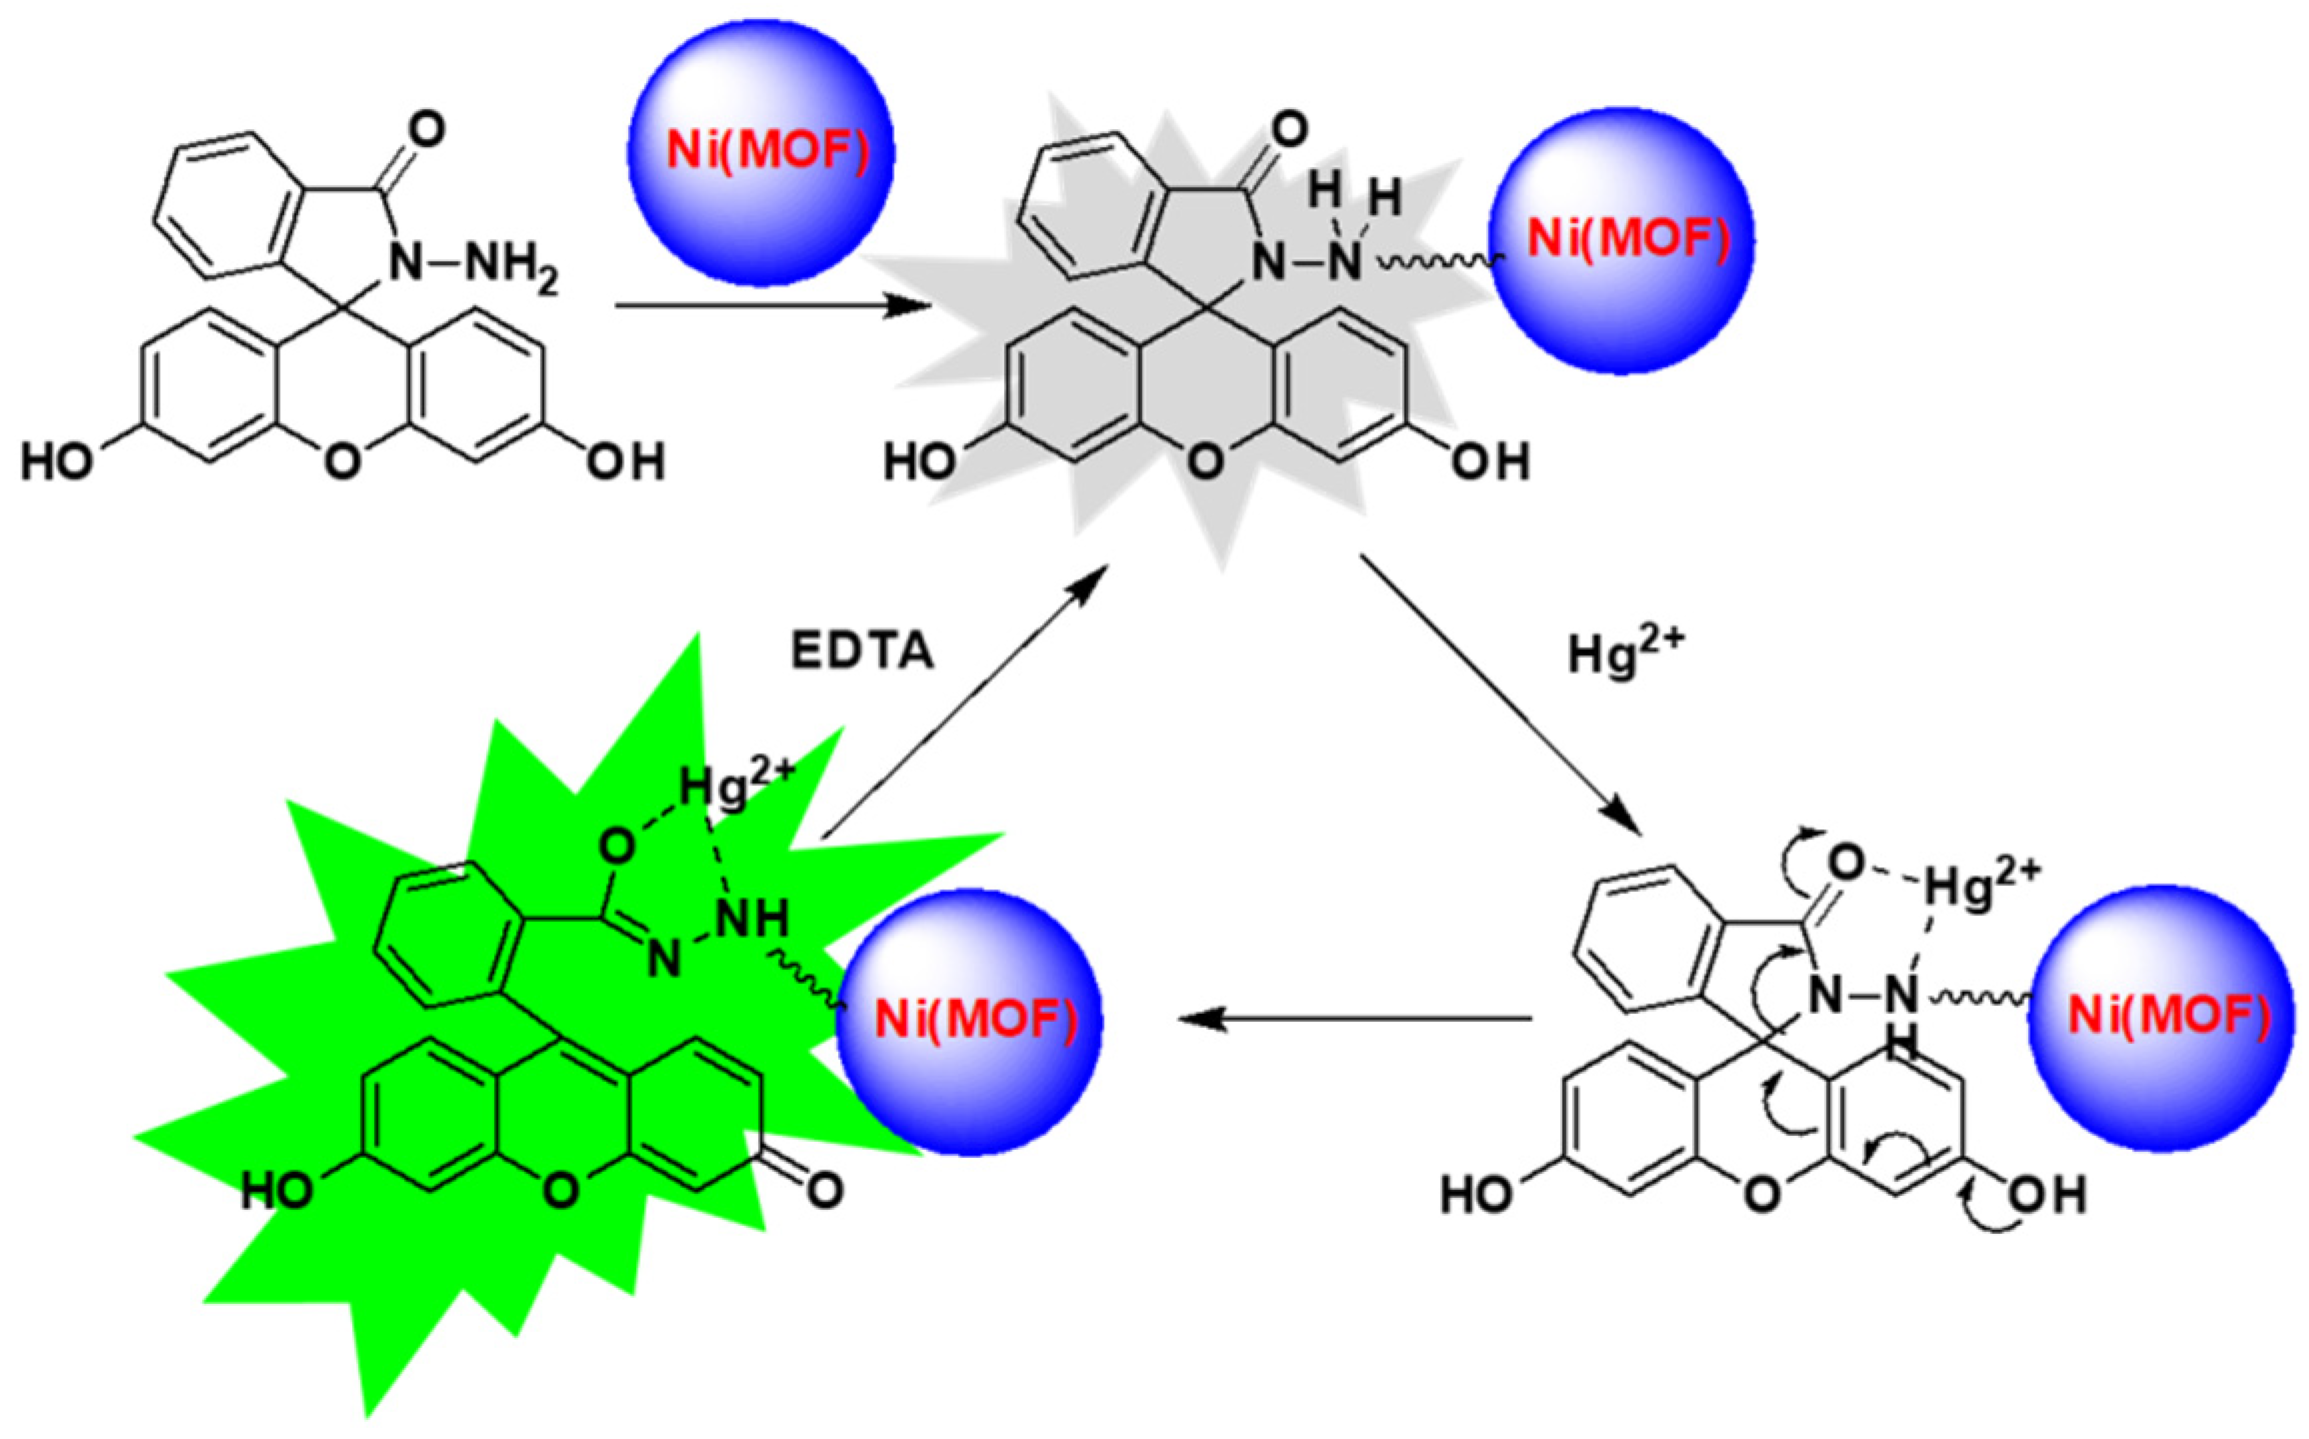
2.2. Cation Sensing Properties of FH@Ni(MOF)

Ni(MOF) does not have effective optical or binding properties for heavy metals. Nevertheless, it produces both optical and selective binding properties with heavy metals when forming a composite with fluorescein hydrazide. Thus, the absorbance and emission studies of FH@Ni(MOF) were carried out in an aqueous solution such as an emulsion. The FH@Ni(MOF) has an absorption maximum at 362 nm due to the π−π* transition of the aromatic rings. Initial studies with different metal cations indicate that only the Hg2+ ion produces a decrease in the absorbance at 362 nm and the appearance of a new absorption maximum at 583 nm (Figure 4 and Figure S6). This peak is characteristic of the opening of the spirolactam ring and binding with the Hg2+ (Scheme 2). This new absorption triggers the color change of the emulsion from colorless to pink (Figure 5), which is visible to the naked eye. The slow addition of Hg2+ to the emulsion of FH@Ni(MOF) resulted in the formation of the new peak at 583 nm, with a synchronous decrease in the absorbance band at 362 nm (Figure 5). From the UV–vis titration, the binding constant was calculated to be 6.1 × 10⁵ M−1 (error estimated to be ≤10%) (Section S3 and Figure S10) (Supplementary Maerials). Moreover, the Job’s plot experiment of FH@Ni(MOF) with the Hg2+ ion indicated the formation of a 1:1 complex between the fluorescein hydrazide of the FH@Ni(MOF) and the Hg2+ ion (Figure S7).
The emission properties of composite FH@Ni(MOF) were investigated in aqueous emulsion with different biologically and non-biologically relevant cations. It was observed that only Hg2+, in addition to the composite FH@Ni(MOF), produced an enhancement in the emission at 523 nm upon excitation at 460 nm (Figure 6). None of the cations, except Hg2+, induced any noticeable enhancement in emission when interacting with any metal ions. However, transition metal ions Cu2+, Co2+, and Fe3+ induced complete or partial quenching on binding with the chemosensor due to their paramagnetic nature (Figure S8). This high selectivity is likely due to the attachment of the fluorescein hydrazide with the inorganic SBU (secondary building unit) of the Ni(MOF) in the composite FH@Ni(MOF). Upon the slow addition of Hg2+ to FH@Ni(MOF), we detected the enhancement of the peak at 523 nm upon excitation at 460 nm (Figure 7) with the change in the color of the emulsion to green fluorescence (λex = 365 nm) (Figure 7). The augmentation of the peak at 523 nm was linear with the increase in the concentration of the Hg2+. To quantify the complexation nature between the Hg2+ and FH@Ni(MOF), the Job’s plot analysis, in fluorescence, was executed by changing the sensor–cation concentration ratio. The maximum emission in the Job’s plot occurred at the mole fraction of 0.5 or 1:1 metal to metal–MOF complex (Figure S9). The quantum yield calculated from the integrated sphere, before and after the Hg2+ ion binding, was found to be increased from 0.07 to 0.46. This indicates that the complexation of Hg2+ with the FH@Ni(MOF) increases the charge transfer character of the composite, inhibiting the major nonradiative decay pathway. The binding constant between the metal (Hg2+) and the MOF composite (FH@Ni(MOF) obtained from the fluorescence titration was calculated to be 9.4 × 10⁵ M−1 (error estimated to be ≤10%) (Figure 7, Section S3, and Figure S11) [47]. The detection limit for Hg2+ by this sensor was calculated to be 0.02 μM or 20 nM (5 ppb) (Section S4 and Figure S12) [48]. This was found to be lower than the guidelines set by the World Health Organization (WHO) and the United States Environmental Protection Agency (US-EPA) for a maximum contaminant level of Hg2+ in drinking water of 2–6 mg/L (10 nM to 30 nM) [49,50]. The powdered XRD of the Hg2+-bounded FH@Ni(MOF) indicates that the crystallinity of the MOF is intact (Figure 1).
To delve into the possibility of using FH@Ni(MOF) for practical purposes, competitive binding experiments with 200 μL of various metal ions (10−2 M) in the presence of 200 μL of the Hg2+ ion exhibited that there was no interference by any of the metal ions in the enhancement of the emission of FH@Ni(MOF) by Hg2+ (Figure S13).
The mechanism of fluorescence can be demonstrated based on Scheme 3. It can be clearly observed that the binding of the Hg2+ ion with the fluorescein hydrazide leads to the opening of the spirolactam ring, which produces a chromogenic change to a pink color that is visible to the naked eye. Moreover, the binding of the Hg2+ ion with the fluorescein hydrazide produces the chelation enhancement of fluorescence (CHEF), resulting in the enhancement of fluorescence at 523 nm upon excitation at 460 nm. We also checked the UV–Vis absorbance of the Ni(MOF) and FH with different metal ions in water and found that this selective chromogenic change in absorbance is only produced by the FH@Ni(MOF) upon binding with the Hg2+ ion (Figures S14–S16).
In order to measure the recyclable sensing ability of FH@Ni(MOF), the fluorescence- sensing experiments were repeated with the recovered materials. The first set of experiments was followed by washing with a 1.0 M aqueous solution of EDTA (ethylenediaminetetraacetic acid) in order to remove the bounded Hg2+ ions, water, and then drying at 100 °C for 1 h. The recovered FH@Ni(MOF) exhibited no significant change in emission intensity or sensitivity towards detecting Hg2+ ions for seven successive cycles (Figure S17). We also used FH@Ni(MOF) to detect Hg2+ ion in tap water, drinking water, and groundwater using the standard addition method [51]. From Table 1, the recovery yield of Hg2+ ions ranging from 97–101% indicates the efficacy of FH@Ni(MOF) for the detection of Hg2+ ions.

3. Experimental

3.1. Materials and General Methods

3.1.1. Chemicals Used in This Work

Trimesic acid (BTC) (95%), nickel nitrate hexahydrate (99.9% purity), fluorescein (99.9% purity), N,N-dimethylformamide (DMF; 99.8% purity), ethanol (99.9% purity), dichloromethane (99.8% extra dry grade), and all other nitrates or chlorides of the metal salts were purchased from Sigma Aldrich Corporation, USA. NMR solvents: dimethyl sulfoxide-d6 (DMSO-d6; 99.9% purity) was purchased from Cambridge Isotope. All chemicals were used without further purification. The water used in this work was double-distilled and filtered through a Millipore membrane. The solutions of metal ions were prepared from their nitrate and chloride salts, and anions were prepared from their sodium and potassium salts (analytical grade), followed by subsequent dilution to prepare the working solutions.

3.1.2. Instrumentation

Powdered X-ray diffraction patterns of the samples were recorded using a Rigaku MiniFlex diffractometer, which was equipped with Cu-Kα radiation. The data were acquired over the 2θ range of 5° and 30°. The FT-IR spectra of FH@Ni(MOF) were obtained using a Nicolet 6700 Thermo Scientific, USA instrument in the range of 400–4000 cm−1 using KBr. Thermogravimetric analysis (TGA) of the samples were performed using a TA Q500, USA. In this study, an activated sample of FH@Ni(MOF) (10 mg) was heated in an alumina pan under airflow (60 mL min−1) with a gradient of 10 °C min−1 in the temperature range of 30–800 °C. The N2 adsorption isotherm of the MOFs for the BET surface area was calculated using a Micromeritics ASAP 2020 instrument, USA. The surface morphology of these materials were discerned using a field emission-scanning electron microscope (FESEM, LYRA 3 Dual Beam, Tescan, USA), which operated at 30 kV. The FESEM samples were prepared from suspension in ethanol. The absorption spectra of the MOF were studied using a Jasco V-670 spectrophotometer. Fluorescence spectra were measured using a Jasco, Spectrophotometer FP-8500, Japan equipped with a xenon discharge lamp and 1 cm quartz cells with a slit width of 2 nm for both the source and the detector. Quantum yield studies were carried out using a Fluoromax-4 equipped with Quanta-Phi integration sphere (Horiba), using a liquid sample holder at room temperature.

3.1.3. Sample Preparation for Photophysical Studies

In a typical luminescence-sensing experimental setup, 1.0 mg of FH@Ni(MOF) powder was dispersed in 1 mL of water. A volume of 3 mL of dispersed aqueous solution of FH@Ni(MOF) was placed in a 1 cm quartz cuvette, and the absorption and emission responses were measured in situ after the incremental addition of freshly prepared analyte solutions. The mixtures were sonicated for 5 min after each incremental addition of the analytes for uniform dispersion during the luminescent measurements. All of the measurements were performed at 298 K.

3.1.4. Practical Application in Water Samples

FH@Ni(MOF) was used for the detection of Hg2+ in tap water, drinking water, and ground water via the standard addition method. All the water samples were filtered three times through a 0.2 mm membrane filter. Then, these three water samples were spiked with 10 and 15 μM of Hg2+ and titrated against the FH@Ni(MOF).

3.2. Synthesis

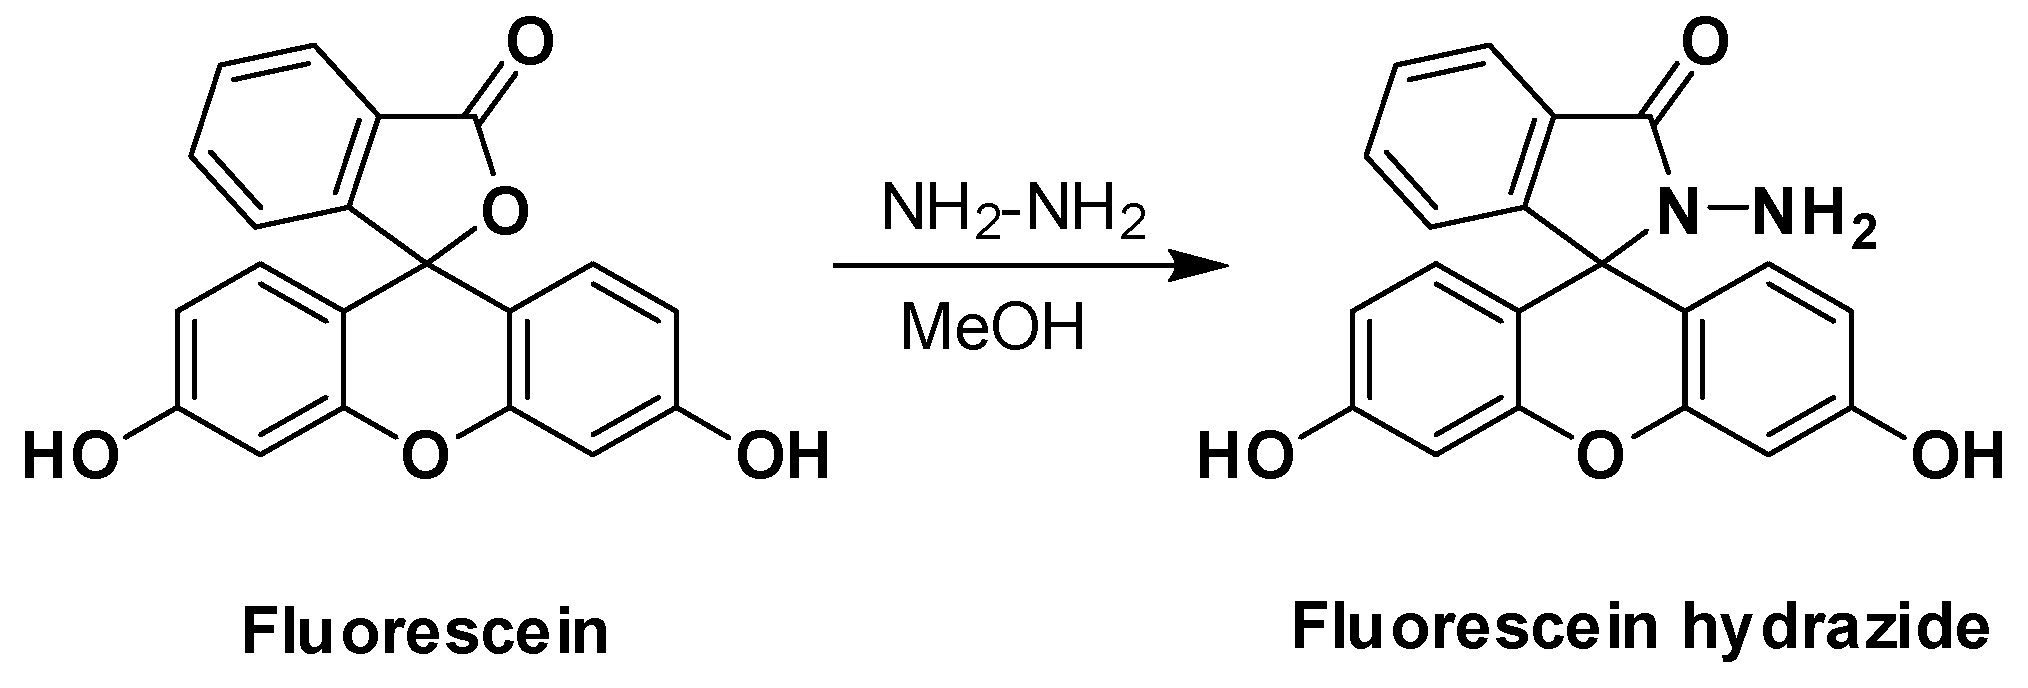
3.2.1. Synthesis of Fluorescein Hydrazide (FH)

Fluorescein (500 mg, 1.44 mmol) was dissolved in 20 mL methanol and to it was added an excess amount of hydrazine hydrate (0.25 mL, 5.05 mmol). The reaction mixture was refluxed for 4 h and then cooled to room temperature, poured into distilled water, and extracted with ethyl acetate (6 × 25 mL). The combined extract was washed with brine, dried with anhydrous sodium sulphate, filtered, and then concentrated under a reduced pressure to yield (71%) FH [52,53]. 1H NMR (400 MHz, DMSO-d6), δ (ppm): 6.47–6.39 (m, 4H), 6.60 (d, J= 3.0 Hz, 2H), 7.00–6.98 (m, 1H), 7.49 (t, J= 4.0 Hz, 2H), 7.79–7.77 (m, 1H), 9.84 (s, 2H). 13C NMR (100 MHz, DMSO-d6), δ (ppm): 65.12, 102.82, 110.43, 112.48, 122.84, 123.89, 128.43, 128.89, 129.78, 133.10, 152.00, 152.88, 158.66, 165.99 (Figures S1 and S2).

3.2.2. Synthesis of Ni(MOF)

The Ni(MOF) [Ni3(BTC)2(H2O)3]·(DMF)3(H2O)3 was prepared by the same method as that reported in the literature [46]. Ni-MOF was synthesized by dissolving Ni(NO3)2. 6H2O (291 mg, 1.0 mmol), and Trimesic acid (BTC) (210 mg, 1.0 mmol) in DMF (20 mL) with ultrasonic vibration for 15 min, then 5 mL of acetic acid was added. The as-obtained mixture was transferred to a 40 mL Parr steel autoclave and heated at 448 K for 72 h. Then, the autoclave was cooled in air to room temperature. The resulting green icosahedral-shaped crystals were collected and washed with 3 × 10 mL of DMF for 3 days and 3 × 10 mL of CH2Cl2 for 3 days, yielding the required Ni-MOF in a 35% yield (related to the nickel salt).

3.2.3. Synthesis of FH@Ni(MOF)

The Ni(MOF) was activated by heating the MOF at 150 °C in a vacuum oven for 6 h. The activated MOF (100 mg) was then suspended in ethanol (10 mL) containing fluorescein hydrazide (FH) (200 mg, 0.55 mmol), and refluxed at 358 K for 48 h. Then, the vial was cooled in air to room temperature. The resulting FH@Ni(MOF) was washed three times with DMF (5–10 mL) using a centrifuge (10,000 rpm for 30 min) and then sequentially immersed in methanol (5–10 mL three times per day) for three 24 h periods. The washing with methanol was continued until the washing solution did not contain any residual dye, which was confirmed by absorption studies of the methanol extracts obtained after washing. This justified the fact that no dye was leaching from the FH@Ni(MOF) powder. Finally, FH@Ni(MOF) was dried by removing the solvent under vacuum for 24 h at 80 °C. FT-IR (KBr, cm−1): 3415, 1680, 1629, 1579, 1499, 1439, 1378, 1185, 1111, 936, 836, 795, 754, 701. Anal. Calcd for C144H108N12O33Ni3[Ni3(BTC)2(H2O)3]. (C21H16N2O3)6: C 63.81; H 4.02; N 6.20; Found: C, 62.78; H, 4.15; N, 6.37.

4. Conclusions

In conclusion, we prepared a composite FH@Ni(MOF) by appending fluorescein hydrazide with the inorganic SBU of Ni(MOF). The composite was characterized by PXRD, FTIR, XPS, N2 adsorption isotherm, and TGA. This composite was found to act as a highly selective and sensitive optical sensor for Hg2+ ions and could also detect Hg2+ ions in the presence of other metal ions. It was observed that this composite produces a pink color visible to the naked eye and a green fluorescence upon binding with only the Hg2+ ion; none of the other metal ions produce such a chromogenic or fluorogenic change with this sensor. The binding constant was found to be 9.4 × 10⁵ M−1, with a detection limit of 0.02 μM, or 5 ppb. This chemosensor was also found to be reversible and could be used for seven consecutive cycles.

Supplementary Materials

The following are available online. Section S1: Characterization of FH@Ni(MOF); Section S2: Optical Sensing properties of FH@Ni(MOF); Section S3: Determination of the Rate Constant; Section S4: Determination of the detection limit; Section S5: Comparison of Absorbance of FH, Ni(MOF), and FH@Ni(MOF) with metal ions; Section S6: Recyclability of FH@Ni(MOF); Section S7: References.

Author Contributions

Conceptualization, A.H. and M.F.; methodology, A.H., M.N. and M.F.; software, A.H. and M.N.; validation, A.H., M.F. and M.H.Z.; formal analysis, A.H. and M.N.; investigation, A.H. and M.N.; resources, A.H., M.F. and M.H.Z.; data curation, A.H., M.N. and M.F.; writing—original draft preparation, A.H.; writing—A.H., M.N., M.F. and M.H.Z.; visualization, A.H., M.N., M.F. and M.H.Z.; supervision, A.H. and M.H.Z.; project administration, A.H.; funding acquisition, A.H. All authors have read and agreed to the published version of the manuscript.

Funding

This research was funded by King Abdulaziz City for Science and Technology National Science, Technology, and Innovation Plan (NSTIP No. 15-NAN4601-04).

Institutional Review Board Statement

Not applicable.

Informed Consent Statement

Not applicable.

Data Availability Statement

Not applicable.

Acknowledgments

We acknowledge the Center for Research Excellence in Nanotechnology (CENT) for their continued support. This research was supported by King Abdulaziz City for Science and Technology National Science, Technology, and Innovation Plan (NSTIP No. 15-NAN4601-04).

Conflicts of Interest

The authors declare that there are no conflict of interest.

Sample Availability

Not available as further studies on other applications are going on.

References

  1. Budnik, L.T.; Casteleyn, L. Mercury pollution in modern times and its socio-medical consequences. Sci. Total Environ. 2019, 654, 720–734. [Google Scholar] [CrossRef] [PubMed]
  2. Denmark, I.S.; Begu, E.; Arslan, Z.; Han, F.X.; Seiter-Moser, J.M.; Pierce, E.M. Removal of inorganic mercury by selective extraction and coprecipitation for determination of methylmercury in mercury-contaminated soils by chemical vapor generation inductively coupled plasma mass spectrometry (CVG-ICP-MS). Anal. Chim. Acta 2018, 1041, 68–77. [Google Scholar] [CrossRef]
  3. Harris, H.H.; Pickering, I.J.; George, G.N. The chemical form of mercury in fish. Science 2003, 301, 1203. [Google Scholar] [CrossRef] [Green Version]
  4. Tchounwou, P.B.; Ayensu, W.K.; Ninashvili, N.; Sutton, D. Review: Environmental exposure to mercury and its toxico pathologic implications for public health. Environ. Toxicol. 2003, 18, 149–175. [Google Scholar] [CrossRef]
  5. Fu, L.; Xie, K.; Wang, A.; Lyu, F.; Ge, J.; Zhang, L.; Zhang, H.; Su, W.; Hou, Y.L.; Zhou, C.; et al. High selective detection of mercury (II) ions by thioether side groups on metal-organic frameworks. Anal. Chim. Acta. 2019, 1081, 51–58. [Google Scholar] [CrossRef]
  6. Letelier, M.E.; Lepe, A.M.; Faundez, M.; Salazar, J.; Marín, R.; Aracena, P.; Speisky, H. Possible mechanisms underlying copper-induced damage in biological membranes leading to cellular toxicity. Chem. Interact. 2005, 151, 71–82. [Google Scholar] [CrossRef]
  7. Silbergeld, E.K.; Silva, I.A.; Nyland, J.F. Mercury and autoimmunity: Implications for occupational and environmental health. Toxicol. Appl. Pharm. 2005, 207, 282–292. [Google Scholar] [CrossRef]
  8. Hoyle, I.; Handy, R. Dose-dependent inorganic mercury absorption by isolated perfused intestine of rainbow trout, Oncorhynchus mykiss, involves both amiloride-sensitive and energy-dependent pathways. Aquat. Toxicol. 2005, 72, 147–159. [Google Scholar] [CrossRef] [PubMed]
  9. Boening, D.W. Ecological effects, transport, and fate of mercury: A general review. Chemosphere 2000, 40, 1335–1351. [Google Scholar] [CrossRef]
  10. Wang, C.; Wang, L.; Fang, S.; Qin, D.; Zhou, J.; Yang, G.; Jin, S.; Duan, H. Two novel fluorescent probes based on phenothiazine: Synthesis and “naked-eye” colorimetric recognition of Hg2+. Res. Chem. Intermed. 2019, 45, 2045–2063. [Google Scholar] [CrossRef]
  11. Wei, Y.; Gao, C.; Meng, F.-L.; Li, H.-H.; Wang, L.; Liu, J.-H.; Huang, X.-J. SnO2/Reduced Graphene Oxide Nanocomposite for the Simultaneous Electrochemical Detection of Cadmium(II), Lead(II), Copper(II), and Mercury(II): An Interesting Favorable Mutual Interference. J. Phys. Chem. C 2012, 116, 1034–1041. [Google Scholar] [CrossRef]
  12. Chen, J.; Chen, H.; Jin, X. Determination of ultra-trace amount methyl-, phenyl- and inorganic mercury in environmental and biological samples by liquid chromatography with inductively coupled plasma mass spectrometry after cloud point extraction preconcentration. Talanta 2009, 77, 1381–1387. [Google Scholar] [CrossRef]
  13. de Wuilloud, J.C.; Wuilloud, R.; Silva, M.F.; A Olsina, R.; Martinez, L.D. Sensitive determination of mercury in tap water by cloud point extraction pre-concentration and flow injection-cold vapor-inductively coupled plasma optical emission spectrometry. Spectrochim. Acta Part. B At. Spectrosc. 2002, 57, 365–374. [Google Scholar] [CrossRef]
  14. Chen, G.; Guo, Z.; Zeng, G.; Tang, L. Fluorescent and colorimetric sensors for environmental mercury detection. Analyst 2015, 140, 5400. [Google Scholar] [CrossRef]
  15. Bhowmick, R.; Alam, R.; Mistri, T.; Bhattacharya, D.; Karmakar, P.; Ali, M. Morphology-Directing Synthesis of Rhodamine-Based Fluorophore Microstructures and Application toward Extra- and Intracellular Detection of Hg2+. ACS Appl. Mater. Interfaces 2015, 7, 7476–7485. [Google Scholar] [CrossRef] [PubMed]
  16. Ratner, N.; Mandler, D. Electrochemical Detection of Low Concentrations of Mercury in Water Using Gold Nanoparticles. Anal. Chem. 2015, 87, 5148. [Google Scholar] [CrossRef]
  17. Qi, G.; Fu, C.; Chen, G.; Xu, S.; Xu, W. Highly sensitive SERS sensor for mercury ions based on the catalytic reaction of mercury ion decorated Ag nanoparticles. RSC Adv. 2015, 5, 49759–49764. [Google Scholar] [CrossRef]
  18. Ma, C.; Zeng, F.; Huang, L.; Wu, S. FRET-Based Ratiometric Detection System for Mercury Ions in Water with Polymeric Particles as Scaffolds. J. Phys. Chem. B 2011, 115, 874–882. [Google Scholar] [CrossRef] [PubMed]
  19. Wei, H.; Wang, Z.; Yang, L.; Tian, S.; Hou, C.; Lu, Y. Lysozyme-stabilized gold fluorescent cluster: Synthesis and application as Hg2+ sensor. Analyst 2010, 135, 1406–1410. [Google Scholar] [CrossRef] [Green Version]
  20. Kawasaki, H.; Yoshimura, K.; Hamaguchi, K.; Arakawa, R. Trypsin-Stabilized Fluorescent Gold Nanocluster for Sensitive and Selective Hg2+ Detection. Anal. Sci. 2011, 27, 591. [Google Scholar] [CrossRef] [Green Version]
  21. Dave, N.; Chan, M.Y.; Huang, P.-J.J.; Smith, B.D.; Liu, J. Regenerable DNA-Functionalized Hydrogels for Ultrasensitive, Instrument-Free Mercury(II) Detection and Removal in Water. J. Am. Chem. Soc. 2010, 132, 12668–12673. [Google Scholar] [CrossRef] [PubMed] [Green Version]
  22. He, D.; He, X.; Wang, K.; Zhao, Y.; Zou, Z. Regenerable Multifunctional Mesoporous Silica Nanocomposites for Simultaneous Detection and Removal of Mercury(II). Langmuir 2013, 29, 5896–5904. [Google Scholar] [CrossRef] [PubMed]
  23. Liu, M.; Wang, Z.; Zong, S.; Chen, H.; Zhu, D.; Wu, L.; Hu, G.; Cui, Y. SERS Detection and Removal of Mercury(II)/Silver(I) using Oligonucleotide-Functionalized Core/Shell Magnetic Silica Sphere@Au Nanoparticles. ACS Appl. Mater. Interfaces 2014, 6, 7371. [Google Scholar] [CrossRef] [PubMed]
  24. He, Y.; Zhou, W.; Qian, G.; Chen, B. Methane storage in metal–organic frameworks. Chem. Soc. Rev. 2014, 43, 5657–5678. [Google Scholar] [CrossRef] [PubMed]
  25. Corma, A.; García, H.; Llabrés, F.; Xamen, X. Engineering Metal Organic Frameworks for Heterogeneous Catalysis. Chem. Rev. 2010, 110, 4606–4655. [Google Scholar] [CrossRef] [PubMed]
  26. Li, Y.; Xu, H.; Ouyang, S.; Ye, J. Metal-organic frameworks for photocatalysis. Phys. Chem. Chem. Phys. 2016, 18, 7563–7572. [Google Scholar] [CrossRef]
  27. McKinlay, A.C.; Morris, R.E.; Horcajada, P.; Férey, G.; Gref, R.; Couvreur, P.; Serre, C. BioMOFs: Metal–Organic Frameworks for Biological and Medical Applications. Angew. Chem. Int. Ed. 2010, 49, 6260–6266. [Google Scholar] [CrossRef]
  28. Morozan, A.; Jaouen, F. Metal organic frameworks for electrochemical applications. Energy Environ. Sci. 2012, 5, 9269–9290. [Google Scholar] [CrossRef]
  29. Kreno, L.E.; Leong, K.; Farha, O.K.; Allendorf, M.; Van Duyne, R.P.; Hupp, J.T. Metal–Organic Framework Materials as Chemical Sensors. Chem. Rev. 2012, 112, 1105–1125. [Google Scholar] [CrossRef]
  30. Zhao, Y.; Yang, X.G.; Lu, X.M.; Yang, C.D.; Fan, N.N.; Yang, Z.T.; Wang, L.Y.; Ma, L.F. {Zn6} Cluster Based Metal–Organic Framework with Enhanced Room-Temperature Phosphorescence and Optoelectronic Performances. Inorg. Chem. 2019, 58, 6215–6221. [Google Scholar] [CrossRef]
  31. Zhao, Y.; Wang, L.; Fan, N.-N.; Han, M.-L.; Yang, G.-P.; Ma, L. Porous Zn(II)-Based Metal–Organic Frameworks Decorated with Carboxylate Groups Exhibiting High Gas Adsorption and Separation of Organic Dyes. Cryst. Growth Des. 2018, 18, 7114–7121. [Google Scholar] [CrossRef]
  32. Liu, Y.; Xie, X.-Y.; Cheng, C.; Shao, Z.-S.; Wang, H.-S. Strategies to fabricate metal–organic framework (MOF)-based luminescent sensing platforms. J. Mater. Chem. C 2019, 7, 10743–10763. [Google Scholar] [CrossRef]
  33. Au, V.K.M. Recent Advances in the Use of Metal-Organic Frameworks for Dye Adsorption. Front. Chem. 2020, 8, 708. [Google Scholar] [CrossRef]
  34. Yang, L.-Z.; Wang, J.; Kirillov, A.; Dou, W.; Xu, C.; Fang, R.; Xu, C.-L.; Liu, W.-S. 2D lanthanide MOFs driven by a rigid 3,5-bis(3-carboxy-phenyl)pyridine building block: Solvothermal syntheses, structural features, and photoluminescence and sensing properties. CrystEngComm 2016, 18, 6425–6436. [Google Scholar] [CrossRef]
  35. Zhang, Q.; Jiang, J.; Kirillov, A.M.; Zhang, Y.; Hu, M.; Liu, W.; Yang, L.; Fang, R.; Liu, W. Construction of a Two-Dimensional Composite Derived from TiO2 and SnS2 for Enhanced Photocatalytic Reduction of CO2 into CH4. ACS Sustain. Chem. Eng. 2019, 7, 3203–3212. [Google Scholar] [CrossRef]
  36. Helal, A.; Qamaruddin, M.; Aziz, M.A.; Shaikh, M.N.; Yamani, Z.H. MB-UiO-66-NH2 Metal-Organic Framework as Chromogenic and Fluorogenic Sensor for Hydrazine Hydrate in Aqueous Solution. ChemistrySelect 2017, 2, 7630–7636. [Google Scholar] [CrossRef]
  37. Mondal, T.; Bose, S.; Husain, A.; Ghorai, U.K.; Saha, S.K. White light emission from single dye incorporated metal organic framework. Opt. Mater. 2020, 100, 109706. [Google Scholar] [CrossRef]
  38. Wang, C.; Tian, L.; Zhu, W.; Wang, S.; Wang, P.; Liang, Y.; Zhang, W.; Zhao, H.; Li, G. Dye@bio-MOF-1 Composite as a Dual-Emitting Platform for Enhanced Detection of a Wide Range of Explosive Molecules. ACS Appl. Mater. Interfaces 2017, 9, 20076–20085. [Google Scholar] [CrossRef]
  39. Zhang, N.; Zhang, D.; Zhao, J.; Xia, Z. Fabrication of a dual-emitting dye-encapsulated metal–organic framework as a sSection fluorescent sensor for metal ion detection. Dalton Trans. 2019, 48, 6794–6799. [Google Scholar] [CrossRef]
  40. Diet, D.; Hintz, H.; Rühle, B.; Günne, J.S.; Langhals, H.; Wuttke., S. Switch-On Fluorescence of a Perylene-Dye-Functionalized Metal–Organic Framework through Postsynthetic Modification. Chem. Eur. J. 2015, 21, 10714–10720. [Google Scholar]
  41. Zhang, T.; Guo, X.; Shi, Y.; He, C.; Duan, C. Dye-incorporated coordination polymers for direct photocatalytic trifluoromethylation of aromatics at metabolically susceptible positions. Nat. Commun. 2018, 9, 4024. [Google Scholar] [CrossRef] [Green Version]
  42. Yu, J.; Cui, Y.; Xu, Y.; Yang, Y.; Wang, Z.; Chen, B.; Qian, G. Confinement of pyridinium hemicyanine dye within an anionic metal-organic framework for two-photon-pumped lasing. Nat. Commun. 2013, 4, 2719. [Google Scholar] [CrossRef] [PubMed] [Green Version]
  43. Chueh, C.-C.; Chen, C.-I.; Su, Y.-A.; Konnerth, H.; Gu, Y.-J.; Kung, C.-W.; Wu, K.C.-W. Harnessing MOF materials in photovoltaic devices: Recent advances, challenges, and perspectives. J. Mater. Chem. A 2019, 7, 17079–17095. [Google Scholar] [CrossRef]
  44. Duan, Y.; Liu, M.; Sun, W.; Wang, M.; Liu, S.; Li, Q. Recent Progress on Synthesis of Fluorescein Probes. Mini-Rev. Org. Chem. 2009, 6, 35–43. [Google Scholar] [CrossRef]
  45. Oliveira, E.; Bértolo, E.; Núñez, C.; Pilla, V.; Santos, H.M.; Fernández-Lodeiro, J.; Fernández-Lodeiro, A.; Djafari, J.; Capelo, J.L.; Lodeiro, C. Green and Red Fluorescent Dyes for Translational Applications in Imaging and Sensing Analytes: A Dual-Color Flag. ChemistryOpen 2018, 7, 9–52. [Google Scholar] [CrossRef] [PubMed]
  46. Helal, A.; Fettouhi, M.; Arafat, E.; Khan, M.Y.; Sanhoob, M.A. Nickel based metal-organic framework as catalyst for chemical fixation of CO2 in oxazolidinone synthesis. J. CO2 Util. 2021, 50, 101603. [Google Scholar] [CrossRef]
  47. Fery-Forgues, S.; Le Bris, M.-T.; Guett, J.-P.; Valeur, B. Ion-responsive fluorescent compounds. 1. Effect of cation binding on photophysical properties of benzoxazinone derivative linked to monoaza-15-crown-5. J. Phys. Chem. 1988, 92, 6233–6237. [Google Scholar] [CrossRef]
  48. Lv, R.; Wang, J.; Zhang, Y.; Li, H.; Yang, L.; Liao, S.; Gu, W.; Liu, X. An amino-decorated dual-functional metal–organic framework for highly selective sensing of Cr (III) and Cr (VI) ions and detection of nitroaromatic explosives. J. Mater. Chem. A 2016, 4, 15494–15500. [Google Scholar] [CrossRef]
  49. Roditi, E.; Tsetsoni, M.; Kokkinos, C.; Economou, A. Integrated on-chip sensor with sputtered Ag-Au-Au electrodes for the voltammetric determination of trace Hg(II). Sens. Actuators B Chem. 2019, 286, 125–130. [Google Scholar] [CrossRef]
  50. Lin, W.C.; Hu, J.W.; Chen, K.Y. A ratiometric chemodosimeter for highly selective naked-eye and fluorogenic detection of cyanide. Anal. Chim. Acta 2015, 893, 91–100. [Google Scholar] [CrossRef]
  51. Zhao, G.; Sun, Y.; Duan, H. Four xanthene–fluorene based probes for the detection of Hg2+ ions and their application in strip tests and biological cells. N. J. Chem. 2021, 45, 685–695. [Google Scholar] [CrossRef]
  52. Saha, S.; Das, S.; Das, S.; Samanta, A.; Maitra, S.; Sahoo, P. Prompt detection of endogenous hypochlorite (ClO−) in murine macrophages and zebrafish embryos facilitated by a distinctive chemodosimetric mode. Org. Biomol. Chem. 2020, 18, 6716–6723. [Google Scholar] [CrossRef] [PubMed]
  53. Christus, A.A.B.; Panneerselvam, P.; Ravikumar, A.; Marieeswaran, M.; Sivanesan, S. MoS2 nanosheet mediated ZnO–g-C3N4 nanocomposite as a peroxidase mimic: Catalytic activity and application in the colorimetric determination of Hg(II). RSC Adv. 2019, 9, 4268. [Google Scholar] [CrossRef] [Green Version]
Scheme 1. Synthesis of fluorescein hydrazide (FH).
Molecules 26 05773 sch001
Scheme 2. Synthesis of FH@Ni(MOF) from Ni(MOF).
Molecules 26 05773 sch002
Figure 1. Powder X-ray diffraction (PXRD) analysis of FH@Ni(MOF). The simulated pattern (black) of Ni(MOF) matches well with the as-synthesized sample of Ni(MOF) (red), activated Ni(MOF) (blue), FH-appended sample FH@Ni(MOF) (brown), and FH@Ni(MOF) after the addition of Hg2+ (green).
Molecules 26 05773 g001
Figure 2. Thermogravimetric analysis of FH@Ni(MOF).
Molecules 26 05773 g002
Figure 3. N2 adsorption isotherm of Ni(MOF) and FH@Ni(MOF).
Molecules 26 05773 g003
Figure 4. Change in the UV–vis absorbance of FH@Ni(MOF) in water upon addition of 200 μL of different metal cations (10−2 M).
Molecules 26 05773 g004
Figure 5. Changes in the UV–vis spectra of FH@Ni(MOF) with the incremental addition of Hg2+ (10−2 M) in water. Inset: change in the color of FH@Ni(MOF) upon the addition of Hg2+.
Molecules 26 05773 g005
Figure 6. Change in the fluorescence intensity of FH@Ni(MOF) in water upon the addition of 200 μL of different metal cations (10−2 M).
Molecules 26 05773 g006
Figure 7. Changes in fluorescence emission spectra of FH@Ni(MOF) with the incremental addition of Hg2+ (10−2 M) in water (λex = 460 nm). Inset: fluorogenic changes in FH@Ni(MOF) upon the addition of Hg2+ in water upon illumination at 365 nm.
Molecules 26 05773 g007
Scheme 3. Schematic illustration of the mechanism for the detection of Hg2+ by FH@Ni(MOF).
Molecules 26 05773 sch003
Table 1. Determination of Hg2+ ions in water samples.
SampleHg2+ Ion (M) SpikedHg2+ Ion (M) DetectedRecovery (%)
Tap Water1010.09100.9
1514.6997.93
Drinking Water1010.1101.0
1514.5897.2
Groundwater109.7197.1
1514.7198.07
FH@Ni(MOF) was used for the detection of Hg2+ by the standard addition method. All the water samples were filtered three times through a 0.2 mm membrane filter.
Publisher’s Note: MDPI stays neutral with regard to jurisdictional claims in published maps and institutional affiliations.

