
New Amino Acid Schiff Bases as Anticancer Agents via Potential Mitochondrial Complex I-Associated Hexokinase Inhibition and Targeting AMP-Protein Kinases/mTOR Signaling Pathway


Abstract
:1. Introduction
2. Materials and Methods
2.1. Chemicals and Drugs
2.1.1. General Information
2.1.2. Synthesis of 2-Phenyl-4H-benzo[d][1,3] Oxazin-4-one (1)
2.1.3. Synthesis of 3-(4-Acetylphenyl)-2-phenylquinazolin-4(3H)-one (2)
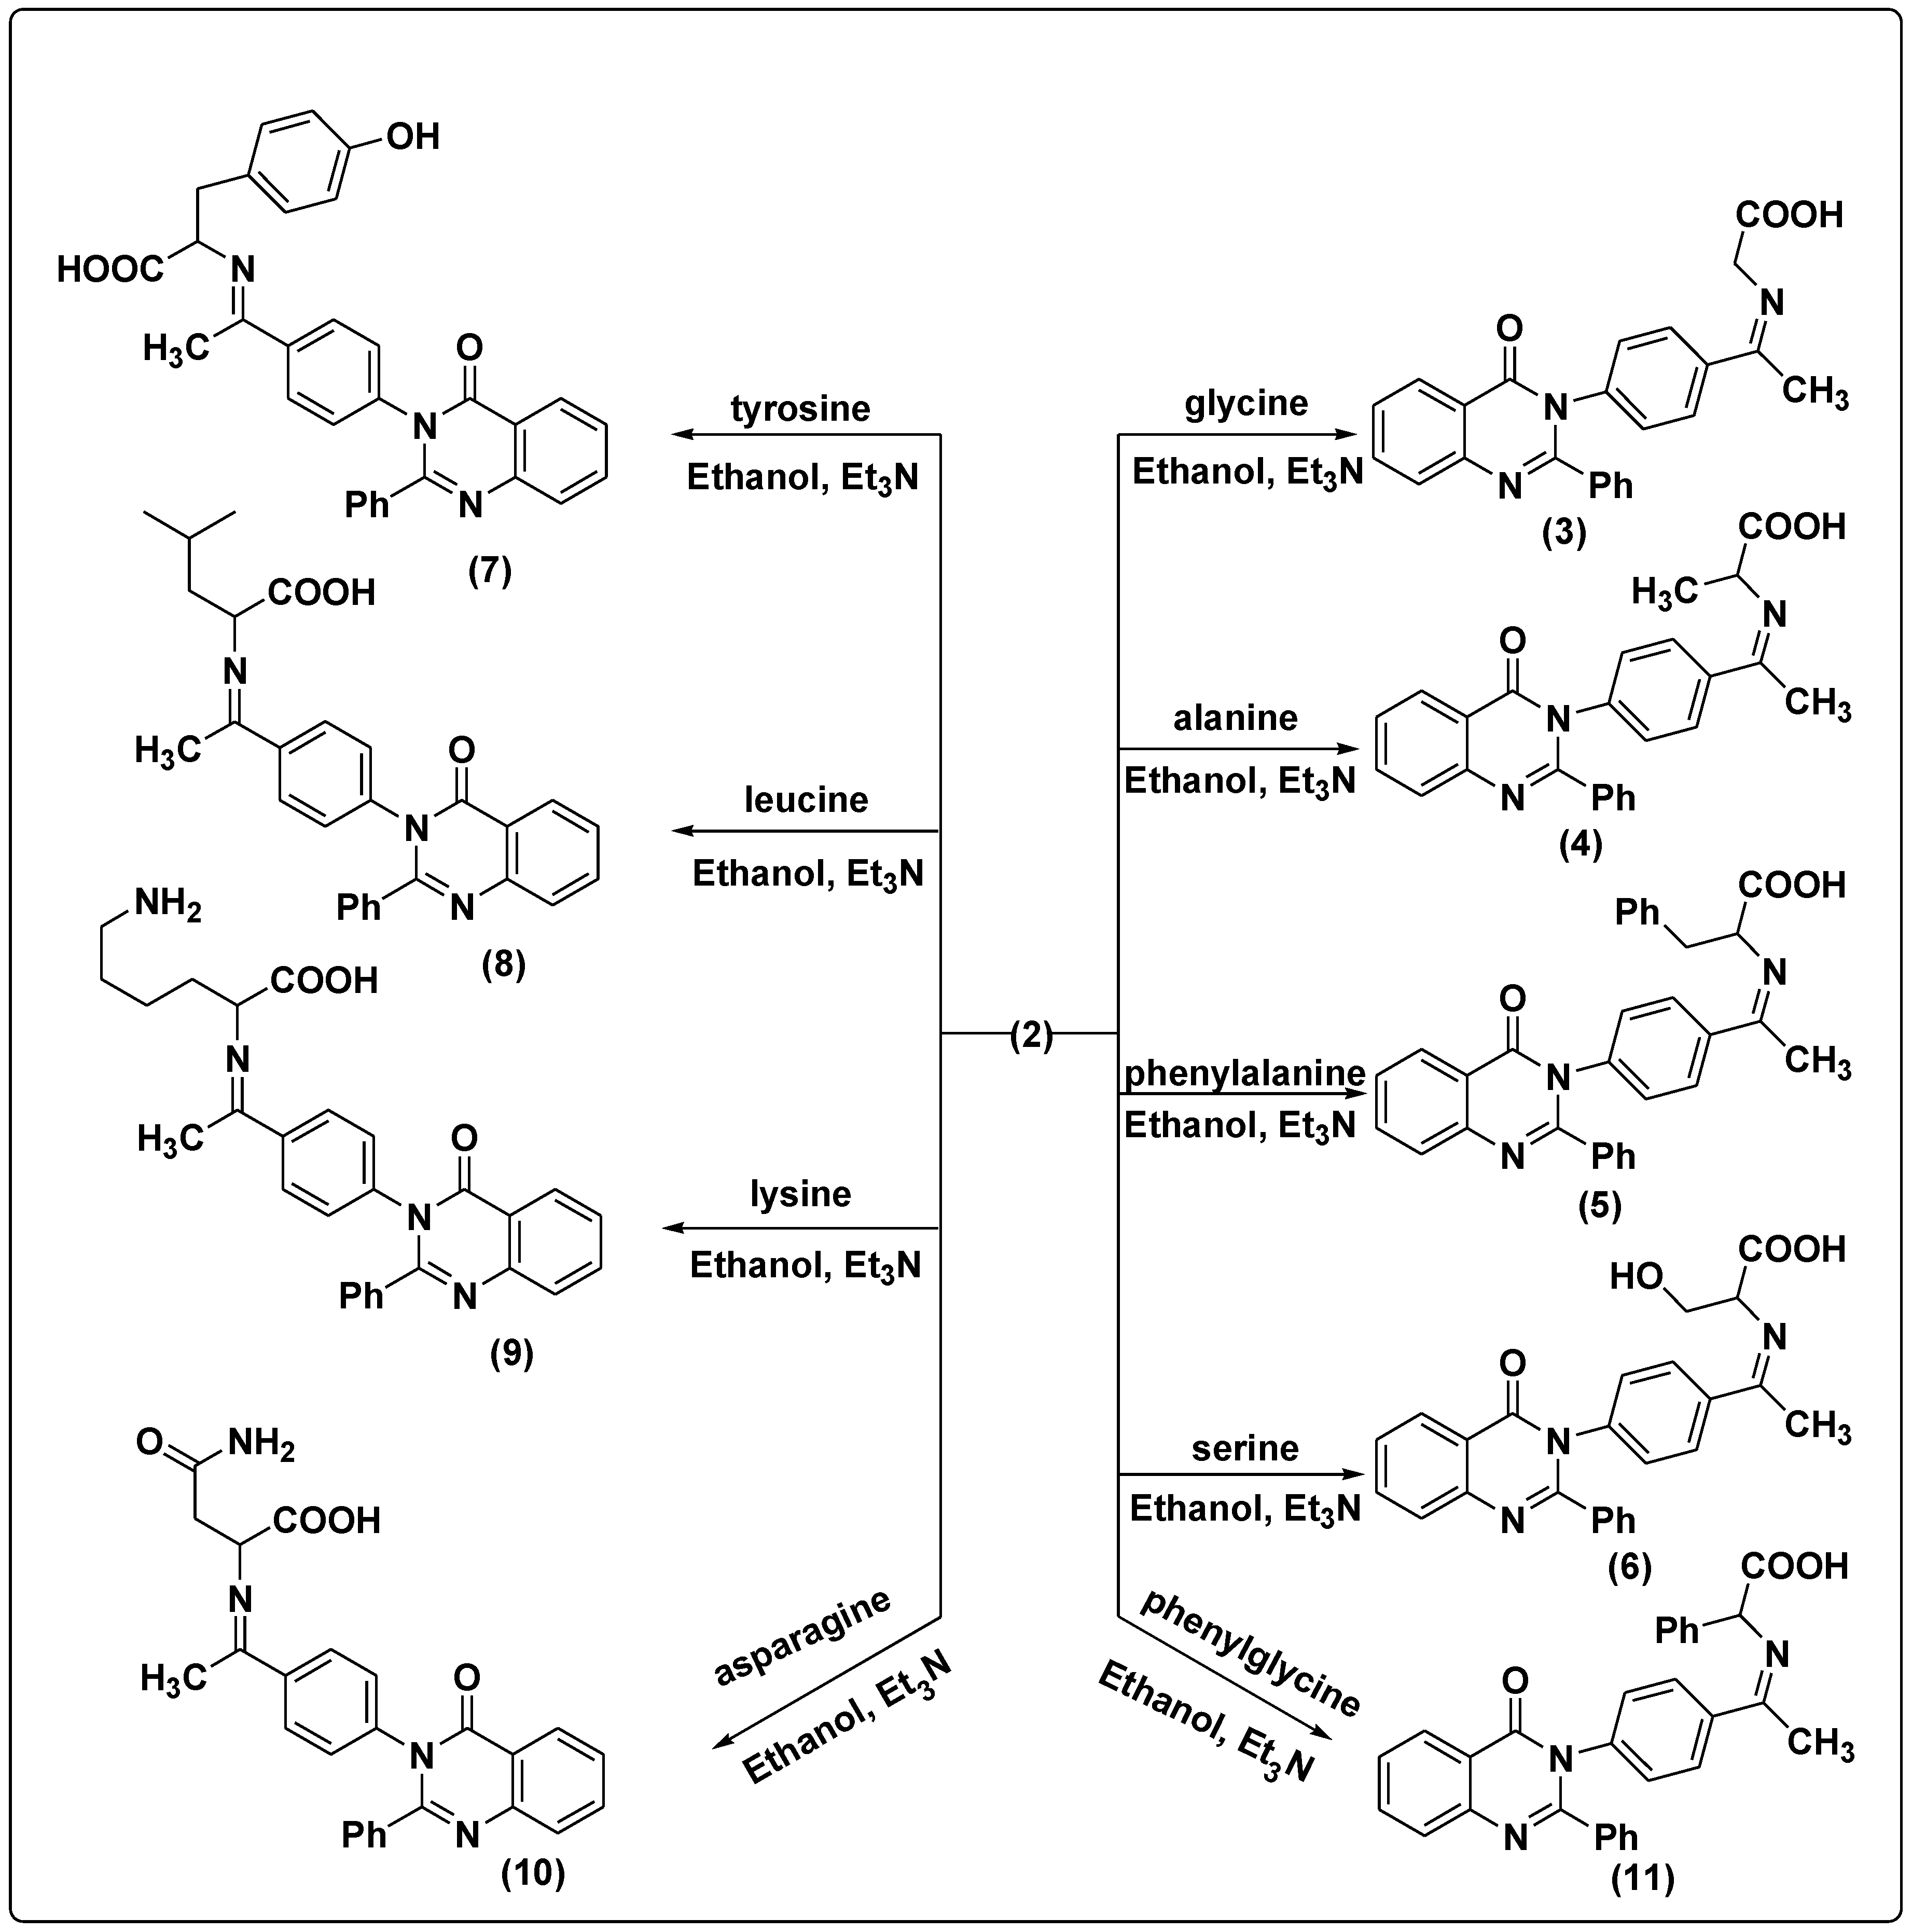
2.1.4. Synthesis of Amino Acid Schiff Bases
2-(1-(4-(4-oxo-2-Phenylquinazolin-3(4H)-yl) phenyl) ethylideneamino) Acetic Acid (3)
2-(1-(4-(4-oxo-2-Phenylquinazolin-3(4H)-yl) phenyl) ethylideneamino) Propionic Acid (4)
2-(1-(4-(4-oxo-2-Phenylquinazolin-3(4H)-yl) phenyl) ethylidene amino)-3-phenyl Propionic Acid (5)
3-Hydroxy-2-(1-(4-(4-oxo-2-phenylquinazolin-3(4H)-yl) phenyl) ethylidene amino) Propionic Acid (6)
3-(4-Hydroxyphenyl)-2-(1-(4-(4-oxo-2-phenylquinazolin-3(4H)-yl) phenyl) ethylidene amino) Propionic Acid (7)
4-Methyl-2-(1-(4-(4-oxo-2-phenylquinazolin-3(4H)-yl) phenyl) ethylideneamino) Pentanoic Acid (8)
6-Amino-2-(1-(4-(4-oxo-2-phenylquinazolin-3(4H)-yl) phenyl) ethylideneamino) Hexanoic Acid (9)
4-Amino-4-oxo-2-(1-(4-(4-oxo-2-phenylquinazolin-3(4H)-yl) phenyl) ethylidene amino) Butanoic Acid (10)
2-(1-(4-(4-oxo-2-Phenylquinazolin-3(4H)-yl) phenyl) ethylideneamino)-2-phenyl Acetic Acid (11)
2-((1H-Indol-3-yl) methyleneamino) Acetic Acid (12)
2-((1H-Indol-3-yl)methyleneamino) Propionic Acid (13)
2-((1H-Indol-3-yl) methyleneamino)-3-phenylpropionic Acid (14)
2-((1H-Indol-3-yl) methyleneamino)-3-hydroxy Propionic Acid (15)
2-((1H-Indol-3-yl) methyleneamino)-3-(4-hydroxyphenyl) Propionic Acid (16)
2-((1H-Indol-3-yl) methyleneamino)-4-methylpentanoic Acid (17)
2-((1H-Indol-3-yl) methyleneamino)-6-aminohexanoic Acid (18)
2-((1H-Indol-3-yl)methyleneamino)-4-amino-4-oxobutanoic Acid (19)
2-((1H-indol-3-yl)methyleneamino)-2-phenylacetic Acid (20)
2.2. In Silico Study
2.3. In Vitro Anticancer Studies on Predicted Compounds
2.3.1. Cell Culture, Maintenance, and Treatment
2.3.2. Cell Cytotoxicity Assay by MTT
2.3.3. Cell Cycle Analysis
2.3.4. QPCR Analysis
2.3.5. Detection of Hexokinase Activity Level (ELISA)
2.3.6. Estimation of Oxidative/Antioxidant Biomarkers
2.3.7. Immunoblotting Analysis
2.3.8. Statistical Analysis
3. Results and Discussion
3.1. Chemistry of the Synthesized Compounds
3.2. In Silico Docking Study
3.3. In Vitro Studies
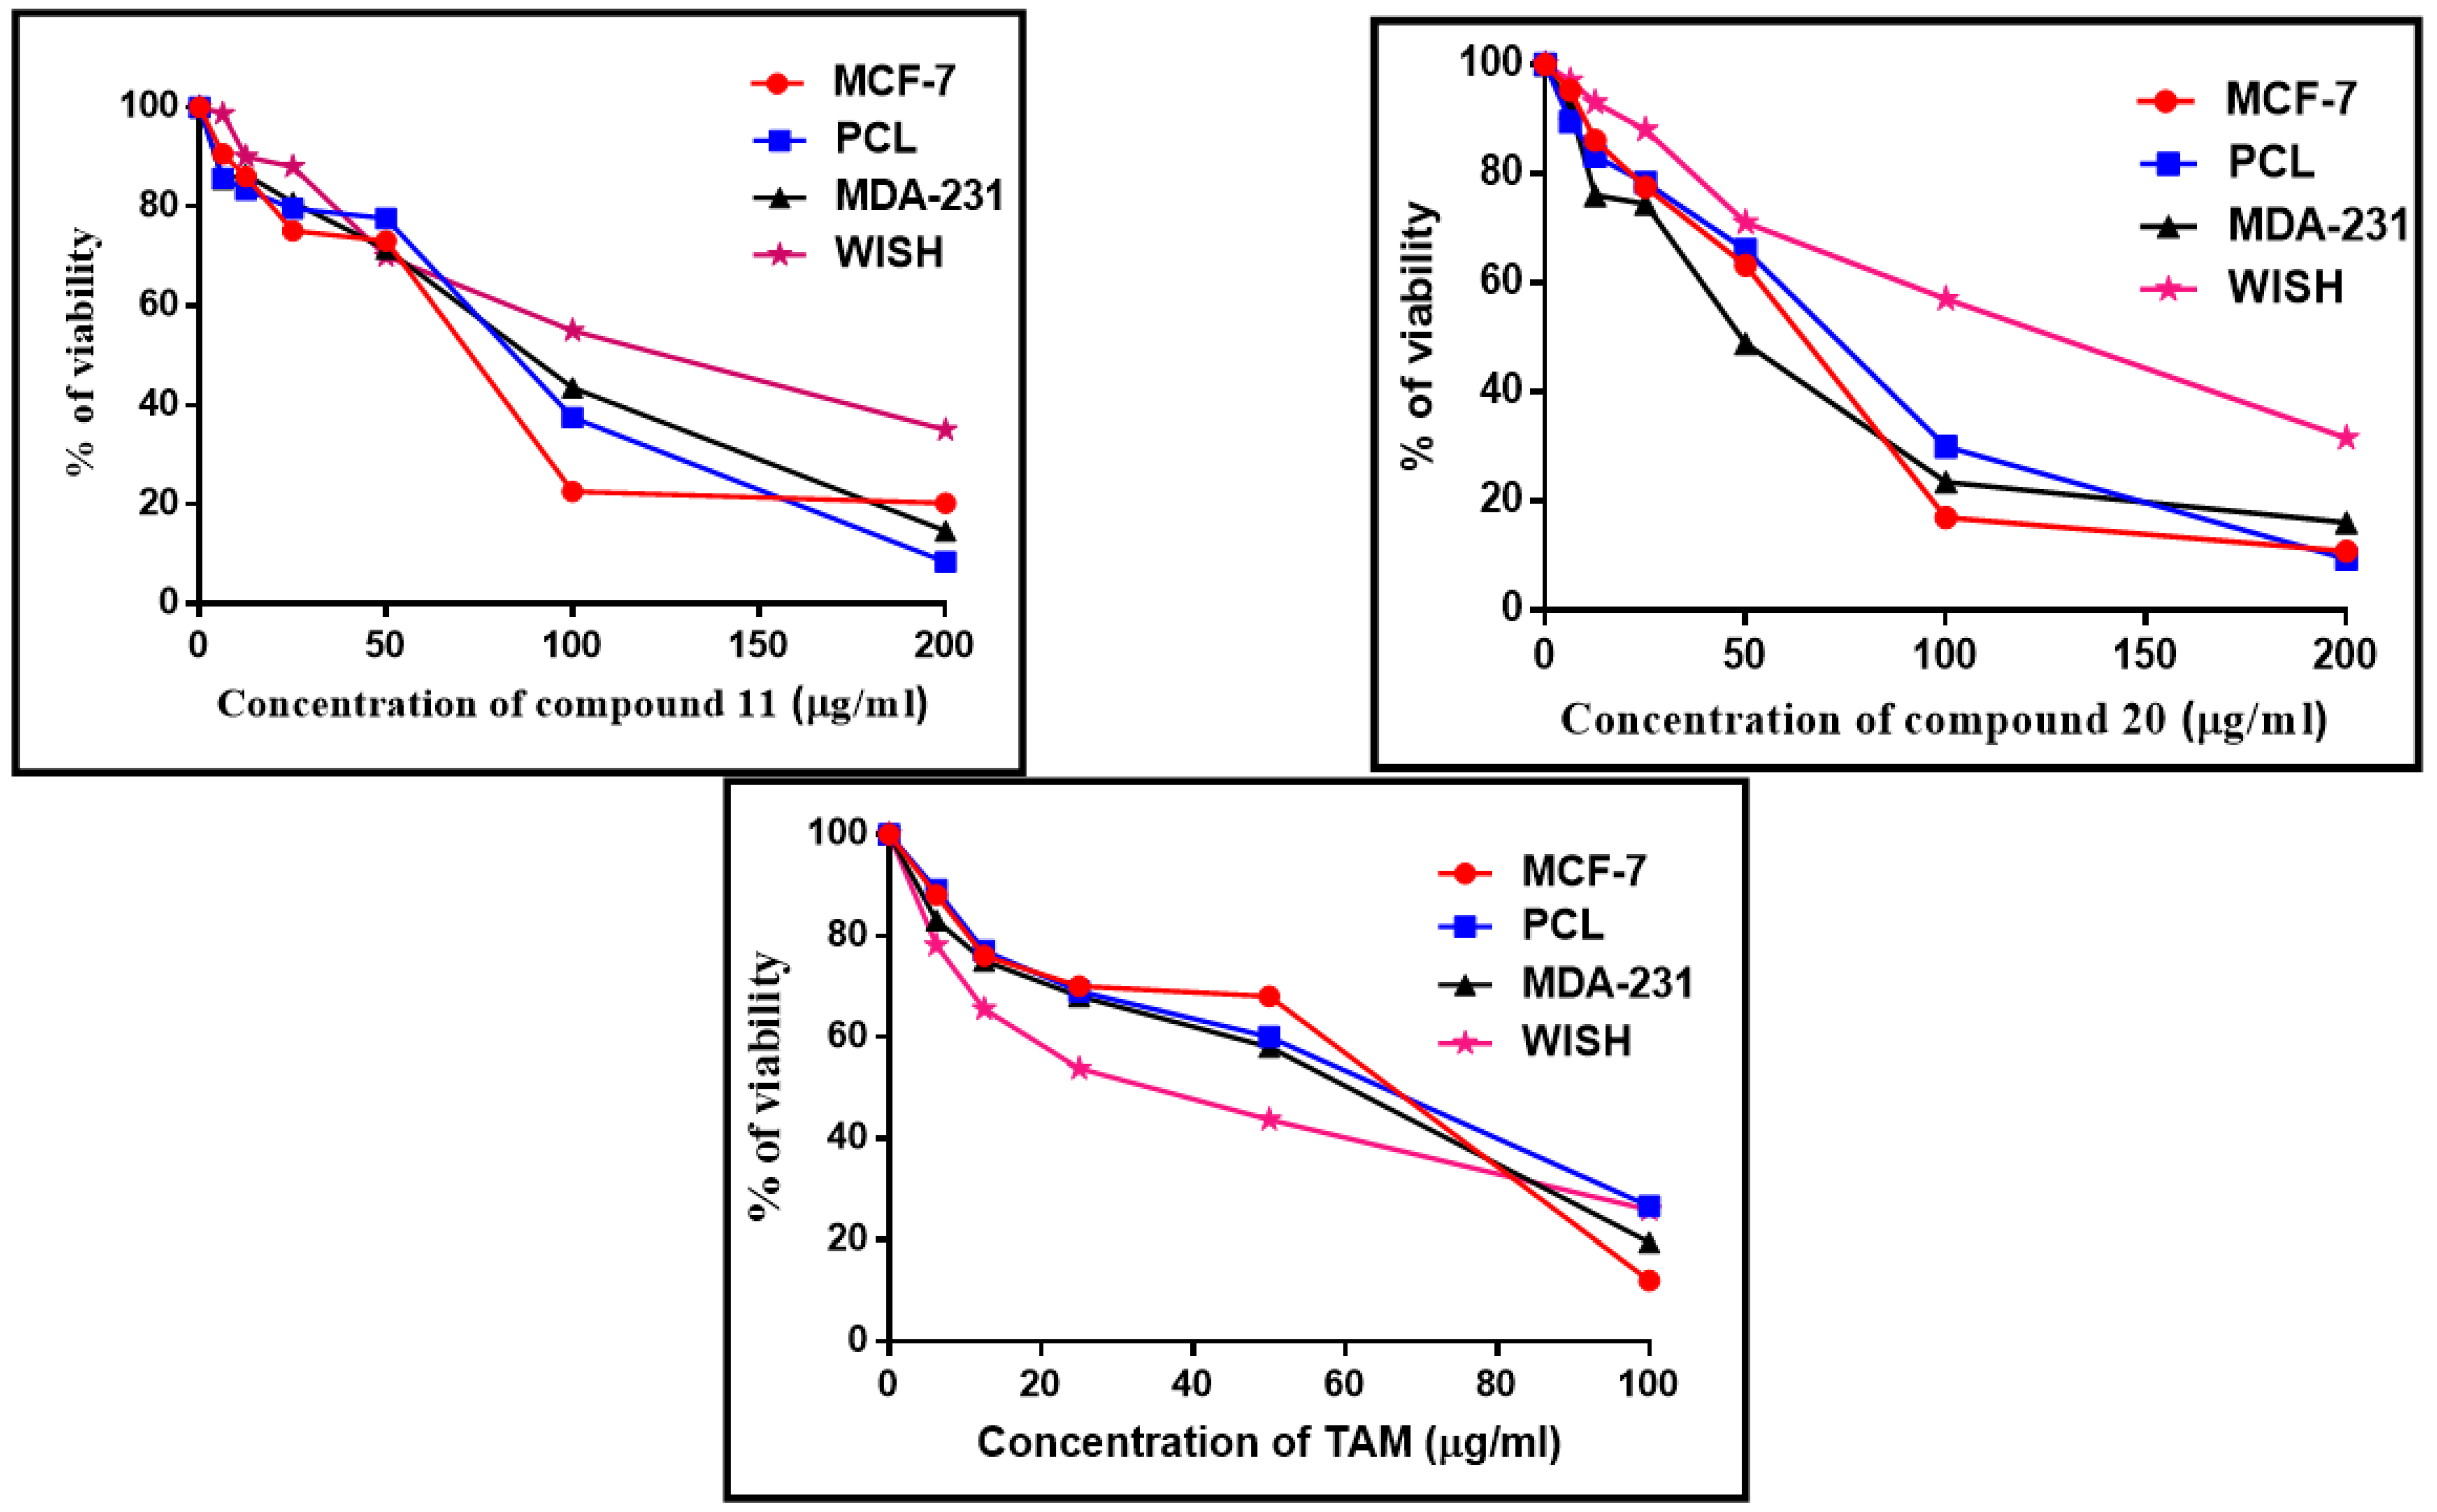
3.3.1. Cytotoxic Effect of Compounds 11, 20, and Tamoxifen (TAM)
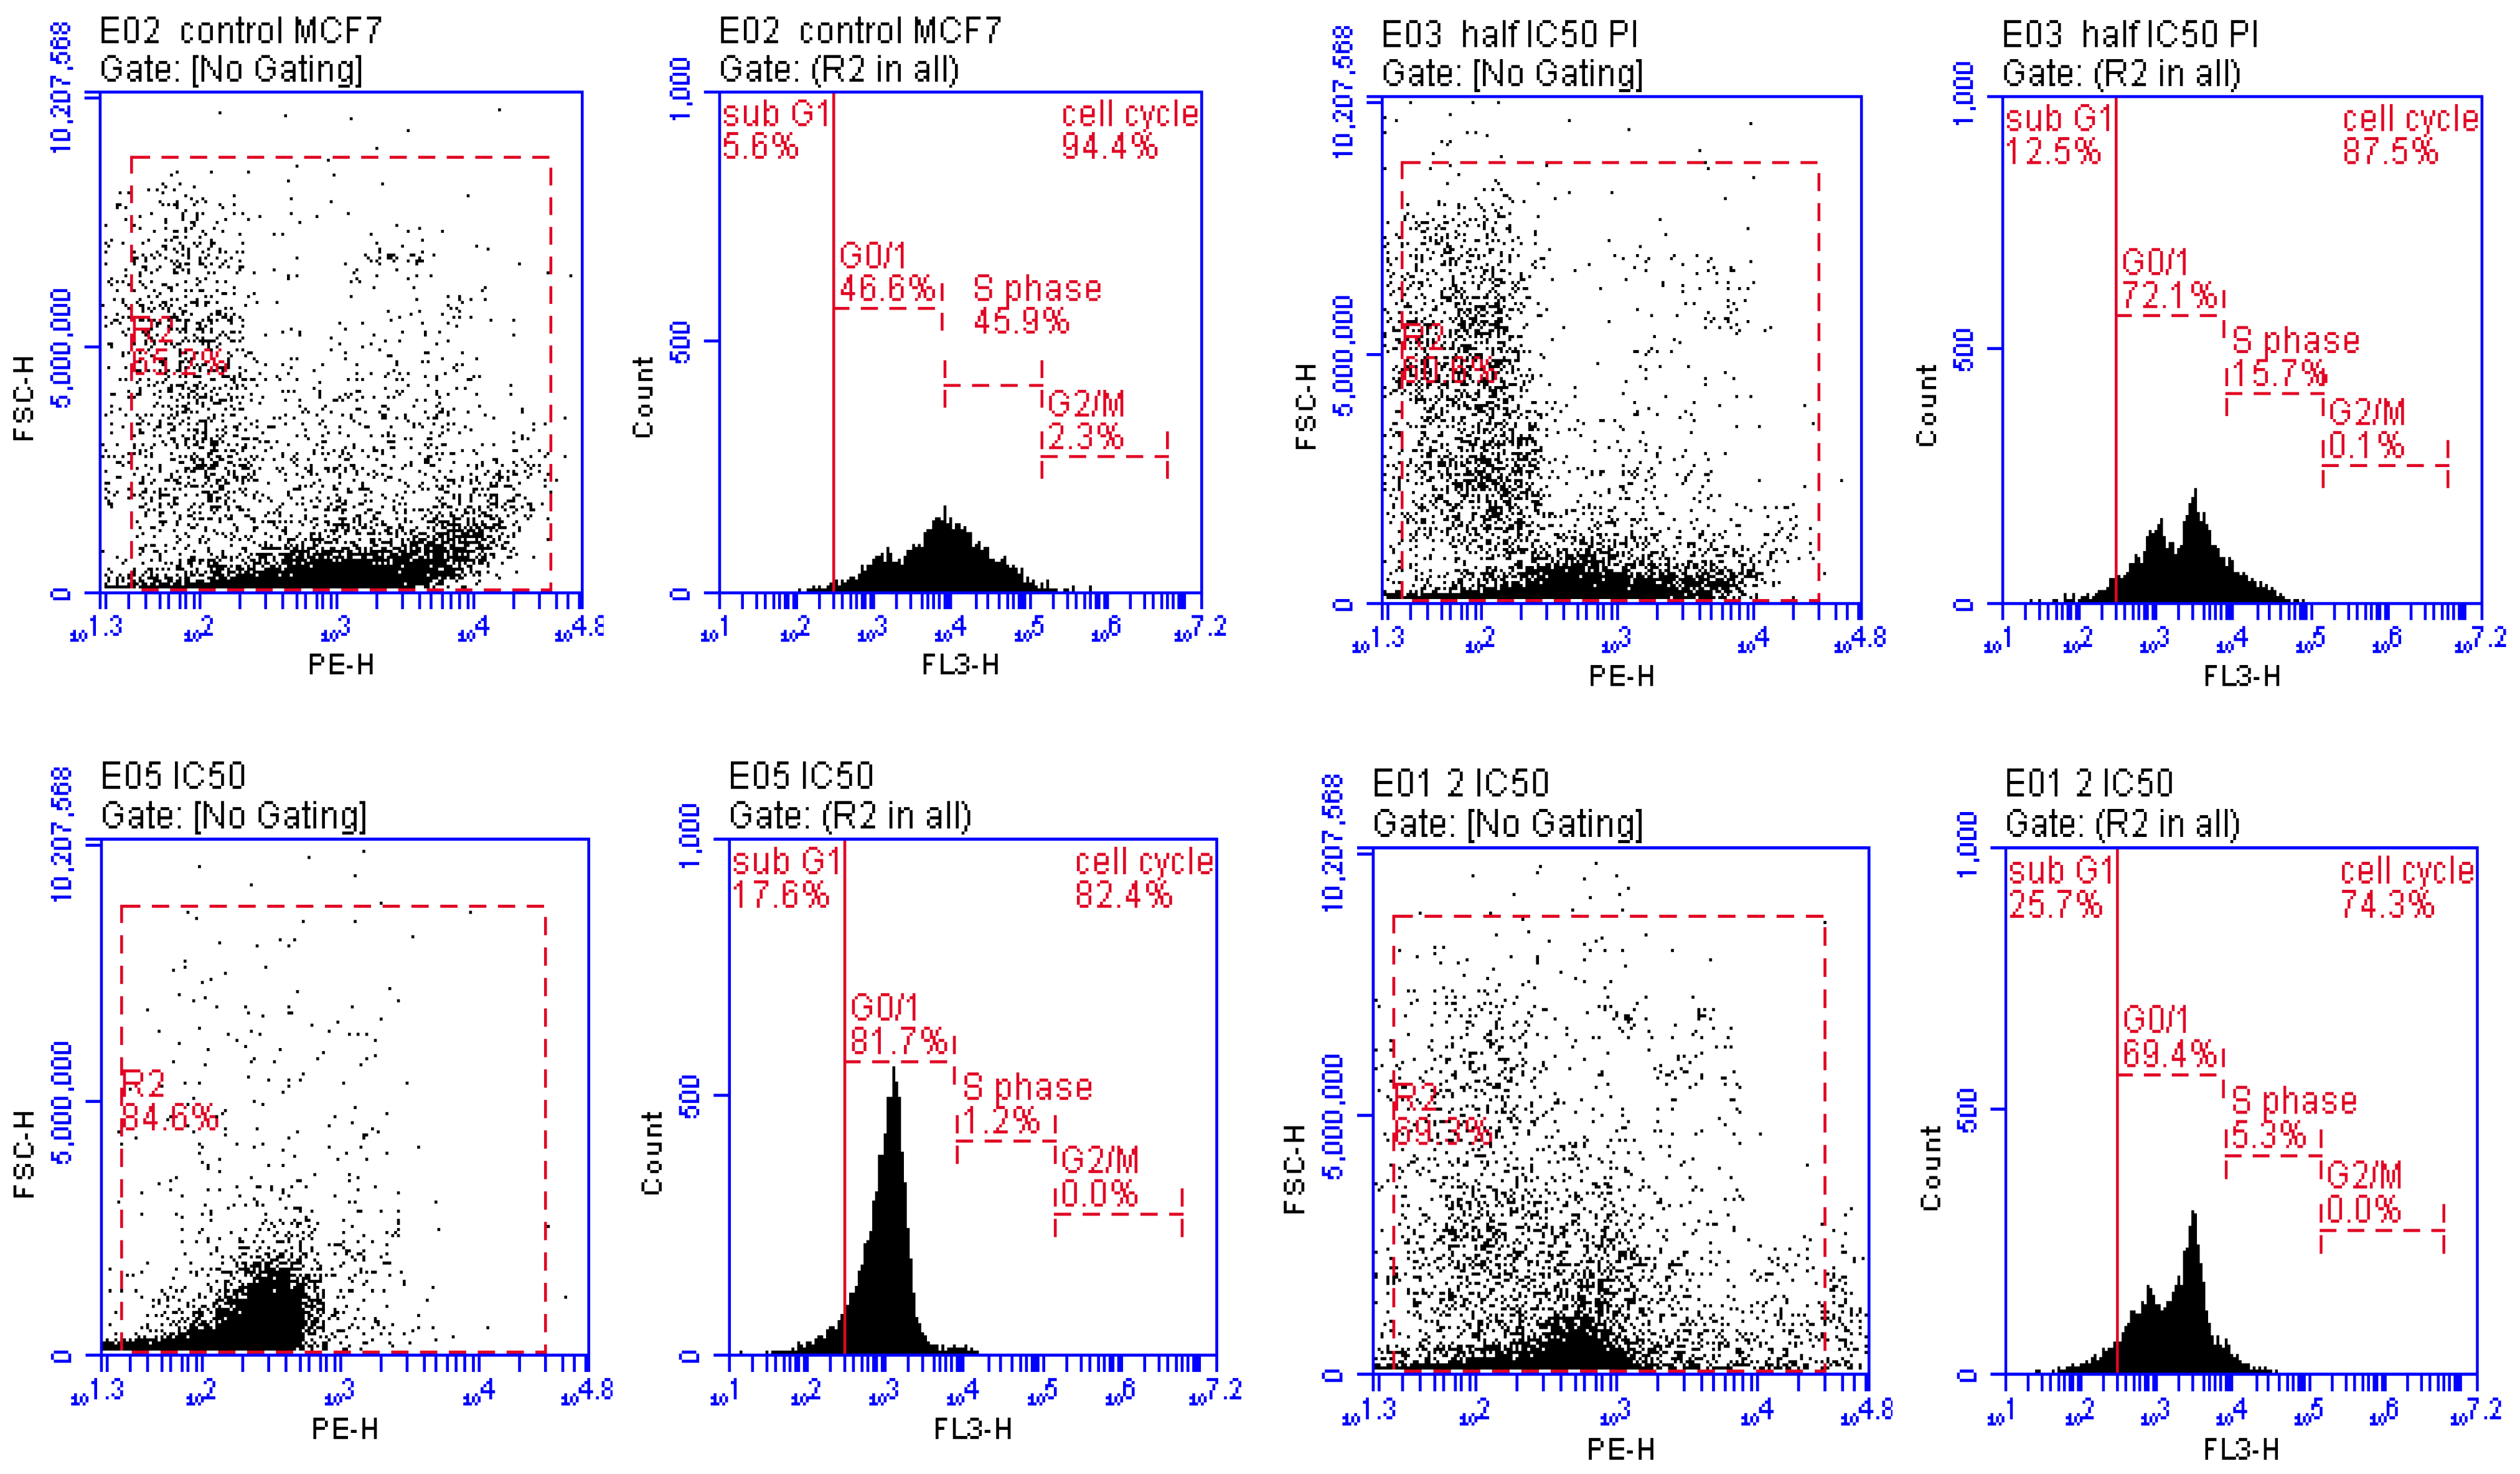
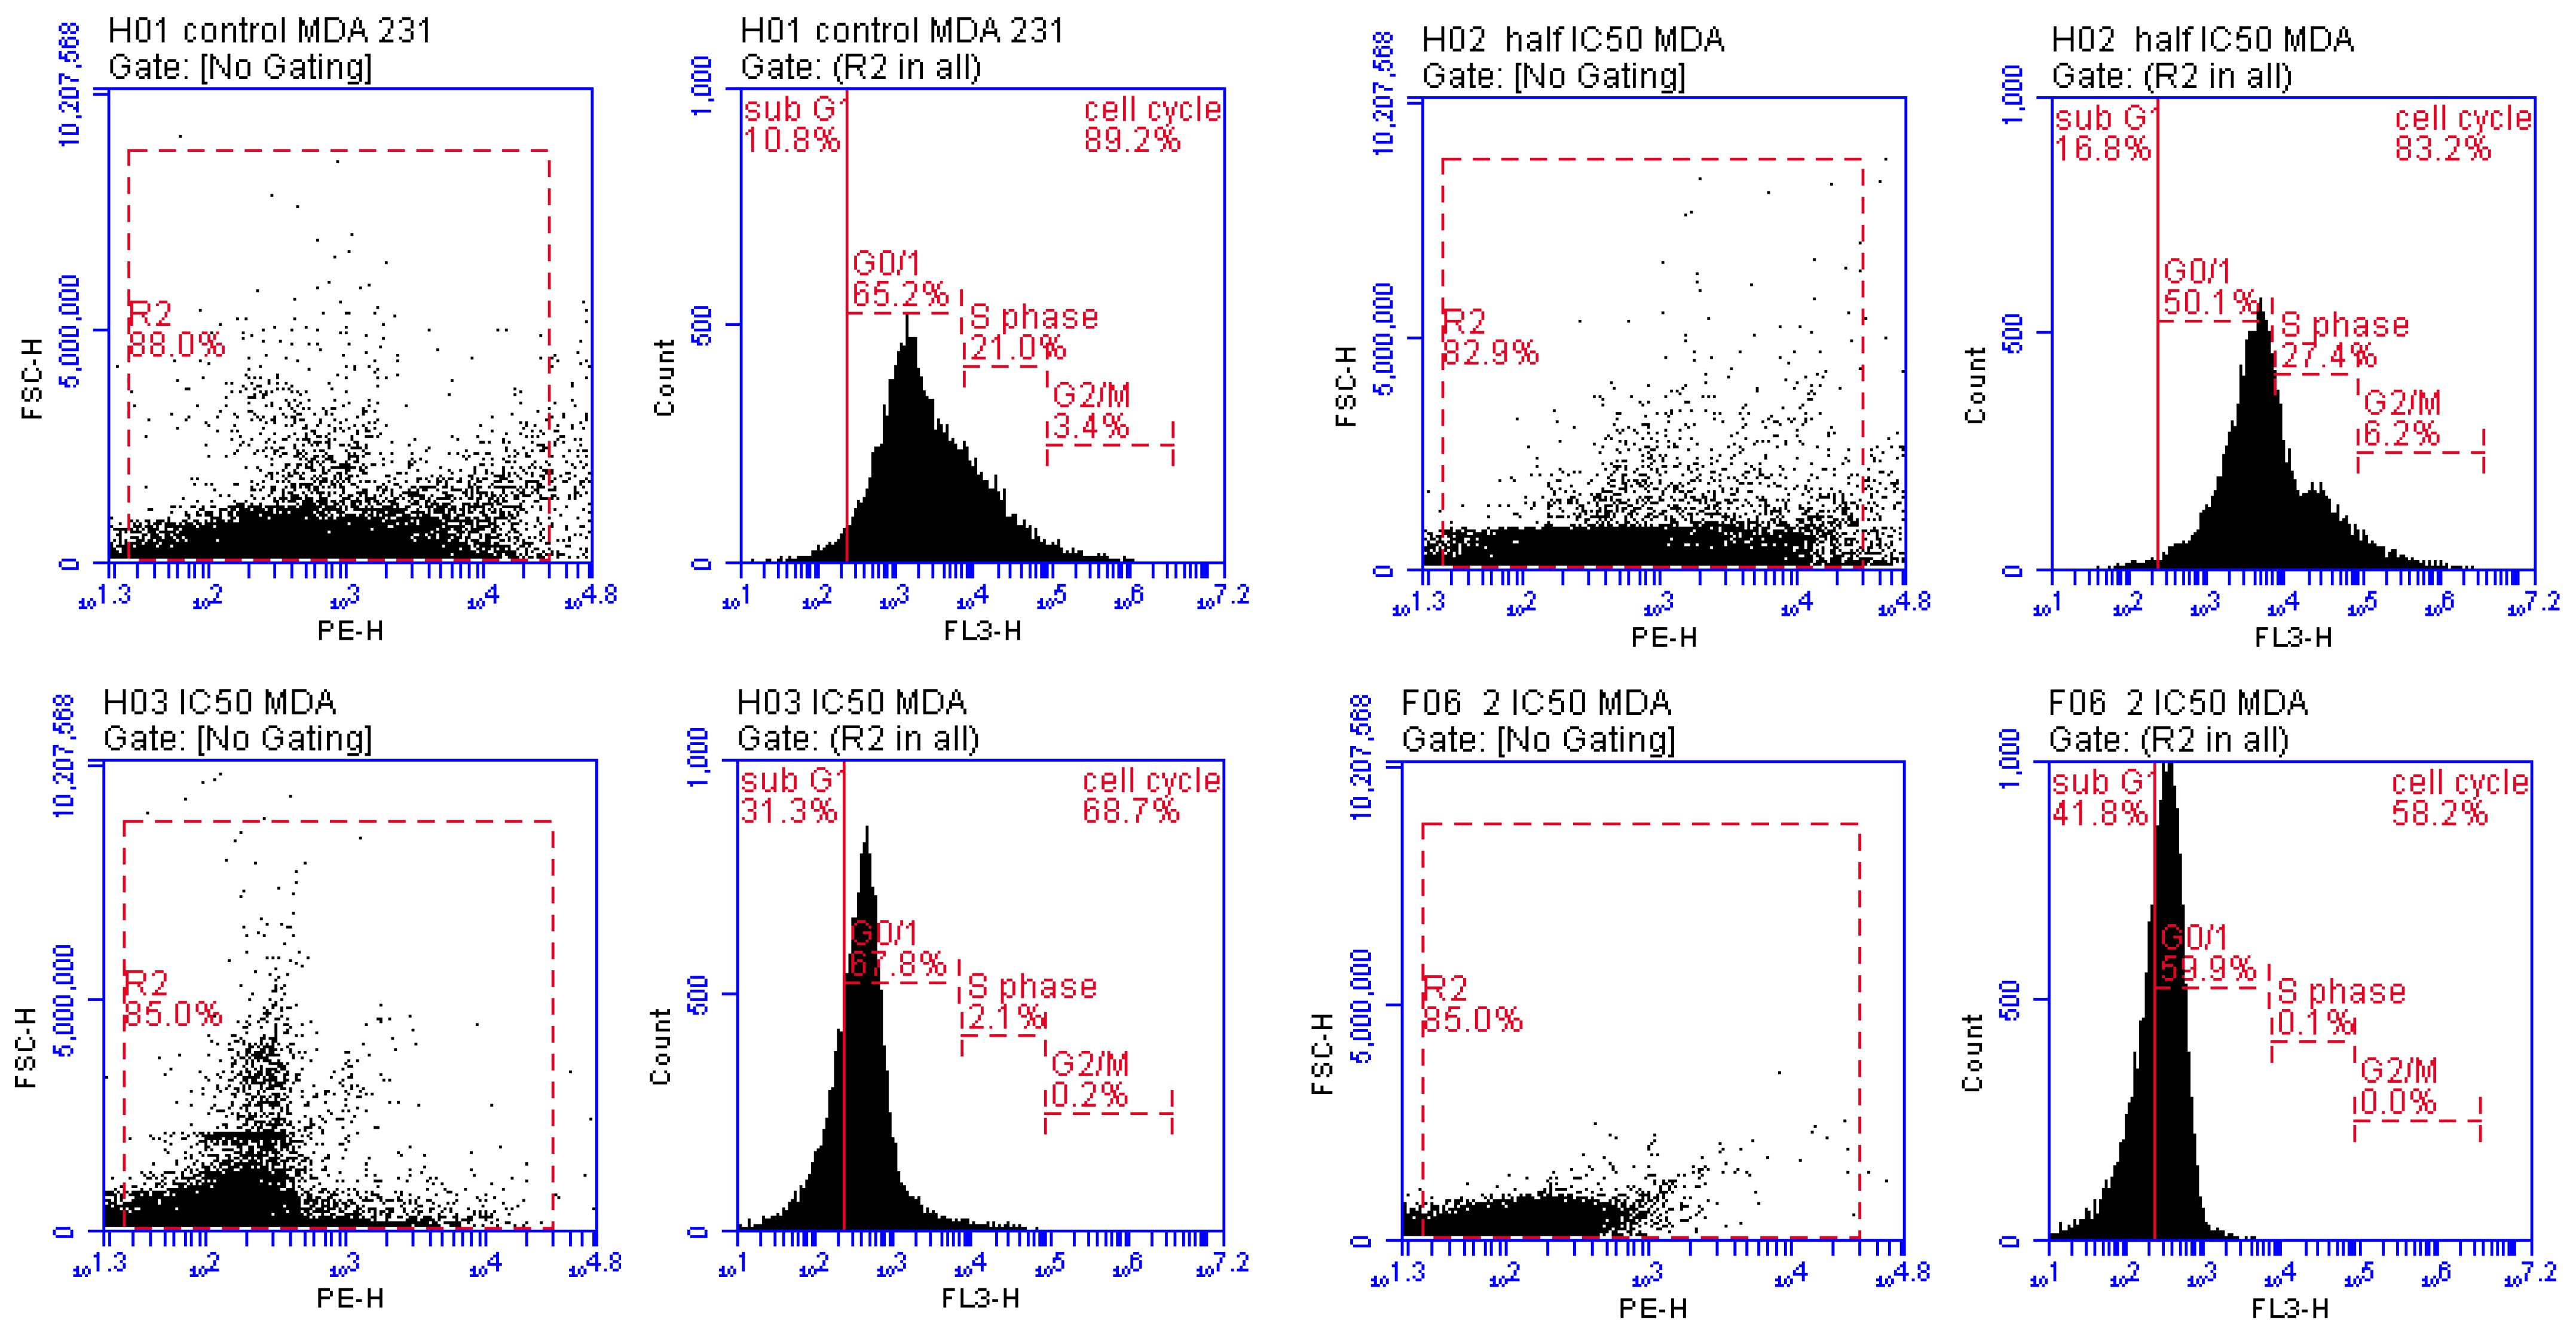
3.3.2. Detection of Cell Cycle Arrest Phase
3.3.3. Altered mRNA Expression of Apoptosis Markers
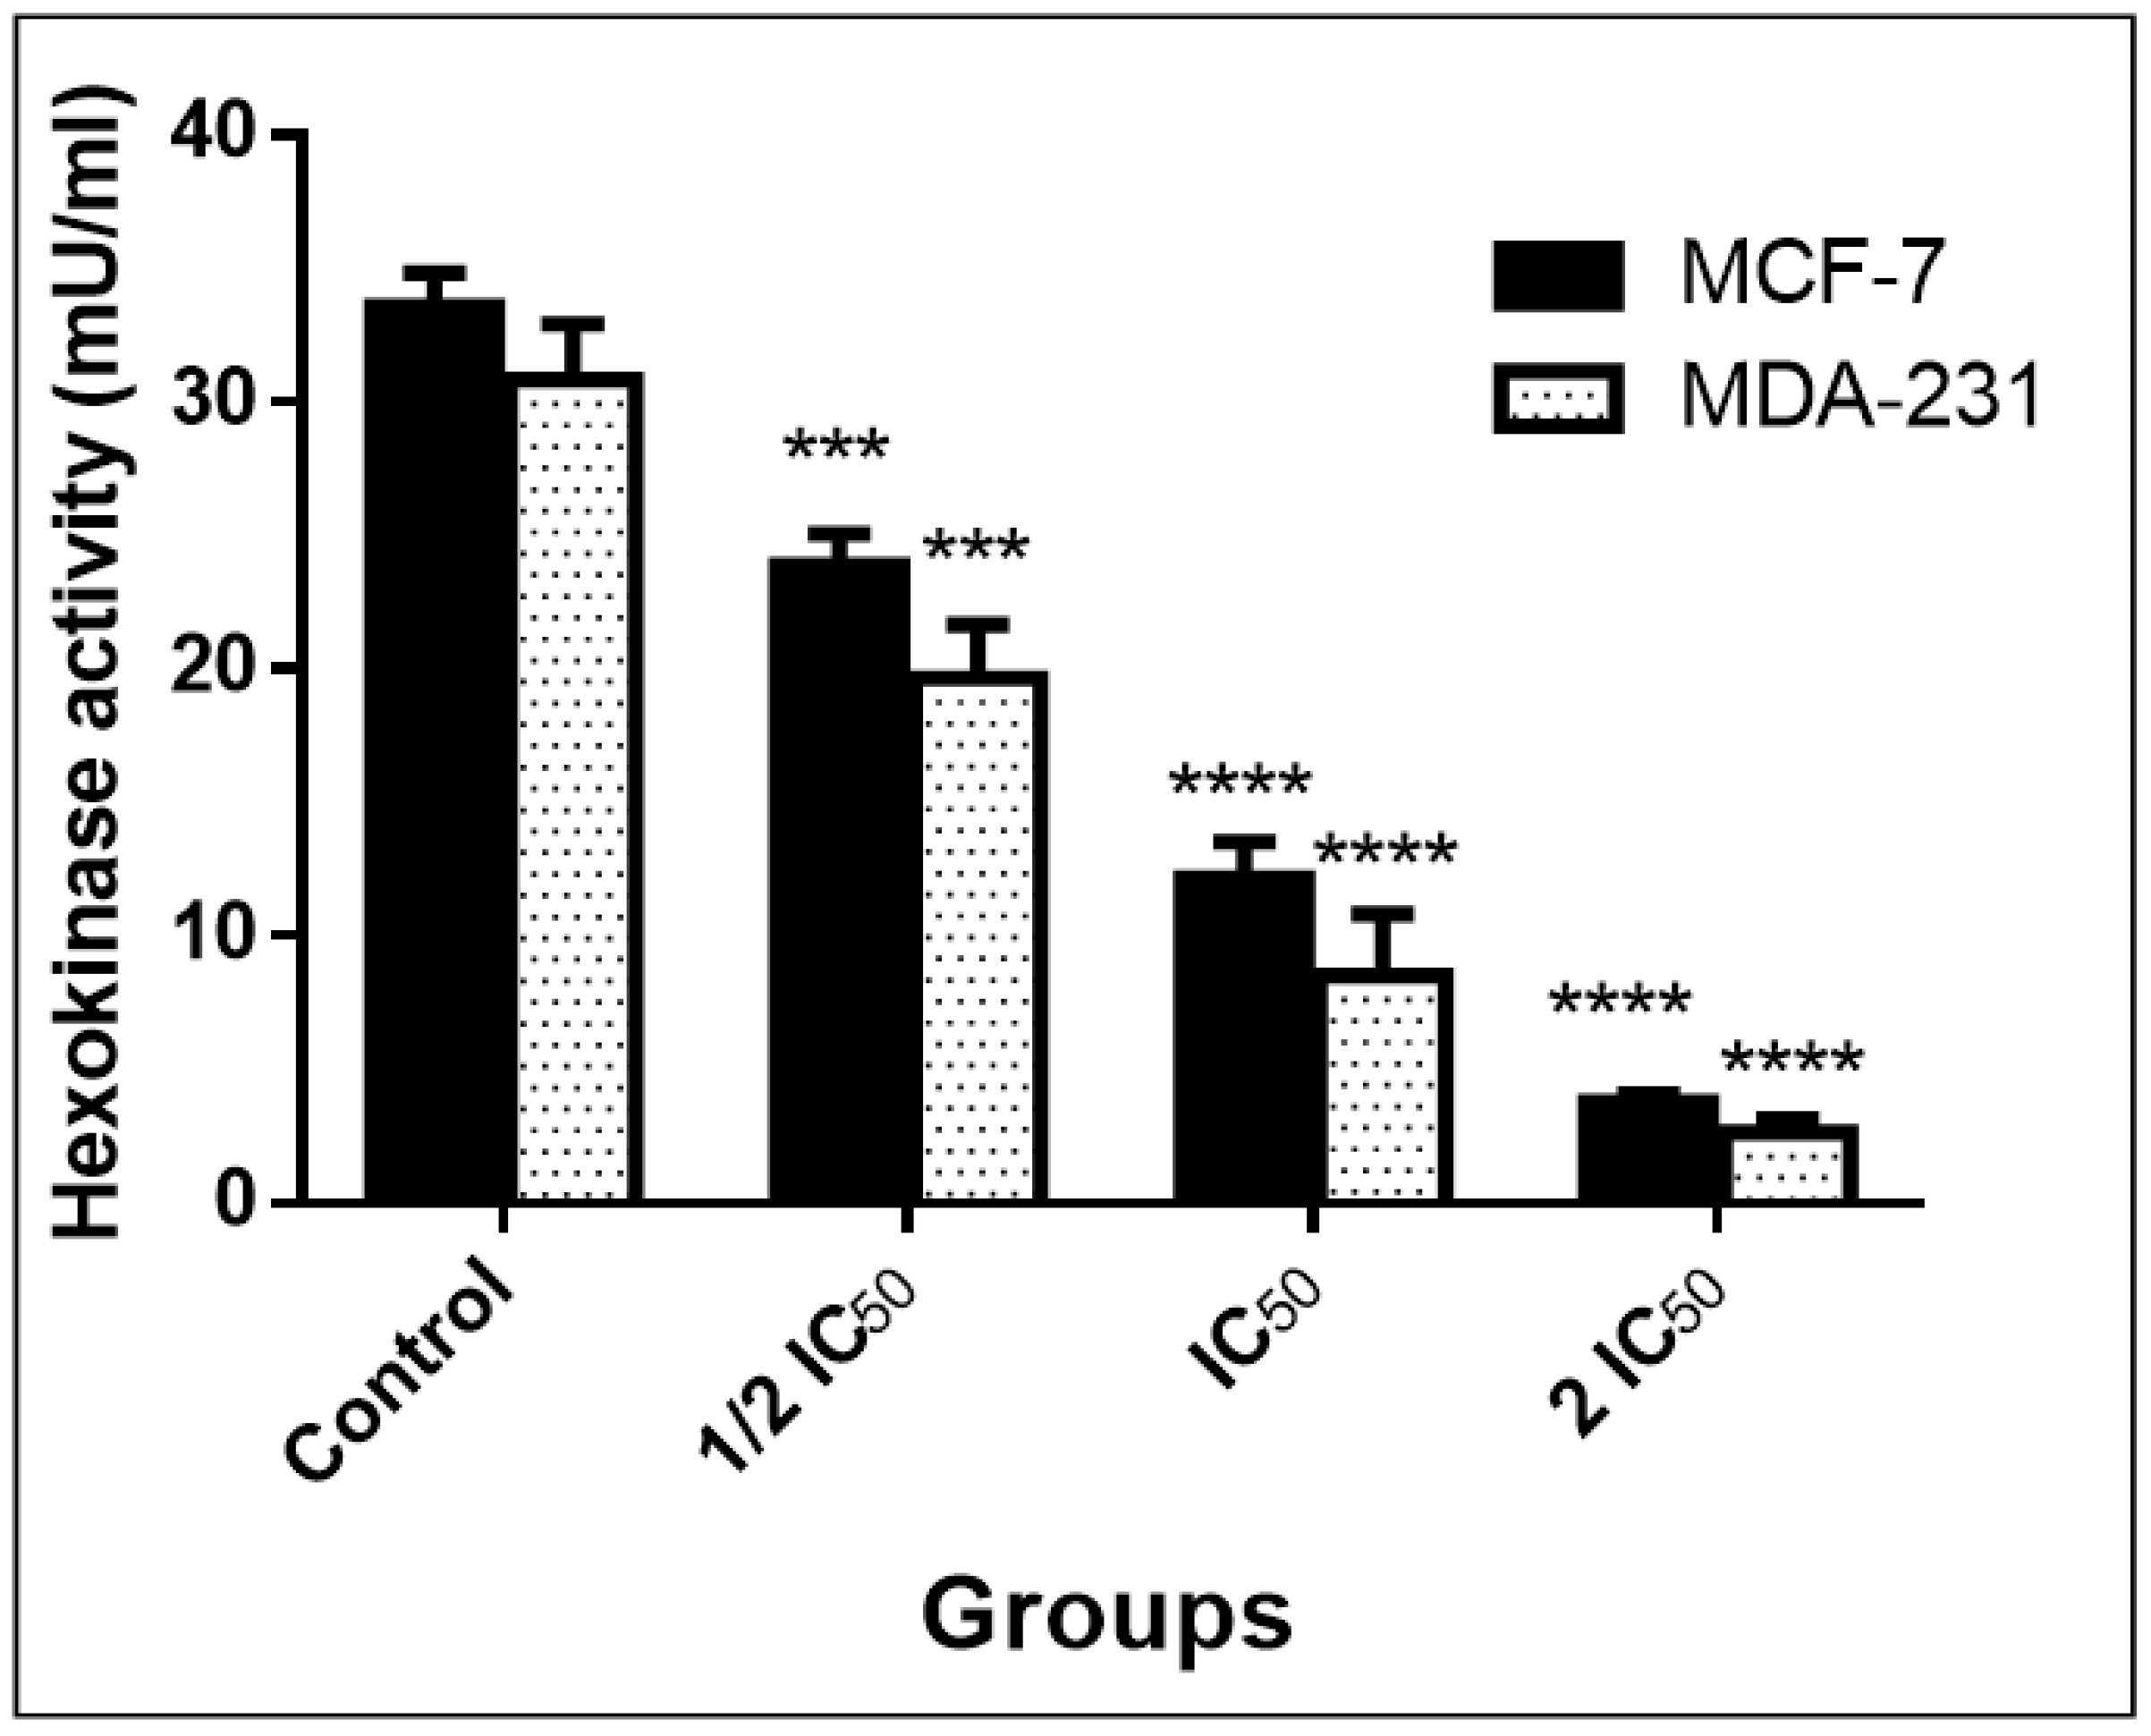
3.3.4. Inhibition of Warburg Effect through Hexokinase (ELISA)
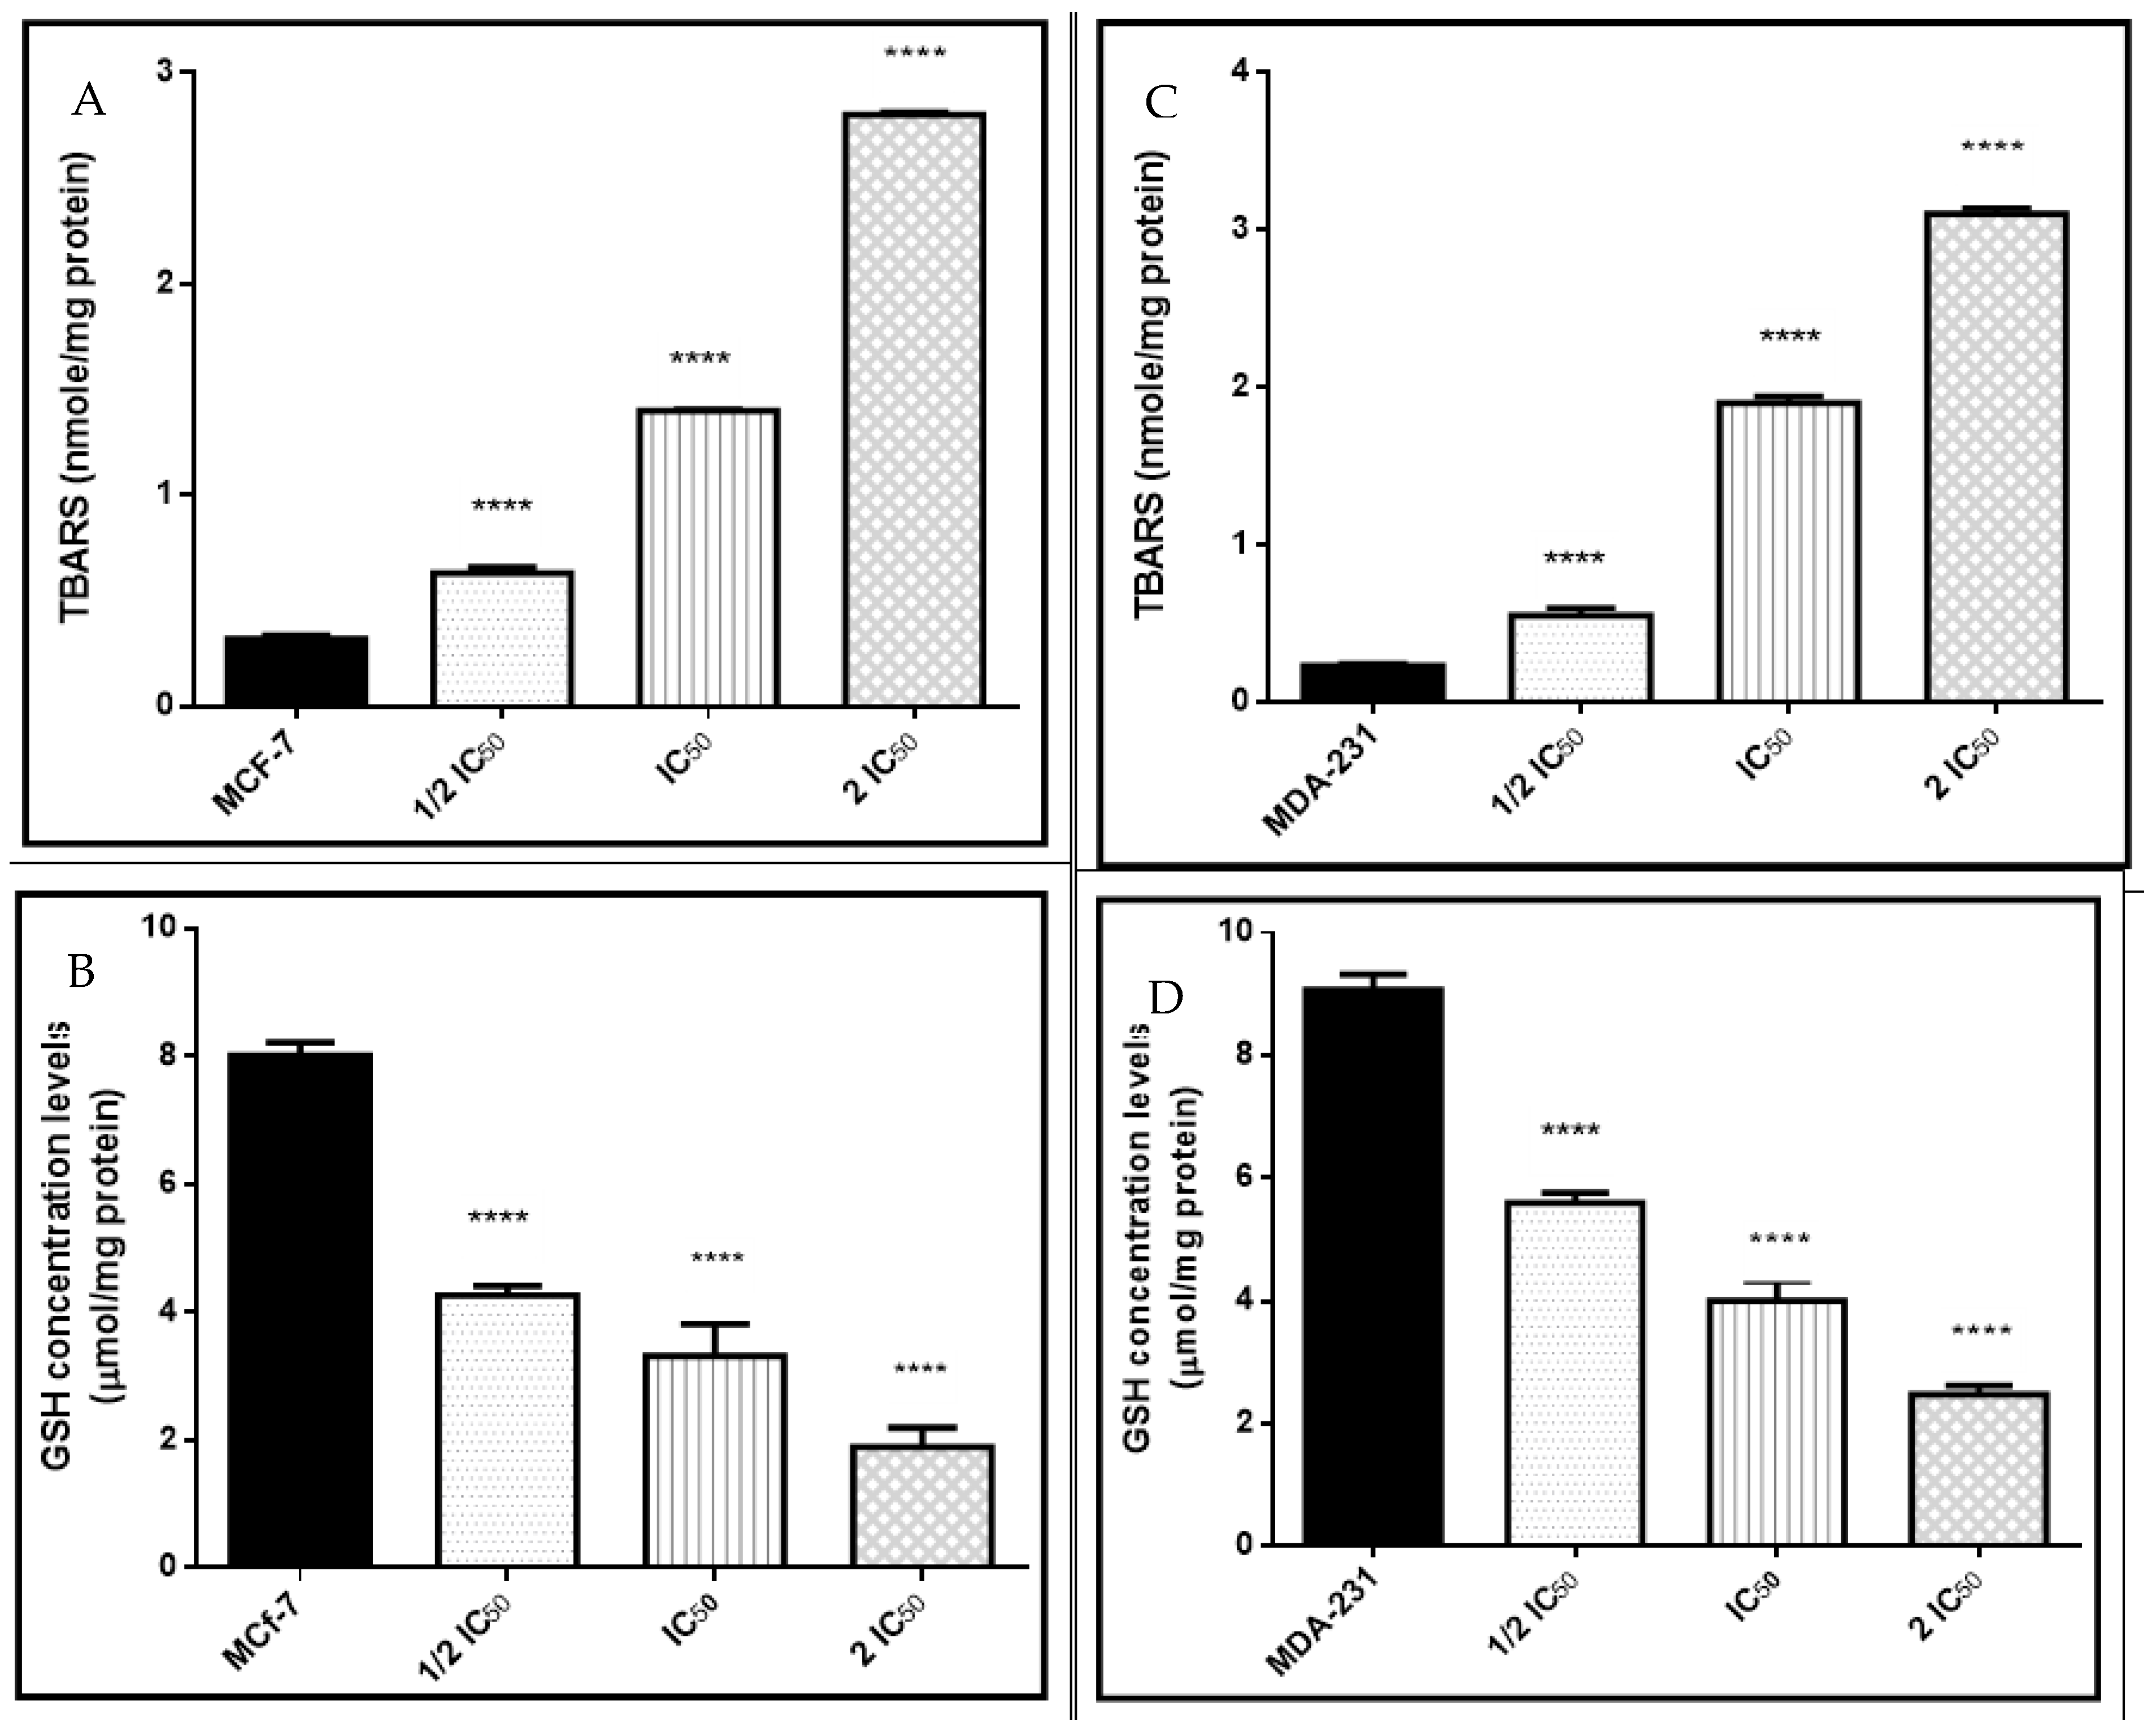
3.3.5. Oxidative and Antioxidant Biomarkers
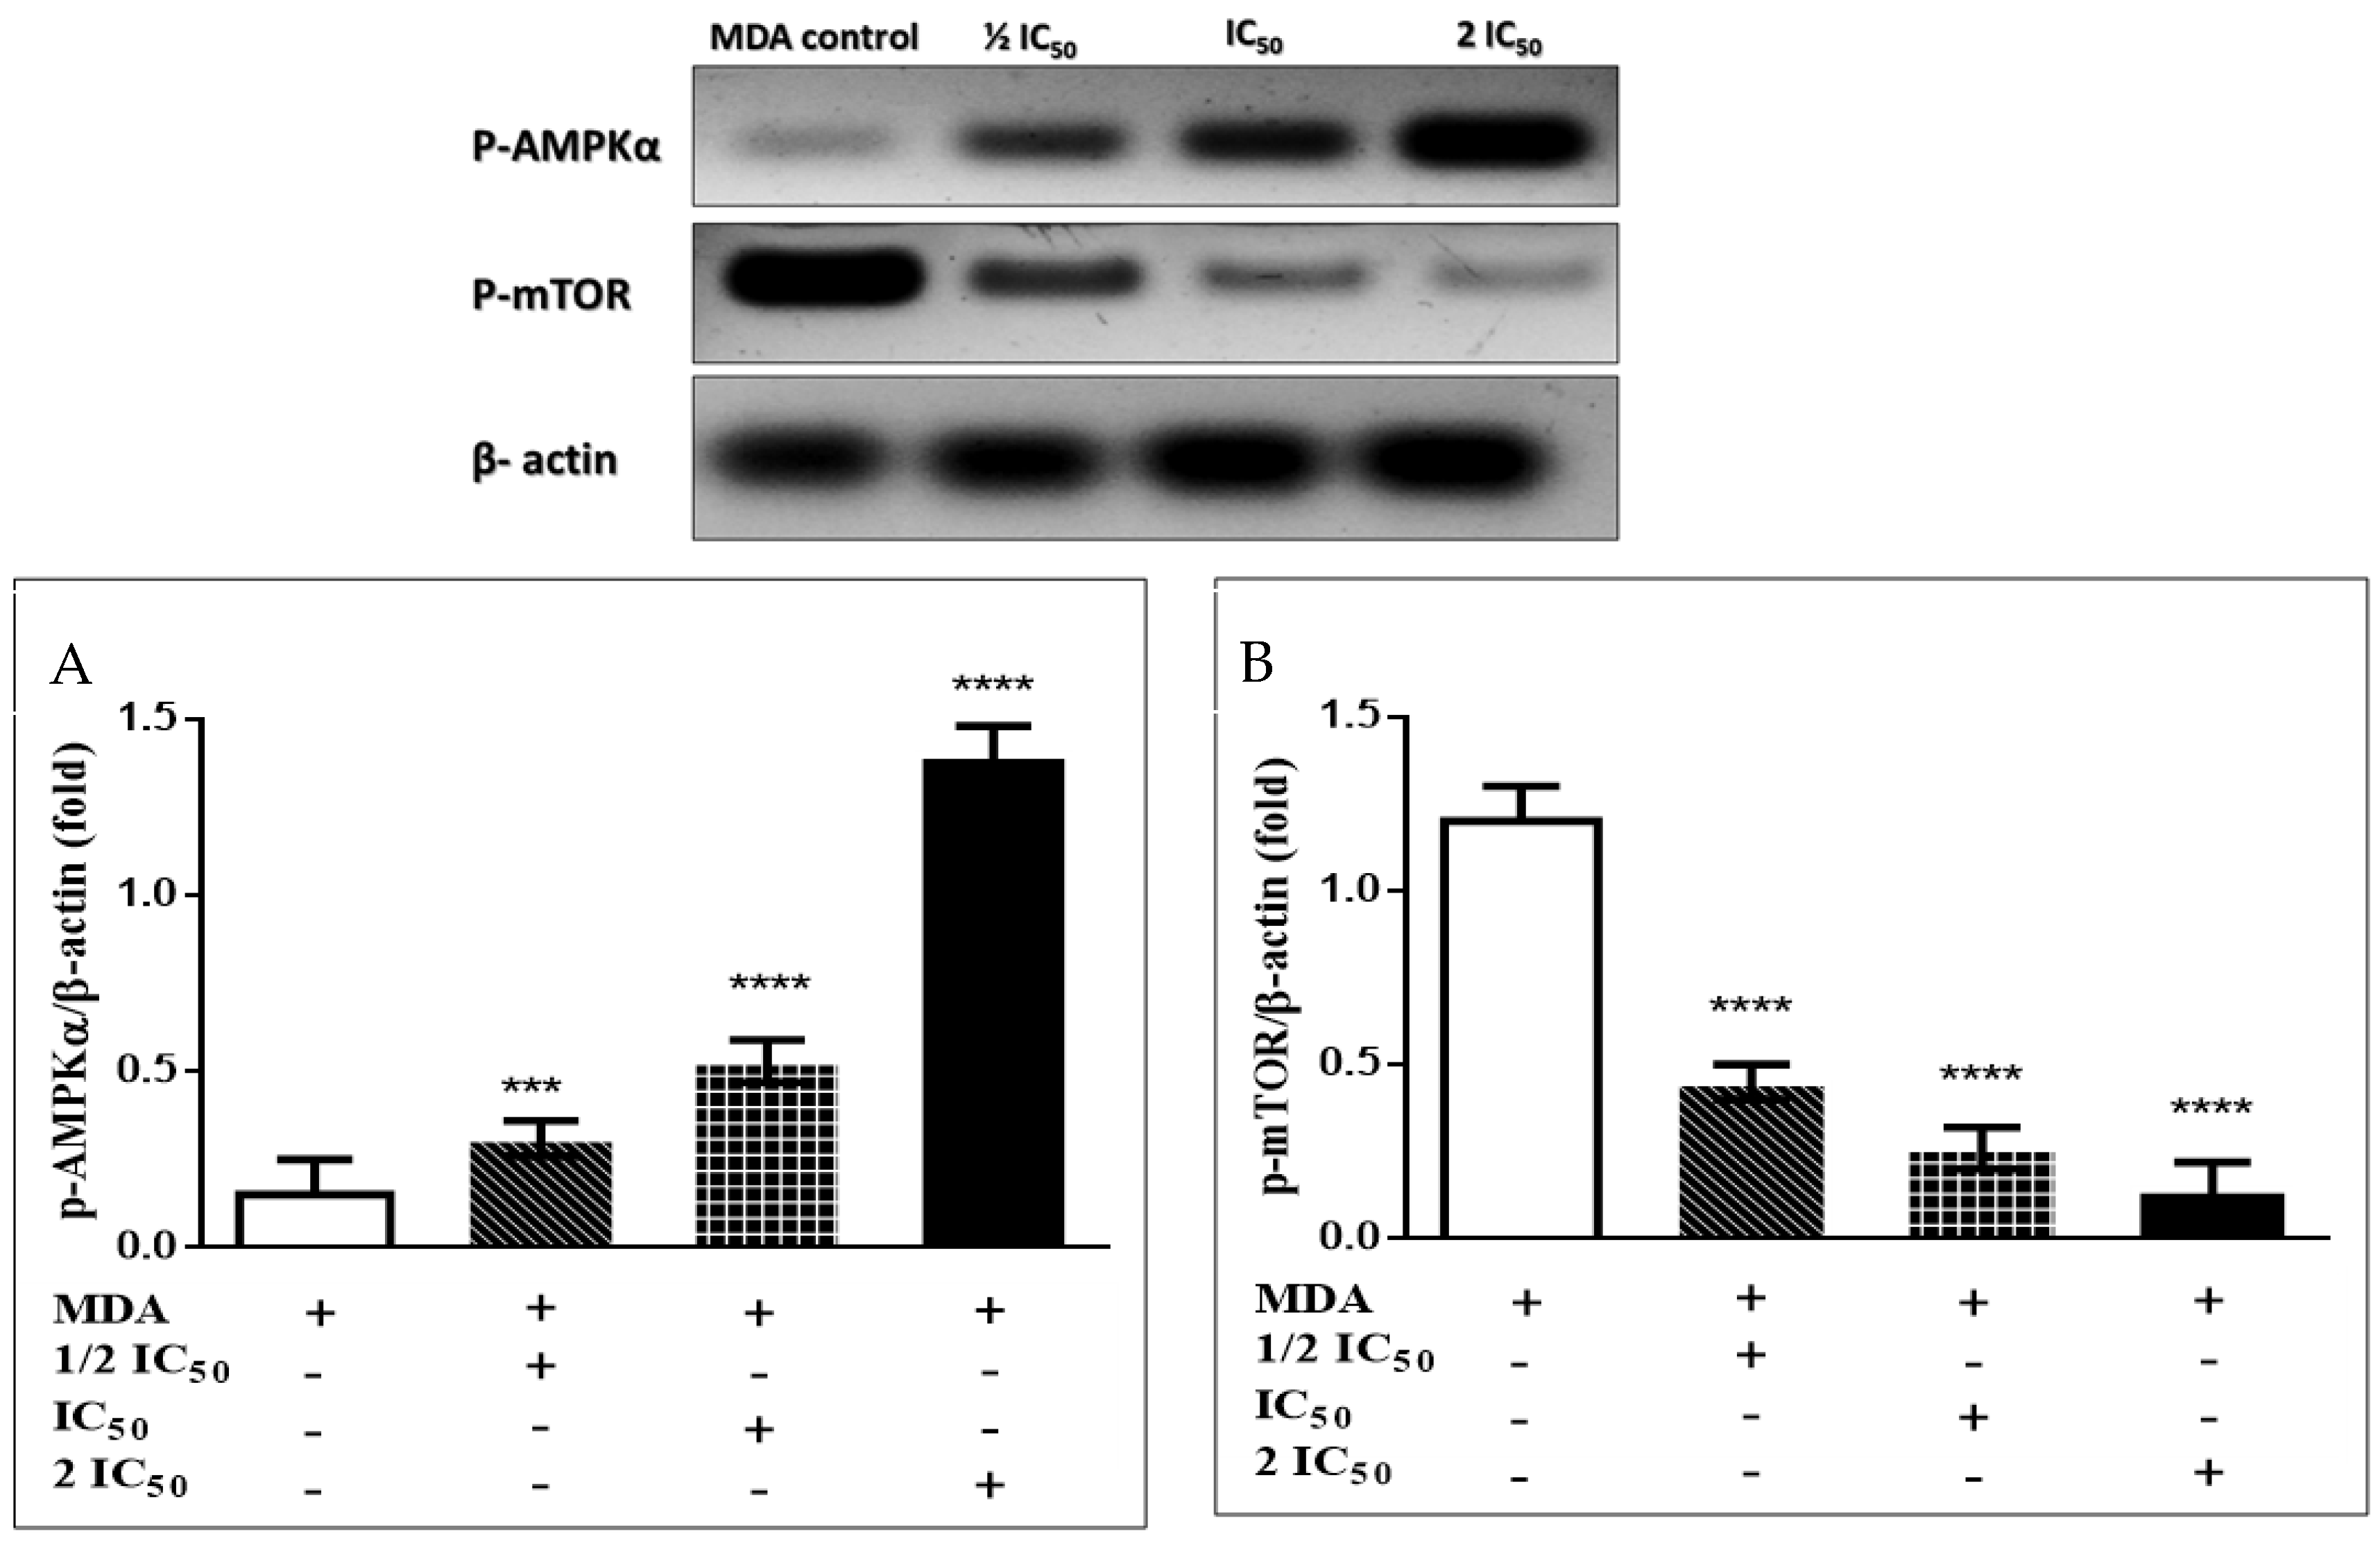
3.3.6. Immunoblotting Confirms the AMPK/mTOR Pathway
4. Conclusions
Supplementary Materials
Author Contributions
Funding
Institutional Review Board Statement
Informed Consent Statement
Data Availability Statement
Conflicts of Interest
Sample Availability
References
- von Meyenfeldt, M. Cancer-associated malnutrition: An introduction. Eur. J. Oncol. Nurs. 2005, 9, 35–38. [Google Scholar] [CrossRef]
- Noser, A.A.; El-Naggar, M.; Donia, T.; Abdelmonsef, A.H. Synthesis, In Silico and In Vitro Assessment of New Quinazolinones as Anticancer Agents via Potential AKT Inhibition. Molecules 2020, 25, 4780. [Google Scholar] [CrossRef]
- Andrzejewski, S.; Siegel, P.M.; St-Pierre, J. Metabolic profiles associated with metformin efficacy in cancer. Front. Endocrinol. 2018, 9, 372. [Google Scholar] [CrossRef] [Green Version]
- Andrzejewski, S.; Gravel, S.-P.; Pollak, M.; St-Pierre, J. Metformin directly acts on mitochondria to alter cellular bioenergetics. Cancer Metab. 2014, 2, 12. [Google Scholar] [CrossRef] [Green Version]
- Andrzejewski, S.; Klimcakova, E.; Johnson, R.M.; Tabariès, S.; Annis, M.G.; McGuirk, S.; Northey, J.J.; Chénard, V.; Sriram, U.; Papadopoli, D.J.; et al. PGC-1α Promotes Breast Cancer Metastasis and Confers Bioenergetic Flexibility against Metabolic Drugs. Cell Metab. 2017, 26, 778–787. [Google Scholar] [CrossRef] [PubMed]
- Owen, M.R.; Doran, E.; Halestrap, A.P. Evidence that metformin exerts its anti-diabetic effects through inhibition of complex 1 of the mitochondrial respiratory chain. Biochem. J. 2000, 348, 607–614. [Google Scholar] [CrossRef]
- El-Mir, M.Y.; Nogueira, V.; Fontaine, E.; Avéret, N.; Rigoulet, M.; Leverve, X. Dimethylbiguanide inhibits cell respiration via an indirect effect targeted on the respiratory chain complex I. J. Biol. Chem. 2000, 275, 223–228. [Google Scholar] [CrossRef] [Green Version]
- Griss, T.; Vincent, E.E.; Egnatchik, R.; Chen, J.; Ma, E.H.; Faubert, B.; Viollet, B.; DeBerardinis, R.J.; Jones, R.G. Metformin Antagonizes Cancer Cell Proliferation by Suppressing Mitochondrial-Dependent Biosynthesis. PLoS Biol. 2015, 13, e1002309. [Google Scholar] [CrossRef] [PubMed] [Green Version]
- Zhou, G.; Myers, R.; Li, Y.; Chen, Y.; Shen, X.; Fenyk-Melody, J.; Wu, M.; Ventre, J.; Doebber, T.; Fujii, N.; et al. Role of AMP-activated protein kinase in mechanism of metformin action. J. Clin. Investig. 2001, 108, 1167–1174. [Google Scholar] [CrossRef] [PubMed]
- Bogachus, L.D.; Turcotte, L.P. Genetic downregulation of AMPK-α isoforms uncovers the mechanism by which metformin decreases FA uptake and oxidation in skeletal muscle cells. Am. J. Physiol.—Cell Physiol. 2010, 299, 1549–1561. [Google Scholar] [CrossRef] [Green Version]
- Bhat, M.; Yanagiya, A.; Graber, T.; Razumilava, N.; Bronk, S.; Zammit, D.; Zhao, Y.; Zakaria, C.; Metrakos, P.; Pollak, M.; et al. Metformin requires 4E-BPs to induce apoptosis and repress translation of Mcl-1 in hepatocellular carcinoma cells. Oncotarget 2017, 8, 50542–50556. [Google Scholar] [CrossRef] [Green Version]
- Takahashi, A.; Kimura, F.; Yamanaka, A.; Takebayashi, A.; Kita, N.; Takahashi, K.; Murakami, T. Metformin impairs growth of endometrial cancer cells via cell cycle arrest and concomitant autophagy and apoptosis. Cancer Cell Int. 2014, 14, 53. [Google Scholar] [CrossRef] [PubMed] [Green Version]
- Rojas-Ortiz, J.J.; Contreras-Celedón, C.; Gómez-Hurtado, M.A.; Chacón-García, L.; Cortes-García, C.J. Synthesis of Novel Schiff Base Derivates Containing a Fragment of the HIV Integrase Inhibitor Drug Raltegravir. Proceedings 2019, 41, 5. [Google Scholar] [CrossRef] [Green Version]
- Kajal, A.; Bala, S.; Kamboj, S.; Sharma, N.; Saini, V. Schiff Bases: A Versatile Pharmacophore. J. Catal. 2013, 2013, 893512. [Google Scholar] [CrossRef] [Green Version]
- Rakesh, K.P.; Darshini, N.; Shubhavathi, T.; Mallesha, N. Biological Applications of Quinazolinone Analogues: A Review. Org. Med. Chem Int. J. 2017, 2, 555585. [Google Scholar]
- Mungroo, M.R.; Shahbaz, M.S.; Anwar, A.; Saad, S.M.; Khan, K.M.; Khan, N.A.; Siddiqui, R. Aryl Quinazolinone Derivatives as Novel Therapeutic Agents against Brain-Eating Amoebae. ACS Chem. Neurosci. 2020, 11, 2438–2449. [Google Scholar] [CrossRef]
- Hameed, A.; Al-Rashida, M.; Uroos, M.; Ali, S.A.; Arshia; Ishtiaq, M.; Khan, K.M. Quinazoline and quinazolinone as important medicinal scaffolds: A comparative patent review (2011–2016). Expert. Opin. Ther. Targets 2018, 28, 281–297. [Google Scholar] [CrossRef] [PubMed]
- Naim, M.J.; Alam, O.; Alam, J.; Bano, F.; Alam, P. Recent review on indole: A privileged scaffold structure. Int. J. Pharm. Sci. Res. 2016, 7, 51–62. [Google Scholar]
- Chadha, N.; Silakari, O. Indoles as therapeutics of interest in medicinal chemistry: Bird’s eye view. Eur. J. Med. Chem. 2017, 134, 159–184. [Google Scholar] [CrossRef] [PubMed]
- Gomha, S.M.; Abdelhady, H.A.; Hassain, D.Z.H.; Abdelmonsef, A.H.; El-Naggar, M.; Elaasser, M.M.; Mahmoud, H.K. Thiazole-Based Thiosemicarbazones: Synthesis, Cytotoxicity Evaluation and Molecular Docking Study. Drug Des. Devel. Ther. 2021, 2021, 659–677. [Google Scholar] [CrossRef]
- El-Maghraby, A.; Abdelmonsef, A. Synthesis, characterization and Insilico molecular docking studies of novel chromene derivatives as Rab23 inhibitors. Egypt. J. Chem. 2019, 20, 1341–1358. [Google Scholar]
- Dasari, T.; Kondagari, B.; Dulapalli, R.; Abdelmonsef, A.H.; Mukkera, T.; Padmarao, L.S.; Malkhed, V.; Vuruputuri, U. Design of novel lead molecules against RhoG protein as cancer target–a computational study. J. Biomol. Struct. Dyn. 2017, 35, 3119–3139. [Google Scholar] [CrossRef] [PubMed]
- Abdelmonsef, A.H.; Dulapalli, R.; Dasari, T.; Padmarao, L.S.; Mukkera, T.; Vuruputuri, U. Identification of Novel Antagonists for Rab38 Protein by Homology Modeling and Virtual Screening. Comb. Chem. High Throughput Screen. 2016, 19, 875–892. [Google Scholar] [CrossRef] [PubMed]
- Haredi Abdelmonsef, A. Computer-aided identification of lung cancer inhibitors through homology modeling and virtual screening. Egypt. J. Med. Hum. Genet. 2019, 20, 6. [Google Scholar] [CrossRef] [Green Version]
- Rashdan, H.R.M.; Abdelmonsef, A.H.; Shehadi, I.A.; Gomha, S.M.; Soliman, A.M.M.; Mahmoud, H.K. Synthesis, Molecular Docking Screening and Anti-Proliferative Potency Evaluation of Some New Imidazo[2,1-b]Thiazole Linked Thiadiazole Conjugates. Molecules 2020, 25, 4997. [Google Scholar] [CrossRef]
- Rashdan, H.; Shehadi, I.; Abdelmonsef, A.H. Synthesis, Anticancer Evaluation, Computer-Aided Docking Studies, and ADMET Prediction of 1,2,3-Triazolyl-Pyridine Hybrids as Human Aurora B Kinase Inhibitors. ACS Omega 2021, 6, 1445–1455. [Google Scholar] [CrossRef] [PubMed]
- Shehadi, I.A.; Rashdan, H.R.M.; Abdelmonsef, A.H. Homology modeling and virtual screening studies of antigen MLAA-42Protein: Identification of noveldrugcandidates against leukemia-an in silico approach. Comput. Math. Methods Med. 2020, 2020, 8196147. [Google Scholar] [CrossRef] [PubMed] [Green Version]
- Abdelmonsef, A.H.; Mosallam, A.M. Synthesis, in vitro biological evaluation and in silico docking studies of new quinazolin-2,4-dione analogues as possible anticarcinoma agents. J. Heterocycl. Chem. 2020, 25, 4780. [Google Scholar]
- Tiwary, B.K.; Zirmire, R.K.; Pradhan, K.; Nanda, A.K. Innovare academic sciences preparation and spectroscopic characterization of inclusion complex of 2-phenyl-4H-benzo [d][1,3] oxazin-4-one and β-cyclodextrin. Int. J. Pharm. Pharm. Sci. 2014, 6, 7–10. [Google Scholar]
- Patel, H.M.; Noolvi, M.N.; Shirkhedkar, A.A.; Kulkarni, A.D.; Pardeshi, C.V.; Surana, S.J. Anti-convulsant potential of quinazolinones. RSC Adv. 2016, 6, 44435–44455. [Google Scholar] [CrossRef]
- Yorur-Goreci, C.; Demir, Z.; Altaş, N. Green Synthesis of New Amino Acid Schiff Bases and Their Biological Activities. J. Turkish Chem. Soc. Sect. A Chem. 2016, 3, 15–26. [Google Scholar] [CrossRef] [Green Version]
- Berman, H.M.; Westbrook, J.; Feng, Z.; Gilliland, G.; Bhat, T.N.; Weissig, H.; Shindyalov, I.N.; Bourne, P.E. The protein data bank. Acta Crystallogr. Sect. D Biol. Crystallogr. 2002, 58, 899–907. [Google Scholar] [CrossRef]
- O’Boyle, N.M.; Banck, M.; James, C.A.; Morley, C.; Vandermeersch, T.; Hutchison, G.R. Open Babel: An Open chemical toolbox. J. Cheminform. 2011, 3, 33. [Google Scholar] [CrossRef] [Green Version]
- Dallakyan, S.; Olson, A.J. Small-Molecule Library Screening by Docking with PyRx. Chem. Biol. 2015, 1263, 243–250. [Google Scholar]
- Dash, S.K.; Ghosh, T.; Roy, S.; Chattopadhyay, S.; Das, D. Zinc sulfide nanoparticles selectively induce cytotoxic and genotoxic effects on leukemic cells: Involvement of reactive oxygen species and tumor necrosis factor alpha. J. Appl. Toxicol. 2014, 34, 1130–1144. [Google Scholar] [CrossRef] [PubMed]
- Darzynkiewicz, Z.; Halicka, H.D.; Zhao, H. Analysis of cellular DNA content by flow and laser scanning cytometry. Adv. Exp. Med. Biol. 2010, 675, 137–147. [Google Scholar]
- Kvastad, L.; Solnestam, B.W.; Johansson, E.; Nygren, E.O.; Laddach, N.; Sahlén, P.; Vickovic, S.; Bendigtsen, S.C.; Aaserud, M.; Floer, L.; et al. Single cell analysis of cancer cells using an improved RT-MLPA method has potential for cancer diagnosis and monitoring. Sci. Rep. 2015, 5, 16519. [Google Scholar] [CrossRef]
- Livak, K.J.; Schmittgen, T.D. Analysis of relative gene expression data using real-time quantitative PCR and the 2-ΔΔCT method. Methods 2001, 25, 402–408. [Google Scholar] [CrossRef] [PubMed]
- Salem, M.M.; Donia, T.; Abu-Khudir, R.; Ramadan, H.; Ali, E.M.M.; Mohamed, T.M. Propolis Potentiates Methotrexate Anticancer Mechanism and Reduces its Toxic Effects. Nutr. Cancer 2020, 72, 460–480. [Google Scholar] [CrossRef]
- Bradford, M.M. A rapid and sensitive method for the quantitation of microgram quantities of protein utilizing the principle of protein-dye binding. Anal. Biochem 1976, 72, 248–254. [Google Scholar] [CrossRef]
- Mruk, D.D.; Cheng, C.Y. Enhanced chemiluminescence (ECL) for routine immunoblotting. Spermatogenesis 2011, 1, 121–122. [Google Scholar] [CrossRef] [PubMed] [Green Version]
- El-Naggar, M.; Mohamed, M.E.; Mosallam, A.M.; Salem, W.; Rashdan, H.R.; Abdelmonsef, A.H. Synthesis, Characterization, Antibacterial Activity, and Computer-Aided Design of Novel Quinazolin-2,4-dione Derivatives as Potential Inhibitors Against Vibrio cholerae. Evol. Bioinforma. 2020, 16, 1176934319897596. [Google Scholar] [CrossRef] [PubMed] [Green Version]
- El-Saghier, A.M.; El-Naggar, M.; Hussein, A.H.M.; El-Adasy, A.-B.A.; Olish, M.; Abdelmonsef, A.H. Eco-Friendly Synthesis, Biological Evaluation, and In Silico Molecular Docking Approach of Some New Quinoline Derivatives as Potential Antioxidant and Antibacterial Agents. Front. Chem. 2021, 9, 679967. [Google Scholar] [CrossRef] [PubMed]
- Lu, C.C.; Chiang, J.H.; Tsai, F.J.; Hsu, Y.M.; Juan, Y.N.; Yang, J.S.; Chiu, H.Y. Metformin triggers the intrinsic apoptotic response in human AGS gastric adenocarcinoma cells by activating AMPK and suppressing mTOR/AKT signalling. Int. J. Oncol. 2019, 54, 1271–1281. [Google Scholar]
- Chen, Z.; Zhang, H.; Lu, W.; Huang, P. Role of mitochondria-associated hexokinase II in cancer cell death induced by 3-bromopyruvate. Biochim. Biophys. Acta—Bioenerg. 2009, 1787, 553–560. [Google Scholar] [CrossRef] [Green Version]
- Shafaee, A.; Islamian, J.P.; Zarei, D.; Mohammadi, M.; Nejati-Koshki, K.; Farajollahi, A.; Aghamiri, S.M.R.; Yamchi, M.R.; Baradaran, B.; Jafarabadi, M.A. Induction of apoptosis by a combination of 2-deoxyglucose and metformin in esophageal squamous cell carcinoma by targeting cancer cell metabolism. Iran. J. Med. Sci. 2019, 44, 99–107. [Google Scholar]
- Hasanzadeh, D.; Mahdavi, M.; Dehghan, G.; Charoudeh, H.N. Farnesiferol C induces cell cycle arrest and apoptosis mediated by oxidative stress in MCF-7 cell line. Toxicol. Reports 2017, 4, 420–426. [Google Scholar] [CrossRef]
- Dias Lopes, N.M.; Marinello, P.C.; Sanches, L.J.; da Silva Brito, W.A.; Lovo-Martins, M.I.; Pinge-Filho, P.; Luiz, R.C.; Cecchini, R.; Cecchini, A.L. Patterns of cell death induced by metformin in human MCF-7 breast cancer cells. Pathol. Res. Pract. 2020, 216, 153199. [Google Scholar] [CrossRef]
- Fu, S.C.; Liu, J.M.; Lee, K.I.; Tang, F.C.; Fang, K.M.; Yang, C.Y.; Su, C.C.; Chen, H.H.; Hsu, R.J.; Chen, Y.W. Cr(VI) induces ROS-mediated mitochondrial-dependent apoptosis in neuronal cells via the activation of Akt/ERK/AMPK signaling pathway. Toxicol. Vitr. 2020, 65, 104795. [Google Scholar] [CrossRef]


| Gene | Forward Primer (/5---/3) | Reverse Primer (/5---/3) |
|---|---|---|
| Bax | GGCTGGACACTGGACTTCCT | GGTGAGGACTCCAGCCACAA |
| P53 | TAACAGTTCCTGCATGGGCGGC | AGGACAGGCACAAACACGCACC |
| Bcl-2 | TTCGCAGAGATGTCCAGTCA | TTCAGAGACAGCCAGGAGAA |
| GAPDH | TGTGTCCGTCGTGGATCTGA | CCTGCTTCACCACCTTCTTGA |
| HK | NADH | |||||
|---|---|---|---|---|---|---|
| (ΔGbind) | Docked Complex (Amino Acid–Ligand) Interactions | Distance (Å) | (ΔGbind) | Docked Complex (Amino Acid–Ligand) Interactions | Distance (Å) | |
| 3 | −7.7 | −9.4 | H-bonds | |||
| Lys202:NZ―compound 3 | 2.98 | |||||
| π-π interactions | ||||||
| H-bonds | Phe205―compound 3 | 4.28 | ||||
| Glu220:OE1―compound 3 | 2.38 | Phe205―compound 3 | 4.29 | |||
| π-σ interactions | Phe78―compound 3 | 3.93 | ||||
| Pro105:CD―compound 3 | 3.61 | Phe78―compound 3 | 4.23 | |||
| π-cation interactions | ||||||
| Lys75:NZ―compound 3 | 5.42 | |||||
| Lys75:NZ―compound 3 | 5.25 | |||||
| 4 | −7.6 | −9.5 | H-bonds | |||
| Lys202:NZ―compound 4 | 3 | |||||
| π-π interactions | ||||||
| H-bonds | Phe205―compound 4 | 4.17 | ||||
| Ile114:N―compound 4 | 3 | Phe205―compound 4 | 4.18 | |||
| π-σ interactions | Phe78―compound 4 | 4.07 | ||||
| Met300:CA―compound 4 | 3.87 | Phe78―compound 4 | 4.32 | |||
| π-cation interactions | ||||||
| Lys75:NZ―compound 4 | 5.71 | |||||
| Lys75:NZ―compound 4 | 5.36 | |||||
| 5 | −8.6 | 3.88 | −10.7 | H-bonds | ||
| Glu184:OE2―compound 5 | 2.11 | |||||
| π-π interactions | ||||||
| Phe205―compound 5 | 4.28 | |||||
| π-σ interactions | Phe205―compound 5 | 3.95 | ||||
| Met300:CA―compound 5 | Phe78―compound 5 | 4.37 | ||||
| Phe78―compound 5 | 4.21 | |||||
| π-cation interactions | ||||||
| Lys75:NZ―compound 5 | 5.38 | |||||
| Lys75:NZ―compound 5 | 5.43 | |||||
| Lys75:NZ―compound 5 | 5.91 | |||||
| 6 | −7.9 | −9.3 | H-bonds | |||
| Lys202:NZ―compound 6 | 2.99 | |||||
| Glu185:OE2―compound 6 | 2.46 | |||||
| H-bonds | π-π interactions | |||||
| Tyr90:N--compound 6 | 2.95 | Phe205―compound 6 | 4.12 | |||
| π-σ interactions | Phe205―compound 6 | 4.24 | ||||
| Met300:CA--compound 6 | 3.91 | Phe78―compound 6 | 4.08 | |||
| Phe78―compound 6 | 4.28 | |||||
| π-cation interactions | ||||||
| Lys75:NZ―compound 6 | 5.55 | |||||
| Lys75:NZ―compound 6 | 5.4 | |||||
| 7 | −8.3 | −11.0 | H-bonds | |||
| Asn92:ND2―compound 7 | 2.95 | |||||
| H-bonds | Lys202:NZ―compound 7 | 2.87 | ||||
| Thr88:OG1―compound 7 | 2.95 | π-π interactions | ||||
| Ile114:N―compound 7 | 2.96 | Phe205―compound 7 | 4.1 | |||
| Ile114:O―compound 7 | 2.94 | Phe205―compound 7 | 4.18 | |||
| Thr232:OG1―compound 7 | 2.65 | Phe78―compound 7 | 4.46 | |||
| Phe78―compound 7 | 3.99 | |||||
| π-cation interactions | ||||||
| Lys75:NZ―compound 7 | 5.88 | |||||
| 8 | −7.7 | −12.8 | H-bonds | 2.93 | ||
| Glu97:OE1―compound 8 | 2.89 | |||||
| Tyr180:OH―compound 8 | ||||||
| π-σ interactions | π-π interactions | |||||
| Pro105:CD―compound 8 | Phe205―compound 8 | 4.14 | ||||
| Phe205―compound 8 | 4.24 | |||||
| Phe78―compound 8 | 4.35 | |||||
| Phe78―compound 8 | 4.05 | |||||
| 9 | −7.2 | −9.5 | H-bonds | |||
| H-bonds | Lys75:NZ―compound 9 | 2.92 | ||||
| Lys62:NZ―compound 9 | Gly183:O―compound 9 | 2.35 | ||||
| Glu266:OE1―compound 9 | π-π interactions | |||||
| Lys267:NZ―compound 9 | Phe205―compound 9 | 4.43 | ||||
| π-cation interactions | Phe205―compound 9 | 4.29 | ||||
| Lys62:NZ―compound 9 | Phe78―compound 9 | 4.31 | ||||
| Phe78―compound 9 | 3.79 | |||||
| 10 | −8.6 | 3.83 | −9.6 | H-bonds | ||
| Glu184:OE2―compound 10 | 2.23 | |||||
| Lys202:NZ―compound 10 | 2.88 | |||||
| π-π interactions | ||||||
| π-σ interactions | Phe205―compound 10 | 4.37 | ||||
| Met300:CA―compound 10 | Phe205―compound 10 | 3.94 | ||||
| Phe78―compound 10 | 4.41 | |||||
| Phe78―compound 10 | 4.15 | |||||
| π-cation interactions | ||||||
| Lys75:NZ―compound 10 | 5.38 | |||||
| Lys75:NZ―compound 10 | 5.3 | |||||
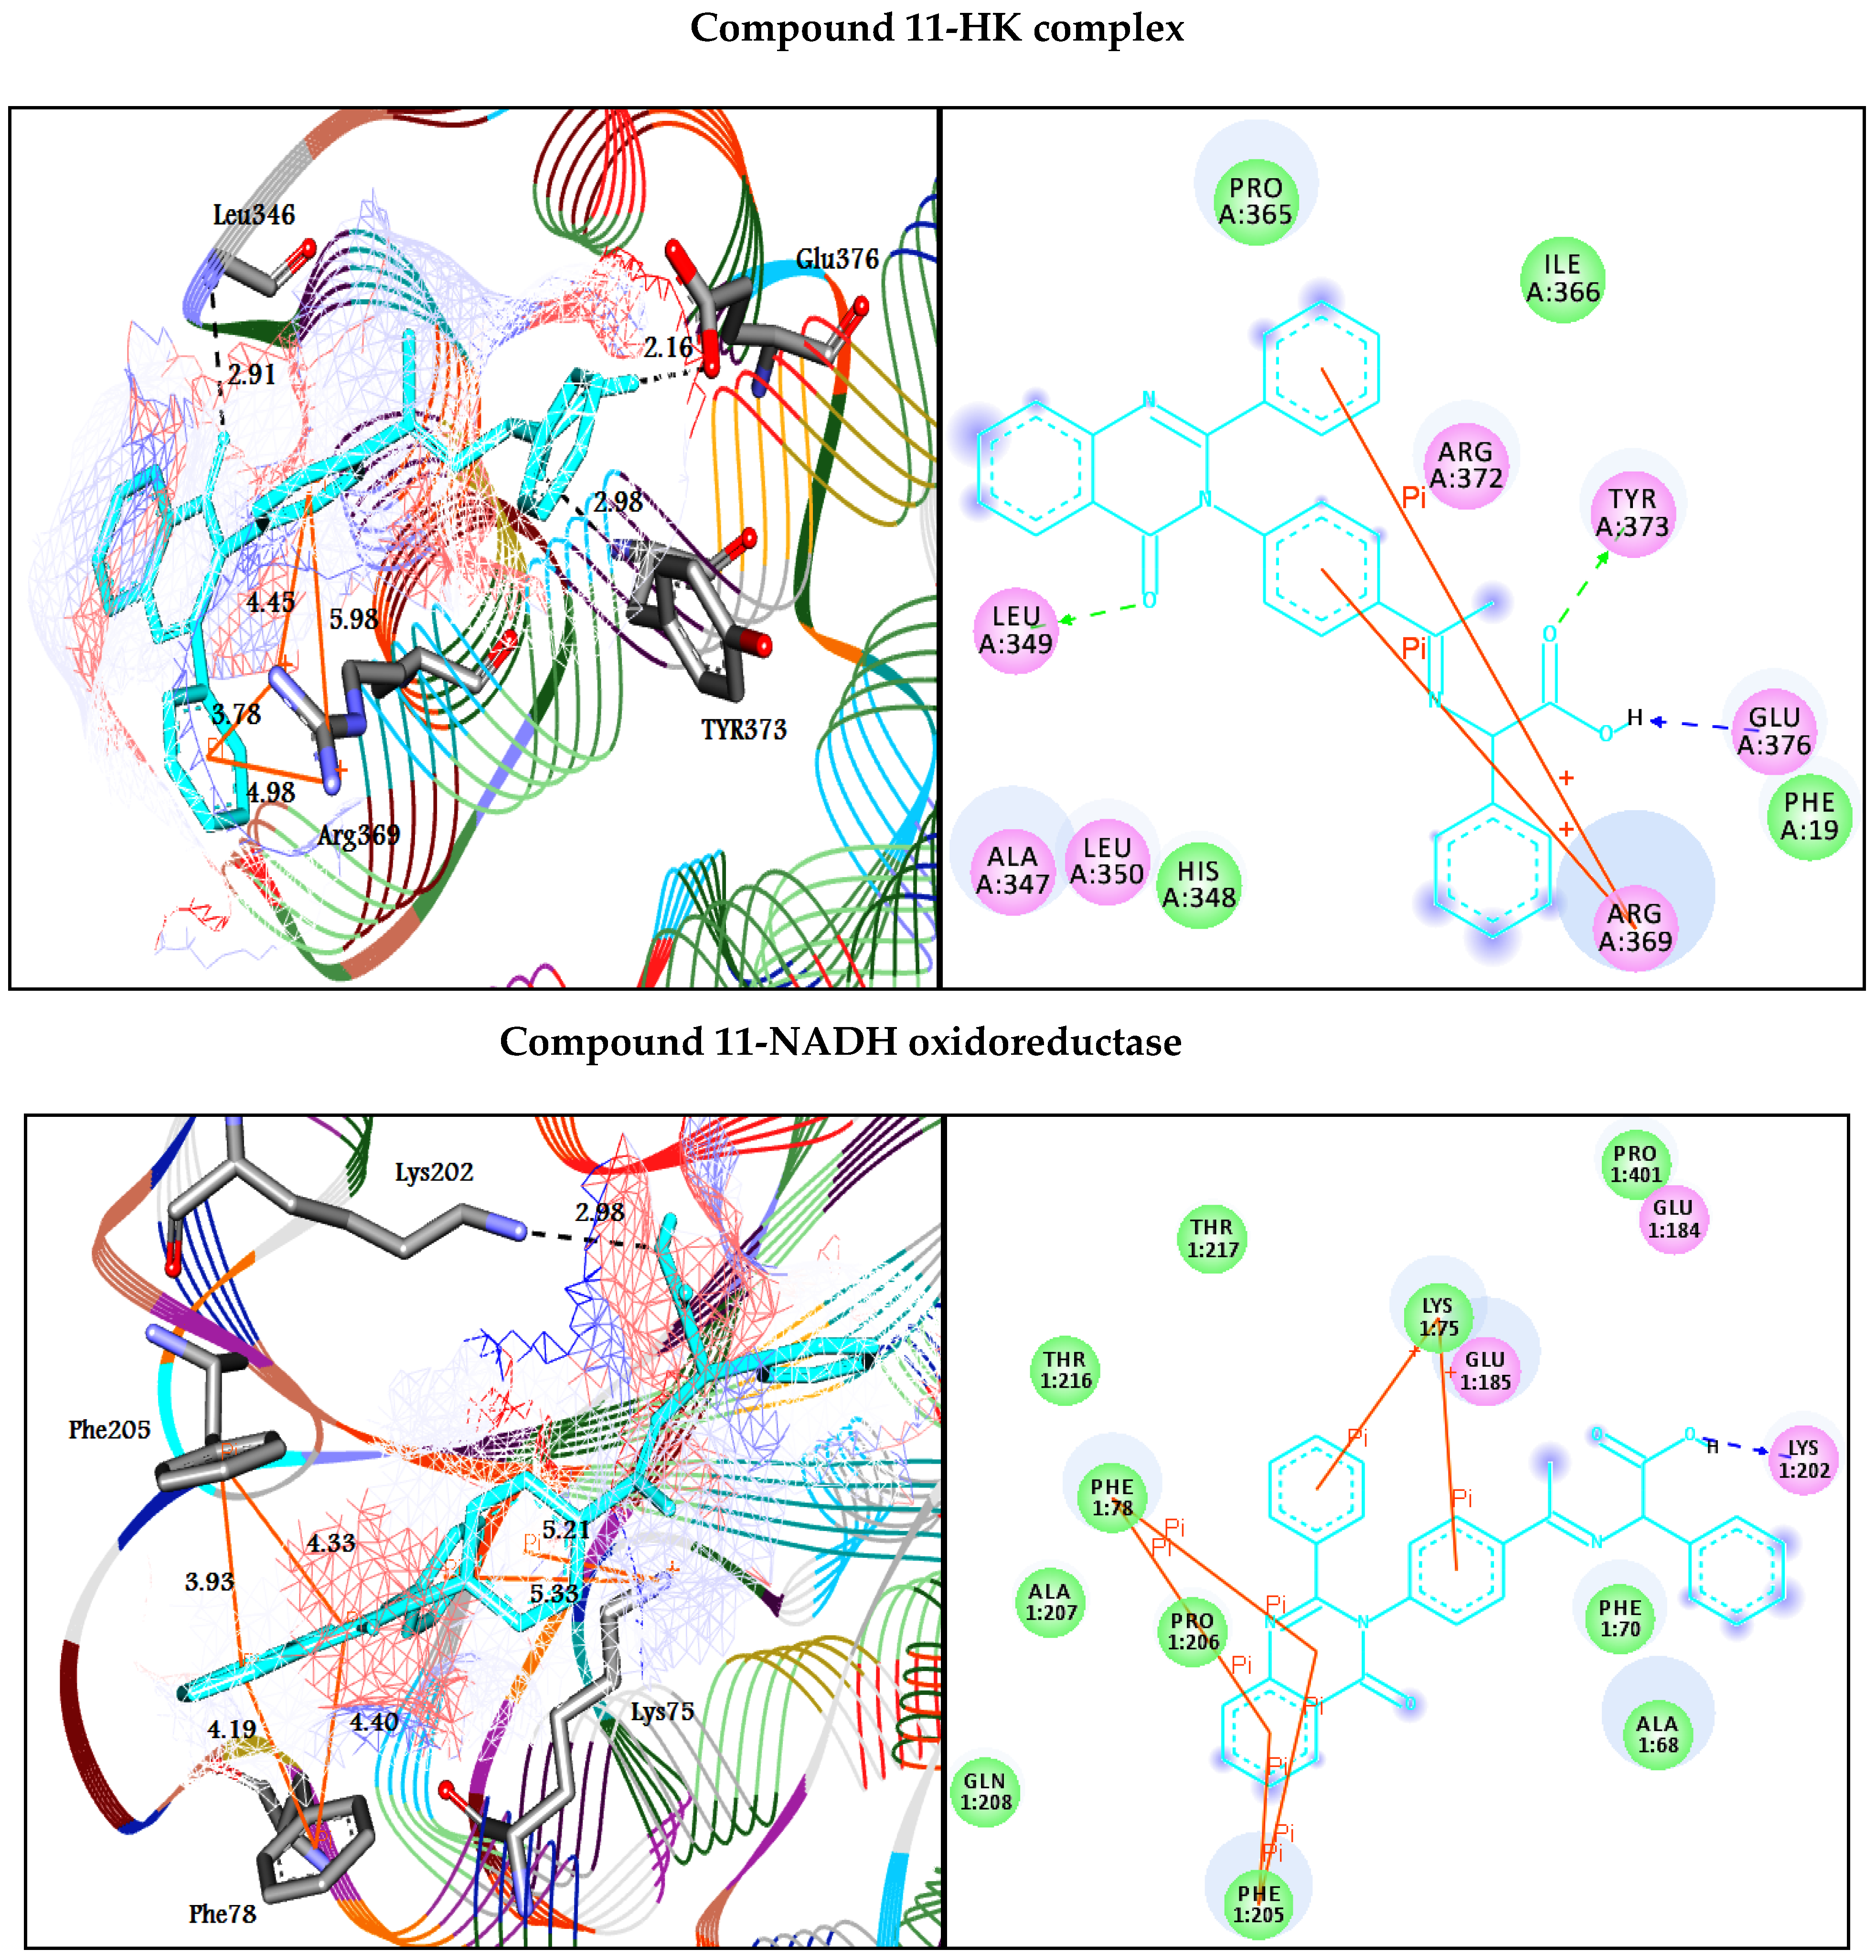
| 11 | −8.8 | H-bonds | −13.0 | H-bonds | ||
| Leu349:N―compound 11 | 2.91 | Lys202:NZ―compound 11 | 2.98 | |||
| Tyr373:N―compound 11 | 2.98 | π-π interactions | ||||
| Glu376―compound 11 | 2.16 | Phe205―compound 11 | 4.33 | |||
| π-cation interactions | Phe205―compound 11 | 3.93 | ||||
| Arg369:NH1―compound 11 | 4.45 | Phe78―compound 11 | 4.4 | |||
| Arg369:NH1―compound 11 | 3.78 | Phe78―compound 11 | 4.19 | |||
| Arg369:NH2―compound 11 | 5.98 | π-cation interactions | ||||
| Arg369:NH2―compound 11 | 4.98 | Lys75:NZ―compound 11 | 5.21 | |||
| Lys75:NZ―compound 11 | 5.33 | |||||
| 12 | H-bonds | −7.1 | H-bonds | |||
| Thr232:N―compound 12 | 3.1 | Asn92:ND2―compound 12 | 2.96 | |||
| Thr232:N―compound 12 | 2.93 | Asn92:ND2―compound 12 | 3.01 | |||
| Gly233:N―compound 12 | 2.83 | Tyr180:O―compound 12 | 1.86 | |||
| π-cation interactions | π-π interactions | |||||
| Lys418:NZ―compound 12 | 5.93 | Tyr180―compound 12 | 4.72 | |||
| Lys418:NZ―compound 12 | 5.98 | Tyr180―compound 12 | 3.98 | |||
| 13 | −8.0 | H-bonds | ||||
| Asn92:ND2―compound 13 | 2.95 | |||||
| H-bonds | Asn92:ND2―compound 13 | 2.98 | ||||
| Gly303:N―compound 13 | Tyr180:O―compound 13 | 1.81 | ||||
| Thr336:OG1―compound 13 | π-π interactions | |||||
| Tyr180―compound 13 | 4.74 | |||||
| Tyr180―compound 13 | 4.04 | |||||
| 14 | H-bonds | −8.4 | ||||
| Thr88:N―compound 14 | 2.95 | |||||
| Thr88:OG1―compound 14 | 2.92 | |||||
| Thr232:N―compound 14 | 2.85 | H-bonds | ||||
| Thr232:N―compound 14 | 2.85 | Tyr180:O―compound 14 | 2.94 | |||
| Thr232:OG1―compound 14 | 2.99 | π-π interactions | ||||
| Gly233:N―compound 14 | 2.94 | Tyr180―compound 14 | 4.75 | |||
| π-cation interactions | ||||||
| Lys418:NZ―compound 14 | 4.02 | |||||
| Lys418:NZ―compound 14 | 4.43 | |||||
| 15 | H-bonds | −7.8 | H-bonds | |||
| Thr88:N―compound 15 | 2.9 | Asn92:ND2―compound 15 | 2.93 | |||
| Thr88:OG1―compound 15 | 2.87 | Ser96:N―compound 15 | 2.93 | |||
| Thr232:N―compound 15 | 2.98 | Ser96:N―compound 15 | 2.89 | |||
| Thr232:N―compound 15 | 2.92 | π-π interactions | ||||
| Thr232:OG1―compound 15 | 2.99 | Tyr180―compound 15 | 4.96 | |||
| Gly233:N―compound 15 | 2.89 | Tyr180―compound 15 | 4.16 | |||
| Asp209:OD2―compound 15 | 2.08 | |||||
| 16 | H-bonds | −8.6 | H-bonds | |||
| Thr88:N―compound 16 | 3.02 | Asn92:ND2―compound 16 | 2.81 | |||
| Thr88:OG1―compound 16 | 2.33 | Ser100:OG―compound 16 | 2.64 | |||
| Thr232:N―compound 16 | 2.86 | Lys102:NZ―compound 16 | 2.95 | |||
| Thr232: OG1―compound 16 | 2.77 | π-π interactions | ||||
| Thr232:OG1―compound 16 | 2.31 | Tyr180―compound 16 | 5.15 | |||
| Ser415:OG―compound 16 | 2.89 | Tyr180―compound 16 | 4.28 | |||
| 17 | H-bonds | −8.1 | ||||
| Thr88:N―compound 17 | 2.96 | |||||
| Thr88:OG1―compound 17 | 2.82 | H-bonds | ||||
| Thr88:OG1―compound 17 | 2.23 | Gly66:O―compound 17 | 2.4 | |||
| Thr232:N―compound 17 | 2.99 | Asn92:ND2―compound 17 | 2.97 | |||
| Thr232:N―compound 17 | 2.98 | π-π interactions | ||||
| Thr232:OG1―compound 17 | 3 | Tyr180―compound 17 | 4.9 | |||
| π-cation interactions | Tyr180―compound 17 | 4.13 | ||||
| Lys418:NZ―compound 17 | 3.58 | |||||
| Lys418:NZ―compound 17 | 4.4 | |||||
| 18 | H-bonds | −8.0 | ||||
| Thr88:N―compound 18 | 3 | |||||
| Thr88:OG1―compound 18 | 2.89 | H-bonds | ||||
| Thr88:OG1―compound 18 | 2.19 | Asn92:ND2―compound 18 | 3.09 | |||
| Thr232:N―compound 18 | 2.99 | Asn92:ND2―compound 18 | 2.89 | |||
| Thr232:N―compound 18 | 2.98 | Asp103:OD2―compound 18 | 1.93 | |||
| Thr232:OG1―compound 18 | 2.95 | π-π interactions | ||||
| Asp413:OD2―compound 18 | 2.37 | Tyr180―compound 18 | 5.03 | |||
| π-cation interactions | Tyr180―compound 18 | 4.55 | ||||
| Lys418:NZ―compound 18 | 3.63 | |||||
| Lys418:NZ―compound 18 | 4.52 | |||||
| 19 | H-bonds | −8.4 | H-bonds | |||
| Thr88:OG1―compound 19 | 2.42 | Asn92:ND2―compound 19 | 2.97 | |||
| Asn89:ND2―compound 19 | 2.99 | Ser96:N―compound 19 | 2.95 | |||
| Asp413:OD1―compound 19 | 2.4 | Glu97:N―compound 19 | 3.06 | |||
| Asp413:OD2―compound 19 | 2.4 | π-π interactions | ||||
| Glu446:O―compound 19 | 2.39 | Tyr180―compound 19 | 4.85 | |||
| π-sigma interactions | Tyr180―compound 19 | 4.14 | ||||
| Gly414:CA―compound 19 | 3.86 | |||||
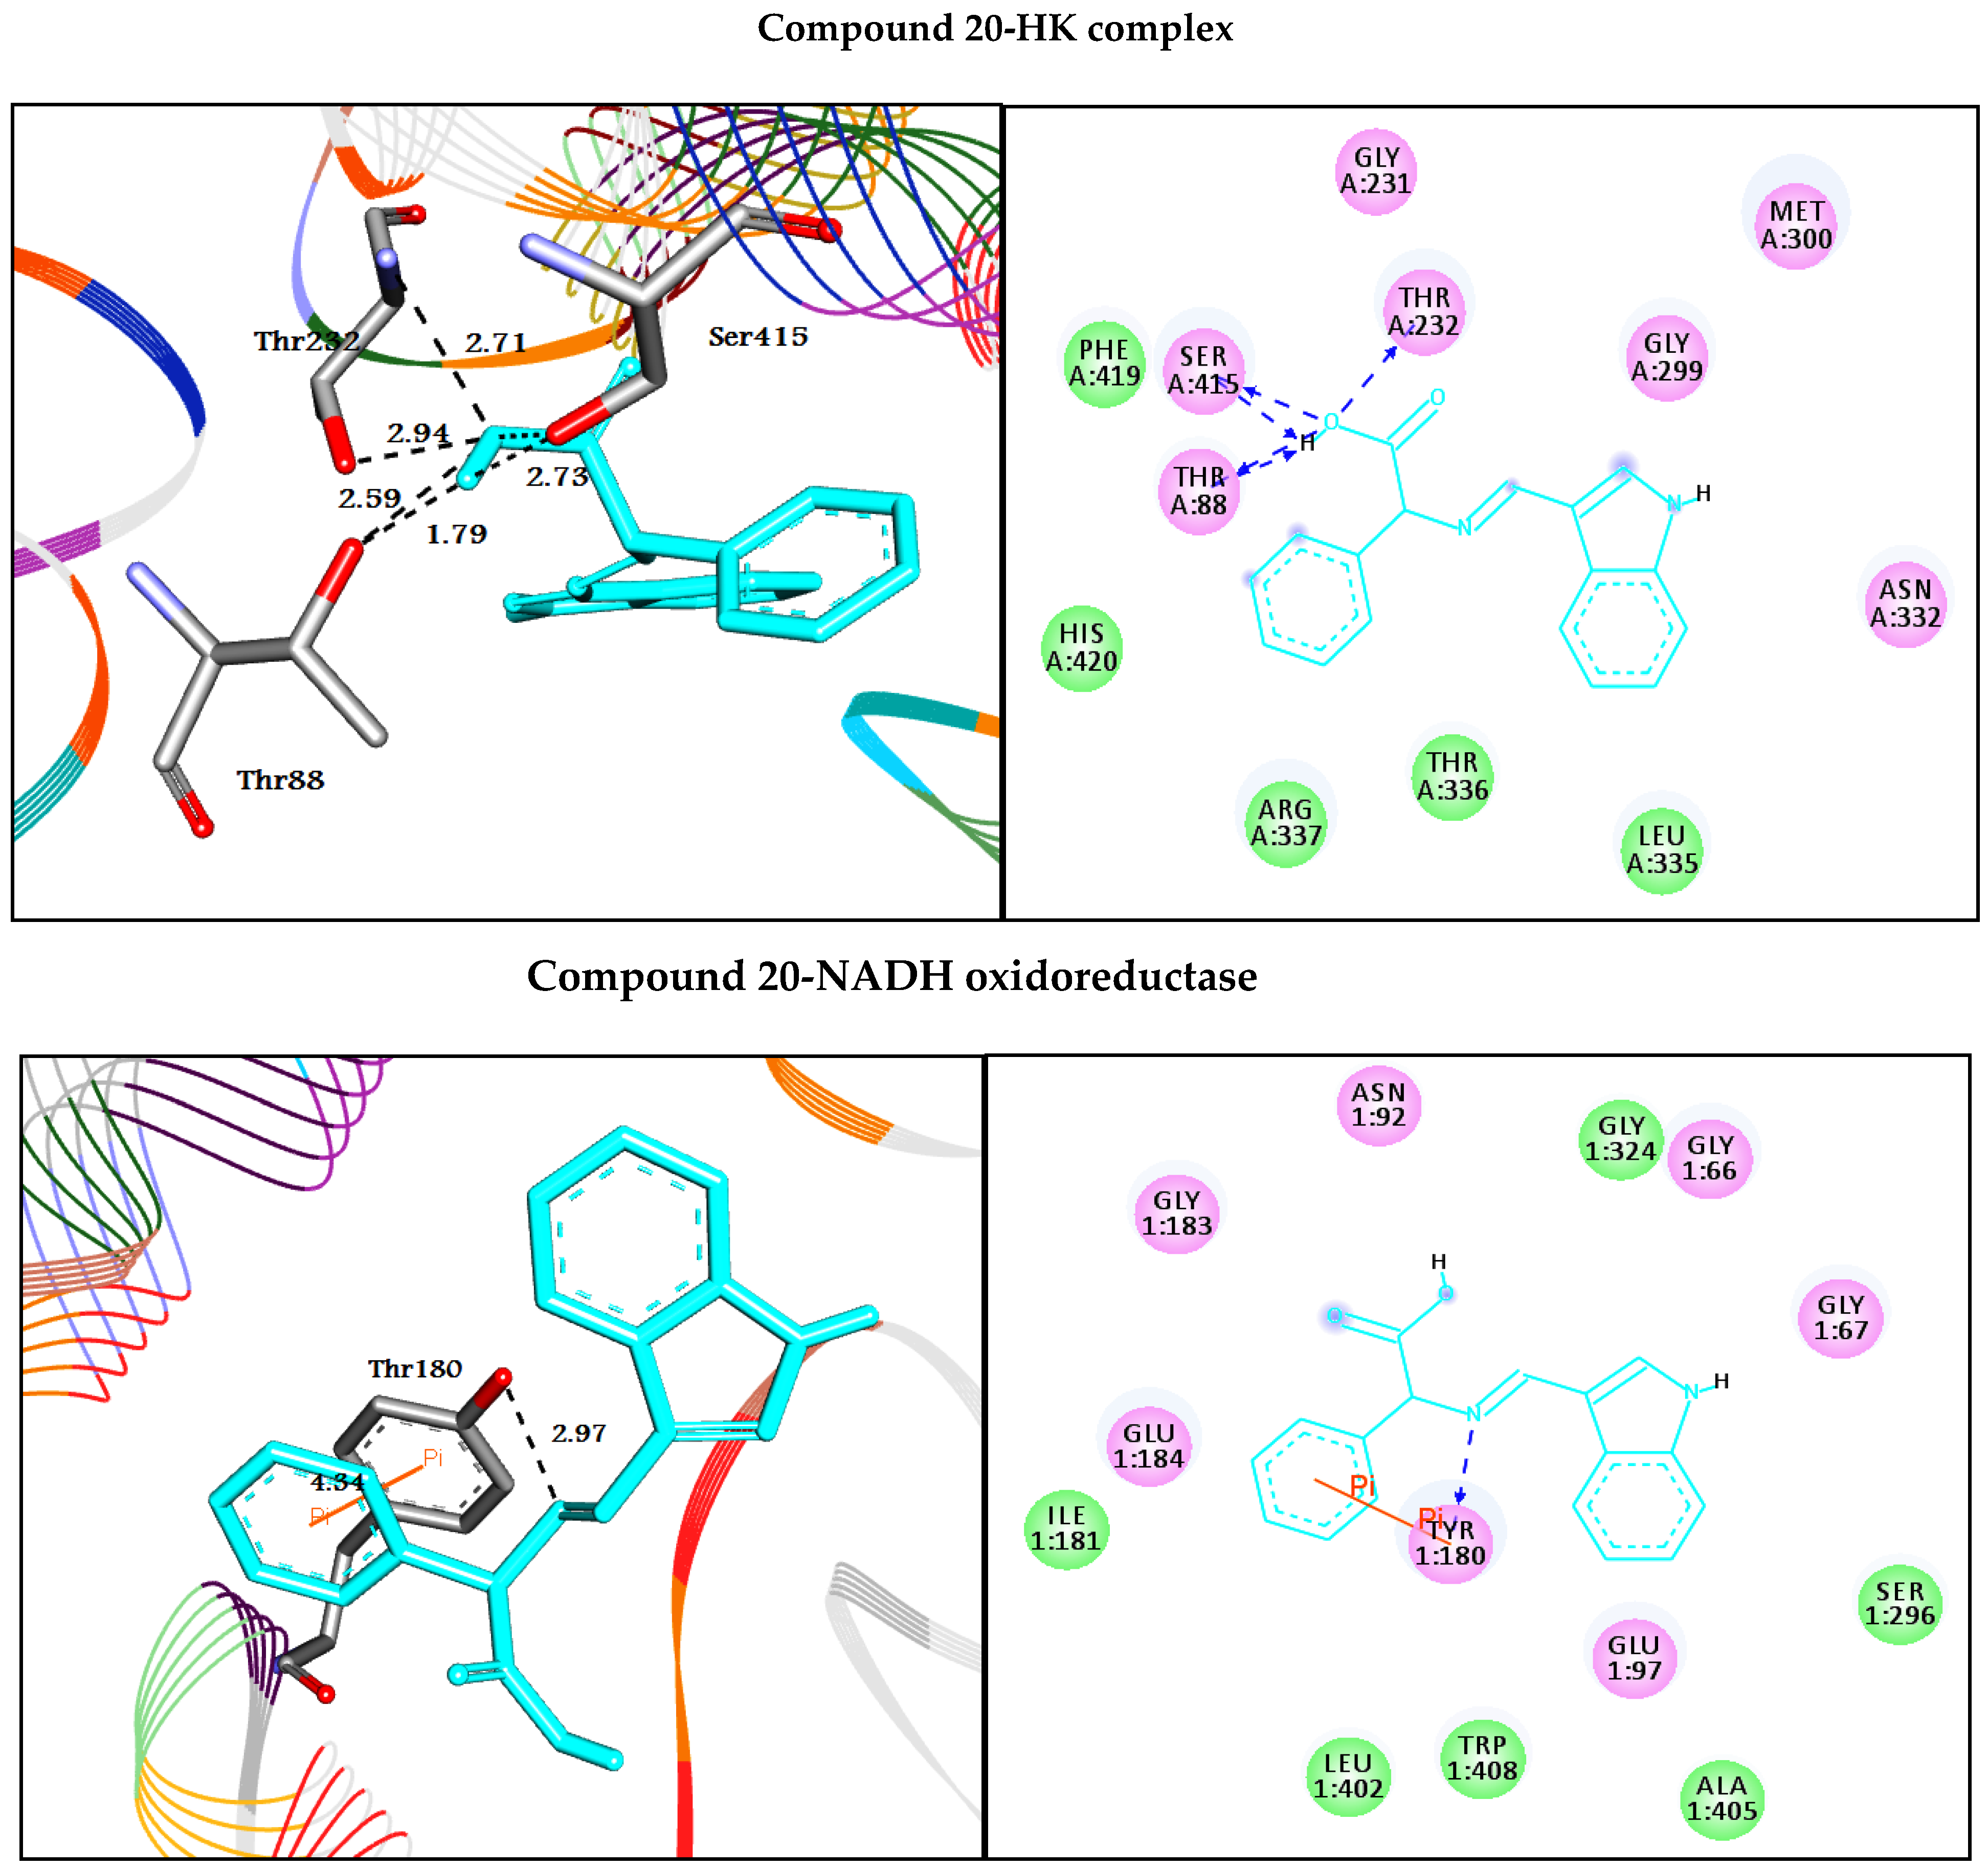
| 20 | −7.9 | H-bonds | −10.0 | |||
| Thr88:OG1―compound 20 | 2.59 | |||||
| Thr88:OG1―compound 20 | 1.79 | H-bonds | ||||
| Thr232:N―compound 20 | 2.94 | Tyr180:OH―compound 20 | 2.97 | |||
| Thr232:OG1―compound 20 | 2.71 | π-π interactions | ||||
| Ser415:OG―compound 20 | 2.73 | Tyr180―compound 20 | 4.34 | |||
| Ser415:OG―compound 20 | 2.31 | |||||
| Molecular Weight (g/mol) | BBB Permeant | % (HIA+) | logp | TPSA A2 | HBA | HBD | N Rotatable | N Violations | Volume A [3] | GI Absorption | Bioavailability Score | |
|---|---|---|---|---|---|---|---|---|---|---|---|---|
| Reference Range | 130–500 | <25 Poor >80 High | <5 | ≤140 | 2–20 | 0–6 | ≤10 | <5 | 500–2000 | |||
| 3 | 397.43 | No | 90 | 3.06 | 84.56 | 6 | 1 | 5 | 0 | 354.67 | High | 0.56 |
| 4 | 411.45 | No | 98 | 2.84 | 84.56 | 6 | 1 | 5 | 0 | 371.26 | High | 0.56 |
| 5 | 487.55 | No | 97 | 4.30 | 84.56 | 6 | 1 | 7 | 0 | 442.91 | High | 0.56 |
| 6 | 427.25 | No | 95 | 1.87 | 104.79 | 7 | 2 | 6 | 0 | 379.52 | High | 0.56 |
| 7 | 503.55 | No | 88 | 3.83 | 104.79 | 7 | 2 | 7 | 1 | 450.39 | High | 0.56 |
| 8 | 453.53 | No | 91 | 4.15 | 84.56 | 6 | 1 | 7 | 0 | 421.45 | High | 0.56 |
| 9 | 468.55 | No | 88 | 2.35 | 110.58 | 7 | 3 | 9 | 0 | 433.19 | High | 0.55 |
| 10 | 454.48 | No | 91 | 2.73 | 127.65 | 8 | 3 | 7 | 0 | 401.77 | High | 0.56 |
| 11 | 473.53 | No | 96 | 4.44 | 84.56 | 6 | 1 | 6 | 0 | 426.11 | High | 0.56 |
| 12 | 202.21 | Yes | 73 | 0.26 | 65.45 | 4 | 2 | 3 | 0 | 180.08 | High | 0.85 |
| 13 | 216.24 | Yes | 87 | 0.04 | 65.45 | 4 | 2 | 3 | 0 | 196.67 | High | 0.85 |
| 14 | 292.34 | Yes | 81 | 1.50 | 65.45 | 4 | 2 | 5 | 0 | 268.32 | High | 0.85 |
| 15 | 232.24 | No | 80 | -0.93 | 85.68 | 5 | 3 | 4 | 0 | 204.93 | High | 0.56 |
| 16 | 308.33 | No | 83 | 1.02 | 85.68 | 5 | 3 | 5 | 0 | 276.34 | High | 0.56 |
| 17 | 258.32 | Yes | 75 | 1.35 | 65.45 | 4 | 2 | 5 | 0 | 246.86 | High | 0.85 |
| 18 | 273.43 | No | 85 | -0.45 | 91.48 | 5 | 4 | 7 | 0 | 258.61 | High | 0.55 |
| 19 | 259.26 | No | 90 | -0.07 | 108.55 | 6 | 4 | 5 | 0 | 227.18 | High | 0.56 |
| 20 | 278.31 | No | 99 | 2.75 | 65.45 | 4 | 2 | 4 | 0 | 251.52 | High | 0.85 |
Publisher’s Note: MDPI stays neutral with regard to jurisdictional claims in published maps and institutional affiliations. |
© 2021 by the authors. Licensee MDPI, Basel, Switzerland. This article is an open access article distributed under the terms and conditions of the Creative Commons Attribution (CC BY) license (https://creativecommons.org/licenses/by/4.0/).
Share and Cite
Noser, A.A.; Abdelmonsef, A.H.; El-Naggar, M.; Salem, M.M. New Amino Acid Schiff Bases as Anticancer Agents via Potential Mitochondrial Complex I-Associated Hexokinase Inhibition and Targeting AMP-Protein Kinases/mTOR Signaling Pathway. Molecules 2021, 26, 5332. https://doi.org/10.3390/molecules26175332
Noser AA, Abdelmonsef AH, El-Naggar M, Salem MM. New Amino Acid Schiff Bases as Anticancer Agents via Potential Mitochondrial Complex I-Associated Hexokinase Inhibition and Targeting AMP-Protein Kinases/mTOR Signaling Pathway. Molecules. 2021; 26(17):5332. https://doi.org/10.3390/molecules26175332
Chicago/Turabian StyleNoser, Ahmed A., Aboubakr H. Abdelmonsef, Mohamed El-Naggar, and Maha M. Salem. 2021. "New Amino Acid Schiff Bases as Anticancer Agents via Potential Mitochondrial Complex I-Associated Hexokinase Inhibition and Targeting AMP-Protein Kinases/mTOR Signaling Pathway" Molecules 26, no. 17: 5332. https://doi.org/10.3390/molecules26175332
APA StyleNoser, A. A., Abdelmonsef, A. H., El-Naggar, M., & Salem, M. M. (2021). New Amino Acid Schiff Bases as Anticancer Agents via Potential Mitochondrial Complex I-Associated Hexokinase Inhibition and Targeting AMP-Protein Kinases/mTOR Signaling Pathway. Molecules, 26(17), 5332. https://doi.org/10.3390/molecules26175332