
Effect of Precursor Nature and Sol-Gel Synthesis Conditions on TiO2 Aerogel’s Structure

 ,
,
Abstract
1. Introduction
2. Results and Discussions
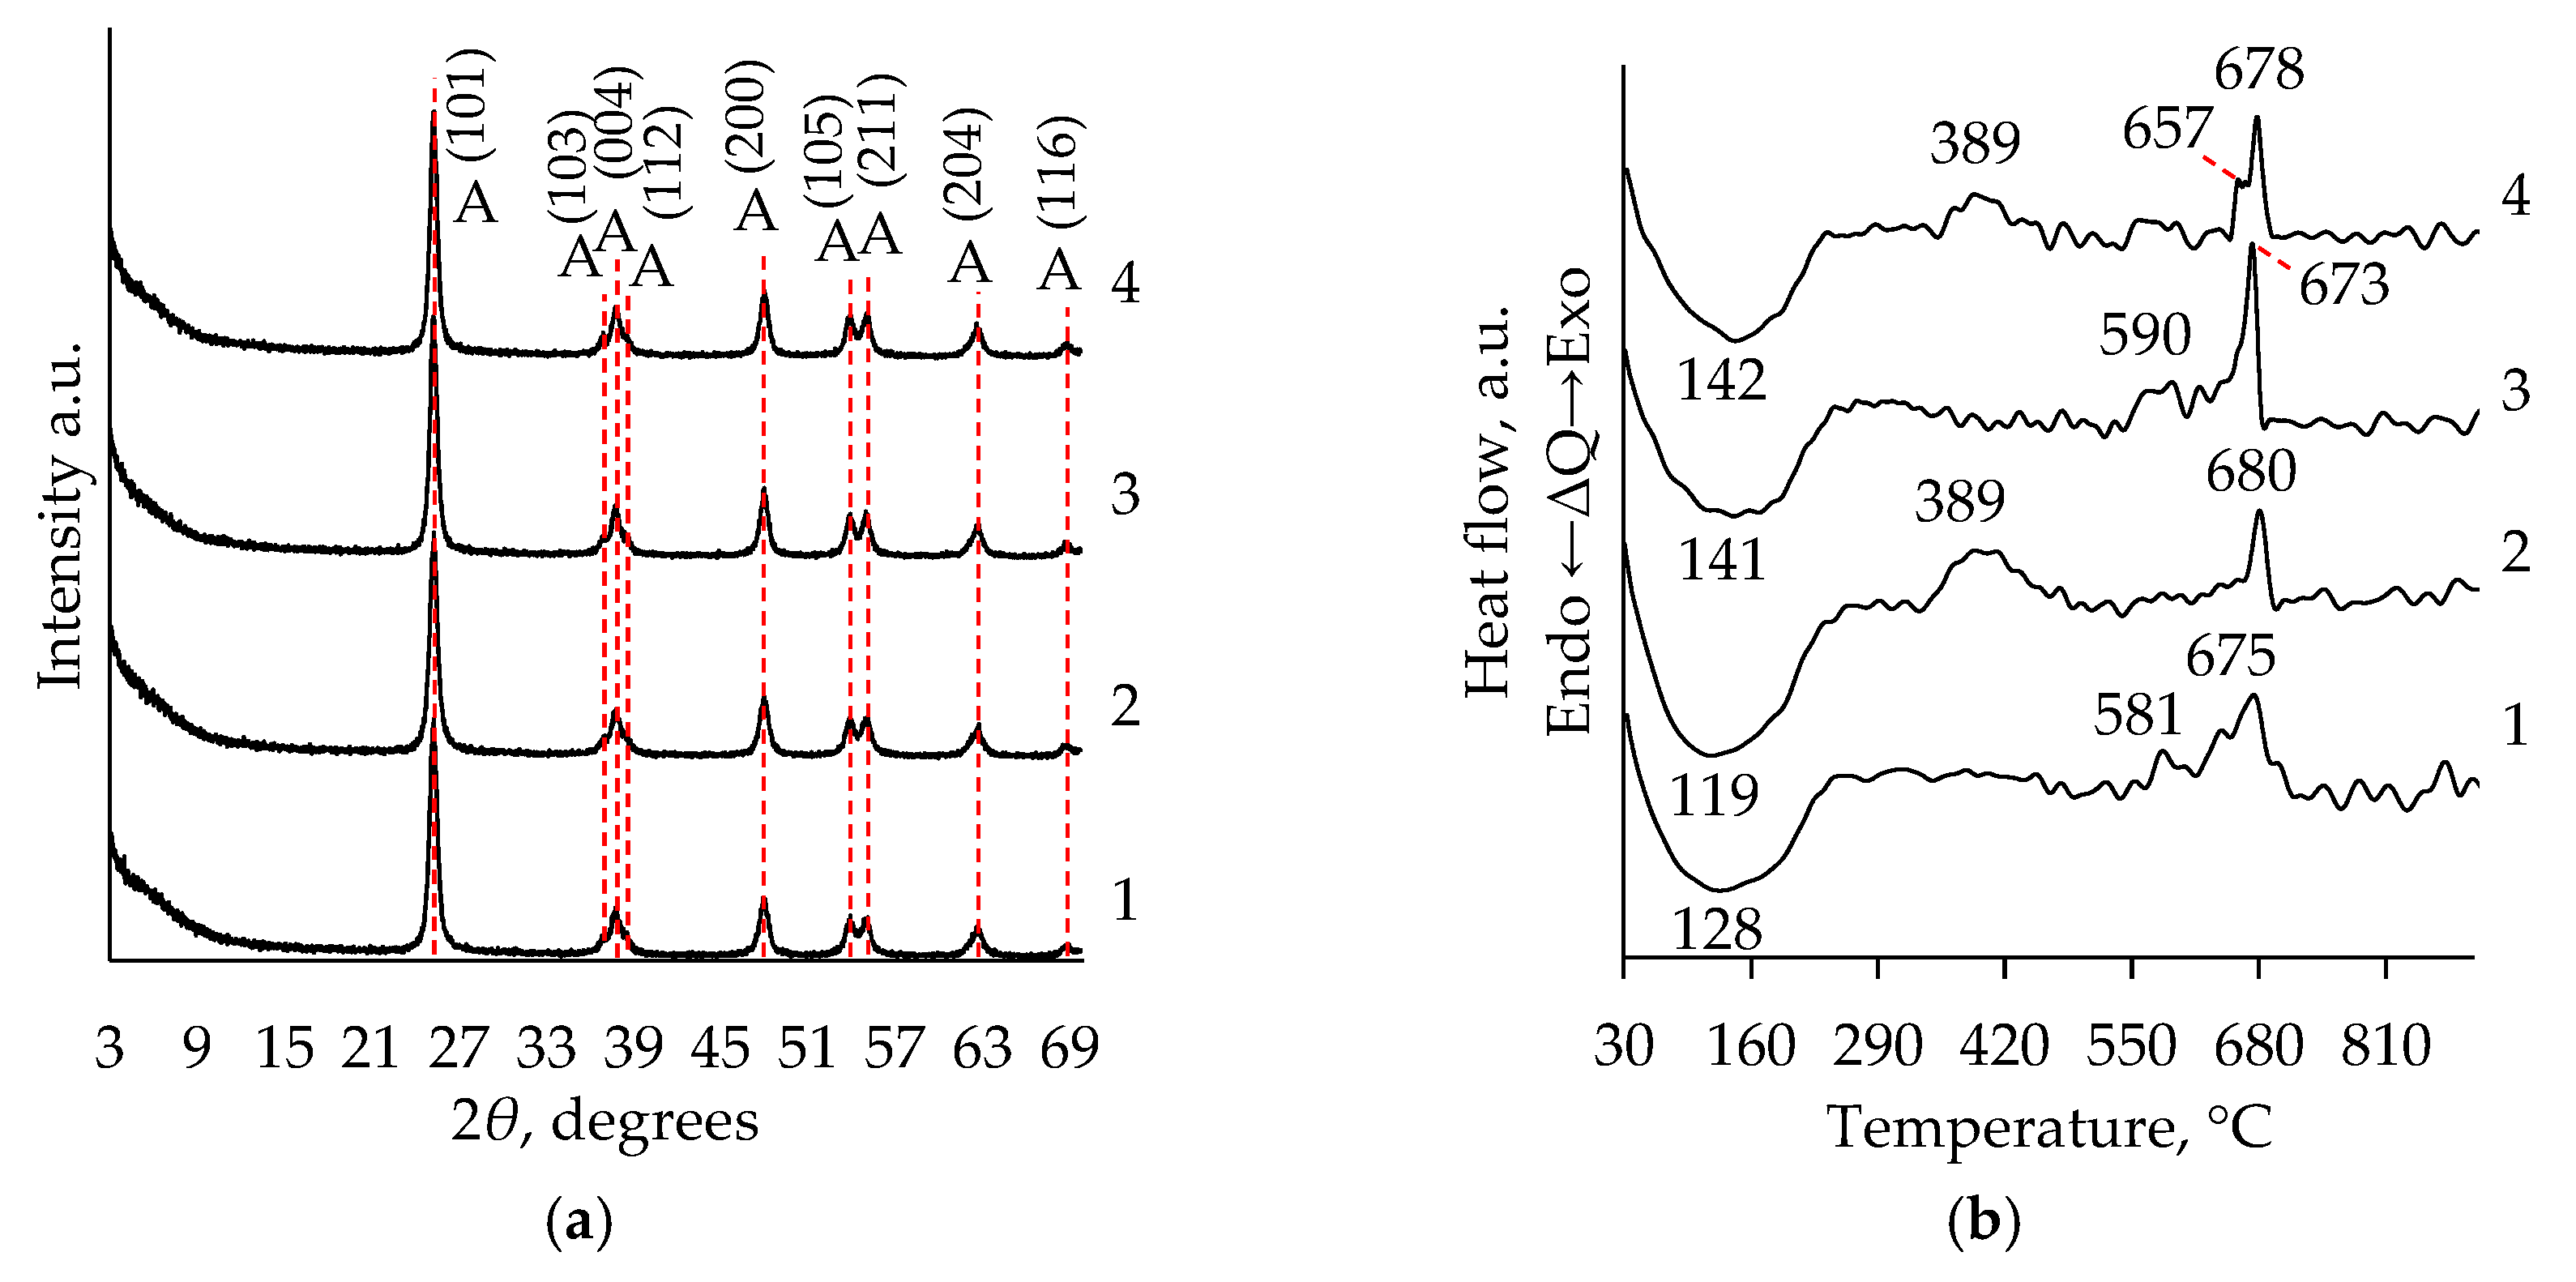
2.1. XRD Analysis
2.2. Thermal Analysis
2.3. FT-IR Analysis
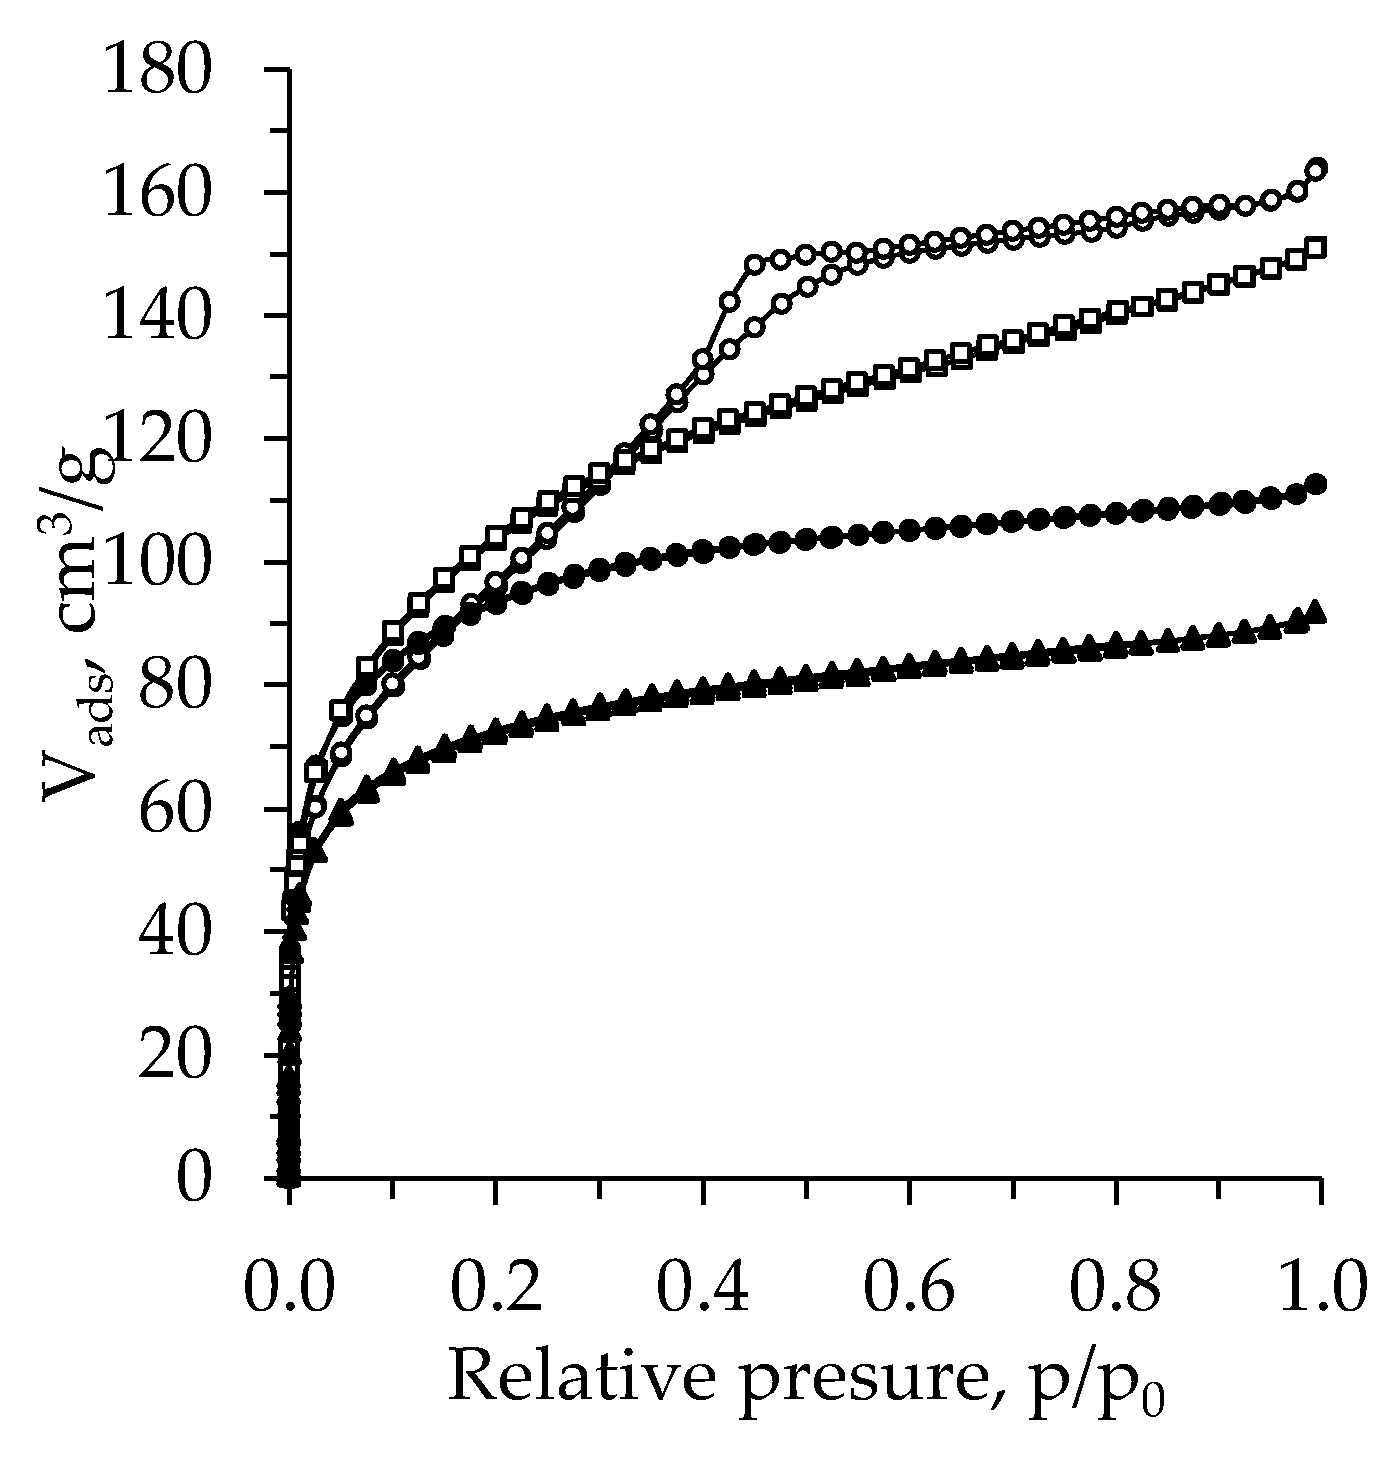
2.4. BET Analysis
2.5. UV-Vis Analysis
3. Materials and Methods
3.1. Materials
3.2. TiO2 Aerogels Synthesis
3.3. Characterization
4. Conclusions
Supplementary Materials
Author Contributions
Funding
Institutional Review Board Statement
Informed Consent Statement
Data Availability Statement
Acknowledgments
Conflicts of Interest
Sample Availability
References
- Bernardes, J.C.; Müller, D.; Pinheiro, G.K.; Rambo, C.R. Enhancing the optical transparency of TiO2 aerogels with high surface area through water-based synthesis. Opt. Mater. 2020, 109, 110359. [Google Scholar] [CrossRef]
- Zirakjou, A.; Mehdinavaz Aghdam, R.; Pashaei Soorbaghi, F. Synthesis and Characterization of Monolithic Titania/Nanoclay Nanocomposite Aerogels. Procedia Mater. Sci. 2015, 11, 548–552. [Google Scholar] [CrossRef][Green Version]
- Yue, X.; Xiang, J.; Chen, J.; Li, H.; Qiu, Y.; Yu, X. High surface area, high catalytic activity titanium dioxide aerogels prepared by solvothermal crystallization. J. Mater. Sci. Technol. 2020, 47, 223–230. [Google Scholar] [CrossRef]
- Yorov, K.E.; Kolesnik, I.V.; Romanova, I.P.; Mamaeva, Y.B.; Sipyagina, N.A.; Lermontov, S.A.; Kopitsa, G.P.; Baranchikov, A.E.; Ivanov, V.K. Engineering SiO2–TiO2 binary aerogels for sun protection and cosmetic applications. J. Supercritic. Fluids 2021, 169, 105099. [Google Scholar] [CrossRef]
- Gu, J.; Hu, C.; Zhang, W.; Dichiara, A.B. Reagentless preparation of shape memory cellulose nanofibril aerogels decorated with Pd nanoparticles and their application in dye discoloration. Catal. B Environ. 2018, 237, 482–490. [Google Scholar] [CrossRef]
- Hanzawa, Y.; Kaneko, K.; Pekala, R.W.; Dresselhaus, M.S. Activated carbon aerogels. Langmuir 1996, 12, 6167–6169. [Google Scholar] [CrossRef]
- Hu, L.; He, R.; Lei, H.; Fang, D. Carbon Aerogel for Insulation Applications: A Review. Int. J. Thermophys. 2019, 40, 1–25. [Google Scholar] [CrossRef]
- Woignier, T.; Phalippou, J.; Despetis, F.; Calas-Etienne, S. Aerogel Processing. In Handbook of Sol-Gel Science and Technology; Klein, L., Aparicio, M., Jitianu, A., Eds.; Springer: Cham, Switzerland, 2017; pp. 18, 21. [Google Scholar] [CrossRef]
- Zuo, L.; Zhang, Y.; Zhang, L.; Miao, Y.E.; Fan, W.; Liu, T. Polymer/Carbon-Based Hybrid Aerogels: Preparation, Properties and Applications. Materials 2015, 8, 6806–6848. [Google Scholar] [CrossRef]
- Paraskevopoulou, P.; Chriti, D.; Raptopoulos, G.; Anyfantis, G.C. Synthetic polymer aerogels in particulate form. Materials 2019, 12, 1543. [Google Scholar] [CrossRef]
- Teo, N.; Gu, Z.; Jana, S.C. Polyimide-based aerogel foams, via emulsion-templating. Polymer 2018, 157, 95–102. [Google Scholar] [CrossRef]
- Shang, K.; Ye, D.D.; Kang, A.H.; Wang, Y.T.; Liao, W.; Xu, S.; Wang, Y.Z. Robust and fire retardant borate-crosslinked poly (vinyl alcohol)/montmorillonite aerogel via melt-crosslink. Polymer 2017, 131, 111–119. [Google Scholar] [CrossRef]
- Antonietti, M.; Fechler, N.; Fellinger, T.P. Carbon aerogels and monoliths: Control of porosity and nanoarchitecture via Sol-Gel routes. Chem. Mater. 2014, 26, 196–210. [Google Scholar] [CrossRef]
- Lermontov, S.A.; Malkova, A.N.; Sipyagina, N.A.; Straumal, E.A.; Baranchikov, A.E.; Yorov, K.E.; Ivanov, V.K. Facile synthesis of fluorinated resorcinol-formaldehyde aerogels. J. Fluor. Chem. 2017, 193, 1–7. [Google Scholar] [CrossRef]
- Balakhonov, S.V.; Efremova, M.V.; Ivanov, V.K.; Churagulov, B.R. Facile synthesis of vanadia aerogels with controlled V3+/V4+ ratio. Mater. Lett. 2015, 156, 109–112. [Google Scholar] [CrossRef]
- Yorov, K.E.; Shekunova, T.O.; Baranchikov, A.E.; Kopitsa, G.P.; Almásy, L.; Skogareva, L.S.; Kozik, V.V.; Malkova, A.N.; Lermontov, S.A.; Ivanov, V.K. First rare-earth phosphate aerogel: Sol–gel synthesis of monolithic ceric hydrogen phosphate aerogel. J. Sol-Gel Sci. Technol. 2018, 85, 574–584. [Google Scholar] [CrossRef]
- Lermontov, S.A.; Straumal, E.A.; Mazilkin, A.A.; Zverkova, I.I.; Baranchikov, A.E.; Straumal, B.B.; Ivanov, V.K. How to Tune the Alumina Aerogels Structure by the Variation of a Supercritical Solvent. Evolution of the Structure during Heat Treatment. J. Phys. Chem. C. 2016, 120, 3319–3325. [Google Scholar] [CrossRef]
- Alwin, S.; Sahaya Shajan, X.; Karuppasamy, K.; Warrier, K.G.K. Microwave assisted synthesis of high surface area TiO2 aerogels: A competent photoanode material for quasi-solid dye-sensitized solar cells. Mater. Chem. Phys. 2017, 196, 37–44. [Google Scholar] [CrossRef]
- Alwin, S.; Sahaya Shajan, X.; Menon, R.; Nabhiraj, P.Y.; Ananthapadmanabhan, P.V. Plasma treated TiO2 aerogel nanostructures as photoanode material and its influence on the performance of quasi-solid dye-sensitized solar cells. Mater. Res. Bull. 2017, 86, 201–208. [Google Scholar] [CrossRef]
- Pinheiro, G.K.; Serpa, R.B.; DeSouza, L.V.; Sartorelli, M.L.; Reis, F.T.; Rambo, C.R. Increasing incident photon to current efficiency of perovskite solar cells through TiO2 aerogel-based nanostructured layers. Colloids Surf. A 2017, 527, 89–94. [Google Scholar] [CrossRef]
- DeSario, P.A.; Pietron, J.J.; Taffa, D.H.; Compton, R.; Schünemann, S.; Marschall, R.; Brintlinger, T.H.; Stroud, R.M.; Wark, M.; Owrutsky, J.C.; et al. Correlating Changes in Electron Lifetime and Mobility on Photocatalytic Activity at Network-Modified TiO2 Aerogels. J. Phys. Chem. C 2015, 119, 17529–17538. [Google Scholar] [CrossRef]
- Sadrieyeh, S.; Malekfar, R. The effects of hydrolysis level on structural properties of titania aerogels. J. Non-Cryst. Solids 2017, 457, 175–179. [Google Scholar] [CrossRef]
- Liu, Z.; Wu, P.; Yang, S.; Wang, H.; Jin, C. Synthesis and Characterization of Uniform Spherical Nanoporous TiO2 Aerogel Templated by Cellulose Alcohol-Gel with Enhanced Photocatalytic Activity. Int. J. Polym. Sci. 2016, 2016, 1–8. [Google Scholar] [CrossRef]
- Yang, H.; Zhu, W.; Sun, S.; Guo, X. Preparation of monolithic titania aerogels with high surface area by a sol–gel process combined surface modification. RSC Adv. 2014, 4, 32934–32940. [Google Scholar] [CrossRef]
- Selman, A.M.; Husham, M. Calcination induced phase transformation of TiO2 nanostructures and fabricated a Schottky diode as humidity sensor based on rutile phase. Sens. Bio-Sens. Res. 2016, 11, 8–13. [Google Scholar] [CrossRef]
- Shao, X.; Pan, F.; Zheng, L.; Zhang, R.; Zhang, W. Nd-doped TiO2-C hybrid aerogels and their photocatalytic properties. New Carbon Mater. 2018, 33, 116–124. [Google Scholar] [CrossRef]
- Ferreira-Neto, E.P.; Worsley, M.A.; Pereira Rodrigues-Filho, U. Towards thermally stable aerogel photocatalysts: TiCl4-based sol-gel routes for the design of nanostructured silica-titania aerogel with high photocatalytic activity and outstanding thermal stability. J. Environ. Chem. Eng. 2019, 7, 103425. [Google Scholar] [CrossRef]
- Zangeneh, H.; Zinatizadeh, A.A.L.; Habibi, M.; Akia, M.; Hasnain Isa, M. Photocatalytic oxidation of organic dyes and pollutants in wastewater using different modified titanium dioxides: A comparative review. J. Ind. Eng. Chem. 2015, 26, 1–36. [Google Scholar] [CrossRef]
- Litter, M.I.; Quici, N. New Advances in Heterogeneous Photocatalysis for Treatment of Toxic Metals and Arsenic. In Nanomaterials for Environmental Protection, 1st ed.; Kharisov, B.I., Kharissova, O.V., Dias, H.V.R., Eds.; John Wiley & Sons, Inc.: Hoboke, NJ, USA, 2014; pp. 145–160. [Google Scholar] [CrossRef]
- Habisreutinger, S.N.; Schmidt-Mende, L.; Stolarcyk, J.K. Photocatalytic Reduction of CO2 on TiO2 and Other Semiconductors. Angew. Chem. Int. Ed. 2013, 52, 7372–7408. [Google Scholar] [CrossRef]
- Bills, B.; Morris, N.; Dubey, M.; Wang, Q.; Fan, Q.H. Electrophoretic Deposited TiO2 Pigment-Based Back Reflectors for Thin Film Solar Cells. Opt. Express. 2015, 23, 71–82. [Google Scholar] [CrossRef] [PubMed][Green Version]
- Alwin, S.; Shajan, X.S.; Menon, R.; Nabhiraj, P.Y.; Warrier, K.G.K.; Rao, G.M. Surface modification of titania aerogel films by oxygen plasma treatment for enhanced dye adsorption. Thin Solid Films 2015, 595, 164–170. [Google Scholar] [CrossRef]
- Kong, Y.; Shen, X.D.; Cui, S. Direct synthesis anataze TiO2 aerogel resistant to high temperature under supercritical ethanol. Mater. Lett. 2014, 117, 192–194. [Google Scholar] [CrossRef]
- Murphy, S. Doped Titanium Dioxide Aerogels for Various Catalytic and Photocatalytic Applications. Doctoral Dissertations, University of Connecticut, Storrs, CT, USA, 25 May 2018. [Google Scholar]
- Habibi, S.; Jamshidi, M. Synthesis of TiO2 nanoparticles coated on cellulose nanofibers with different morphologies: Effect of the template and sol-gel parameters. Mat Sci Semicon Proc. 2020, 109, 104927. [Google Scholar] [CrossRef]
- Agafonov, A.V.; Vinogradov, A.V. Sol–gel synthesis, preparation and characterization of photoactive TiO2 with ultrasound treatment. J Sol-Gel Sci. Technol. 2009, 49, 180–185. [Google Scholar] [CrossRef]
- Hanaor, D.A.H.; Sorrell, C.C. Review of the anatase to rutile phase transformation. J. Mater. Sci. 2011, 46, 855–874. [Google Scholar] [CrossRef]
- Kolen, K.Y.V.; Garshev, A.V.; Churagulov, B.R.; Boujday, S.; Portes, P.; Colbeau-Justin, C. Photocatalytic activity of sol–gel derived titania converted into nanocrystalline powders by supercritical drying. J. Photochem. Photobiol. A 2005, 172, 19–26. [Google Scholar] [CrossRef]
- Yu, J.C.; Zhang, L.; Yu, J. Rapid synthesis of mesoporous TiO2 with high photocatalytic activity by ultrasound-induced agglomeration. New J. Chem. 2002, 26, 416–420. [Google Scholar] [CrossRef]
- Qingge, F.; Huidong, C.; Haiying, L.; Siying, Q.; Zheng, L.; Dachao, M.; Yuyang, Y. Synthesis and structural characteristics of high surface area TiO2 aerogels by ultrasonic-assisted sol–gel method. Nanotechnology 2018, 29, 075702. [Google Scholar] [CrossRef]
- Zu, G.; Shen, J.; Wang, W.; Lian, Y.; Zou, L.; Zhang, Y.; Liu, B.; Zhang, F. Heat-resistant, strong titania aerogels achieved by supercritical deposition. J. Supercritic. Fluids 2015, 106, 145–151. [Google Scholar] [CrossRef]
- Griffiths, P.R.; Haseth, J.A.D. Fourier Transform Infrared Spectrometry, 2nd ed.; Wiley: Hoboken, NJ, USA, 2006. [Google Scholar] [CrossRef]
- Zhang, F.; Zhang, W.; Yu, Y.; Deng, B.; Li, J.; Jin, J. Sol–gel preparation of PAA-g-PVDF/TiO2 nanocomposite hollow fiber membranes with extremely high water flux and improved antifouling property. J. Membr. Sci. 2013, 432, 25–32. [Google Scholar] [CrossRef]
- Li, J.; Liu, J.; Bi, D.; Guo, X.; Wang, P. Preparation, characterization and photocatalytic performance of polyvinylidene fluoride membrane modified with TiO2–C hybrid aerogels. Chem. Ind. Chem. Eng. Q. 2016, 22, 255–262. [Google Scholar] [CrossRef]
- Giwa, A.; Jung, S.M.; Kong, J.; Hasan, S.W. Combined process of electrically-membrane bioreactor and TiO2 aerogel filtration for efficient wastewater treatment. J. Water Process Eng. 2019, 28, 107–114. [Google Scholar] [CrossRef]
- Nawaz, M.; Miran, W.; Jang, J.; Lee, D.S. One-step hydrothermal synthesis of porous 3D reduced graphene oxide/TiO2 aerogel for carbamazepine photodegradation in aqueous solution. Appl. Catal. B 2017, 203, 85–95. [Google Scholar] [CrossRef]
- Lowell, S.; Shields, J.E.; Thomas, M.A.; Thommes, M. Characterization of Porus Solids and Powders: Surface Area, Pore Size and Density. Brian Scarlett; Springer Science+Business Media, LLC: New York, NY, USA, 2004; Volume 16, pp. 11–14, 43–45. [Google Scholar] [CrossRef]
- Rigby, S.P. Structural Characterisation of Natural and Industrial Porous Materials: A Manual., 1st ed.; Springer International Publishing: Cham, Switzerland, 2020; pp. 2, 16–17. [Google Scholar] [CrossRef]
- Paralea, V.G.; Kim, T.; Phadtare, V.D.; Yadav, H.M.; Park, H.-H. Enhanced photocatalytic activity of a mesoporous TiO2 aerogel decorated onto three-dimensional carbon foam. J. Mol. Liq. 2019, 277, 424–433. [Google Scholar] [CrossRef]
- Alwin, S.; Sahaya Shajan, X. Aerogels: Promising nanostructured materials for energy conversion and storage applications. Mater Renew Sustain Energy. 2020, 9, 1–27. [Google Scholar] [CrossRef]
- Kibombo, H.S.; Weber, A.S.; Wu, C.-M.; Raghupathi, K.R.; Koodali, R.T. Effectively dispersed europium oxide dopants in TiO2 aerogel supports for enhanced photocatalytic pollutant degradation. J. Photochem. Photobiol. A. 2013, 269, 49–58. [Google Scholar] [CrossRef]
- Gutzov, S.; Lerch, M. Preparation and optical properties of Zr-Ce-O-N materials. J. Europ. Ceram. Soc. 2001, 21, 595–601. [Google Scholar] [CrossRef]
- Tsekov, R.; Evstatieva, E.; Smirniotis, P.G. Surface diffusion control of the photocatalytic oxidation in air/TiO2 heterogeneous reactors. PhysChemComm 2002, 5, 161–164. [Google Scholar] [CrossRef][Green Version]
- Petkova, N.; Dlugocz, S.; Gutzov, S. Preparation and optical properties of transparent zirconia sol-gel materials. J. Non-Cryst Solids 2011, 357, 1547–1551. [Google Scholar] [CrossRef]
- Henderson, M.A. A surface science perspective on TiO2 photocatalysis. Surf. Sci. Rep. 2011, 66, 185–297. [Google Scholar] [CrossRef]
- Lázára, I.; Kalmár, J.; Peter, A.; Szilágyi, A.; Győri, E.; Ditrói, T.; Fábián, I. Photocatalytic performance of highly amorphous titania–silica aerogels with mesopores: The adverse effect of the in situ adsorption of some organic substrates during photodegradation. Appl. Surf. Sci. 2015, 356, 521–531. [Google Scholar] [CrossRef]
- Fischer, K.; Gawel, A.; Rosen, D.; Krause, M.; Abdul Latif, A.; Griebel, J.; Prager, A.; Schulze, A. Low-Temperature Synthesis of Anatase/Rutile/Brookite TiO2 Nanoparticles on a Polymer Membrane for Photocatalysis. Catalysts 2017, 7, 209. [Google Scholar] [CrossRef]
- Gomes, J.; Lincho, J.; Domingues, E.; Quinta-Ferreira, R.M.; Martins, R.C. N–TiO2 Photocatalysts: A Review of Their Characteristics and Capacity for Emerging Contaminants Removal. Water 2019, 11, 373. [Google Scholar] [CrossRef]
- Petrov, V.; Danchova, N.; Gutzov, S. Temperature dependent optical spectroscopy: A study of holmium diphenanthroline nitrate in DMF. Spectrochim. Acta, Part A 2020, 227, 1–5. [Google Scholar] [CrossRef] [PubMed]
- Coulter, J.B.; Birnie, D.P. Assessing Tauc Plot Slope Quantification: ZnO Thin Films as a Model System. Phys. Status Solidi B 2018, 225, 1–7. [Google Scholar] [CrossRef]


| Precursor | Ageing Duration, h | Solvent | Tonset, °C | Tmax, °C | Tend, °C | Heat of Process, J/g | Mass Change, % |
|---|---|---|---|---|---|---|---|
| TIP | 0 | - | 439.6 | 449.4 | 458.8 | 464.98 | 2.832 |
| CH | 433.7 | 452.7 | 466.2 | 807.51 | 5.169 | ||
| nH | 371.1 | 409.0 | 438.3 | 190.80 | 1.498 | ||
| DE | 369.4 | 395.2 | 427.8 | 88.94 | 1.264 | ||
| 72 | - | 433.6 | 445.5 | 454.8 | 567.30 | 3.187 | |
| CH | 439.8 | 452.8 | 462.5 | 702.34 | 4.752 | ||
| nH | 371.9 | 383.6 | 440.5 | 64.52 | 0.663 | ||
| DE | 430.5 | 445.6 | 457.4 | 665.72 | 4.055 | ||
| TBOT | 0 | - | 488.6 | 523.4 | 559.9 | 336.23 | 1.841 |
| CH | 452.1 | 490.2 | 522.1 | 56.54 | 0.217 | ||
| nH | 452.1 | 479.0 | 515.3 | 67.1 | 0.017 | ||
| DE | 454.2 | 511.0 | 544.7 | 151.95 | 1.002 | ||
| 72 | - | 434.9 | 451.1 | 460.9 | 596.68 | 4.021 | |
| CH | 430.7 | 445.8 | 457.0 | 631.05 | 3.661 | ||
| nH | 366.7 | 399.3 | 436.4 | 156.37 | 2.039 | ||
| DE | 371.2 | 413.6 | 452.3 | 260.99 | 1.883 |
| Precursor | Ageing Duration, h | Solvent | Surface Area, m2/g | Pore Volume, cc/g |
|---|---|---|---|---|
| TIP | 0 | - | 318.597 | 0.146 |
| CH | 331.262 | 0.165 | ||
| nH | 374.564 | 0.247 | ||
| DE | 313.811 | 0.151 | ||
| 72 | - | 367.579 | 0.167 | |
| CH | 384.475 | 0.207 | ||
| nH | 263.443 | 0.234 | ||
| DE | 366.314 | 0.213 | ||
| TBOT | 0 | - | 264.054 | 0.146 |
| CH | 302.115 | 0.165 | ||
| nH | 340.861 | 0.247 | ||
| DE | 296.781 | 0.151 | ||
| 72 | - | 378.066 | 0.216 | |
| CH | 423.731 | 0.245 | ||
| nH | 354.656 | 0.233 | ||
| DE | 377.213 | 0.224 |
| Precursor | Ageing Duration, h | Surface Area, m2/g | Pore Volume, cc/g |
|---|---|---|---|
| TIP | 0 | 64.523 | 0.104 |
| 72 | 80.582 | 0.140 | |
| TBOT | 0 | 58.774 | 0.098 |
| 72 | 47.802 | 0.087 |
Publisher’s Note: MDPI stays neutral with regard to jurisdictional claims in published maps and institutional affiliations. |
© 2021 by the authors. Licensee MDPI, Basel, Switzerland. This article is an open access article distributed under the terms and conditions of the Creative Commons Attribution (CC BY) license (https://creativecommons.org/licenses/by/4.0/).
Share and Cite
Doneliene, J.; Fataraite-Urboniene, E.; Rudzikas, M.; Pakalka, S.; Danchova, N.; Ulbikas, J. Effect of Precursor Nature and Sol-Gel Synthesis Conditions on TiO2 Aerogel’s Structure. Molecules 2021, 26, 5090. https://doi.org/10.3390/molecules26165090
Doneliene J, Fataraite-Urboniene E, Rudzikas M, Pakalka S, Danchova N, Ulbikas J. Effect of Precursor Nature and Sol-Gel Synthesis Conditions on TiO2 Aerogel’s Structure. Molecules. 2021; 26(16):5090. https://doi.org/10.3390/molecules26165090
Chicago/Turabian StyleDoneliene, Jolanta, Egle Fataraite-Urboniene, Matas Rudzikas, Saulius Pakalka, Nina Danchova, and Juras Ulbikas. 2021. "Effect of Precursor Nature and Sol-Gel Synthesis Conditions on TiO2 Aerogel’s Structure" Molecules 26, no. 16: 5090. https://doi.org/10.3390/molecules26165090
APA StyleDoneliene, J., Fataraite-Urboniene, E., Rudzikas, M., Pakalka, S., Danchova, N., & Ulbikas, J. (2021). Effect of Precursor Nature and Sol-Gel Synthesis Conditions on TiO2 Aerogel’s Structure. Molecules, 26(16), 5090. https://doi.org/10.3390/molecules26165090