
Morphological Changes and Component Characterization of Coffee Silverskin


Abstract
:1. Introduction
2. Results and Discussion
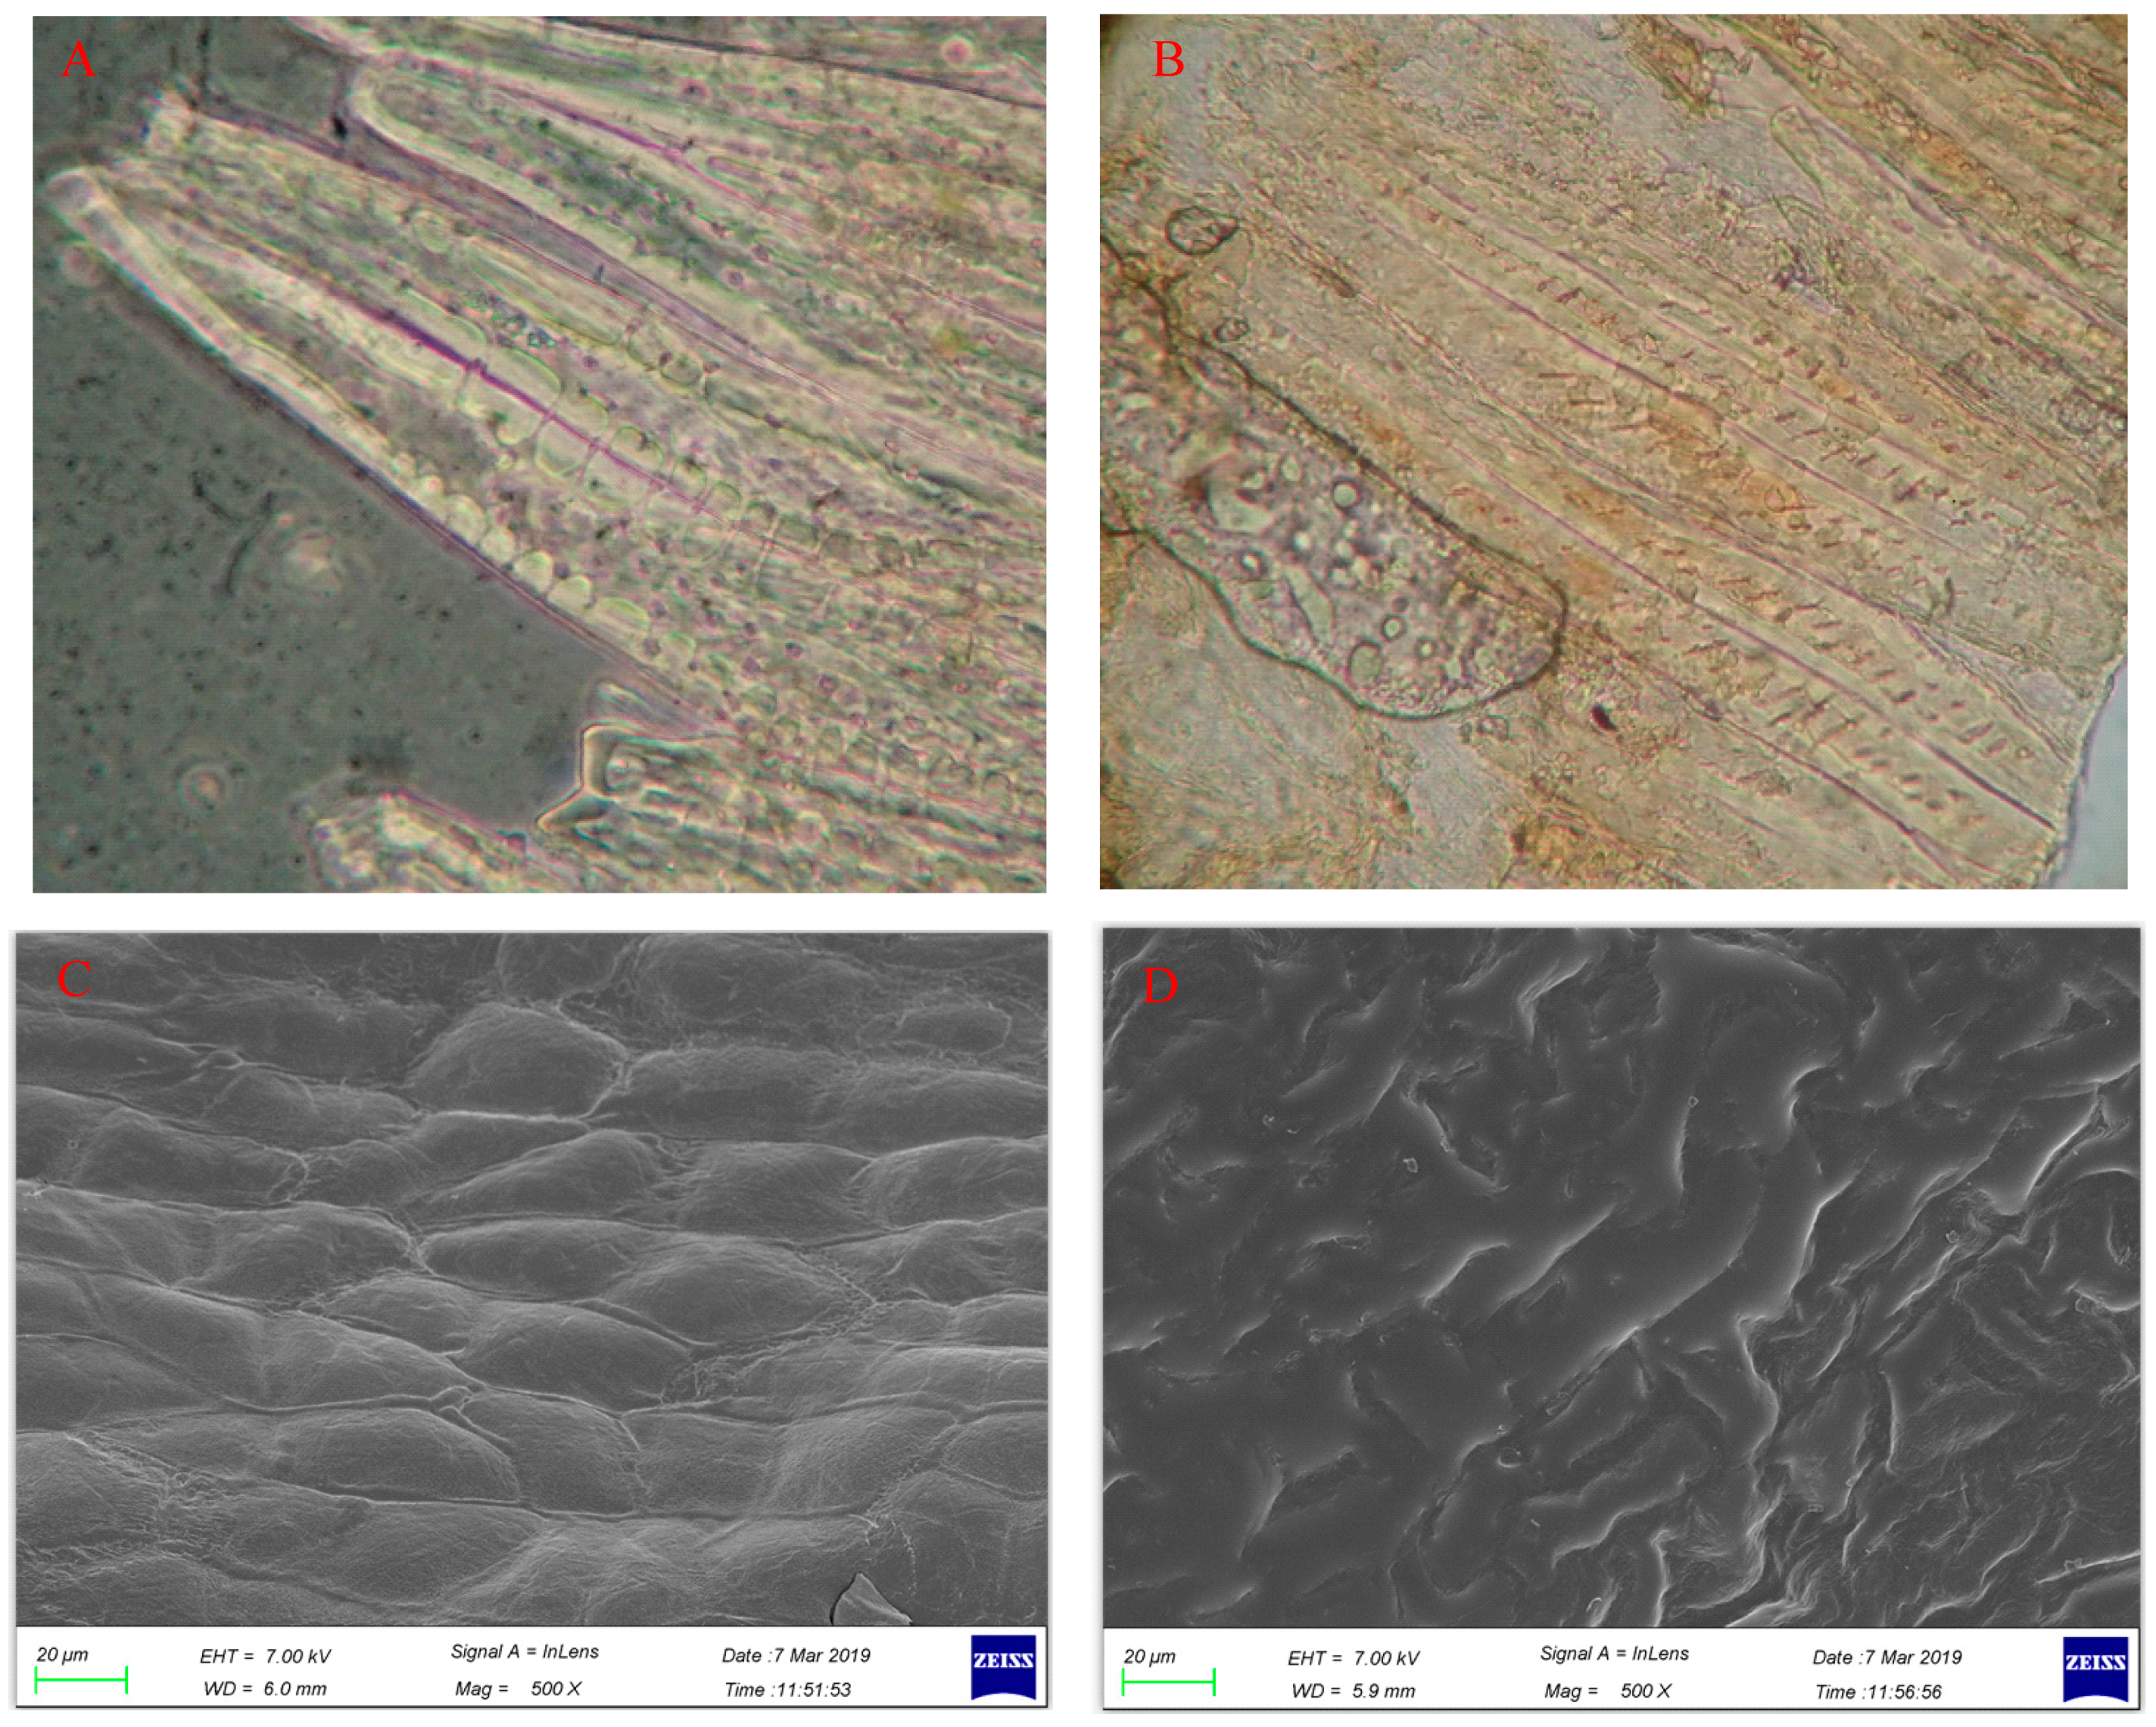
2.1. Changes in Microstructure of CS
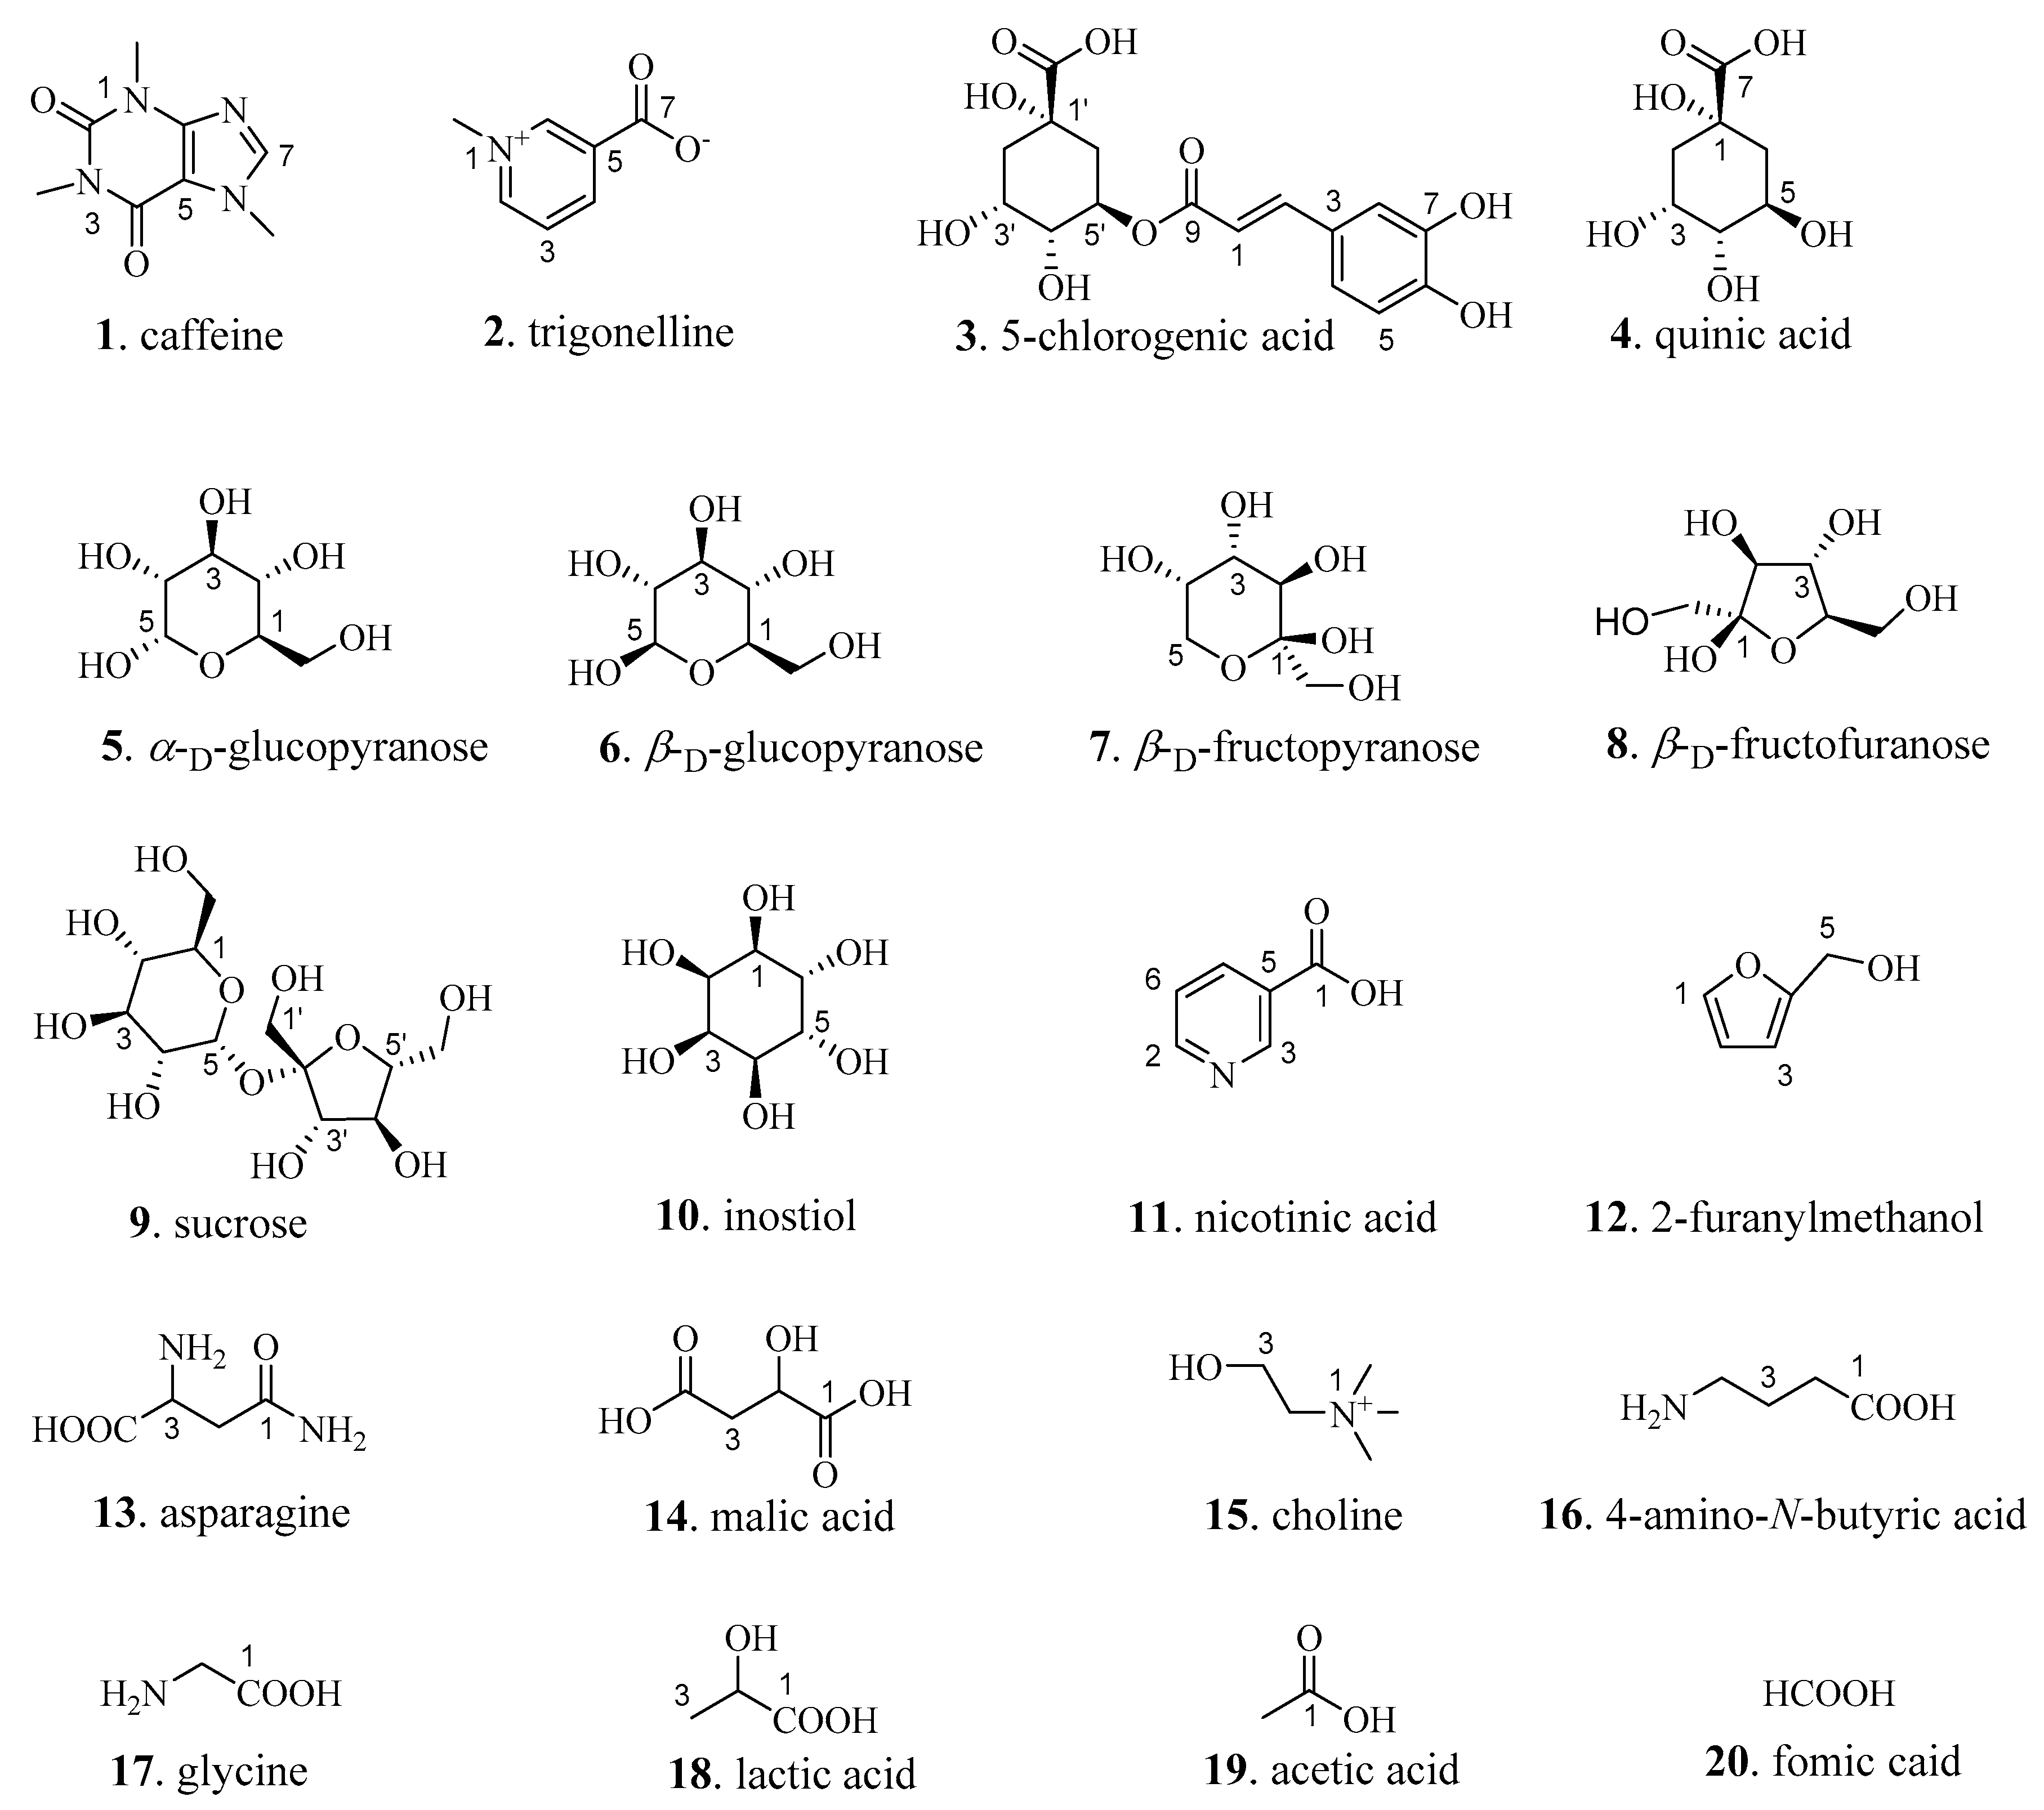
2.2. Qualitative Analysis of CS
2.2.1. Alkaloids
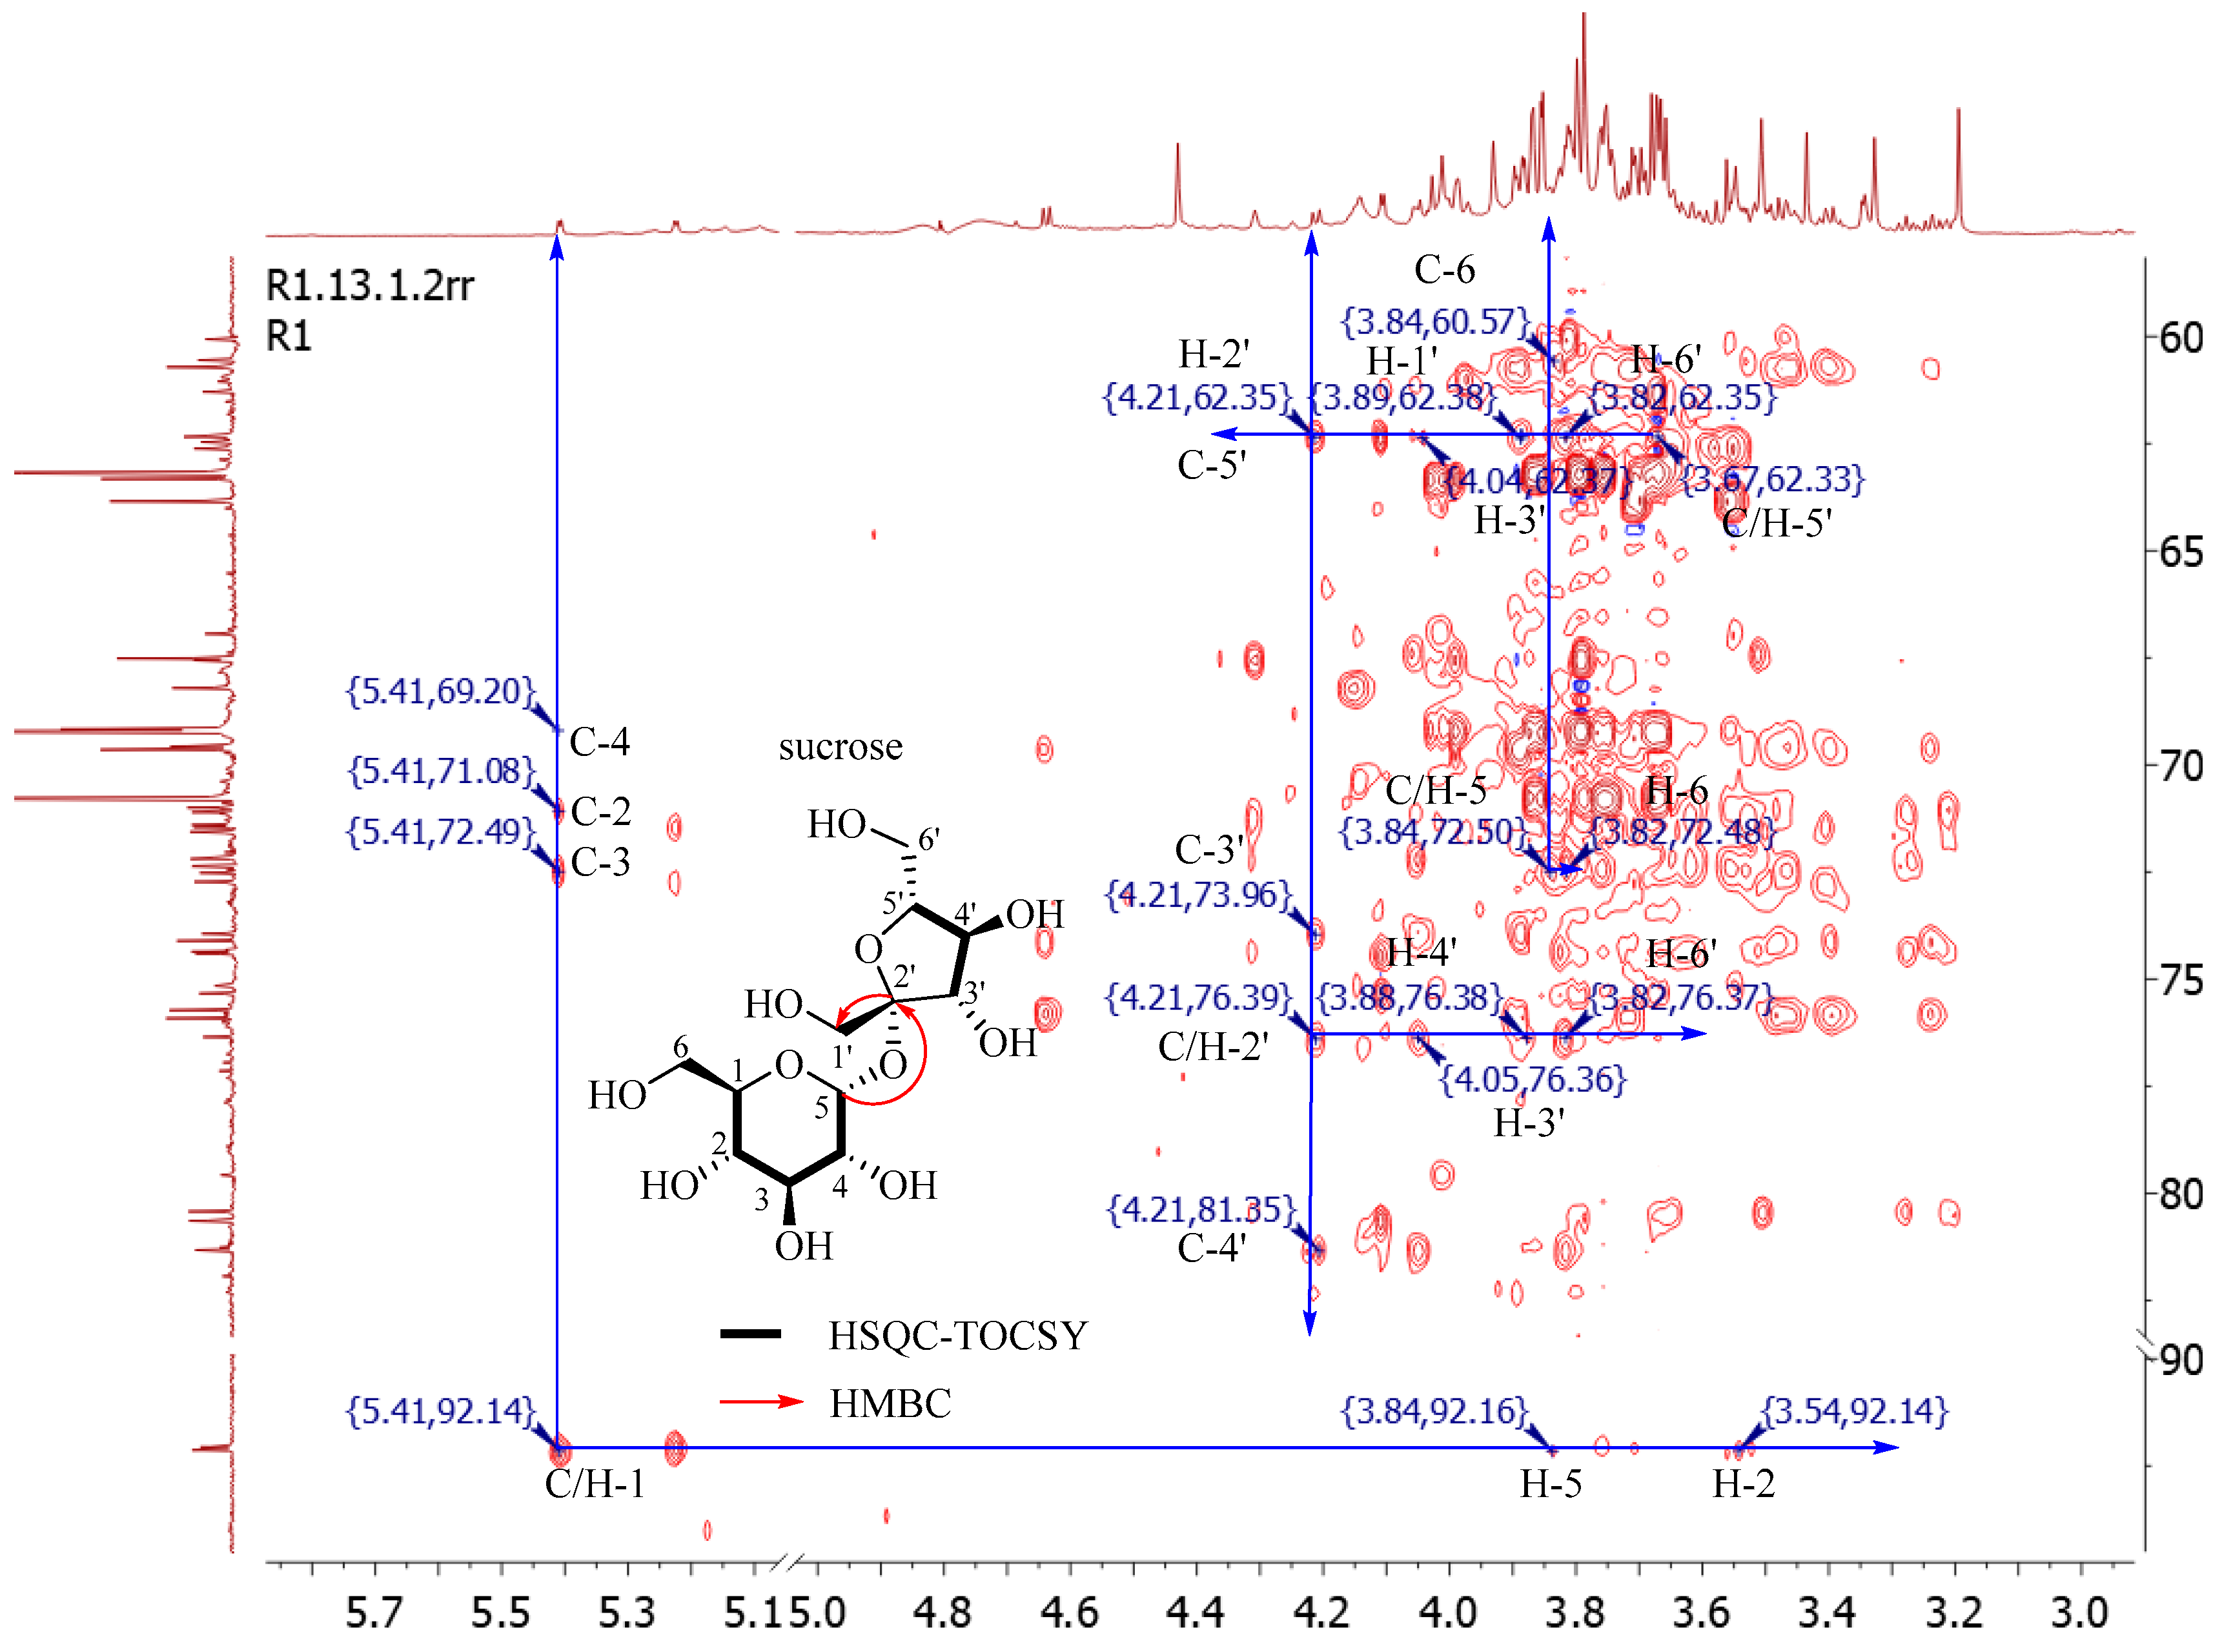
2.2.2. Sugars
2.2.3. Phenolic Acids
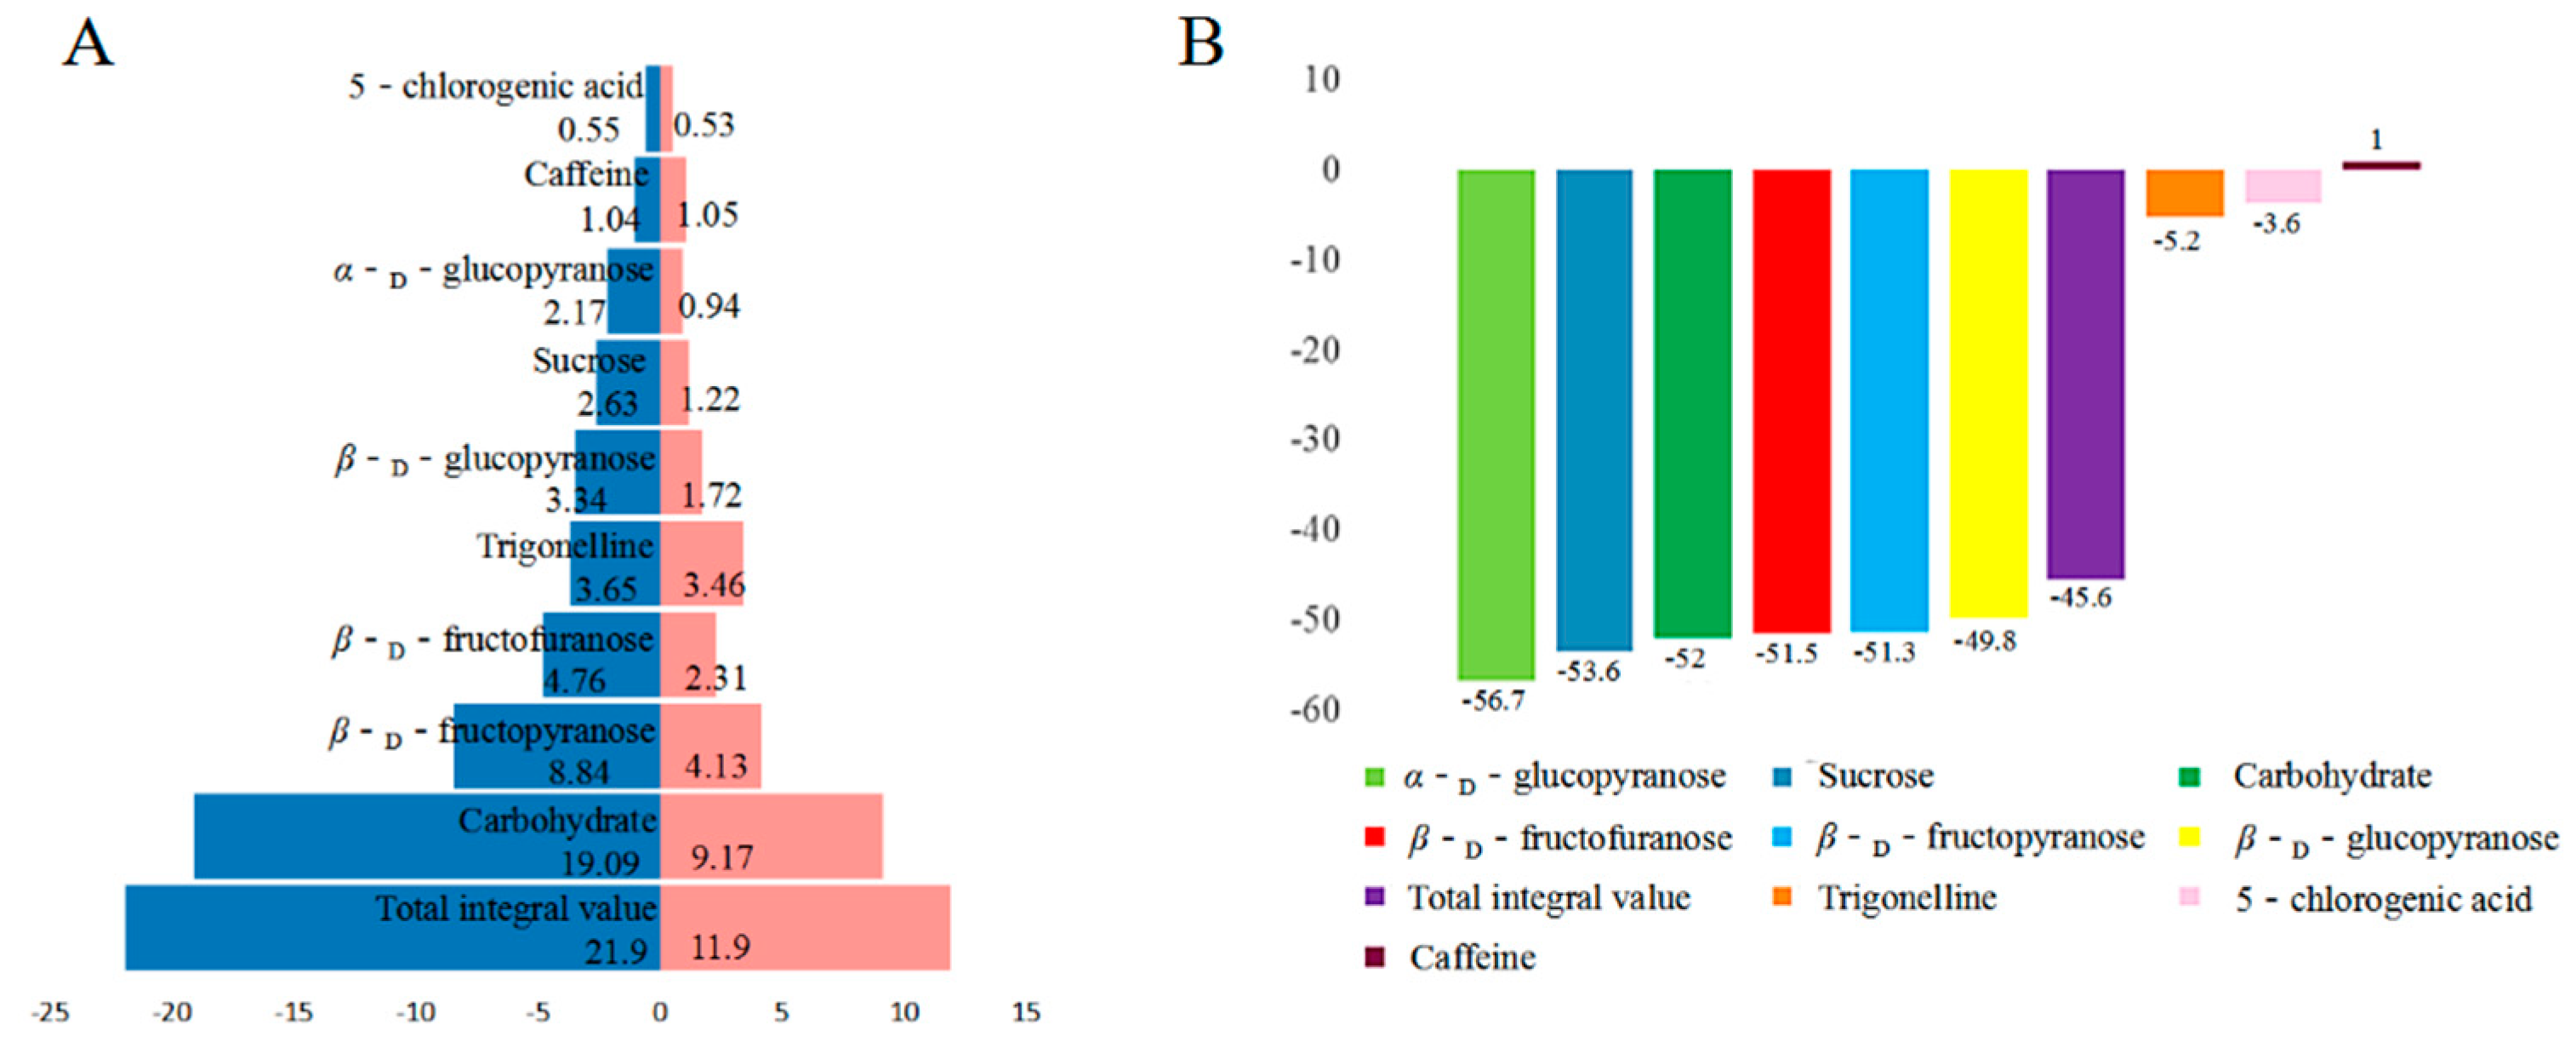
2.3. Quantitative Analysis of CS
3. Materials and Methods
3.1. Instruments and Materials
3.2. Sample Preparation
3.3. NMR Data Acquisition Conditions
3.4. Morphological Characterization of CS with Different Roasting Degrees
3.5. Data Processing
4. Conclusions
Supplementary Materials
Author Contributions
Funding
Institutional Review Board Statement
Informed Consent Statement
Data Availability Statement
Conflicts of Interest
Sample Availability
References
- International Coffffee Organization (ICO). Statistics. Trade Statistics Tables. World Coffffee Consumption. Available online: http://www.ico.org/prices/new-consumption-table.pdf (accessed on 29 April 2020).
- Klingel, T.; Kremer, J.I.; Gottstein, V.; Rezende, T.; Schwarz, S.; Lachenmeier, D.W. A review of coffee by-products including leaf, flower, cherry, husk, silver skin, and spent grounds as novel foods within the european union. Foods 2020, 9, 665. [Google Scholar] [CrossRef]
- Hejna, A. Potential applications of by-products from the coffee industry in polymer technology-current state and perspectives. Waste Manag. 2021, 121, 296–330. [Google Scholar] [CrossRef]
- Behrouzian, F.; Amini, A.M.; Alghooneh, A.; Razavi, S.A. Characterization of dietary fibre from coffee silverskin: An optimization study using response surface methodology. Bioact. Carbohydr. Diet. Fibre 2016, 8, 58–64. [Google Scholar] [CrossRef]
- Costa, A.S.G.; Alves, R.C.; Vinha, A.F.; Costa, E.; Costa, C.S.G.; Antonia Nunes, M.; Almeida, A.A.; Santos-Sliva, A.; Oilveira, M.M.P.P. Nutritional, chemical and antioxidant/pro-oxidant profiles of silverskin, a coffee roasting by-product. Food Chem. 2017, 267, 28–35. [Google Scholar] [CrossRef]
- Nzekouea, F.K.; Angelonia, S.; Navarinic, L.; Angelonia, C.; Freschid, M.; Hreliad, S.; Vitalia, L.A.; Sagratinia, G.; Vittoria, S.; Caprioli, G. Coffee silverskin extracts: Quantification of 30 bioactive compounds by a new HPLC-MS/MS method and evaluation of their antioxidant and antibacterial activities. Food Res. Int. 2020, 133, 109128. [Google Scholar] [CrossRef] [PubMed]
- Bertolino, M.; Barbosa-Pereira, L.; Ghirardello, D.; Botta, C.; Rolle, L.; Guglielmetti, A.; Vecchia, S.B.D.; Zappa, D. Coffee silverskin as nutraceutical ingredient in yogurt: Its effect on functional properties and its bioaccessibility. J. Sci. Food Agric. 2019, 99, 4267–4275. [Google Scholar] [CrossRef] [PubMed]
- Gocmen, D.; Sahan, Y.; Yildiz, E.; Coskun, M.; Aroufai, D.A. Use of coffee silverskin to improve the functional properties of cookies. J. Food. Sci. Technol. 2019, 56, 2979–2988. [Google Scholar] [CrossRef]
- Rodrigues, F.; Gaspar, C.; Palmeira-De-Oliveira, A.; Sarmento, B.; Amaral, M.H.; Oliveira, M.B.P.P. Application of coffee silverskin in cosmetic formulations: Physical/antioxidant stability studies and cytotoxicity effects. Drug Dev. Ind. Pharm. 2016, 42, 99–106. [Google Scholar] [CrossRef] [PubMed]
- Sung, S.H.; Chang, Y.; Han, J. Development of polylactic acid nanocomposite films reinforced with cellulose nanocrystals derived from coffee silverskin. Carbohydr. Polym. 2017, 169, 495–503. [Google Scholar] [CrossRef] [PubMed]
- Oliveira, G.; Gonalves, I.; Barra, A.; Nunes, C.; Coimbra, M.A. Coffee silverskin and starch-rich potato washing slurries as raw materials for elastic, antioxidant, and uv-protective biobased films. Food Res. Int. 2020, 138, 109733. [Google Scholar] [CrossRef]
- Borrelli, R.C.; Esposito, F.; Napolitano, A.; Fogliano, A. Characterization of a new potential functional ingredient: coffee silverskin. J. Agric. Food Chem. 2004, 52, 1338–1343. [Google Scholar] [CrossRef] [PubMed]
- Martinez-Saez, N.; Ullate, M.; Martin-Cabrejas, M.A.; Martorell, P.; Genovés, S.; Ramon, D.; Castillo, M.D.D. A novel antioxidant beverage for body weight control based on coffee silverskin. Food Chem. 2014, 150, 227–234. [Google Scholar] [CrossRef] [PubMed]
- Bresciani, L.; Calani, L.; Bruni, R.; Brighenti, F.; Rio, D.D. Phenolic composition, caffeine content and antioxidant capacity of coffee silverskin. Food Res. Int. 2014, 61, 196–201. [Google Scholar] [CrossRef]
- Navarro, Y.; Soengas, R.; Iglesias, M.J.; Ortiz, F.L. Use of NMR for the analysis and quantification of the sugar composition in fresh and store-bought fruit juices. J. Chem. Educ. 2020, 97, 831–837. [Google Scholar] [CrossRef]
- Solovyev, P.A.; Fauhl-Hassek, C.; Riedl, J.; Esslinger, S.; Bontempo, L.; Camin, F. NMR spectroscopy in wine authentication: An official control perspective. Compr. Rev. Food. Sci. Food Saf. 2021, 20, 2040–2062. [Google Scholar] [CrossRef]
- Soyler, A.; Cikrikci, S.; Cavdaroglu, C.; Bouillaud, D.; Oztop, M.H. Multi-scale benchtop 1H NMR spectroscopy for milk analysis. LWT Food Sci. Technol. 2020, 139, 110557. [Google Scholar] [CrossRef]
- Wei, F.; Furihata, K.; Hu, F.; Miyakawa, T.; Tanokura, M. Complex mixture analysis of organic compounds in green coffee bean extract by two-dimensional NMR spectroscopy. Magn. Reson. Chem. 2010, 48, 857–865. [Google Scholar] [CrossRef]
- Wei, F.; Furihata, K.; Hu, F.; Miyakawa, T.; Tanokura, M. Two-dimensional 1H-13C nuclear magnetic resonance (NMR)-based comprehensive analysis of roasted coffee bean extract. J. Agric. Food Chem. 2011, 59, 9065–9073. [Google Scholar] [CrossRef]
- Wei, F.; Furihata, K.; Koda, M.; Hu, F.; Miyakawa, T. Roasting process of coffee beans as studied by nuclear magnetic resonance: Time course of changes in composition. J. Agric. Food Chem. 2012, 60, 1005–1012. [Google Scholar] [CrossRef]
- Wei, F.; Furihata, K.; Miyakawa, T.; Tanokura, M. A pilot study of NMR-based sensory prediction of roasted coffee bean extracts. Food Chem. 2014, 152, 363–369. [Google Scholar] [CrossRef]
- Hu, G.L.; Peng, X.R.; Wang, X.; Li, X.; Qiu, M.H. Excavation of coffee maturity markers and further research on their changes in coffee cherries of different maturity. Food Res. Int. 2020, 132, 109121. [Google Scholar] [CrossRef] [PubMed]
- Hu, G.L.; Peng, X.R.; Gao, Y.; Huang, Y.J.; Qiu, M.H. Effect of roasting degree of coffee beans on sensory evaluation: Research from the perspective of major chemical ingredients. Food Chem. 2020, 331, 127329. [Google Scholar] [CrossRef]
- Wang, Y.B.; Wang, X.Y.; Hu, G.L.; Hong, D.F.; Qiu, M.H. Chemical ingredients characterization basing on 1H NMR and SHS-GC/MS in twelve cultivars of coffea arabica roasted beans. Food Res. Int. 2021, 147, 110544. [Google Scholar] [CrossRef]
- Schievano, E.; Finotello, C.; Mammi, S.; Illy Belci, A.; Colomban, S.; Navarini, L. Preliminary characterization of monofloral coffea spp. honey: Correlation between potential biomarkers and pollen content. J. Agric. Food Chem. 2015, 63, 5858–5863. [Google Scholar] [CrossRef] [PubMed]
- Kadri, S.M.; Zaluski, R.; Lima, G.; Mazzafera, P.; Ricardo, D. Characterization of Coffea arabica monofloral honey from Espírito Santo, Brazil. Food Chem. 2016, 203, 252–257. [Google Scholar] [CrossRef]
- Chen, X.M.; Ma, Z.; Kitts, D.D. Effects of processing method and age of leaves on phytochemical profiles and bioactivity of coffee leaves. Food Chem. 2017, 249, 143–153. [Google Scholar] [CrossRef]
- Zhou, J.; Chan, L.; Zhou, S. Trigonelline: A plant alkaloid with therapeutic potential for diabetes and central nervous system disease. Curr. Med. Chem. 2012, 19, 3523–3531. [Google Scholar] [CrossRef]
- Choi, M.; Mukherjee, S.; Un, J.W. Trigonelline induces browning in 3T3-L1 white adipocytes. Phytother. Res. 2020, 35, 1113–1124. [Google Scholar] [CrossRef] [PubMed]
- Mohsen, K.; Mitra, A.; Elham, E.J.; Tourandokht, B.; Mehrdad, R. Trigonelline mitigates lipopolysaccharide-induced learning and memory impairment in the rat due to its anti-oxidative and anti-inflammatory effect. Int. Immunopharmacol. 2018, 61, 355–362. [Google Scholar]
- Qiu, Z.; Wang, K.; Jiang, C.; Su, Y.; Yao, L. Trigonelline protects hippocampal neurons from oxygen-glucose deprivation-induced injury through activating the PI3K/Akt pathway. Chem. Biol. Interact. 2020, 317, 108946. [Google Scholar] [CrossRef]
- Zengin, G.; Sinan, K.I.; Mahomoodally, M.F.; Angeloni, S.; Mustafa, A.M.; Vittori, S.; Maggi, F.; Gaprioli, G. Chemical composition, antioxidant and enzyme inhibitory properties of different extracts obtained from spent coffee ground and coffee silverskin. Foods 2020, 9, 173. [Google Scholar] [CrossRef]
- García-Serna, E.; Martinez–Saez, N.; Mesias, M.; Morales, F.J.; Del Castillo, M.D. Use of coffee silverskin and stevia to improve the formulation of biscuits. Pol. J. Food Nutr. Sci. 2014, 64, 243–251. [Google Scholar] [CrossRef] [Green Version]
- Iriondo-DeHond, A.; Garcia, N.A.; Fernandez-Gomez, B.; Guisantes-Batan, E.; Escobar, F.V.; Blanch, G.P.; San-Andres, M.I.; Sanchez-Fortun, S.; Del-Castillo, M.D. Validation of coffee byproducts as novel food ingredients. Inno. Food Sci. Emerg. Tech. 2019, 51, 194–204. [Google Scholar] [CrossRef] [Green Version]
- Narita, Y.; Inouye, K. High antioxidant activity of coffee silverskin extracts obtained by the treatment of coffee silverskin with subcritical water. Food Chem. 2012, 135, 943–949. [Google Scholar] [CrossRef] [PubMed] [Green Version]

| Compound | 1H | 13C | Assignment | Compound | 1H | 13C | Assignment |
|---|---|---|---|---|---|---|---|
| Caffeine | 3.33 | 27.9 (q) | N1-CH3 | 5-CQA | 6.37 | 114.6 (d) | C1-H |
| - | - | 152.7 (s) | C2-O | - | 7.61 | 145.9 (d) | C2-H |
| - | 3.51 | 29.8 (q) | N3-CH3 | - | - | 126.8 (s) | C3 |
| - | - | 156.4 (s) | C4-O | - | 7.08 | 122.5 (d) | C4-H |
| - | - | 107.9 (s) | C5 | - | 6.91 | 116.1 (d) | C5-H |
| - | 3.93 | 33.4 (q) | N6-CH3 | - | - | 147 (s) | C6 |
| - | 7.87 | 143.5 (d) | C7-H | - | - | 144.2 (s) | C7 |
| - | - | 148.4 (s) | C8 | - | 7.14 | 114.9 (d) | C8-H |
| Trigonelline | 4.43 | 48.2 (q) | N1-CH3 | - | - | 169 (s) | C9 |
| - | 8.84 | 145.8 (d) | C2-H | - | 5.32 | 71.1 (d) | C5′-H |
| - | 8.07 | 127.5 (d) | C3-H | - | 3.88 | 72.8 (d) | C4′-H |
| - | 8.83 | 144.7 (d) | C4-H | - | 4.26 | 70.6 (d) | C3′-H |
| - | - | 136.9 (s) | C5 | - | 2.15, 2.05 | 37.3 (t) | C2′-H2 |
| - | 9.12 | 145.9 (d) | C6-H | - | - | 77.3 (s) | C1′ |
| - | - | 167.8 (s) | C7 | - | 2.69 | 39.8 (t) | C6′-H2 |
| 2.51 | |||||||
| Quinic acid | - | 75.8 (s) | C1 | - | - | 173.6 (s) | C7′ |
| - | 2.05, | 37.3 (t) | C2-H2 | α-d-glucopyranose | 3.76 | 72.5 (d) | C1-H |
| 1.98 | |||||||
| - | 4.15 | 70.4 (d) | C3-H | - | 3.46 | 69.2 (d) | C2-H |
| - | 3.55 | 75.2 (d) | C4-H | - | 3.71 | 72.7 (d) | C3-H |
| - | 4.02 | 66.9 (d) | C5-H | - | 3.53 | 71.5 (d) | C4-H |
| - | 2.07, 1.88 | 40.6 (t) | C6-H2 | - | 5.23 | 92.07 (d) | C5-H |
| - | - | 173.3 (s) | C7 | - | 3.67, 3.81 | 62.3 (t) | C6-H2 |
| β-d-glucopyranose | 3.83 | 71.4 (d) | C1-H | β-d-fructopyranose | - | 98 (s) | C1 |
| - | 3.4 | 69.6 (d) | C2-H | - | 3.79 | 67.5 (d) | C2-H |
| - | 3.47 | 75.9 (d) | C3-H | - | 3.89 | 69.6 (d) | C3-H |
| - | 3.24 | 74.1 (d) | C4-H | - | 3.99 | 69.2 (d) | C4-H |
| - | 4.64 | 95.9 (d) | C5-H | - | 4.02, 3.67 | 63.3 (t) | C5-H2 |
| - | 3.89, 3.71 | 60.7 (t) | C6-H2 | - | 3.55, 3.70 | 63.8 (t) | C6-H2 |
| β-d-fructofuranose | - | 101.5 (s) | C1 | Sucrose | 3.84 | 72.4 (d) | C5-H |
| - | 4.11 | 74.4 (s) | C2-H | - | 3.46 | 69.2 (d) | C4-H |
| - | 4.11 | 75.4 (s) | C3-H | - | 3.76 | 72.5 (d) | C3-H |
| - | 3.82 | 80.6 (s) | C4-H | - | 3.54 | 71.1 (d) | C2-H |
| - | 3.67, 3.81 | 62.3 (t) | C5-H2 | - | 5.41 | 92.12 (d) | C1-H |
| - | 3.55, 3.58 | 62.6 (t) | C6-H2 | - | 3.82 | 60.5 (t) | C6-H2 |
| Inostiol | 3.62 | 72.2 (d) | C1-H | - | 3.67 | 62.3 (t) | C5′-H2 |
| - | 3.51 | 71.1 (d) | C2-H | - | - | 103.6 (s) | C1′ |
| - | 4.31 | 71.3 (d) | C3-H | - | 4.21 | 76.4 (d) | C2′-H |
| - | 3.21 | 80.4 (d) | C4-H | - | 4.05 | 74 (d) | C3′-H |
| - | 3.65 | 71.6 (d) | C5-H | - | 3.88 | 81.3 (d) | C4′-H |
| - | 3.28 | 74.4 (d) | C6-H | - | 3.82 | 60.1 (t) | C6′-H2 |
| Nicotinic acid | - | 166.2 (s) | C1 | 2-Furanylmethanol | 7.52 | 146.2 (d) | C1-H |
| - | 8.83 | 153.2 (d) | C2-H | - | 6.67 | 111 (d) | C2-H |
| - | 9.13 | 150.2 (d) | C3-H | - | 6.65 | 110.8 (d) | C3-H |
| - | 8.32 | 136.9 (d) | C4-H | - | - | 161.4 (s) | C4 |
| - | - | 126.7 (s) | C5 | - | 4.68 | 56.0 (t) | C5-H2 |
| - | 7.50 | 123.71 (d) | C6-h | Malic acid | - | 179.4 (s) | C1 |
| Asparagine | - | 174.4 (s) | C1 | - | 4.01 | 66.9 (d) | C2-H |
| - | 2.86, 2.95 | 34.4 (t) | C2-H2 | - | 2.69, 2.51 | 38.3 (t) | C3-H2 |
| - | 4.0 | 51.2 (d) | C3-H | - | - | 179.2 (s) | C4 |
| - | - | 173 (s) | C4 | 4-Amino-N-butyric acid | - | 180.5 (s) | C1 |
| Choline | 3.19 | 53.8 (q) | N1-CH3 | - | 2.35 | 33.4 (t) | C2-H2 |
| - | 3.19 | 53.8 (q) | N1-CH3 | - | 1.91 | 23.1 (t) | C3-H2 |
| - | 3.19 | 53.8 (q) | N1-CH3 | - | 3.02 | 39.1 (t) | C4-H2 |
| - | 3.51 | 67.4 (t) | C2-H2 | Lactic acid | - | 182 (s) | C1 |
| - | 4.06 | 55.5 (t) | C3-H2 | - | 4.15 | 68.2 (d) | C2-H |
| Glycine | - | 170.7 (s) | C1 | - | 1.34 | 19.9 (q) | C3-H3 |
| - | 3.81 | 52.8 (t) | C2-H2 | Acetic acid | - | 178.8 (s) | C1 |
| Formic acid | 8.43 | 171.4 (d) | C1-H | - | 2.0 | 21.6 (d) | C2-H |
Publisher’s Note: MDPI stays neutral with regard to jurisdictional claims in published maps and institutional affiliations. |
© 2021 by the authors. Licensee MDPI, Basel, Switzerland. This article is an open access article distributed under the terms and conditions of the Creative Commons Attribution (CC BY) license (https://creativecommons.org/licenses/by/4.0/).
Share and Cite
Wang, X.; Hong, D.-F.; Hu, G.-L.; Li, Z.-R.; Peng, X.-R.; Shi, Q.-Q.; Qiu, M.-H. Morphological Changes and Component Characterization of Coffee Silverskin. Molecules 2021, 26, 4914. https://doi.org/10.3390/molecules26164914
Wang X, Hong D-F, Hu G-L, Li Z-R, Peng X-R, Shi Q-Q, Qiu M-H. Morphological Changes and Component Characterization of Coffee Silverskin. Molecules. 2021; 26(16):4914. https://doi.org/10.3390/molecules26164914
Chicago/Turabian StyleWang, Xia, De-Fu Hong, Gui-Lin Hu, Zhong-Rong Li, Xing-Rong Peng, Qiang-Qiang Shi, and Ming-Hua Qiu. 2021. "Morphological Changes and Component Characterization of Coffee Silverskin" Molecules 26, no. 16: 4914. https://doi.org/10.3390/molecules26164914
APA StyleWang, X., Hong, D.-F., Hu, G.-L., Li, Z.-R., Peng, X.-R., Shi, Q.-Q., & Qiu, M.-H. (2021). Morphological Changes and Component Characterization of Coffee Silverskin. Molecules, 26(16), 4914. https://doi.org/10.3390/molecules26164914