
Fluorescent Immunoassays for Detection and Quantification of Cardiac Troponin I: A Short Review


Abstract
:1. Introduction
2. Cardiac Troponin—A Biomarker for Myocardial Infarction
3. Immunoassays for cTnI Detection
4. Purpose and Scope
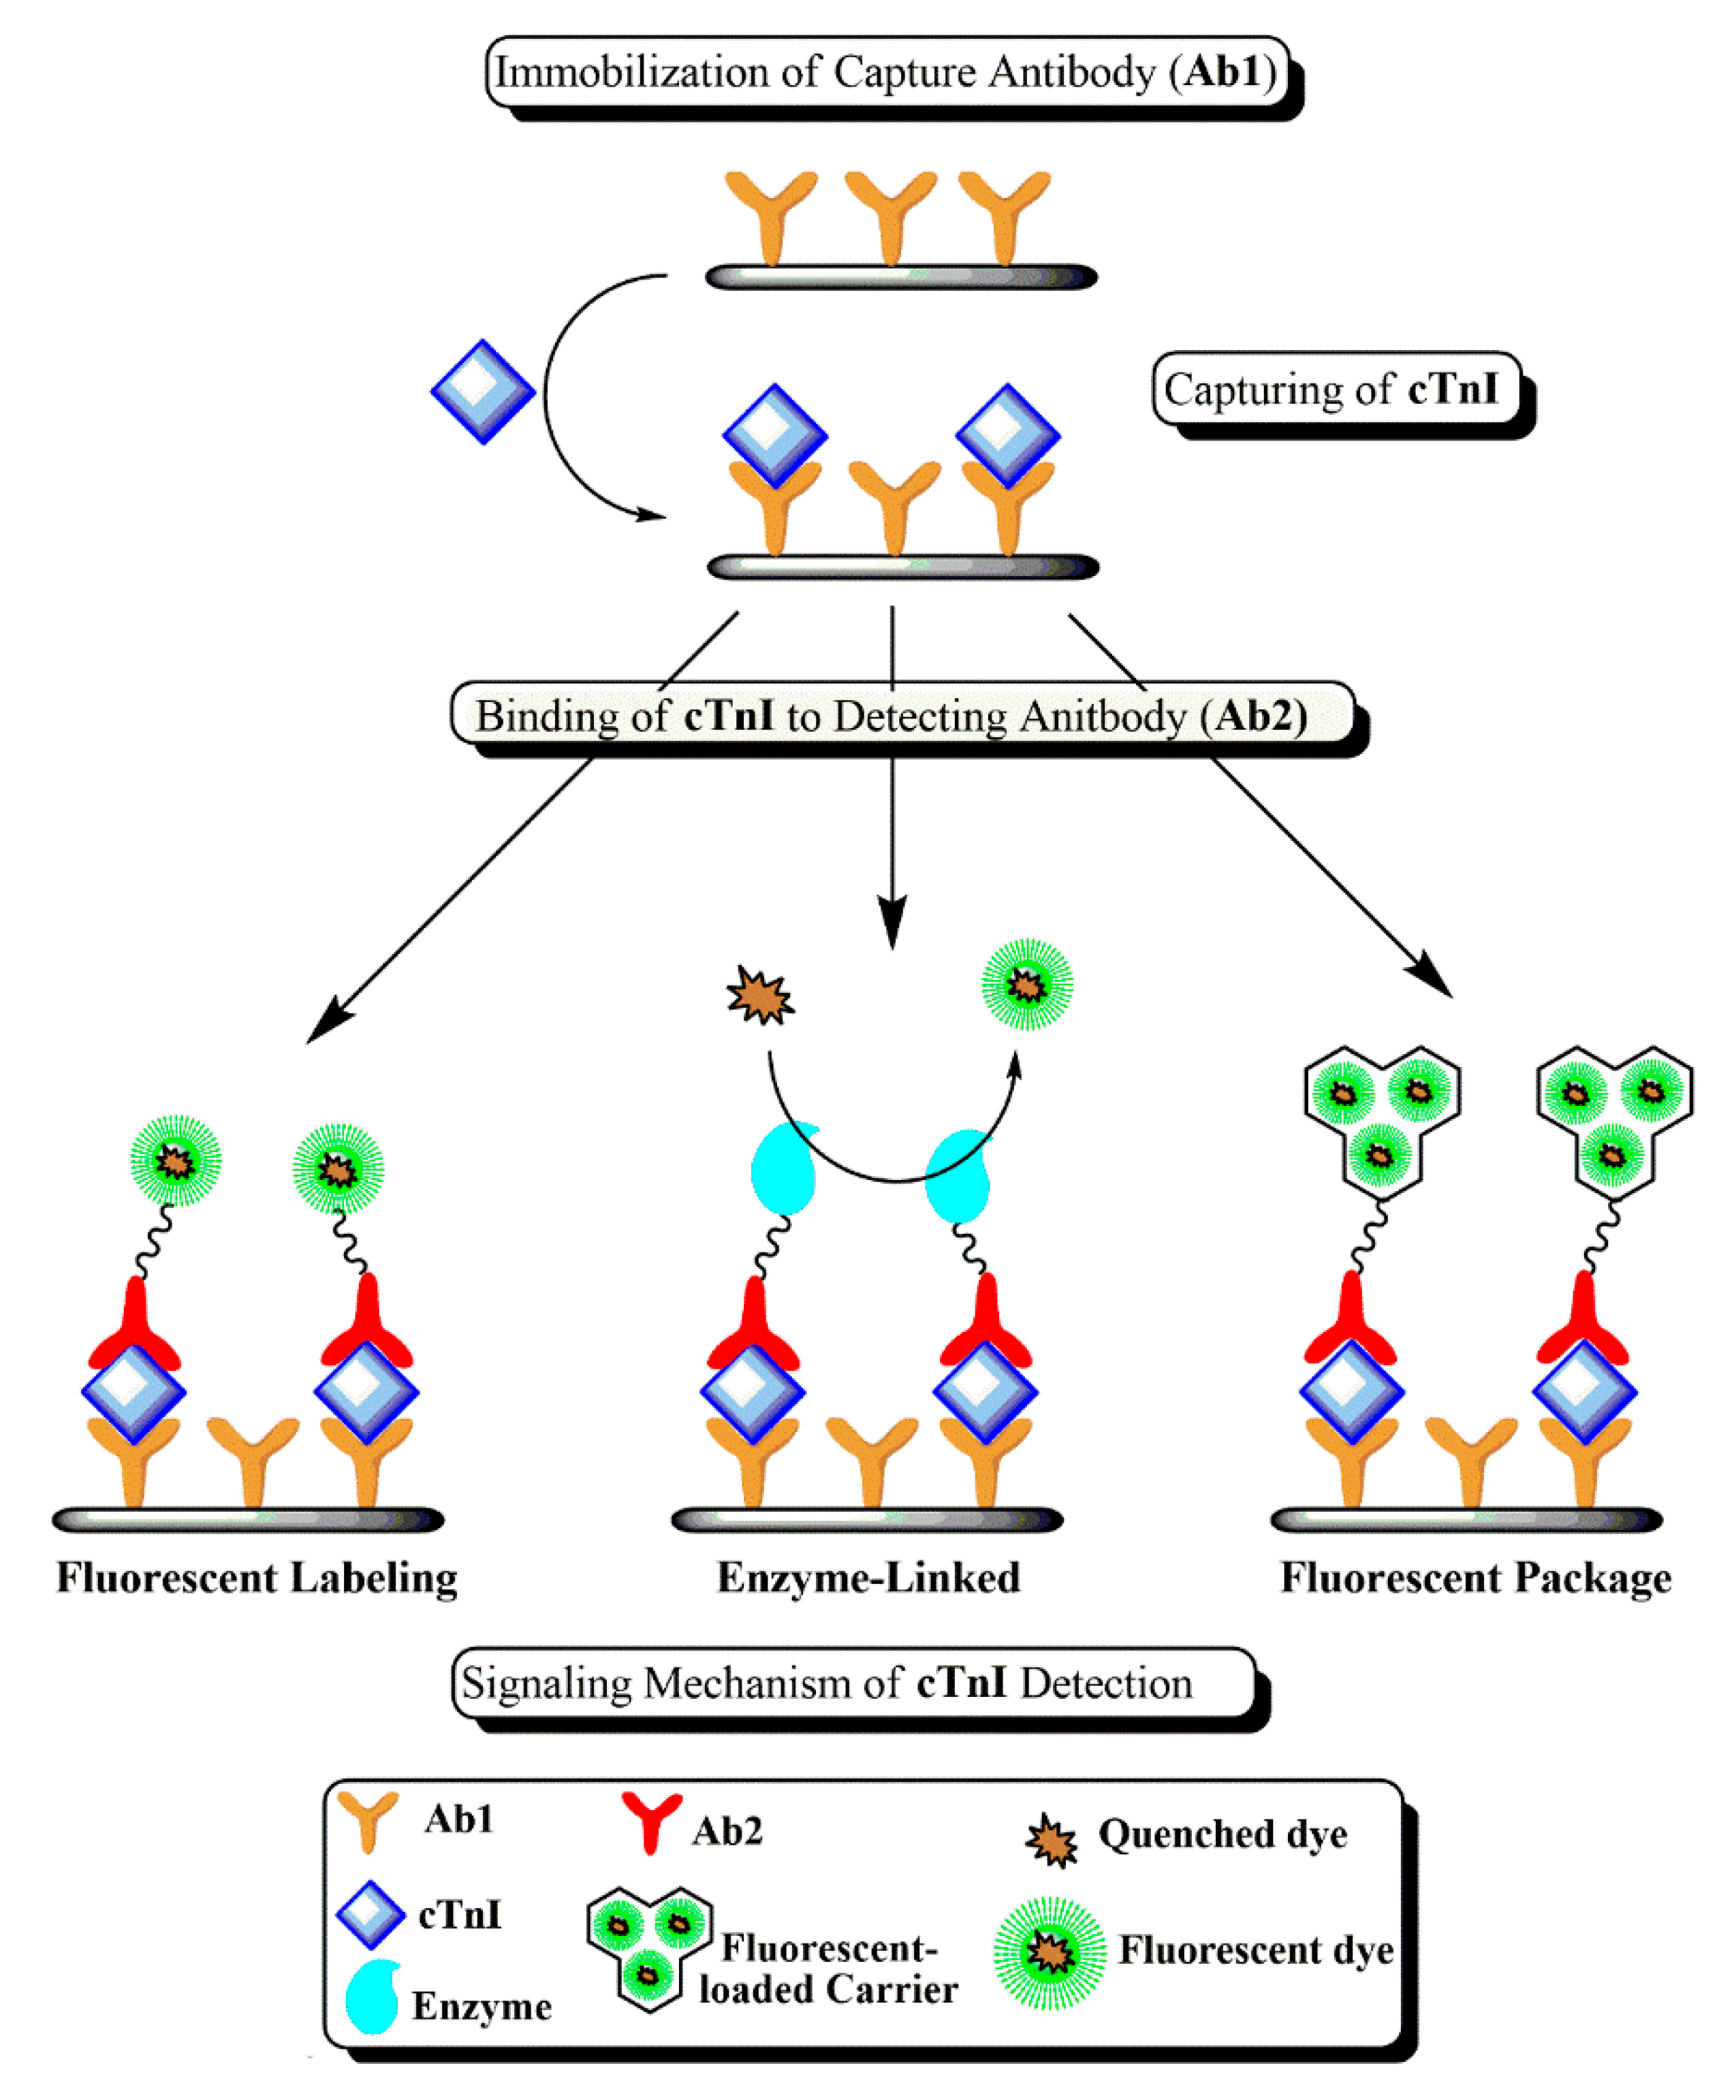
5. Signaling and Amplification Mechanisms
5.1. Direct Fluorescent Labeling
5.2. Package of Fluorescent Labels
5.3. Enzyme-Linked Assays
6. Conclusions
Author Contributions
Funding
Acknowledgments
Conflicts of Interest
Disclosure
References
- Smiseth, O.A.; Tendera, M. (Eds.) Diastolic Heart Failure; Springer: London, UK, 2008; ISBN 978-1-84628-890-6. [Google Scholar]
- WHO. WHO Global Status Report on Noncommunicable Diseases 2014; World Health Organization: Geneva, Switzerland, 2014. [Google Scholar]
- Taherinia, A.; Ahmadi, K.; Bahramian, M.; Khademhosseini, P.; Taleshi, Z.; Maghsoudi, M.; Sattarzadeh Badkoubeh, R.; Talebian, M.T.; Rezaee, M. Diagnostic value of standard electrocardiogram in acute right ventricular myocardial infarction. Eur. J. Transl. Myol. 2019, 29, 8184. [Google Scholar] [CrossRef]
- Han, X.; Li, S.; Peng, Z.; Othman, A.M.; Leblanc, R. Recent development of cardiac Troponin I detection. ACS Sens. 2016, 1, 106–114. [Google Scholar] [CrossRef]
- Sharma, S. Cardiac troponins. J. Clin. Pathol. 2004, 57, 1025–1026. [Google Scholar] [CrossRef] [Green Version]
- Takeda, S.; Yamashita, A.; Maeda, K.; Maéda, Y. Structure of the core domain of human cardiac troponin in the Ca2+-saturated form. Nature 2003, 424, 35–41. [Google Scholar] [CrossRef] [PubMed]
- Guy, M.J.; Chen, Y.-C.; Clinton, L.; Zhang, H.; Zhang, J.; Dong, X.; Xu, Q.; Ayaz-Guner, S.; Ge, Y. The impact of antibody selection on the detection of cardiac Troponin I. Clin. Chim. Acta 2013, 420, 82–88. [Google Scholar] [CrossRef] [Green Version]
- Amundson, B.E.; Apple, F.S. Cardiac troponin assays: A review of quantitative point-of-care devices and their efficacy in the diagnosis of myocardial infarction. Clin. Chem. Lab. Med. CCLM 2015, 53, 665–676. [Google Scholar] [CrossRef] [Green Version]
- Marston, S.; Zamora, J.E. Troponin structure and function: A view of recent progress. J. Muscle Res. Cell Motil. 2020, 41, 71–89. [Google Scholar] [CrossRef] [PubMed] [Green Version]
- Cheng, Y.; Regnier, M. Cardiac troponin structure-function and the influence of hypertrophic cardiomyopathy associated mutations on modulation of contractility. Arch. Biochem. Biophys. 2016, 601, 11–21. [Google Scholar] [CrossRef] [Green Version]
- Melanson, S.E.F.; Tanasijevic, M.J.; Jarolim, P. Cardiac troponin assays: A view from the clinical chemistry laboratory. Circulation 2007, 116, e501–e504. [Google Scholar] [CrossRef] [Green Version]
- Haushalter, K.J.; Vetcha, S.; Haushalter, R.C. Multiplex flow assays. ACS Omega 2016, 1, 586–599. [Google Scholar] [CrossRef]
- Ju, H.; Zhang, X.; Wang, J. Biological and Medical Physics, Biomedical Engineering. In NanoBiosensing: Principles, Development and Application; Springer: New York, NY, USA, 2011; ISBN 978-1-4419-9621-3. [Google Scholar]
- Lee, K.H.; Park, H.; Hwang, M. Immunomagnetic nanoparticle-based assays for detection of biomarkers. Int. J. Nanomed. 2013, 8, 4543. [Google Scholar] [CrossRef] [PubMed] [Green Version]
- Mayilo, S.; Kloster, M.A.; Wunderlich, M.; Lutich, A.; Klar, T.A.; Nichtl, A.; Kürzinger, K.; Stefani, F.D.; Feldmann, J. Long-range fluorescence quenching by gold nanoparticles in a sandwich immunoassay for cardiac Troponin T. Nano Lett. 2009, 9, 4558–4563. [Google Scholar] [CrossRef]
- Singal, S.; Srivastava, A.K.; Gahtori, B. Rajesh immunoassay for Troponin I using a glassy carbon electrode modified with a hybrid film consisting of graphene and multiwalled carbon nanotubes and decorated with platinum nanoparticles. Microchim. Acta 2016, 183, 1375–1384. [Google Scholar] [CrossRef]
- Zhu, J.; Zou, N.; Zhu, D.; Wang, J.; Jin, Q.; Zhao, J.; Mao, H. Simultaneous detection of high-sensitivity cardiac Troponin I and myoglobin by modified sandwich lateral flow immunoassay: Proof of principle. Clin. Chem. 2011, 57, 1732–1738. [Google Scholar] [CrossRef]
- Xu, W.; Wang, L.; Zhang, R.; Sun, X.; Huang, L.; Su, H.; Wei, X.; Chen, C.-C.; Lou, J.; Dai, H.; et al. Diagnosis and prognosis of myocardial infarction on a plasmonic chip. Nat. Commun. 2020, 11, 1654. [Google Scholar] [CrossRef] [Green Version]
- Zhang, J.; Kruss, S.; Hilmer, A.J.; Shimizu, S.; Schmois, Z.; De La Cruz, F.; Barone, P.W.; Reuel, N.F.; Heller, D.A.; Strano, M.S. A rapid, direct, quantitative, and label-free detector of cardiac biomarker Troponin T using near-infrared fluorescent single-walled carbon nanotube sensors. Adv. Healthc. Mater. 2014, 3, 412–423. [Google Scholar] [CrossRef] [PubMed]
- Cho, J.-H.; Kim, M.-H.; Mok, R.-S.; Jeon, J.-W.; Lim, G.-S.; Chai, C.-Y.; Paek, S.-H. Two-dimensional paper chromatography-based fluorescent immunosensor for detecting acute myocardial infarction markers. J. Chromatogr. B 2014, 967, 139–146. [Google Scholar] [CrossRef]
- Rodenko, O.; Eriksson, S.; Tidemand-Lichtenberg, P.; Troldborg, C.P.; Fodgaard, H.; van Os, S.; Pedersen, C. High-sensitivity detection of cardiac Troponin I with UV LED excitation for use in point-of-care immunoassay. Biomed. Opt. Express 2017, 8, 3749. [Google Scholar] [CrossRef] [Green Version]
- Lee, S.; Kang, S.H. Quenching effect on gold nano-patterned cardiac Troponin I chip by total internal reflection fluorescence microscopy. Talanta 2013, 104, 32–38. [Google Scholar] [CrossRef]
- Lopez-Calle, E.; Espindola, P.; Spinke, J.; Lutz, S.; Nichtl, A.; Tgetgel, A.; Herbert, N.; Marcinowski, M.; Klepp, J.; Fischer, T.; et al. A new immunochemistry platform for a guideline-compliant cardiac Troponin T assay at the point of care: Proof of principle. Clin. Chem. Lab. Med. CCLM 2017, 55, 1798–1804. [Google Scholar] [CrossRef]
- Tang, L.; Casas, J.; Venkataramasubramani, M. Magnetic nanoparticle mediated enhancement of localized surface plasmon resonance for ultrasensitive bioanalytical assay in human blood plasma. Anal. Chem. 2013, 85, 1431–1439. [Google Scholar] [CrossRef] [PubMed] [Green Version]
- Tan, Y.; Wang, Y.; Li, M.; Ye, X.; Wu, T.; Li, C. Enhanced photoelectrochemical immunosensing of cardiac Troponin I based on energy transfer between N-Acetyl-L-Cysteine capped CdAgTe quantum dots and dodecahedral Au nanoparticles. Biosens. Bioelectron. 2017, 91, 741–746. [Google Scholar] [CrossRef]
- Wang, Y.; Yang, Y.; Chen, C.; Wang, S.; Wang, H.; Jing, W.; Tao, N. One-step digital immunoassay for rapid and sensitive detection of cardiac Troponin I. ACS Sens. 2020, 5, 1126–1131. [Google Scholar] [CrossRef]
- Braga, F.; Aloisio, E.; Panzeri, A.; Nakagawa, T.; Panteghini, M. Analytical validation of a highly sensitive point-of-care system for cardiac Troponin I determination. Clin. Chem. Lab. Med. CCLM 2019, 58, 138–145. [Google Scholar] [CrossRef]
- Jiang, H.; Zhu, J.; Liu, W.; Cao, F. High-sensitivity cardiac Troponins I sandwich assay by immunomagnetic microparticle and quantum dots. Front. Lab. Med. 2017, 1, 107–113. [Google Scholar] [CrossRef]
- Lou, D.; Fan, L.; Ji, Y.; Gu, N.; Zhang, Y. A Signal amplifying fluorescent nanoprobe and lateral flow assay for ultrasensitive detection of cardiac biomarker Troponin I. Anal. Methods 2019, 11, 3506–3513. [Google Scholar] [CrossRef]
- Liu, D.; Lu, X.; Yang, Y.; Zhai, Y.; Zhang, J.; Li, L. A novel fluorescent aptasensor for the highly sensitive and selective detection of cardiac Troponin I based on a graphene oxide platform. Anal. Bioanal. Chem. 2018, 410, 4285–4291. [Google Scholar] [CrossRef] [PubMed]
- Kar, P.; Pandey, A.; Greer, J.J.; Shankar, K. Ultrahigh sensitivity assays for human cardiac Troponin I using TiO2 nanotube arrays. Lab. Chip 2012, 12, 821. [Google Scholar] [CrossRef]
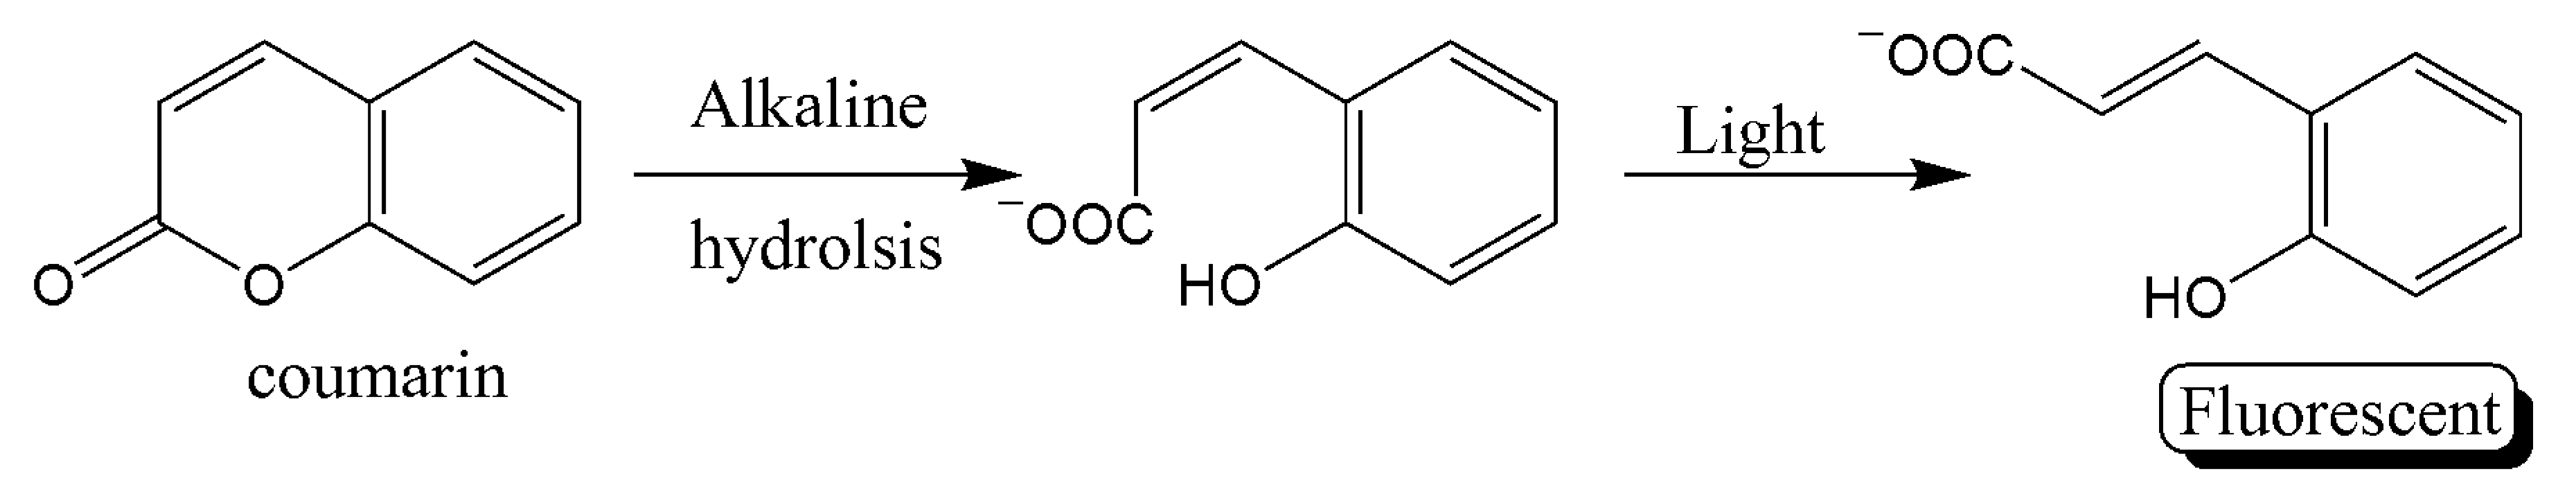
- Wang, X.; Wang, X.; Han, Y.; Li, H.; Kang, Q.; Wang, P.; Zhou, F. Immunoassay for cardiac Troponin I with fluorescent signal amplification by hydrolyzed coumarin released from a metal–organic framework. ACS Appl. Nano Mater. 2019, 2, 7170–7177. [Google Scholar] [CrossRef]
- Järvenpää, M.-L.; Kuningas, K.; Niemi, I.; Hedberg, P.; Ristiniemi, N.; Pettersson, K.; Lövgren, T. Rapid and sensitive cardiac Troponin I immunoassay based on fluorescent europium(III)-chelate-dyed nanoparticles. Clin. Chim. Acta 2012, 414, 70–75. [Google Scholar] [CrossRef] [PubMed]
- Li, Y.; Dai, W.; Lv, X.; Deng, Y. Aptamer-based rolling circle amplification coupled with graphene oxide-based fluorescence resonance energy transfer for sensitive detection of cardiac Troponin I. Anal. Methods 2018, 10, 1767–1773. [Google Scholar] [CrossRef]
- Zhao, J.; Wang, S.; Lu, S.; Liu, G.; Sun, J.; Yang, X. Fluorometric and colorimetric dual-readout immunoassay based on an alkaline phosphatase-triggered reaction. Anal. Chem. 2019, 91, 7828–7834. [Google Scholar] [CrossRef] [PubMed]
- Liu, J.; Zhang, L.; Wang, Y.; Zheng, Y.; Sun, S. An improved portable biosensing system based on enzymatic Chemiluminescence and magnetic immunoassay for biological compound detection. Measurement 2014, 47, 200–206. [Google Scholar] [CrossRef]
- Liu, G.; Zhao, J.; Wang, S.; Lu, S.; Sun, J.; Yang, X. Enzyme-induced in situ generation of polymer carbon dots for fluorescence immunoassay. Sens. Actuators B Chem. 2020, 306, 127583. [Google Scholar] [CrossRef]
- Miao, L.; Jiao, L.; Tang, Q.; Li, H.; Zhang, L.; Wei, Q. A nanozyme-linked immunosorbent assay for dual-modal colorimetric and ratiometric fluorescent detection of cardiac Troponin I. Sens. Actuators B Chem. 2019, 288, 60–64. [Google Scholar] [CrossRef]
- Jiao, L.; Zhang, L.; Du, W.; Li, H.; Yang, D.; Zhu, C. Au@Pt nanodendrites enhanced multimodal enzyme-linked Immunosorbent assay. Nanoscale 2019, 11, 8798–8802. [Google Scholar] [CrossRef]
- Tan, X.; Zhang, L.; Tang, Q.; Zheng, G.; Li, H. Ratiometric fluorescent immunoassay for the cardiac Troponin-I using carbon dots and palladium-iridium nanocubes with peroxidase-mimicking activity. Microchim. Acta 2019, 186, 280. [Google Scholar] [CrossRef]
- Hemmig, E.; Temiz, Y.; Gökçe, O.; Lovchik, R.D.; Delamarche, E. Transposing lateral flow immunoassays to capillary-driven microfluidics using self-coalescence modules and capillary-assembled receptor carriers. Anal. Chem. 2020, 92, 940–946. [Google Scholar] [CrossRef]
- Tang, M.; Zhou, Z.; Shangguan, L.; Zhao, F.; Liu, S. Electrochemiluminescent detection of cardiac troponin I by using soybean peroxidase labeled-antibody as signal amplifier. Talanta 2018, 180, 47–53. [Google Scholar] [CrossRef] [PubMed]
- Natarajan, S.; Jayaraj, J.; Prazeres, D.M.F. A cellulose paper-based fluorescent lateral flow immunoassay for the quantitative detection of cardiac Troponin I. Biosensors 2021, 11, 49. [Google Scholar] [CrossRef]
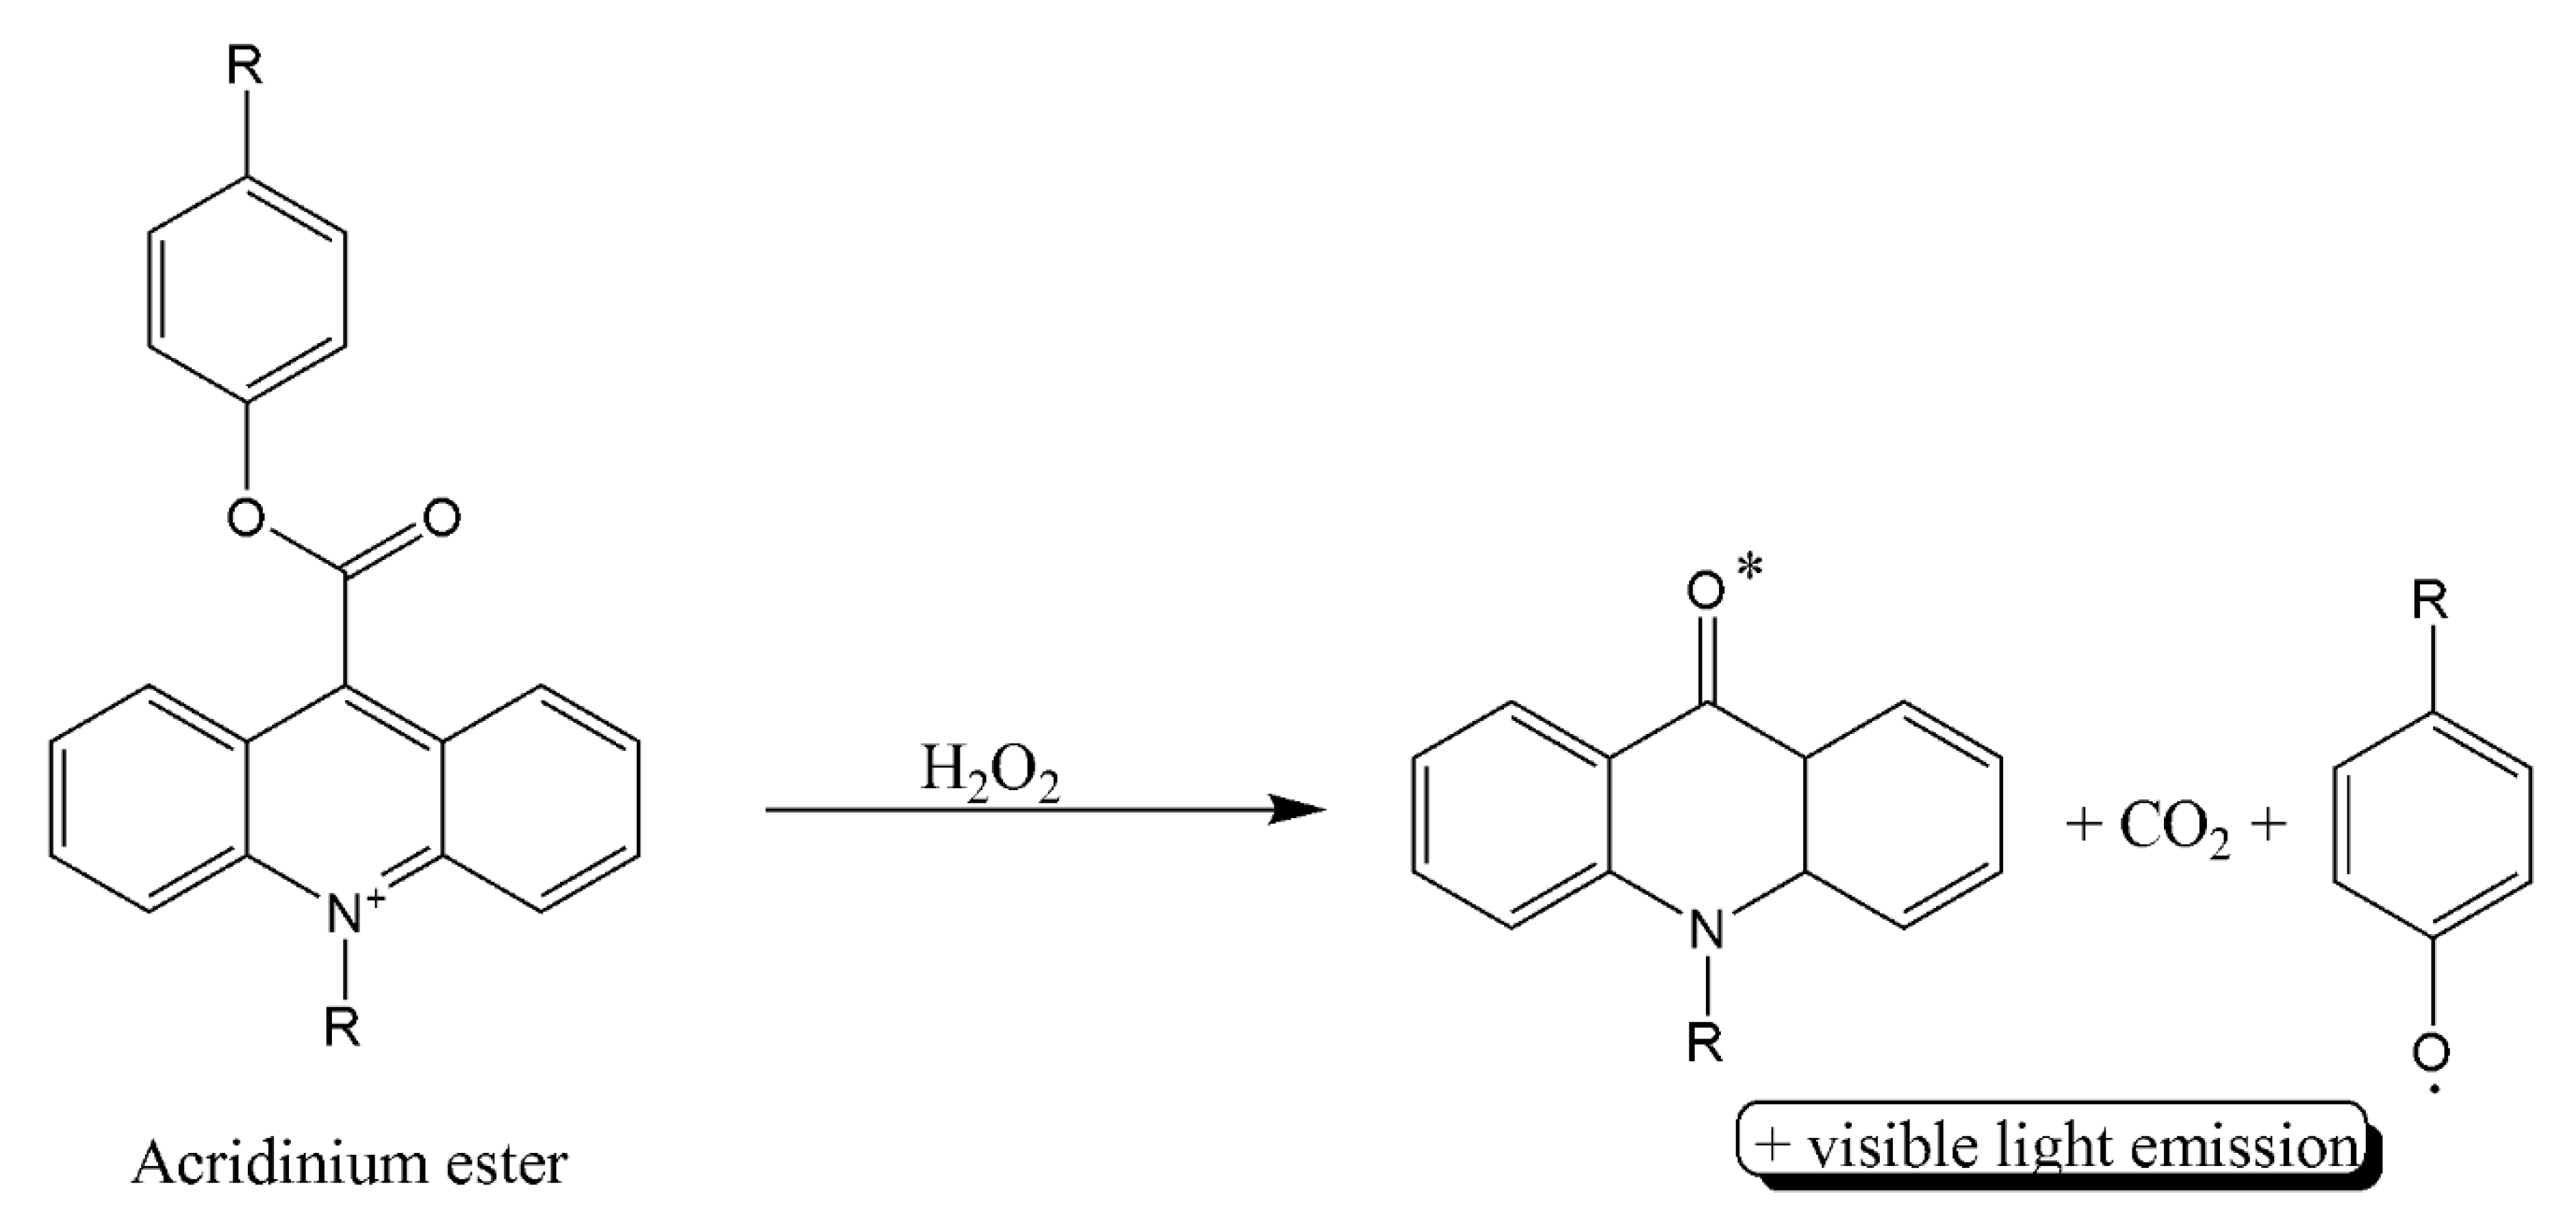
- Zhao, H.; Lin, Q.; Huang, L.; Zhai, Y.; Liu, Y.; Deng, Y.; Su, E.; He, N. Ultrasensitive chemiluminescence immunoassay with enhanced precision for the detection of CTnI amplified by acridinium ester-loaded microspheres and internally calibrated by magnetic fluorescent nanoparticles. Nanoscale 2021, 13, 3275–3284. [Google Scholar] [CrossRef] [PubMed]
- Li, Y.; Yang, Y.; Lü, X.; Deng, Y. Aptamer-based fluorescent assay for sensitive detection of cardiac Troponin I. J. Beijing Inst. Technol. 2020, 29, 45. [Google Scholar]


| cTn Subunits | Molecular Weight and Size | Functions |
|---|---|---|
| cTnI | 24 kDa, 210-residue long protein | Actomyosin ATPase inhibitory subunit |
| cTnT | 36 kDa, 288-residue long protein | Tropomyosin binding subunit |
| cTnC | 18 kDa, a 161-residue long protein with two globular domains | Ca2+ binding subunit and an anchoring protein of Tn complex |
| Assay Type/Signaling Mechanism a | Signaling Probe/Particle | LOD (ng/mL) | LDR (ng/mL) | Ref |
|---|---|---|---|---|
| QDs-based SIA | Immunomagnetic microparticle and QDs | 4.7 × 10⁻² | 0–40 | [28] |
| PoC system by fluorescence detection | Sensor chip with fluorescence-labeled dAb | 6.2 × 10⁻⁴ | 2.0–7132 | [27] |
| LFIA with fluorescent nanoprobe | Multilayer surface-functionalized nanospheres with fluorescent molecules. | 4.9 × 10⁻² | 0.049–50.0 | [29] |
| LED-excitation-based immunoassay for PoC use | A reflection-type fluorimeter with a single chip UV LED | 2.2 × 10⁻⁴ | 0.25–30.0 | [21] |
| Fluorescent aptasensor | Fluorescence of anti-cTnI aptamers labeled by 6-carboxyfluorescein | 7.0 × 10⁻² | 0.1–6.0 | [30] |
| Two-dimensional paper-based fluorescent immunosensor | Fluorescent-conjugated dAb | 5.0 × 10⁻² | 0.05–25.0 | [20] |
| Extended SIA | Fluorescent-conjugated tertiary antibody | 1.0 × 10⁻⁴ | 0.1–1.0 | [31] |
| FSIAwith MOF-loaded dye | Release of fluorescent coumarin from a MOF | 9.9 × 10⁻⁵ | 0.00024–0.7911 | [32] |
| FSIA | Sensitive fluorescent-europium (III)-chelate-dye-nanoparticle | 2.0 × 10⁻³ | 0.003–9.6 | [33] |
| RCA of fluorescent aptamer | FRET signal between the fluorescent aptamer and graphene oxide | 1.4 × 10⁻² | 0.050–0.5 | [34] |
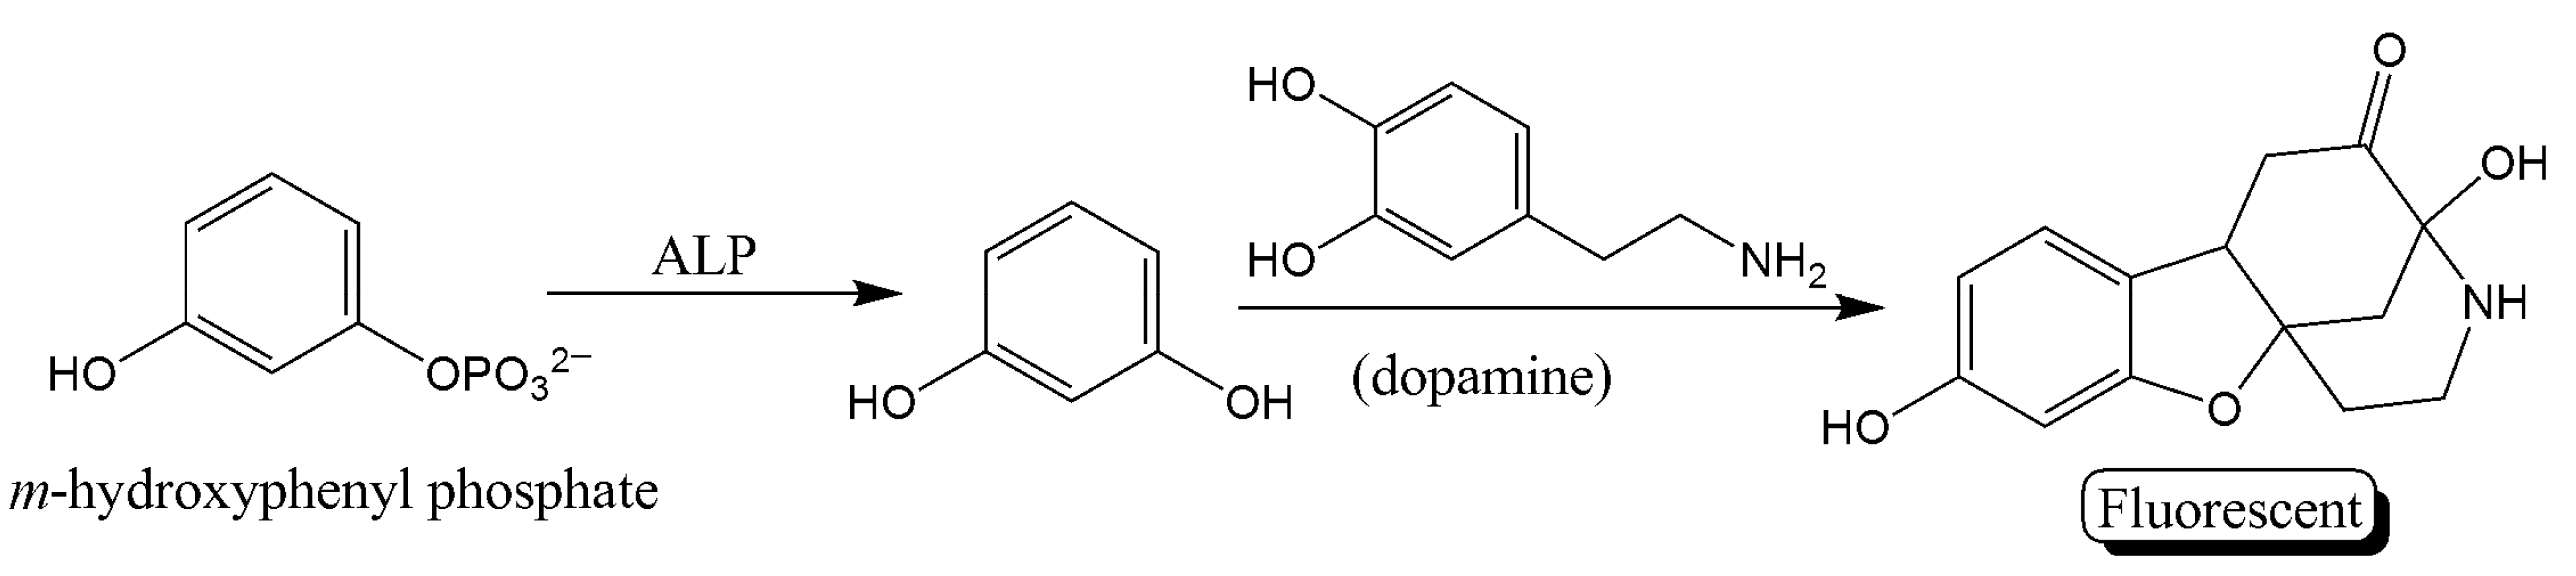
| Fluorometric and colorimetric dual-readout ALP activity | Hydrolysis of m-hydroxyphenyl phosphate to a fluorescent product | 4.0 × 10⁻² | 0.125–8.0 | [35] |
| Enzymatic chemiluminescence and MIA | ALP chemiluminescence chemistry-based detection. | 1.0 × 10⁻¹ | 0.1–50.0 | [36] |
| ALP-based fluorescent ELISA | Fluorescent polymer carbon dots | 1.0 | 1.0–30.0 | [37] |
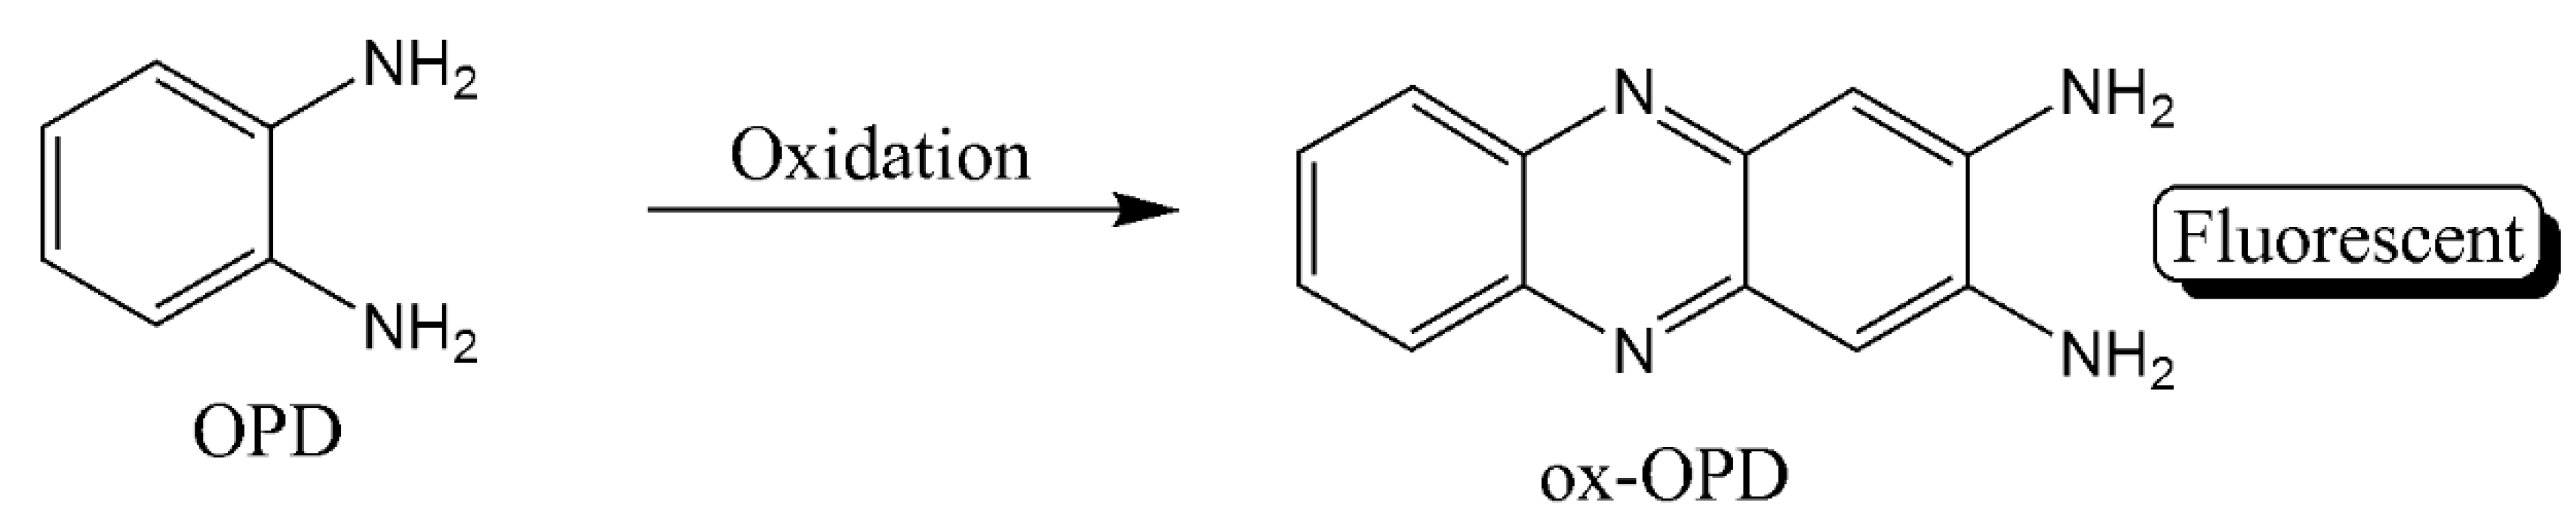
| NLISA | Colorimetric and ratiometric fluorescent detection through oxOPD and QDs | 2.3 × 10⁻⁴ | 0.001–10 | [38] |
| ELISA with the enzyme-like activity of Au@Pt nanodendrites | Combining signals of temperature, color and fluorescence. | 3.4 × 10⁻¹ | 0.5–5.0 | [39] |
| ELISA with Pd-Ir nanocubes | CDs and fluorescent oxOPD | 3.1 × 10⁻² | 0.001–1.0 | [40] |
| NIFA | Fluorescent single-walled CNT | 100 | 0–2500 | [19] |
| Detection on pGold chip using SIA | A pGold chip-based platform | 1.0 × 10⁻² | 0.01–1.2 | [18] |
| MNPmediated-SPR | Fe3O4 MNP | 7.2 × 10⁻¹ | 1.0–20.0 | [24] |
| Photoelectrochemical immunosensing | CdAgTe quantum dots and dodecahedral AuNPs | 1.7 × 10⁻³ | 0.005–0.02 | [25] |
| Single-step LFIA | Microfluidic chip instrumented with two microfluidic modules | 4.0 | 0.01–1000 | [41] |
| RTDIA based on a novel differential bright field imaging system | Gold nanoparticles (AuNPs) | 5.7 × 10⁻³ | 0–5000 | [26] |
| ECL immunosensing | Polyethylenimine-functionalized graphene electrode | 3.3 × 10⁻² | 0.005–30 | [42] |
Publisher’s Note: MDPI stays neutral with regard to jurisdictional claims in published maps and institutional affiliations. |
© 2021 by the authors. Licensee MDPI, Basel, Switzerland. This article is an open access article distributed under the terms and conditions of the Creative Commons Attribution (CC BY) license (https://creativecommons.org/licenses/by/4.0/).
Share and Cite
Radha, R.; Shahzadi, S.K.; Al-Sayah, M.H. Fluorescent Immunoassays for Detection and Quantification of Cardiac Troponin I: A Short Review. Molecules 2021, 26, 4812. https://doi.org/10.3390/molecules26164812
Radha R, Shahzadi SK, Al-Sayah MH. Fluorescent Immunoassays for Detection and Quantification of Cardiac Troponin I: A Short Review. Molecules. 2021; 26(16):4812. https://doi.org/10.3390/molecules26164812
Chicago/Turabian StyleRadha, Remya, Syeda Kiran Shahzadi, and Mohammad Hussein Al-Sayah. 2021. "Fluorescent Immunoassays for Detection and Quantification of Cardiac Troponin I: A Short Review" Molecules 26, no. 16: 4812. https://doi.org/10.3390/molecules26164812
APA StyleRadha, R., Shahzadi, S. K., & Al-Sayah, M. H. (2021). Fluorescent Immunoassays for Detection and Quantification of Cardiac Troponin I: A Short Review. Molecules, 26(16), 4812. https://doi.org/10.3390/molecules26164812