1. Introduction
Fostamatinib is an oral Syk inhibitor that is effective in the treatment of malignant clones through inhibition of antigen-dependent BCR signals [
1,
2]. Fostamatinib is a prodrug of the active compound, tamatinib, which is a relatively selective Syk inhibitor used to treat rheumatoid arthritis [
3,
4], especially in patients with poor therapeutic response to methotrexate [
5]. It is also used to treat thrombocytopenia, a shortage of blood platelets needed for normal blood clotting [
6]. A recent study reported that mice treated with fostamatinib showed less fibrosis and inflammation in lung tissue [
7]. Moreover, fostamatinib has a therapeutic option for limiting breast cancer metastasis [
8] and for treatment of rheumatoid arthritis [
9]. The drug can induce time- and dose-dependent decline in cell viability that is linked to apoptosis activation. This activity causes a reduction in tumor growth and was enhanced in combinations with other treatments, including bortezomib, rituximab, and dexamethasone [
10]. However, dropout and subsequent loss of efficacy during fostamatinib treatment increased with the increases of its dose [
3].
Fostamatinib administration shows variable effects on the pharmacokinetics of other drugs. Clinical investigations indicate that co-administration of fostamatinib increased the rate and extent of absorption of ethinyl estradiol, simvastatin, or rosuvastatin, but had no impact on the pharmacokinetics of warfarin [
11] or methotrexate in rheumatoid arthritis patients [
12]. Therapeutic effects of fostamatinib in chronic lymphocytic leukemia (CLL) was successfully tested in mice [
13] and in clinical trials (phase I and II studies) with proven efficacy and safety in patients with CLL and B cell non-Hodgkin lymphoma (NHL) [
2].
Administration of fostamatinib during pregnancy caused urogenital and cardiovascular abnormalities through kidney and ureteral agenesis and a specific major vessel abnormality of the retroesophageal right subclavian artery [
14]. Tamatinib displays minimal functional immunotoxicity [
15]. In experimental nephrotoxic nephritis in rats, tamatinib reduced glomerular macrophage infiltration, tissue injury, and proteinuria [
16]. It also reduced renal monocyte chemoattractant protein glomerulonephritis in a time-dependent manner and improved renal function [
16].
Fostamatinib hydrolyzes rapidly to tamatinib by intestinal alkaline phosphatases. It is highly bioavailable with dose-dependent systemic exposure [
17]. A study carried out both in vitro and in humans showed that fostamatinib was rapidly transformed to tamatinib by human intestinal microsomes [
18,
19]. After oral administration of fostamatinib, tamatinib was the major metabolite in plasma while fostamatinib plasma levels were very low [
20]. An in-vitro study confirmed that tamatinib is metabolized by CYP3A4 via O-demethylation. Rifampicin (a CYP3A4 inducer) decreased tamatinib blood levels [
11]. Concurrent administration of ketoconazole and verapamil with fostamatinib increases tamatinib levels, attributable inhibition of CYP3A4. Fostamatinib lowered concentrations of pioglitazone and its metabolite hydroxy pioglitazone, increased pioglitazone AUC, and decreased production of the hydroxy metabolite. These observations demonstrated that tamatinib is a CYP2C8 inducer [
11]. Dose escalation of fostamatinib showed a linear response with rapid onset. In vitro, tamatinib downregulated macrophages stimulated with aggregated IgG and MCP-1 produced from mesangial cells [
16].
Tamatinib induces progressive improvement in histopathology, clinical scores, and joint radiography in collagen-induced arthritis in rodents [
21]. Tamatinib is used in therapy for glomerulonephritis through targeting of Syk [
16] and has shown efficacy and safety in patients with NHL [
22]. Tamatinib, as a Syk inhibitor, acts with TGF-β to decrease cell viability. These actions result in a reduction in progression through the cell cycle and increased cell apoptosis [
23]. Tamatinib infusion increases blood pressure in anesthetized rats. It inhibits vascular endothelial growth factors dose-dependently [
24]. It also increases femoral arterial conductance [
5].
Tamatinib, like most TYK inhibitor drugs, has a narrow therapeutic margin. Therefore, individualization of the dose is necessary for safe and efficacious use. Consequently, a sensitive, precise, and accurate method is needed for dose adjustment. There is a lack of fully validated methods for tamatinib determination in plasma. The purpose of this work was to develop an accurate, rapid, and eco-friendly method for detection of tamatinib in rat plasma using UPLC–MS/MS and to apply this method in a pharmacokinetic study.
2. Results and Discussion
2.1. Optimization of Chromatographic Condition
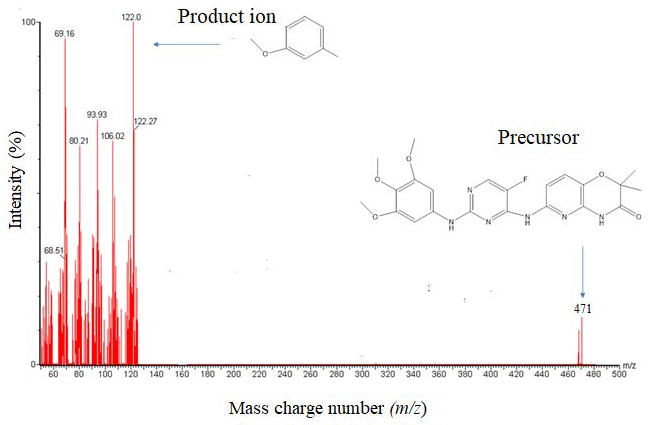
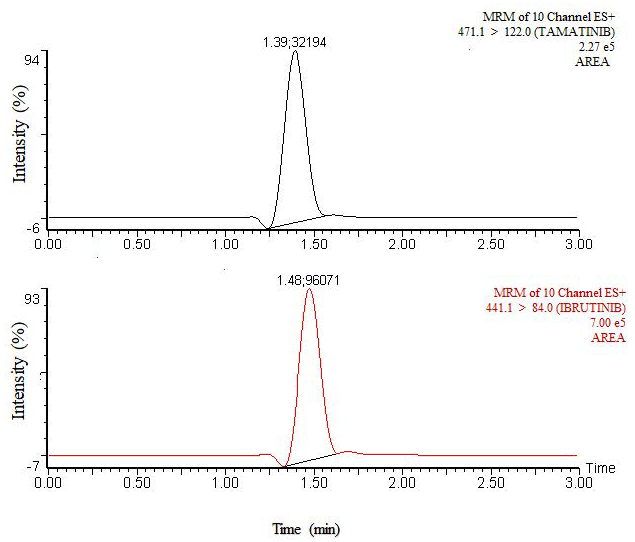
In chromatographic analysis, the efficiency of analytical methods to separate the analyte and IS depends on its sensitivity, which is represented by LLOD or LLOQ. Both mass spectrometry and chromatographic conditions were optimized. Tamatinib and IS (500 ng/mL) were injected into the mass spectrometer with a flow rate of 5 µL/min. Higher sensitivity for both analyte and IS was obtained using the positive ionization mode. The most abundant fragment ions were found at
m/
z 122.0 and 84.0 for the analyte and IS, respectively, and MRM fragmentation of [M+H]
+ 471.1 > 122.0 and 441.1 > 84.0 were applied for quantitation of the analyte and IS, respectively (
Figure 1).
To achieve the best separation, HILIC, Acquity BEH C18 and Acquity CSH C18 columns were tested. The best column for sensitivity and resolution was AcquityTM (Milford, MA 01757, USA) UPLC CSH C18 (2.1 mm × 100 mm, 1.7 µm). Acetonitrile and methanol were tested as solvents with various amounts of ammonium acetate or ammonium format. The most efficient mobile phase with the best retention times for the analyte and IS was acetonitrile with 10 mM ammonium acetate (90:10) at an elution rate of 0.25 mL/min.
2.2. Sample Preparation
Sample preparation is the most important process in a bioanalytical method because it can remove endogenous and other substances to yield higher sensitivity. Protein precipitation, the simplest method in drug analysis, was assessed. However, the recovery or method efficiency was low. This result may reflect suppression arising from interfering endogenous bio-components among the solvents—ethyl acetate, diethyl ether, MTBE, and dichloromethane—tested for extraction of tamatinib and IS. MTBE showed the highest recovery. Finally, a combination of cleanup methods—namely, protein precipitation before liquid–liquid extraction with MTBE—was used to obtain the highest recovery and sensitivity for the analysis of the analyte and IS.
2.3. Method Validation
FDA guidelines for bioanalytical methods were followed to validate the present method. The validation comprises of accuracy, precision, extraction recovery, matrix effects, and stability studies. Three concentration levels of QC samples, across the range of CC, were evaluated (LOQ, MQC, and HQC) along with LLOQ.
2.3.1. Selectivity and Sensitivity
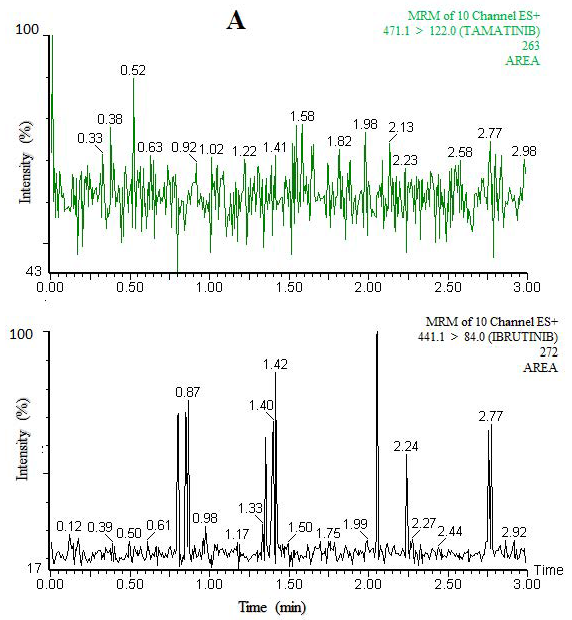
No interfering peaks were found at the retention time of tamatinib and IS following analysis of blank plasma extracted using the same extraction and separation method using the optimized UPLC–MS/MS condition.
Figure 2 shows a typical chromatogram of the extracted blank rat plasma. Sensitivity, or the relationship between the analyte signal and the concentration, is very important for the quality of the method used for therapeutic drug monitoring and routine analysis, and it is related to the signal-to-noise ratio. To maximize the sensitivity and avoid ionization suppression, mass spectrometry parameters were adjusted to get highest intensity. The values of signal-to-noise ratio were 6.96 and 12.46 for low limit of detection (LLOD) and low limit of quantitation (LLOQ), respectively. The values of these parameters are shown in
Table 1.
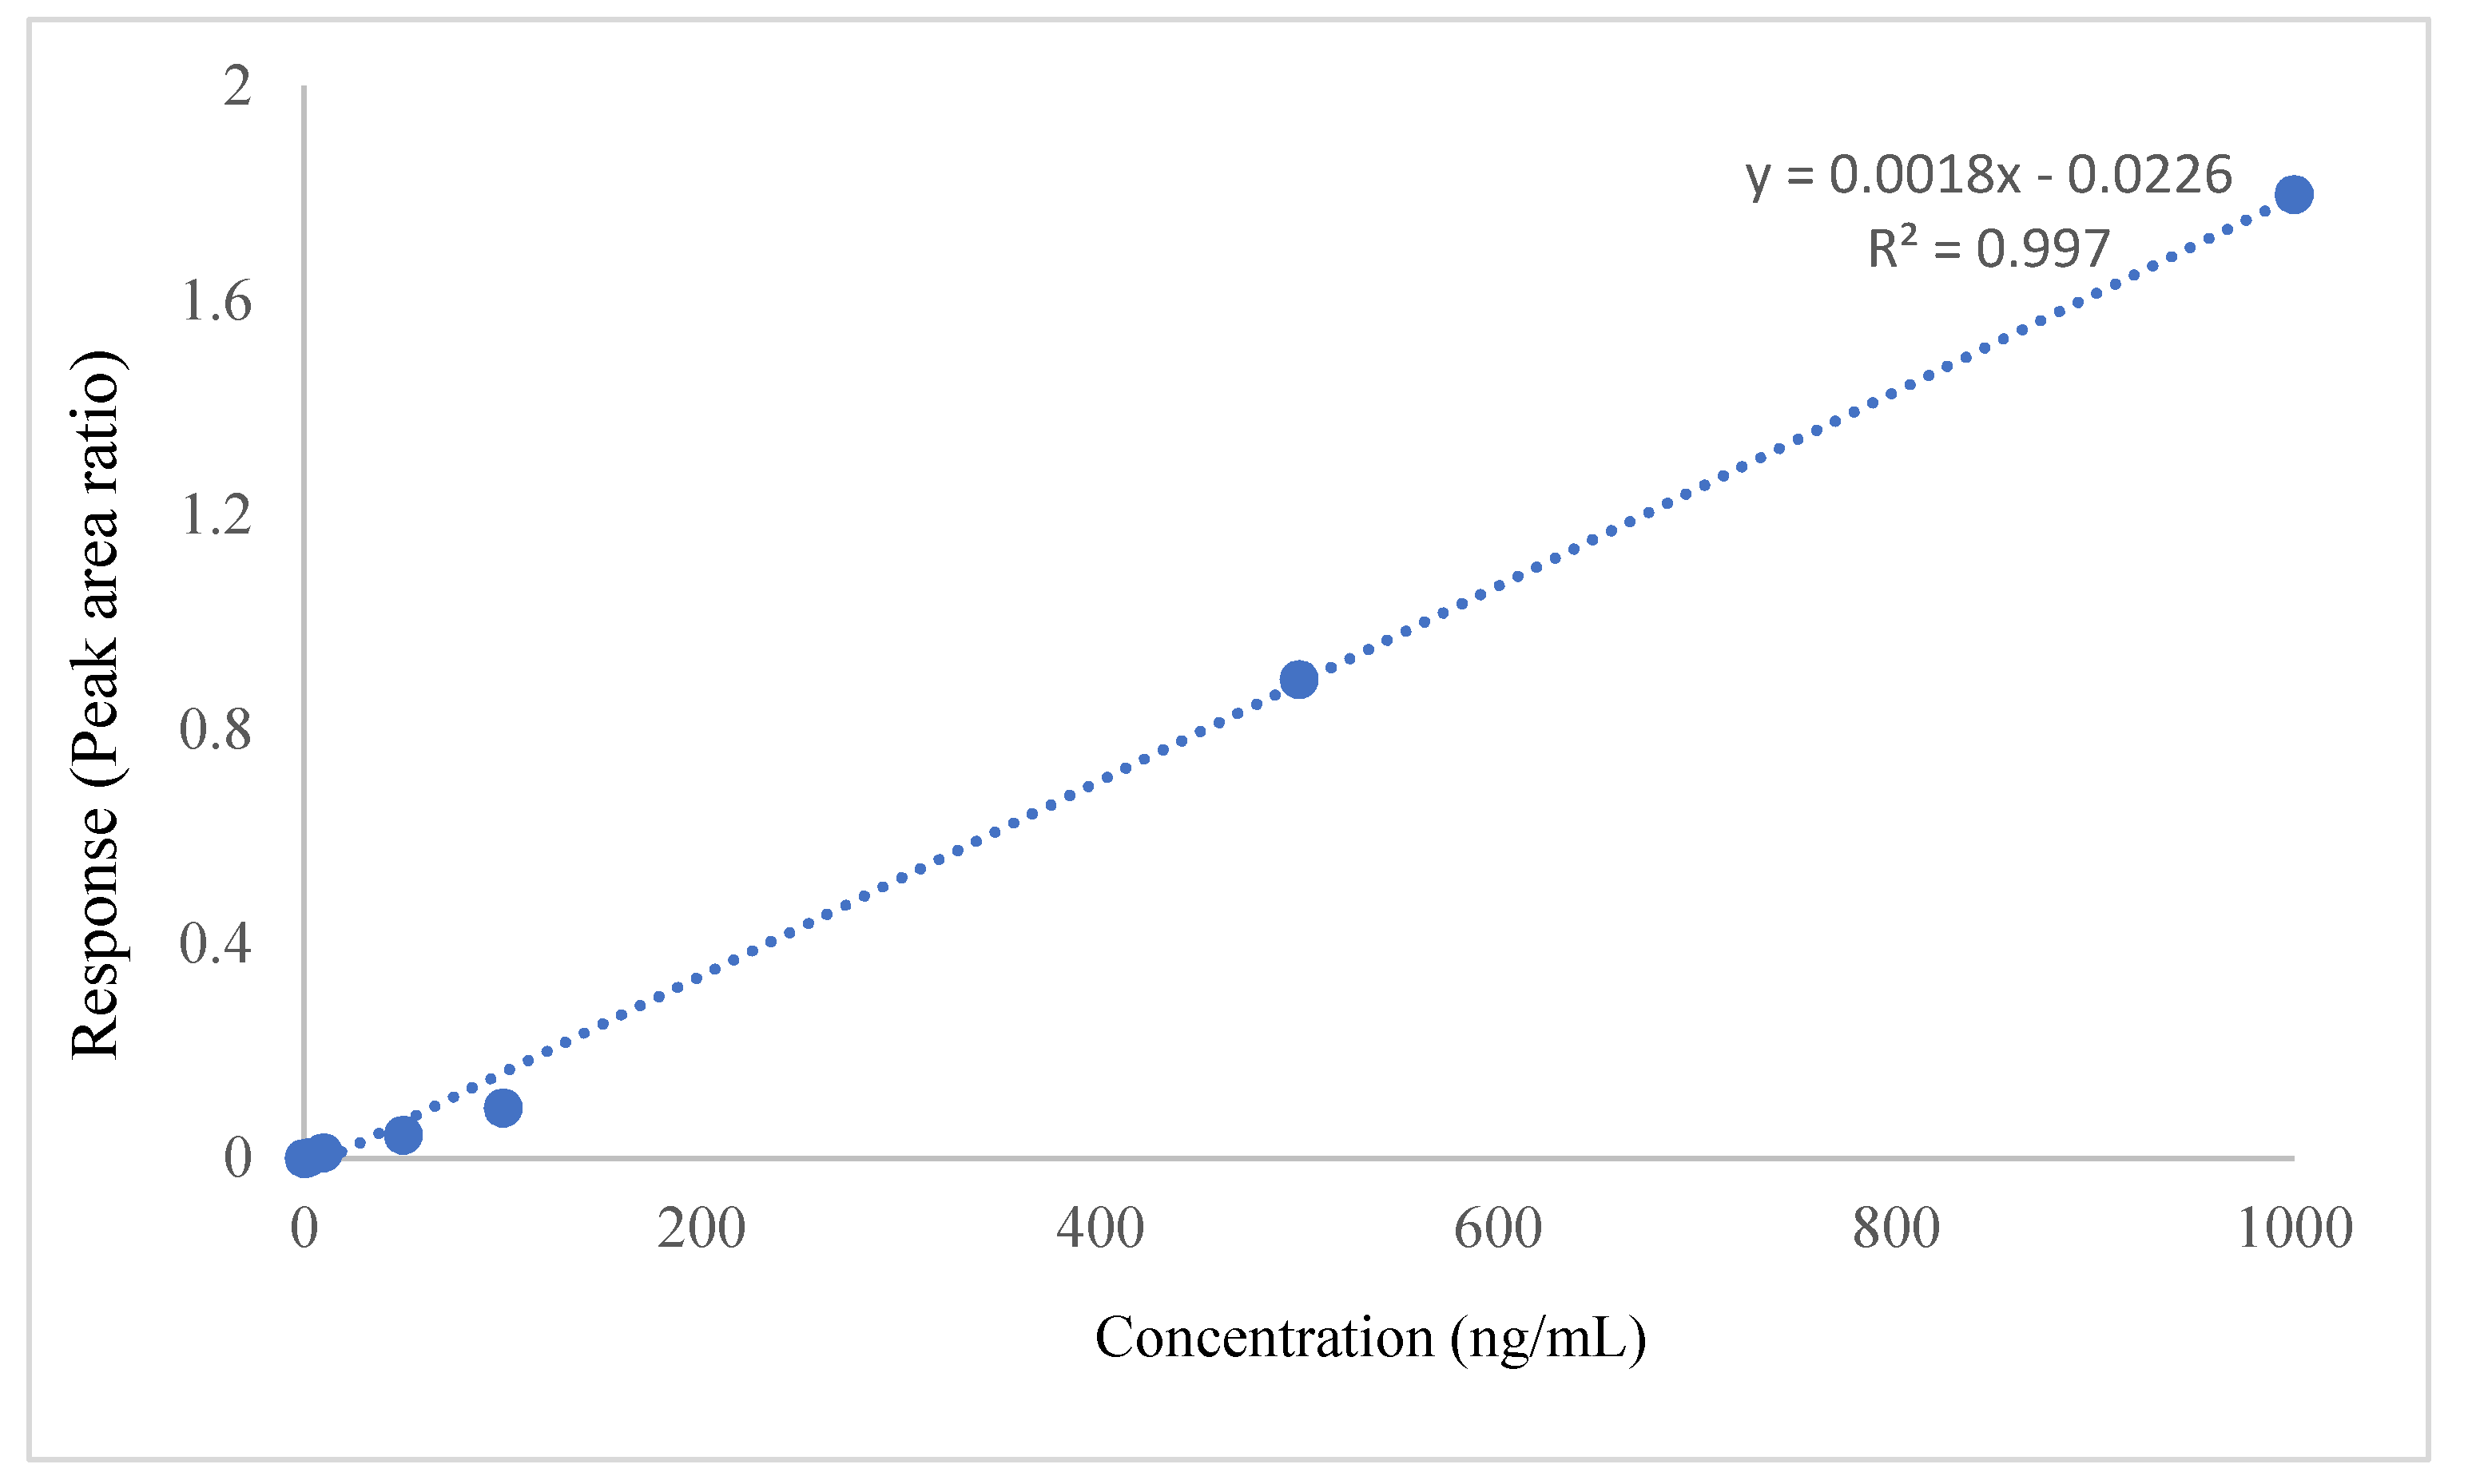
2.3.2. Linearity
Linearity was determined by the regression coefficient from a plot of the ratios of tamatinib to IS (analyte/IS) against tamatinib concentration taken from CC. The method’s linearity was within an acceptable range (0.997) (
Table 1,
Figure 3).
2.3.3. Accuracy and Precision
The LLOQ and three levels of QC were analyzed in five replicates on 3 successive days to determine intra- and inter-day accuracy and precision, respectively. Accuracy is the closeness of a measured value to the actual one or the percentage deviation from nominal concentrations, and precision is expressed as CV%. Accuracy and precision of the method were within acceptable levels. The Guidelines stated accuracy and precision should be ≤±15% and within ±15%, respectively, except for LLOQ, for which they can be ≤±20% and within ±20%, respectively (
Table 2).
2.3.4. Recovery and Matrix Effects
The average of recovery and matrix effect were measured by the analysis of QC samples. Mean recovery (method efficiency) was 81.23% among the three levels. Matrix effect was negligible, showing little ion suppression with an average of matrix effect less than 15% (
Table 3). The recovery of the other solvents used, such as ethyl acetate, diethyl ether, and dichloromethane, ranged from 55% to 63%.
2.3.5. Stability
Stability of tamatinib was examined under different processing and storage conditions using LQC, MQC, and HQC samples. The results demonstrated that tamatinib was stable in plasma under different conditions, showing percentage of deviation (precision) in all cases of ≤15%. In addition, percentage accuracy of tamatinib was also within the ±15% limit. This indicated that the method was stable during its application and use)
Table 4).
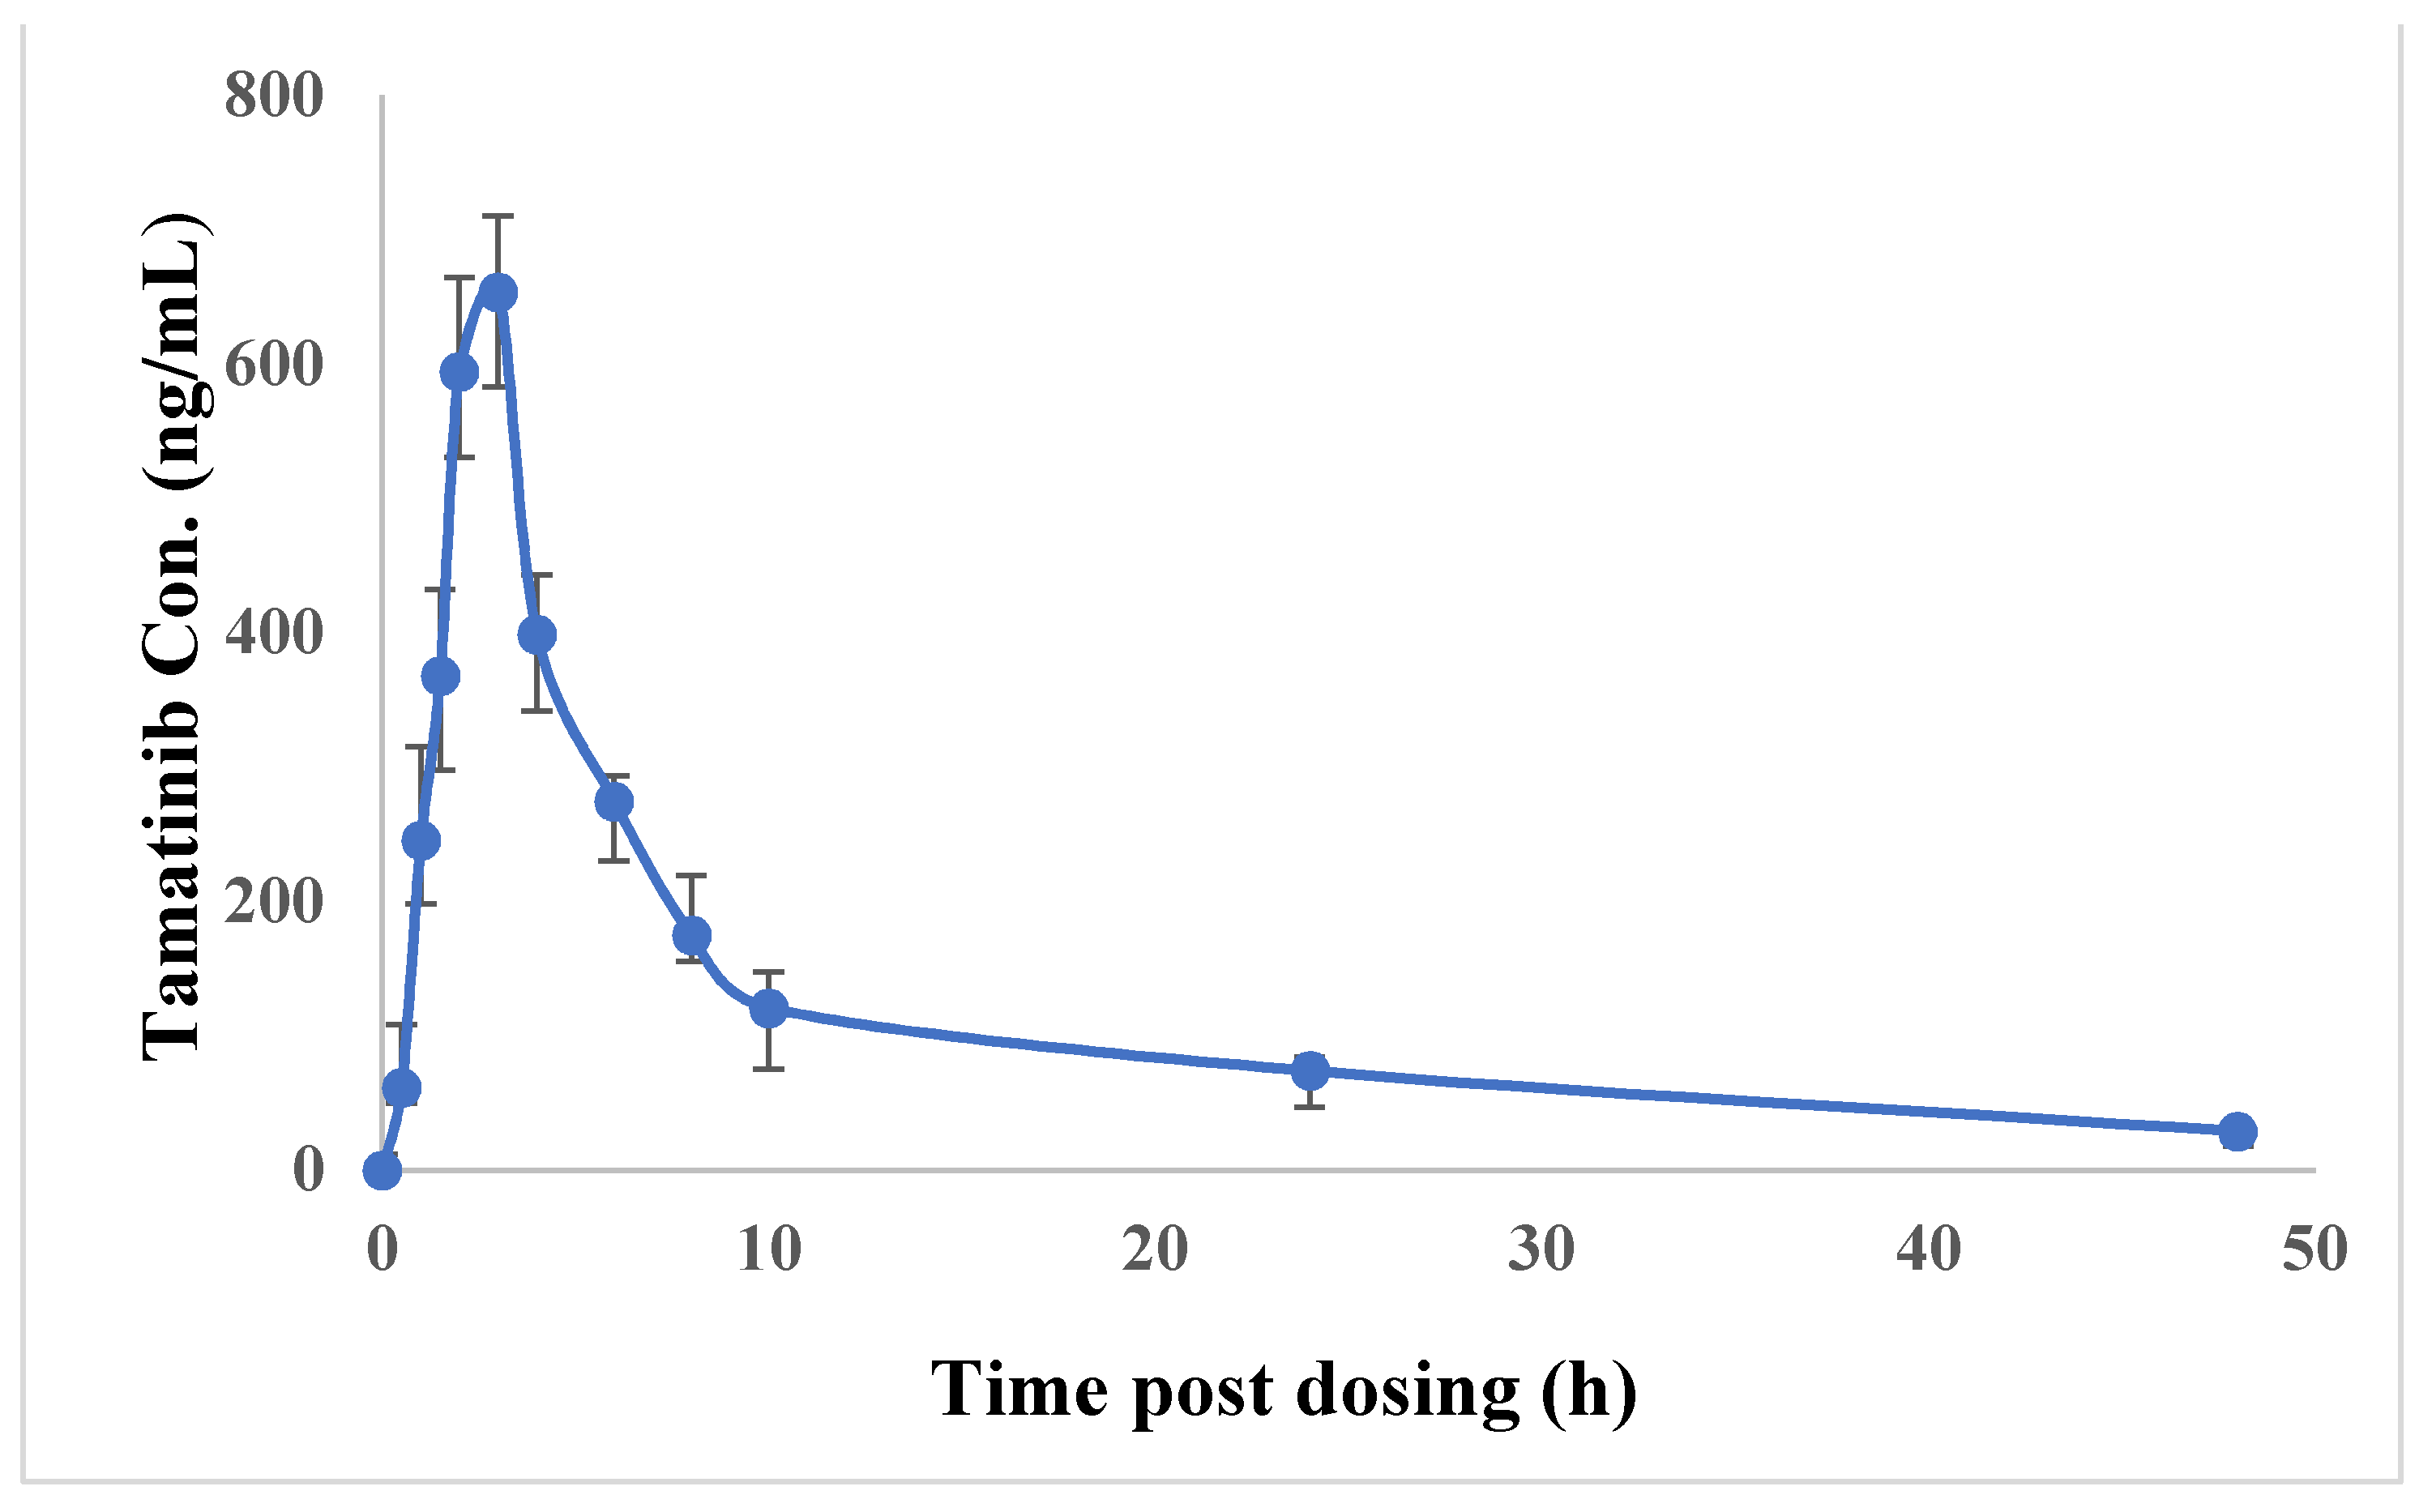
2.4. Application to a Pha Rmacokinetic Study
In pharmacokinetic and clinical studies, fostamatinib was assessed by tamatinib plasma concentrations because the concentration of fostamatinib is low as it is rapidly metabolized to tamatinib [
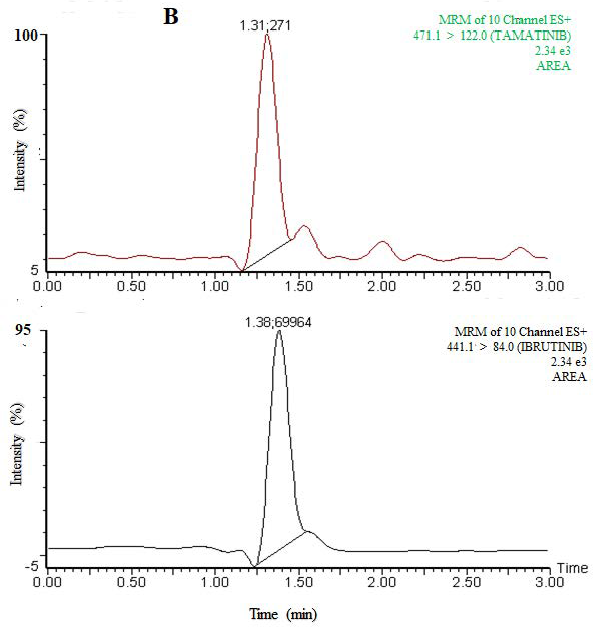
11]. The method was successfully applied to study pharmacokinetics of tamatinib in rats (
Figure 4). The average of tamatinib maximum plasma concentration (C
max) was 653.25 ± 70.4 ng/mL and the corresponding time to reach C
max (t
max) was 3.0 h. The mean area under the time–concentration curve from 0 to 48 h (AUC
0–48h) was 5644.4 ± 1213.6 ng/mL and AUC
0-inf was 6418.5 ± 1495.7 ng/mL. Median residence time (MRT) was 19.77 ± 2.9 h and half-life (t
1/2) was 18.33 ± 0.9 h. (
Table 5,
Figure 5). Previously published tamatinib pharmacokinetics studies [
7,
8,
25] used some LC-MS/MS methods. However, these reports did not provide details about their validation methods including drug extraction and separation. Moreover, the sensitivity of our work exceeded the sensitivity in the reported analyses. The current method is characterized by high throughput reflecting short run times with a LLOQ of only 0.1 ng/mL. Moreover, the extraction procedure is simple and quantitative. The method will be advantageous for therapeutic drug monitoring.
2.5. Investigation of the Method Greenness
The proposed method fulfills the criteria of the greenness profile according to the emergency planning and community right-to-know act, 2004; Code of Federal Regulations, 2014. None of the used solvents are listed in the PBT list (persistent, bio-, accumulative, and toxic) [
26] and are not corrosive, not a hazard. The amount of waste is less than 50 g per sample [
27].
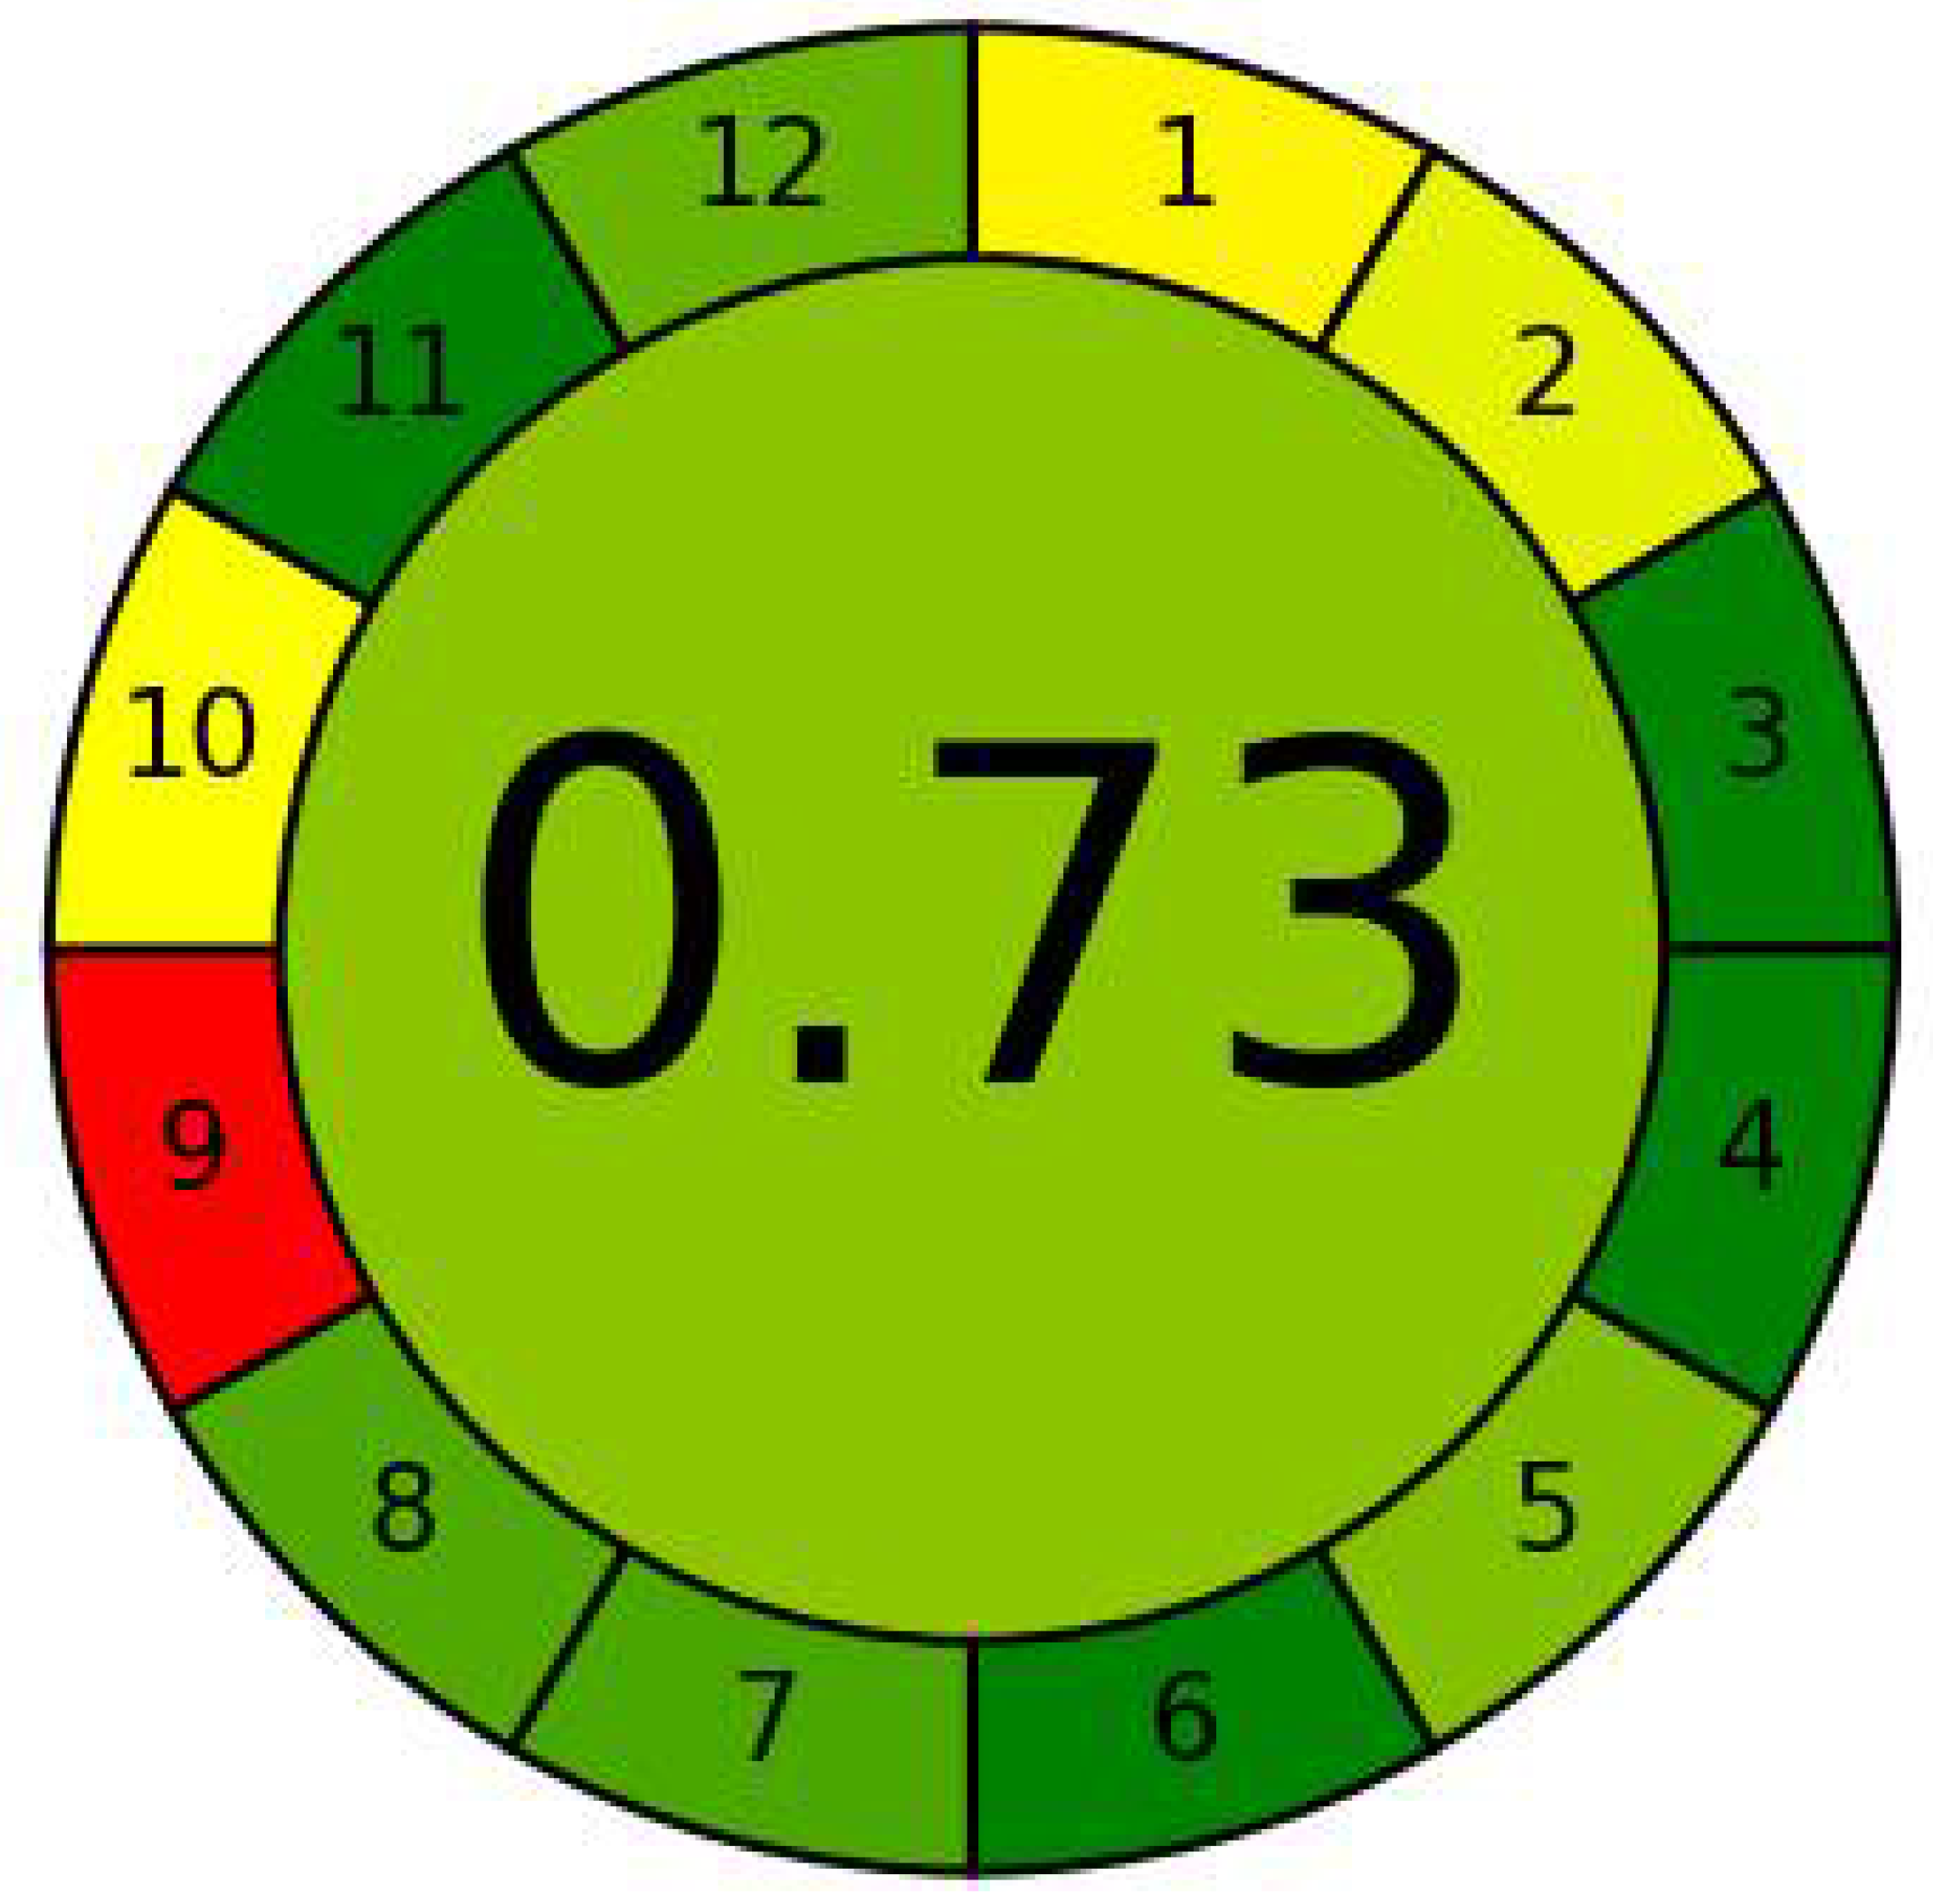
The greenness of the analytical method was evaluated using the AGREE green program as well as an analytical eco-scale. The AGREE green program provides information on the whole procedure. The proposed method scored 0.73 point from 1.0, which indicated that the method was good from the ecological point of view (
Figure 6). Application of the analytical eco-scale indicated that the proposed method acquired 82 points from 100 (
Table 6,
Figure S1), and an analytical eco-scale score of more than 50 points represents an good result of green analysis [
28].


 ,
, 


