
Enhancing the Decolorization of Methylene Blue Using a Low-Cost Super-Absorbent Aided by Response Surface Methodology

 ,
,  ,
,
Abstract
1. Introduction
2. Results
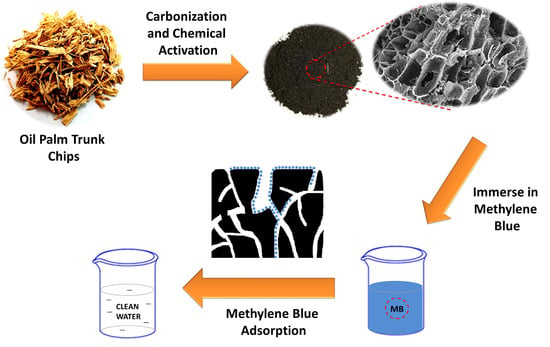
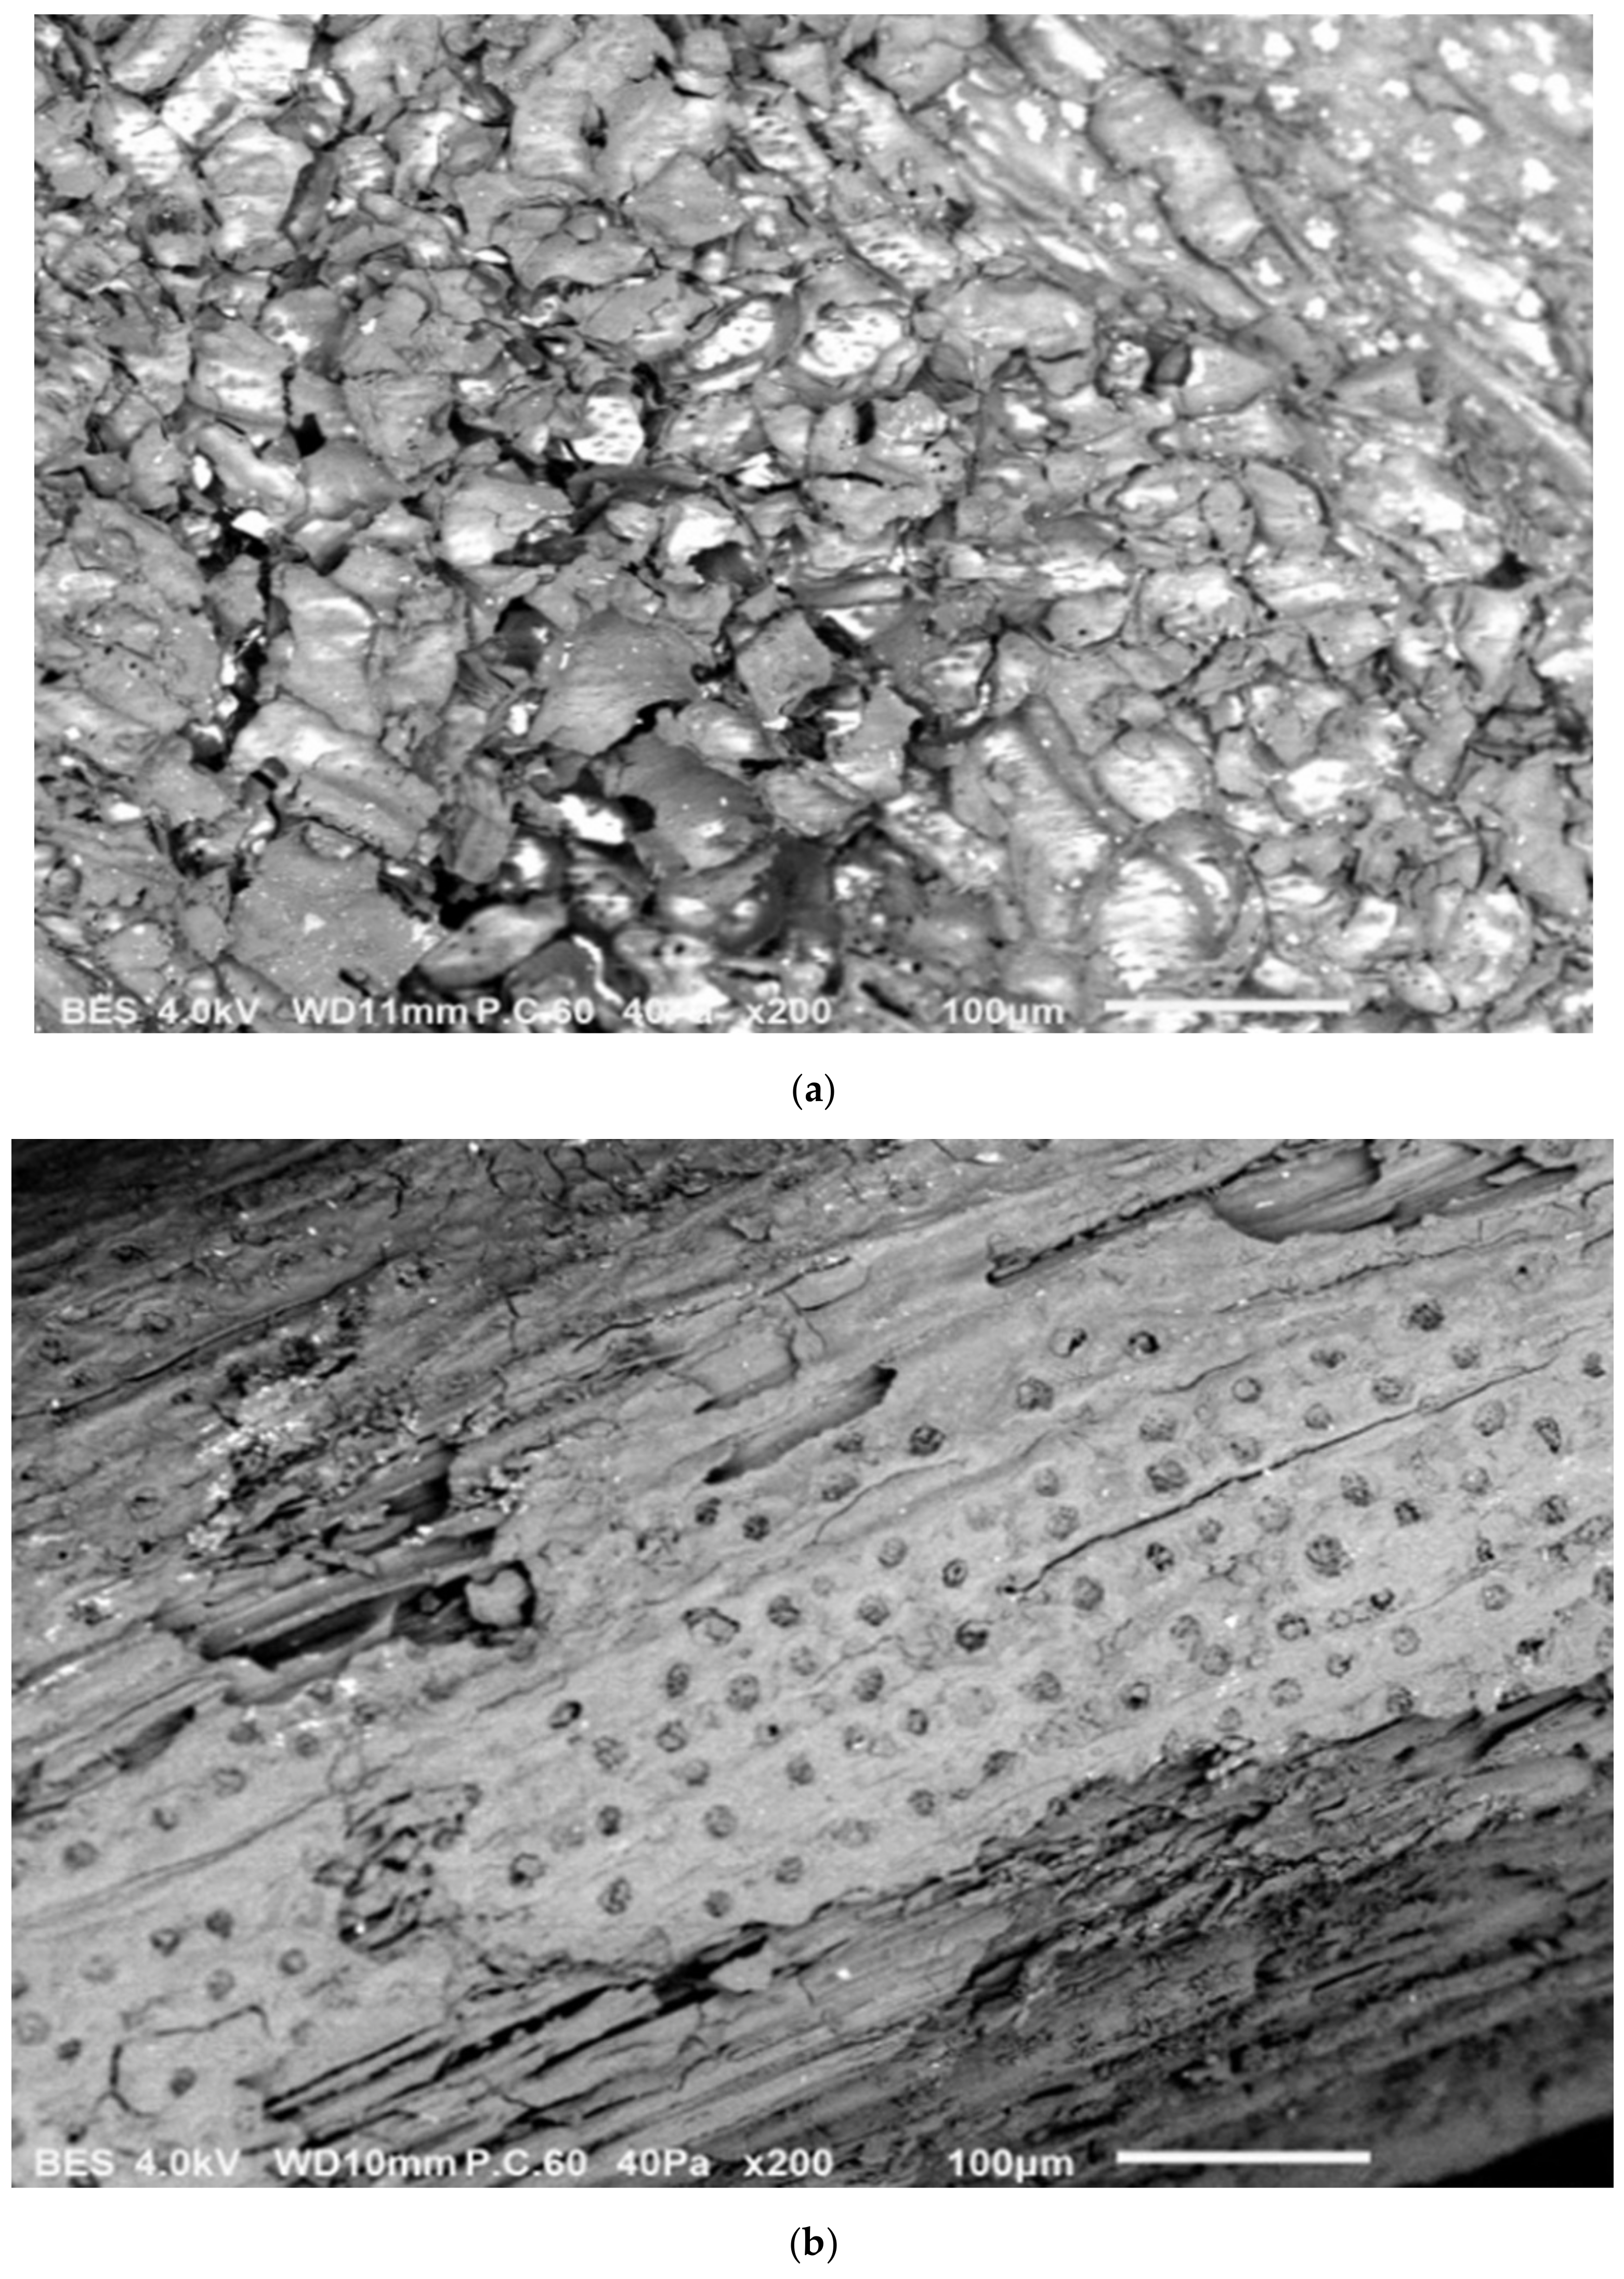
2.1. Characterization of OPTAC
2.1.1. Scanning Electron Microscopy
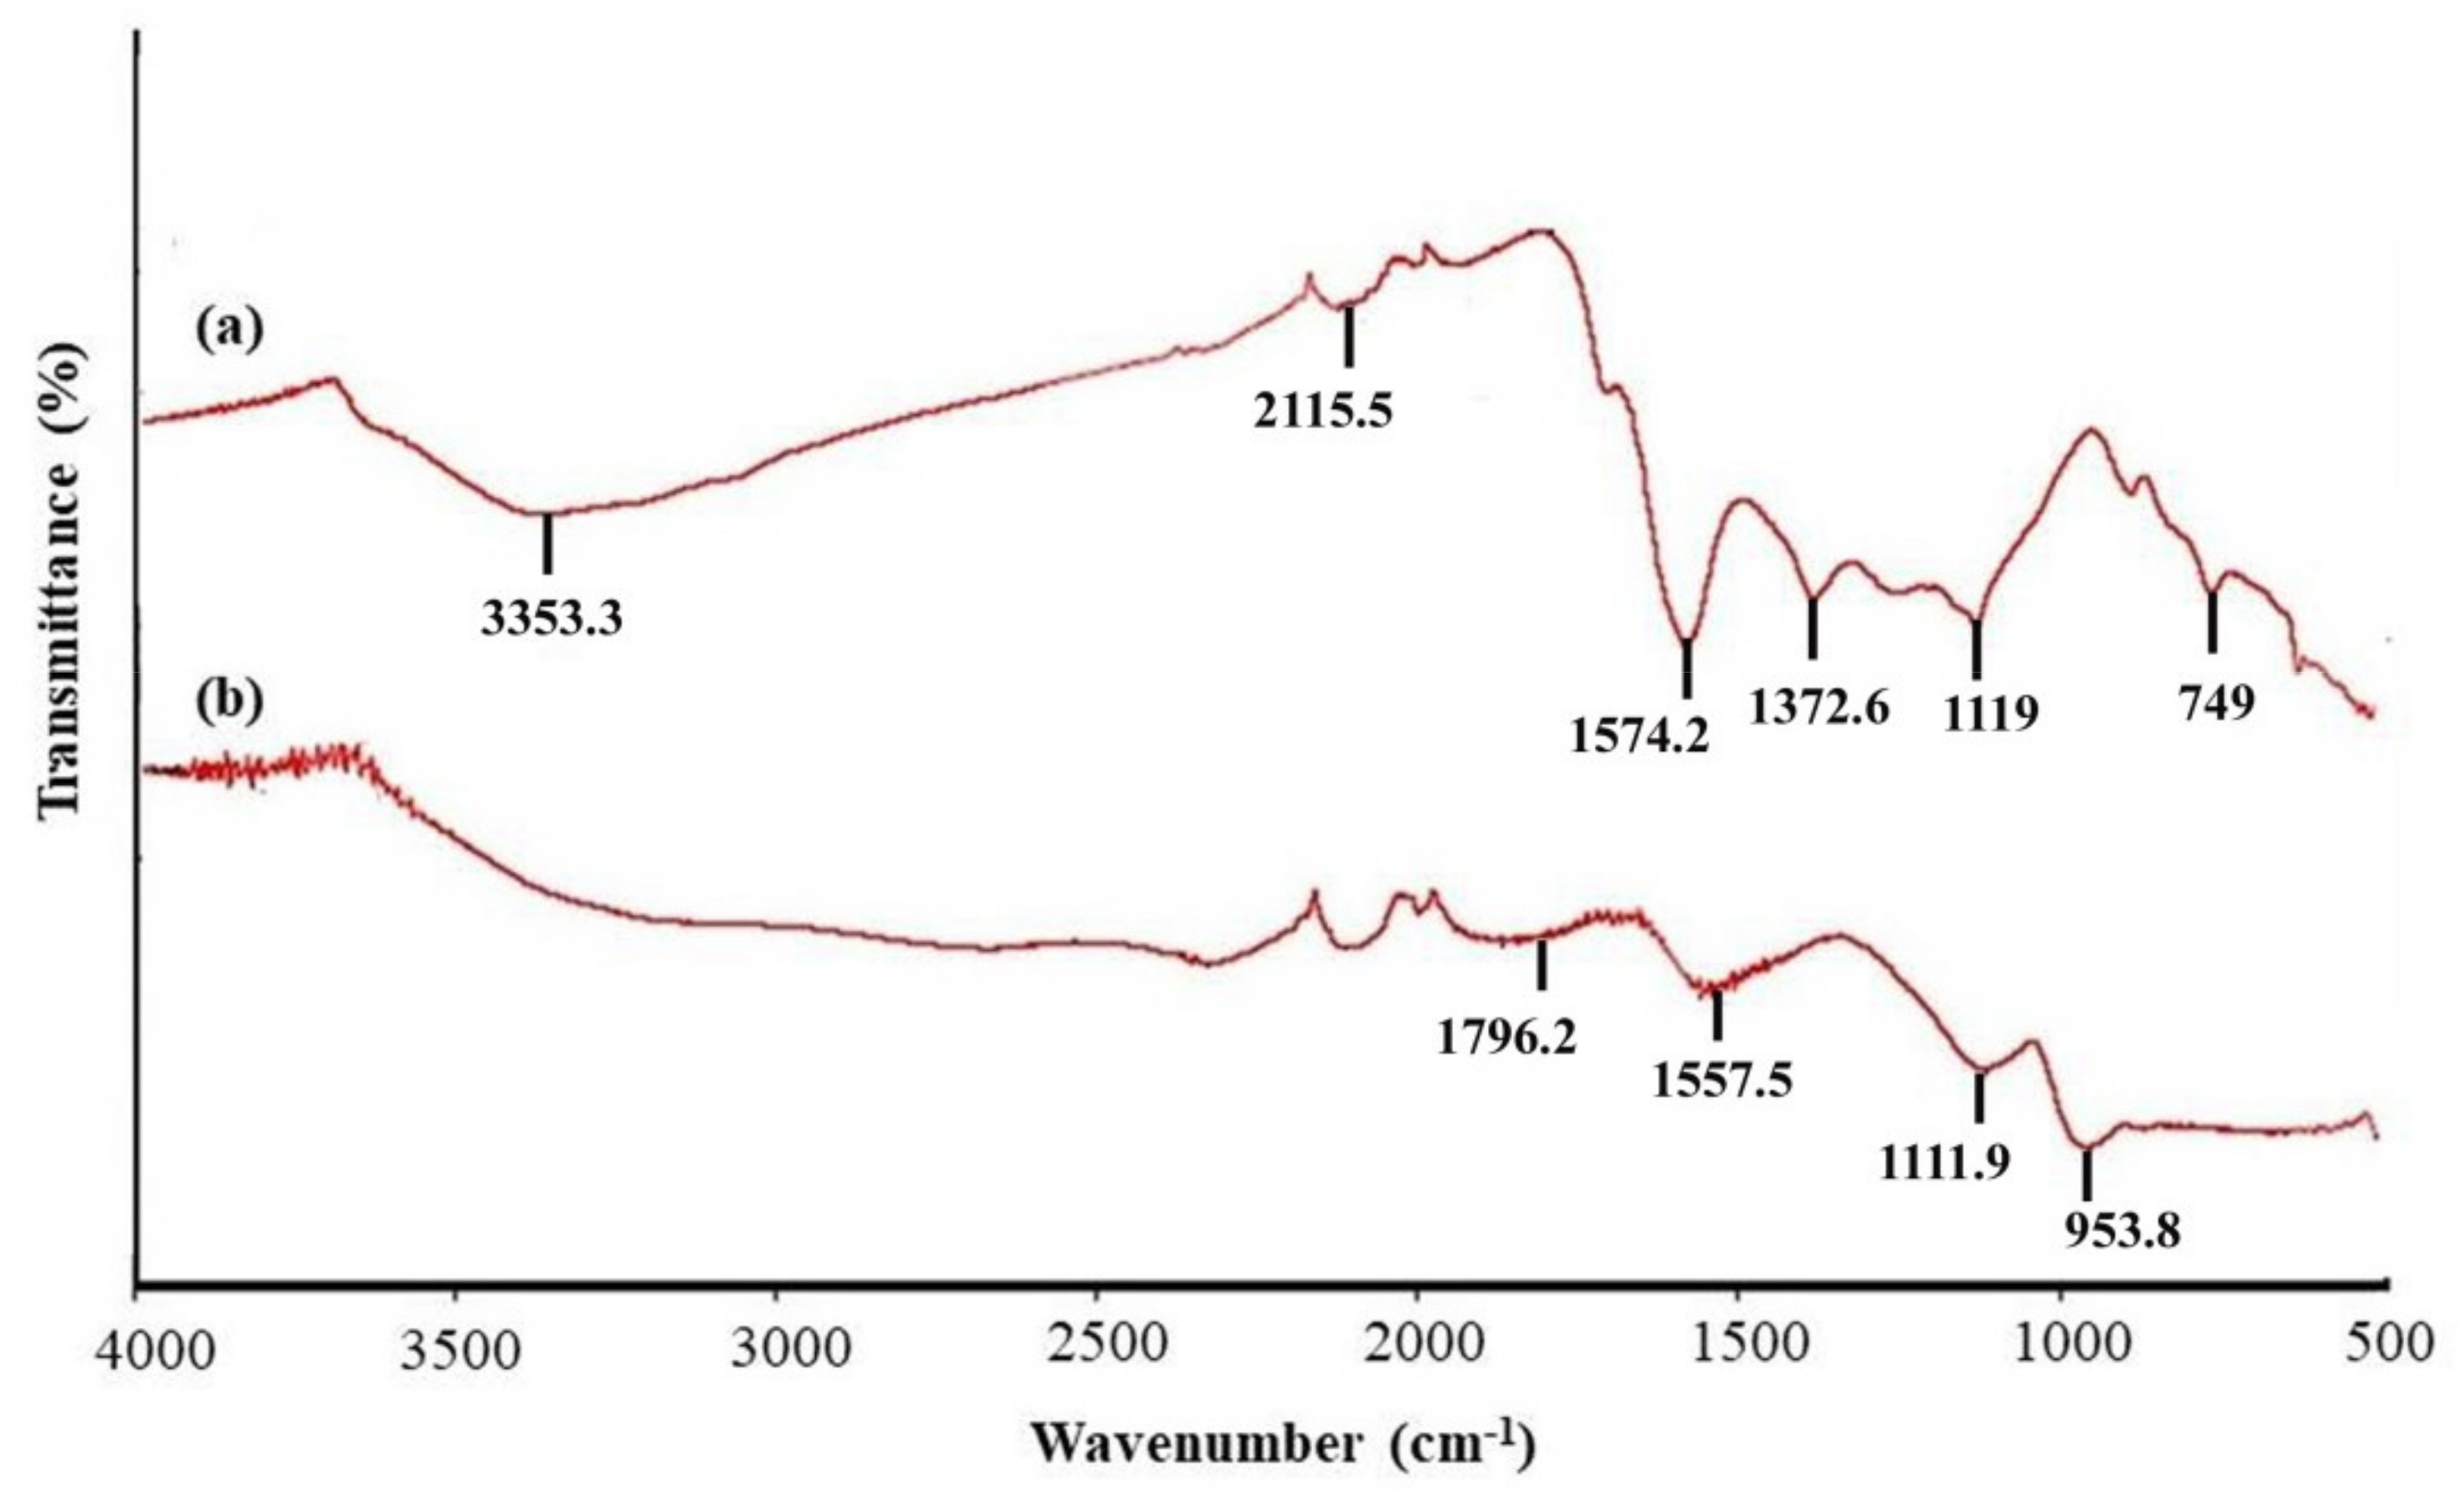
2.1.2. FTIR-ATR Spectra of OPTAC
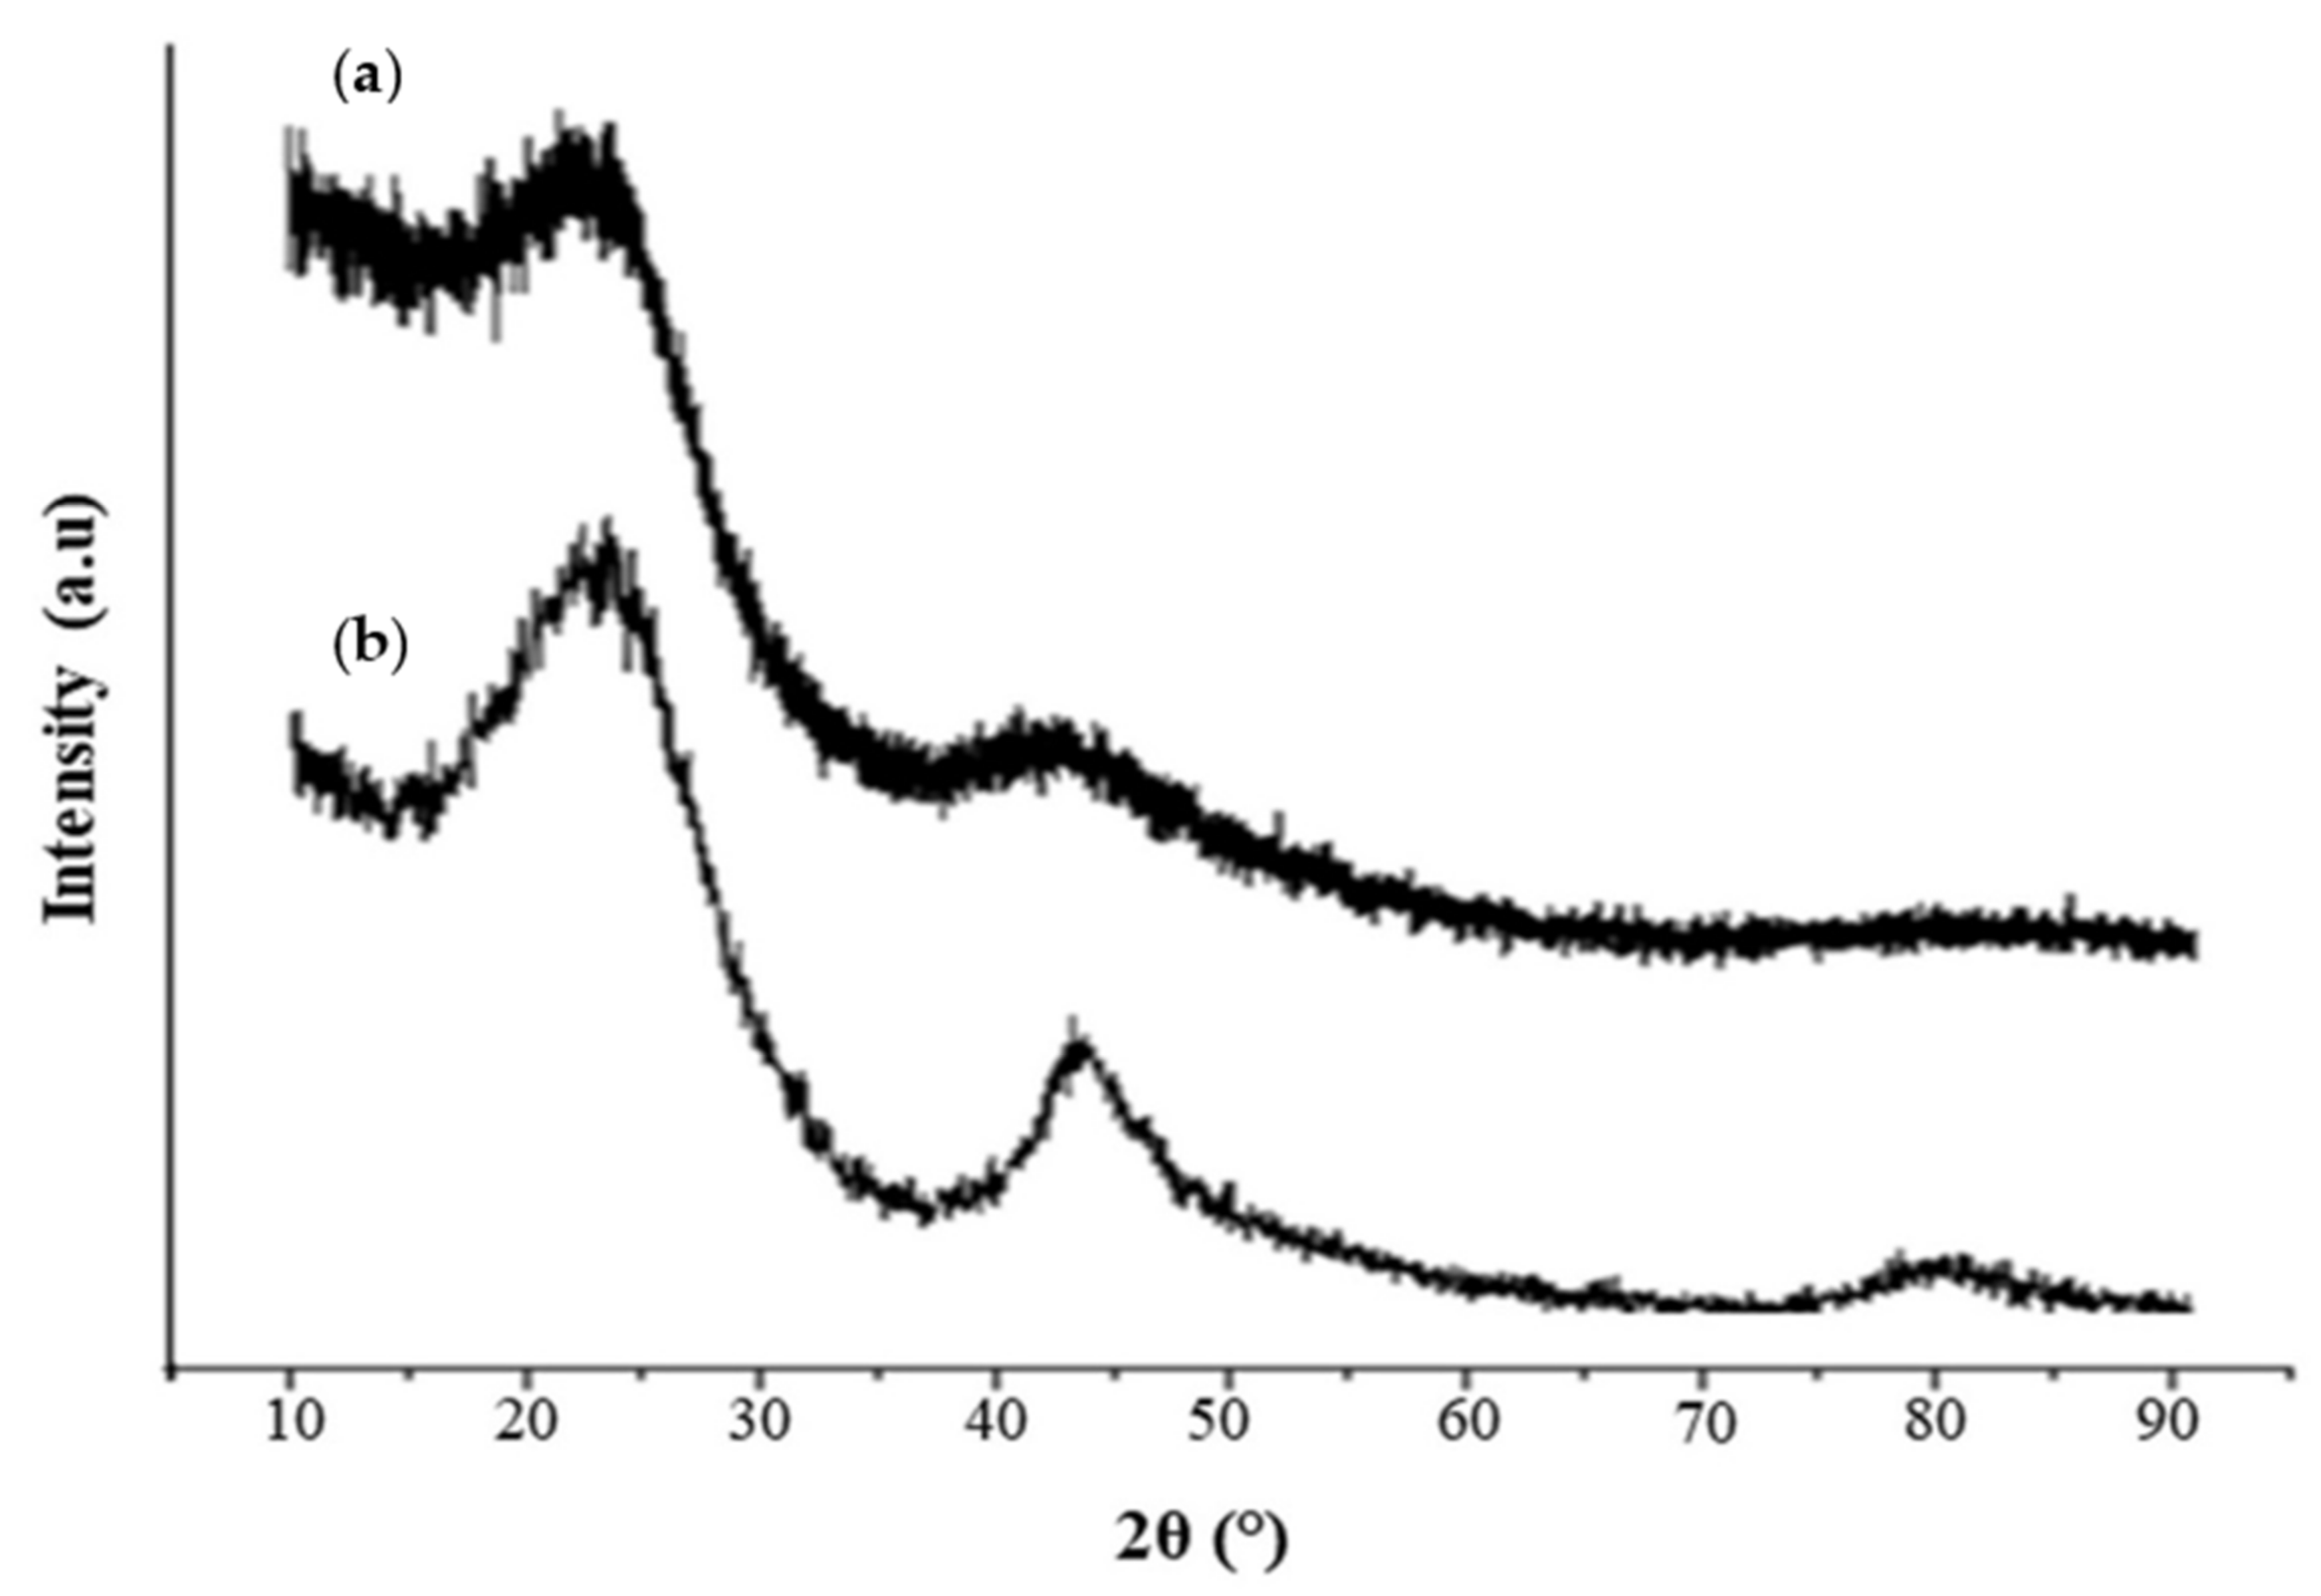
2.1.3. XRD of OPTAC
2.2. Response Surface Methodology–Box–Behnken Design
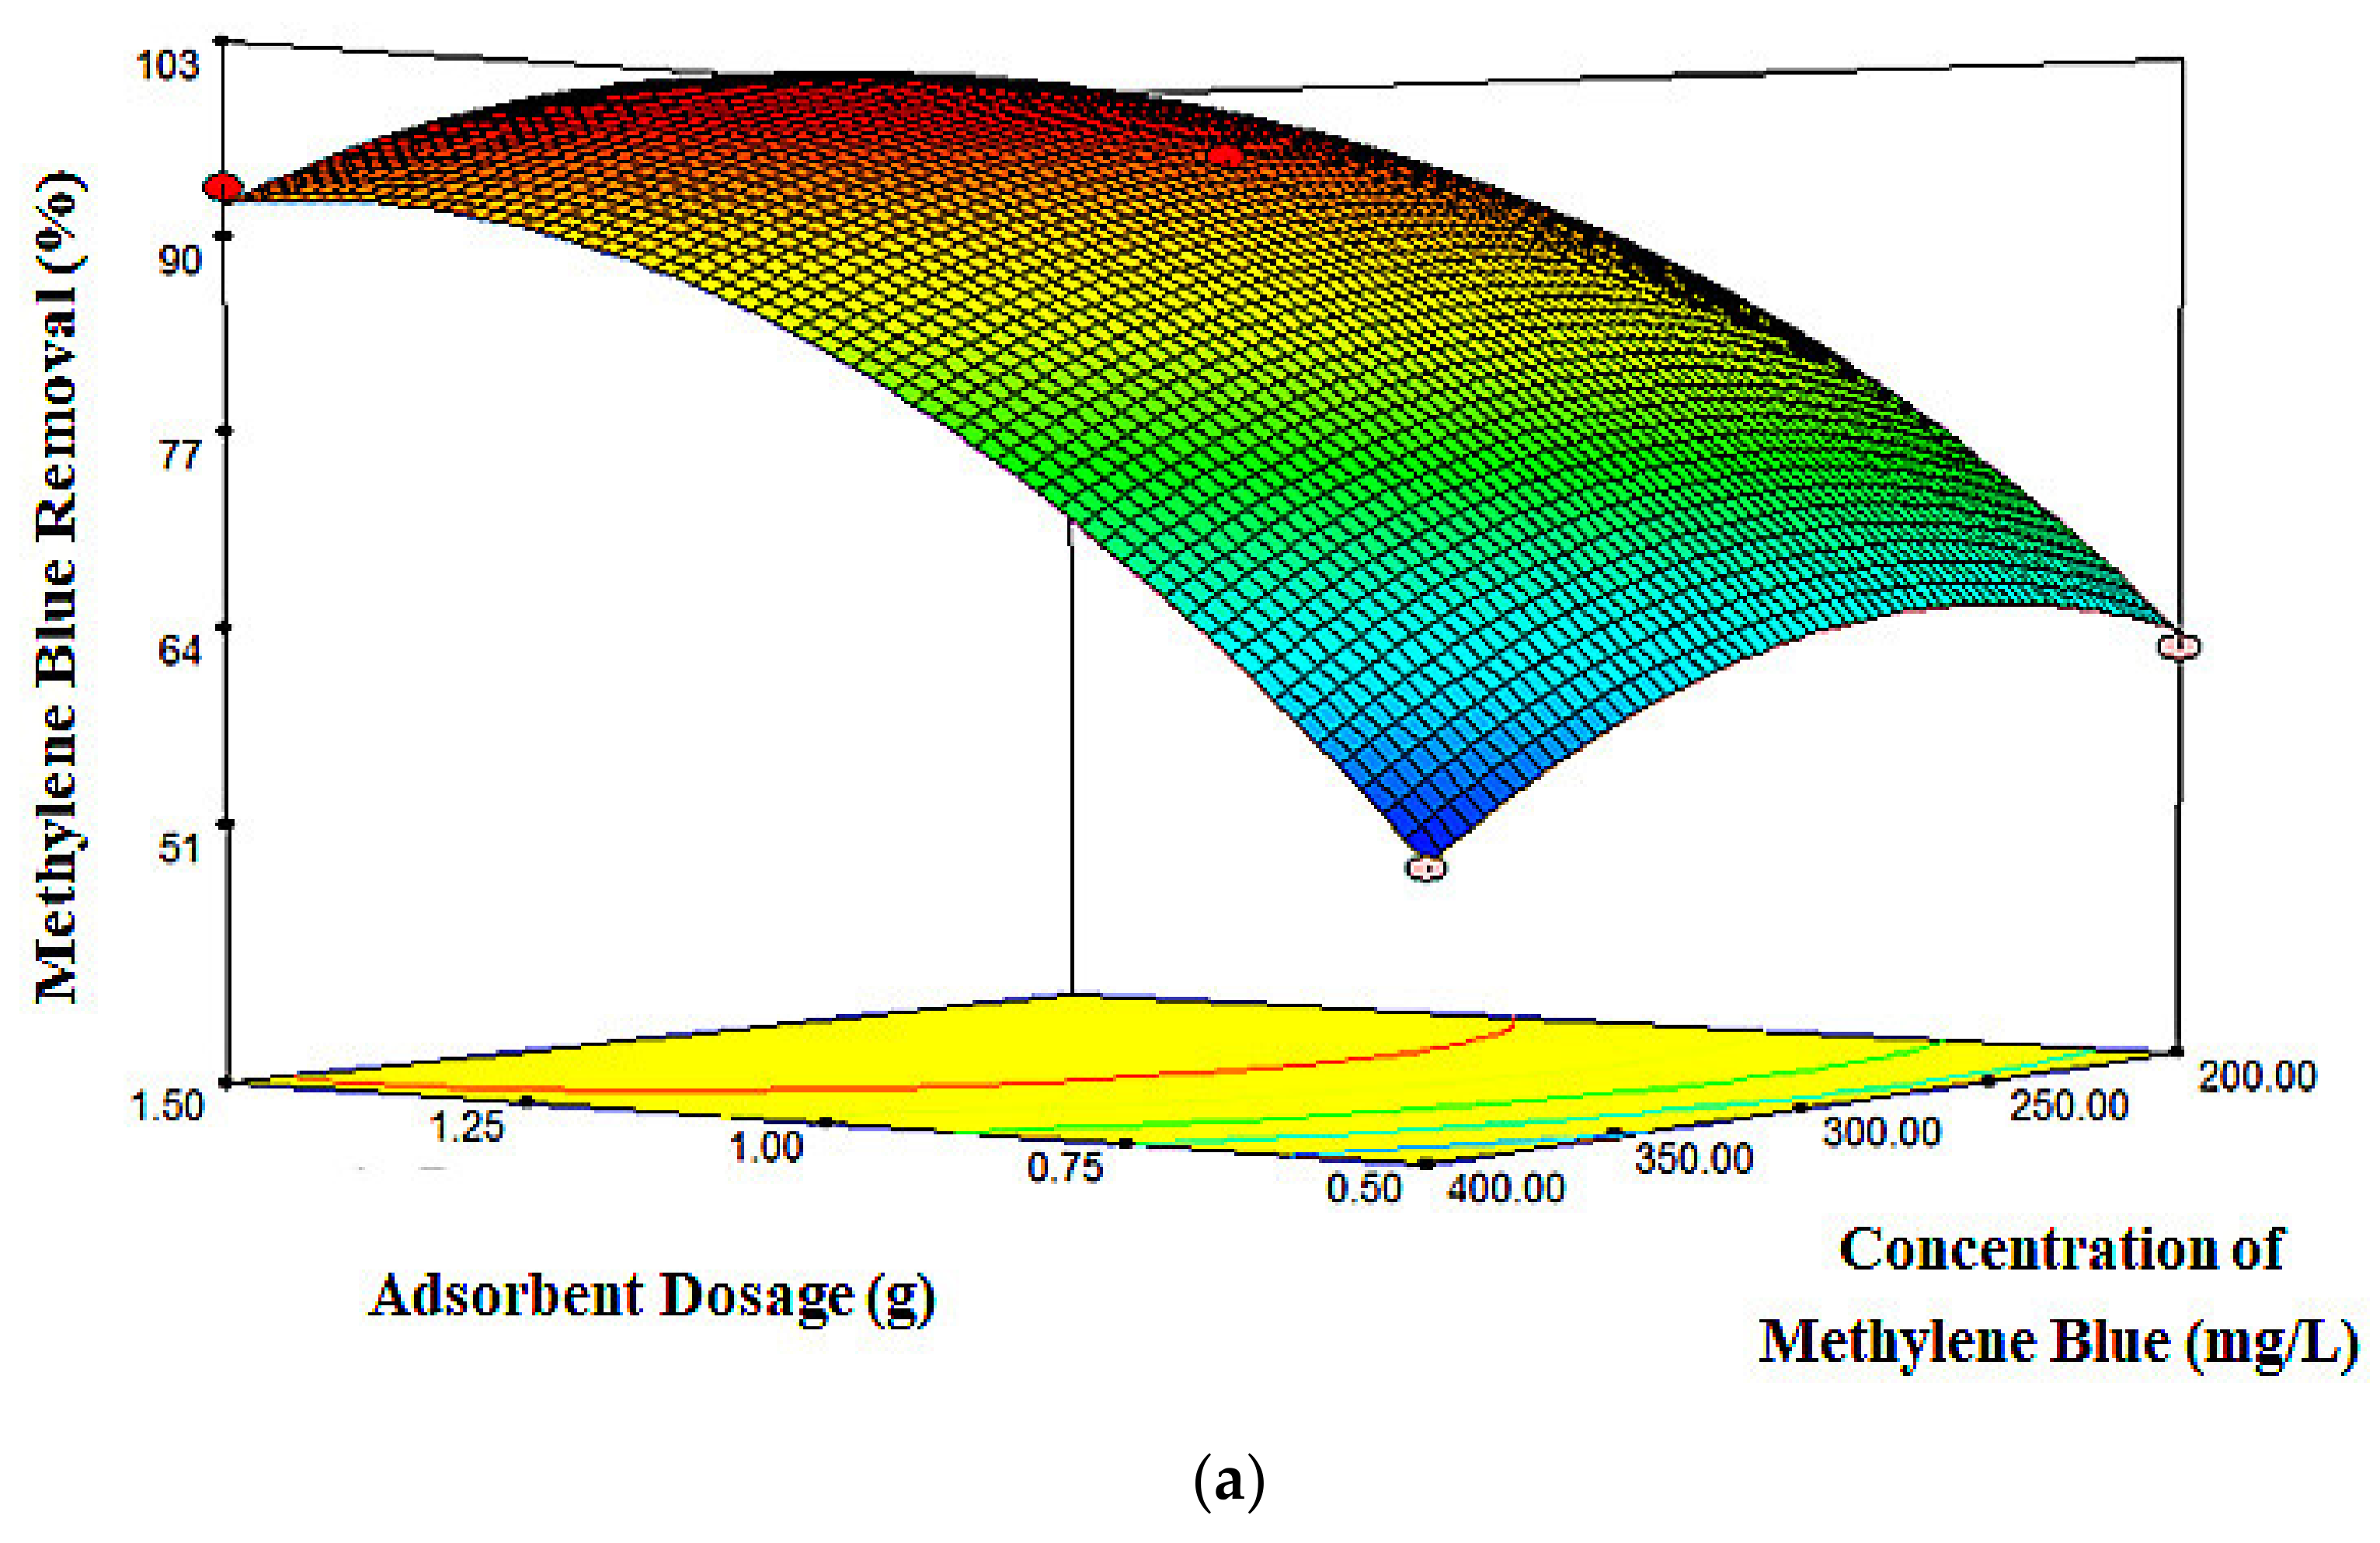
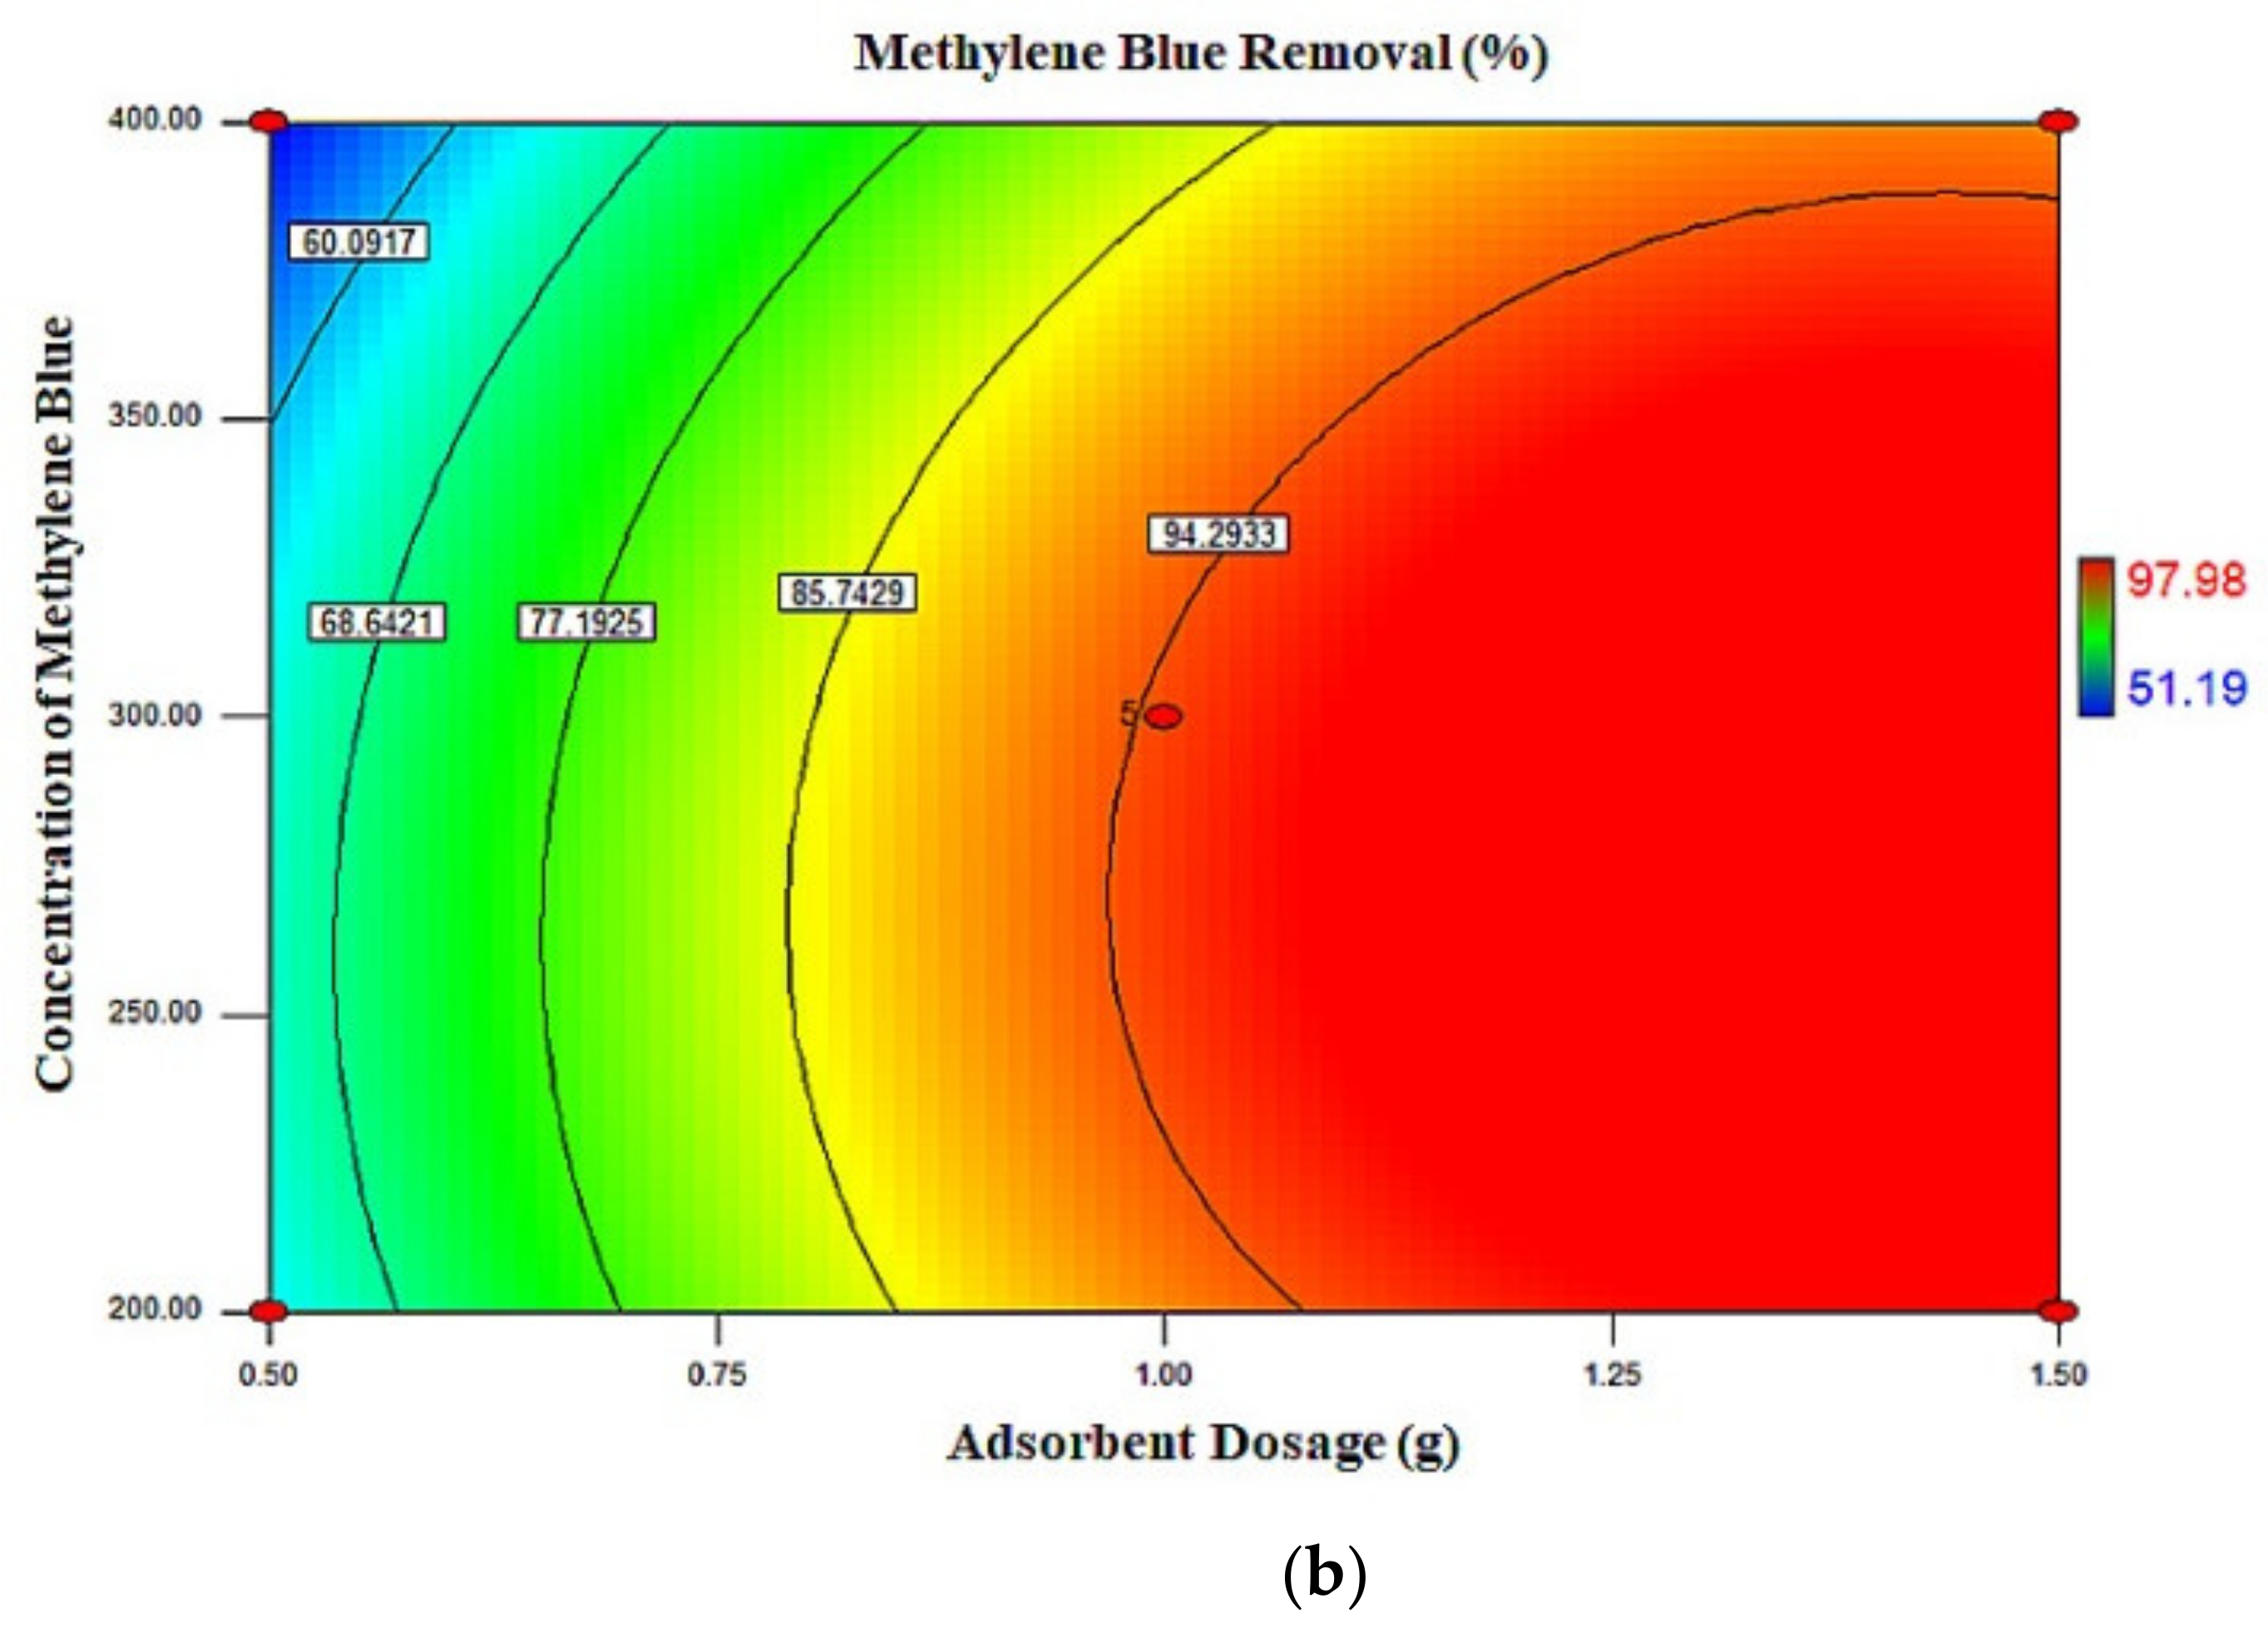
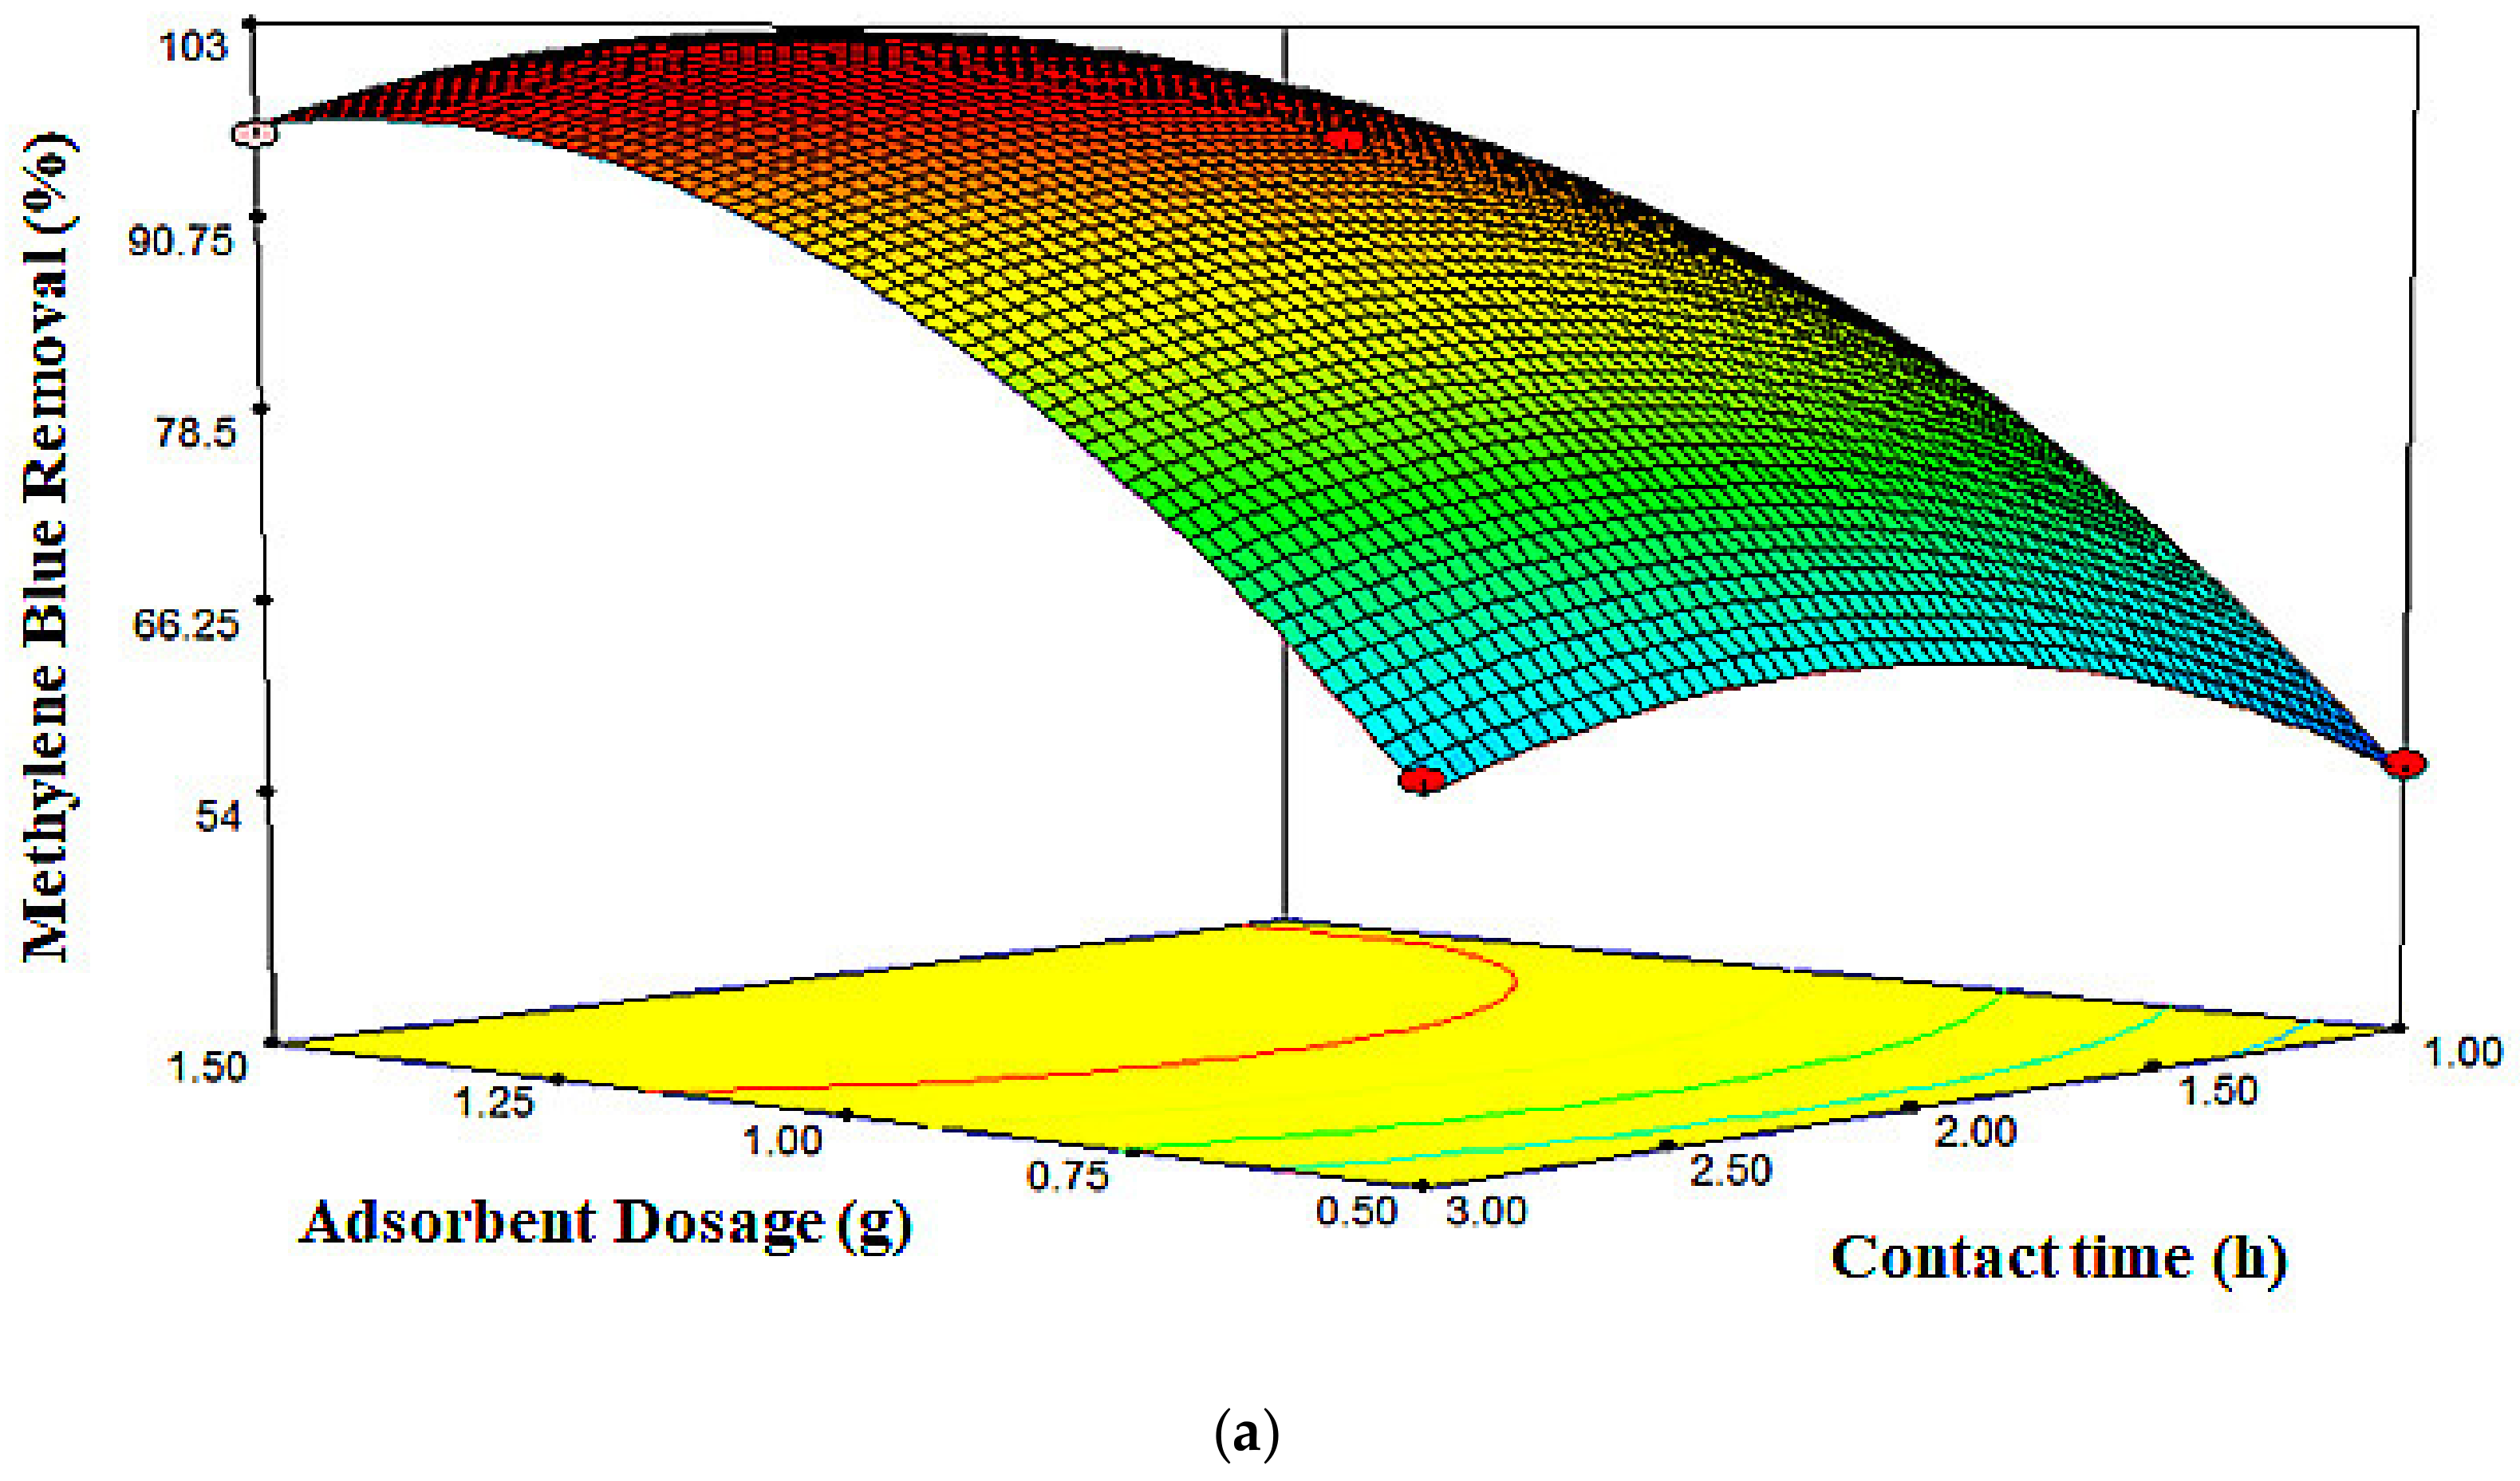
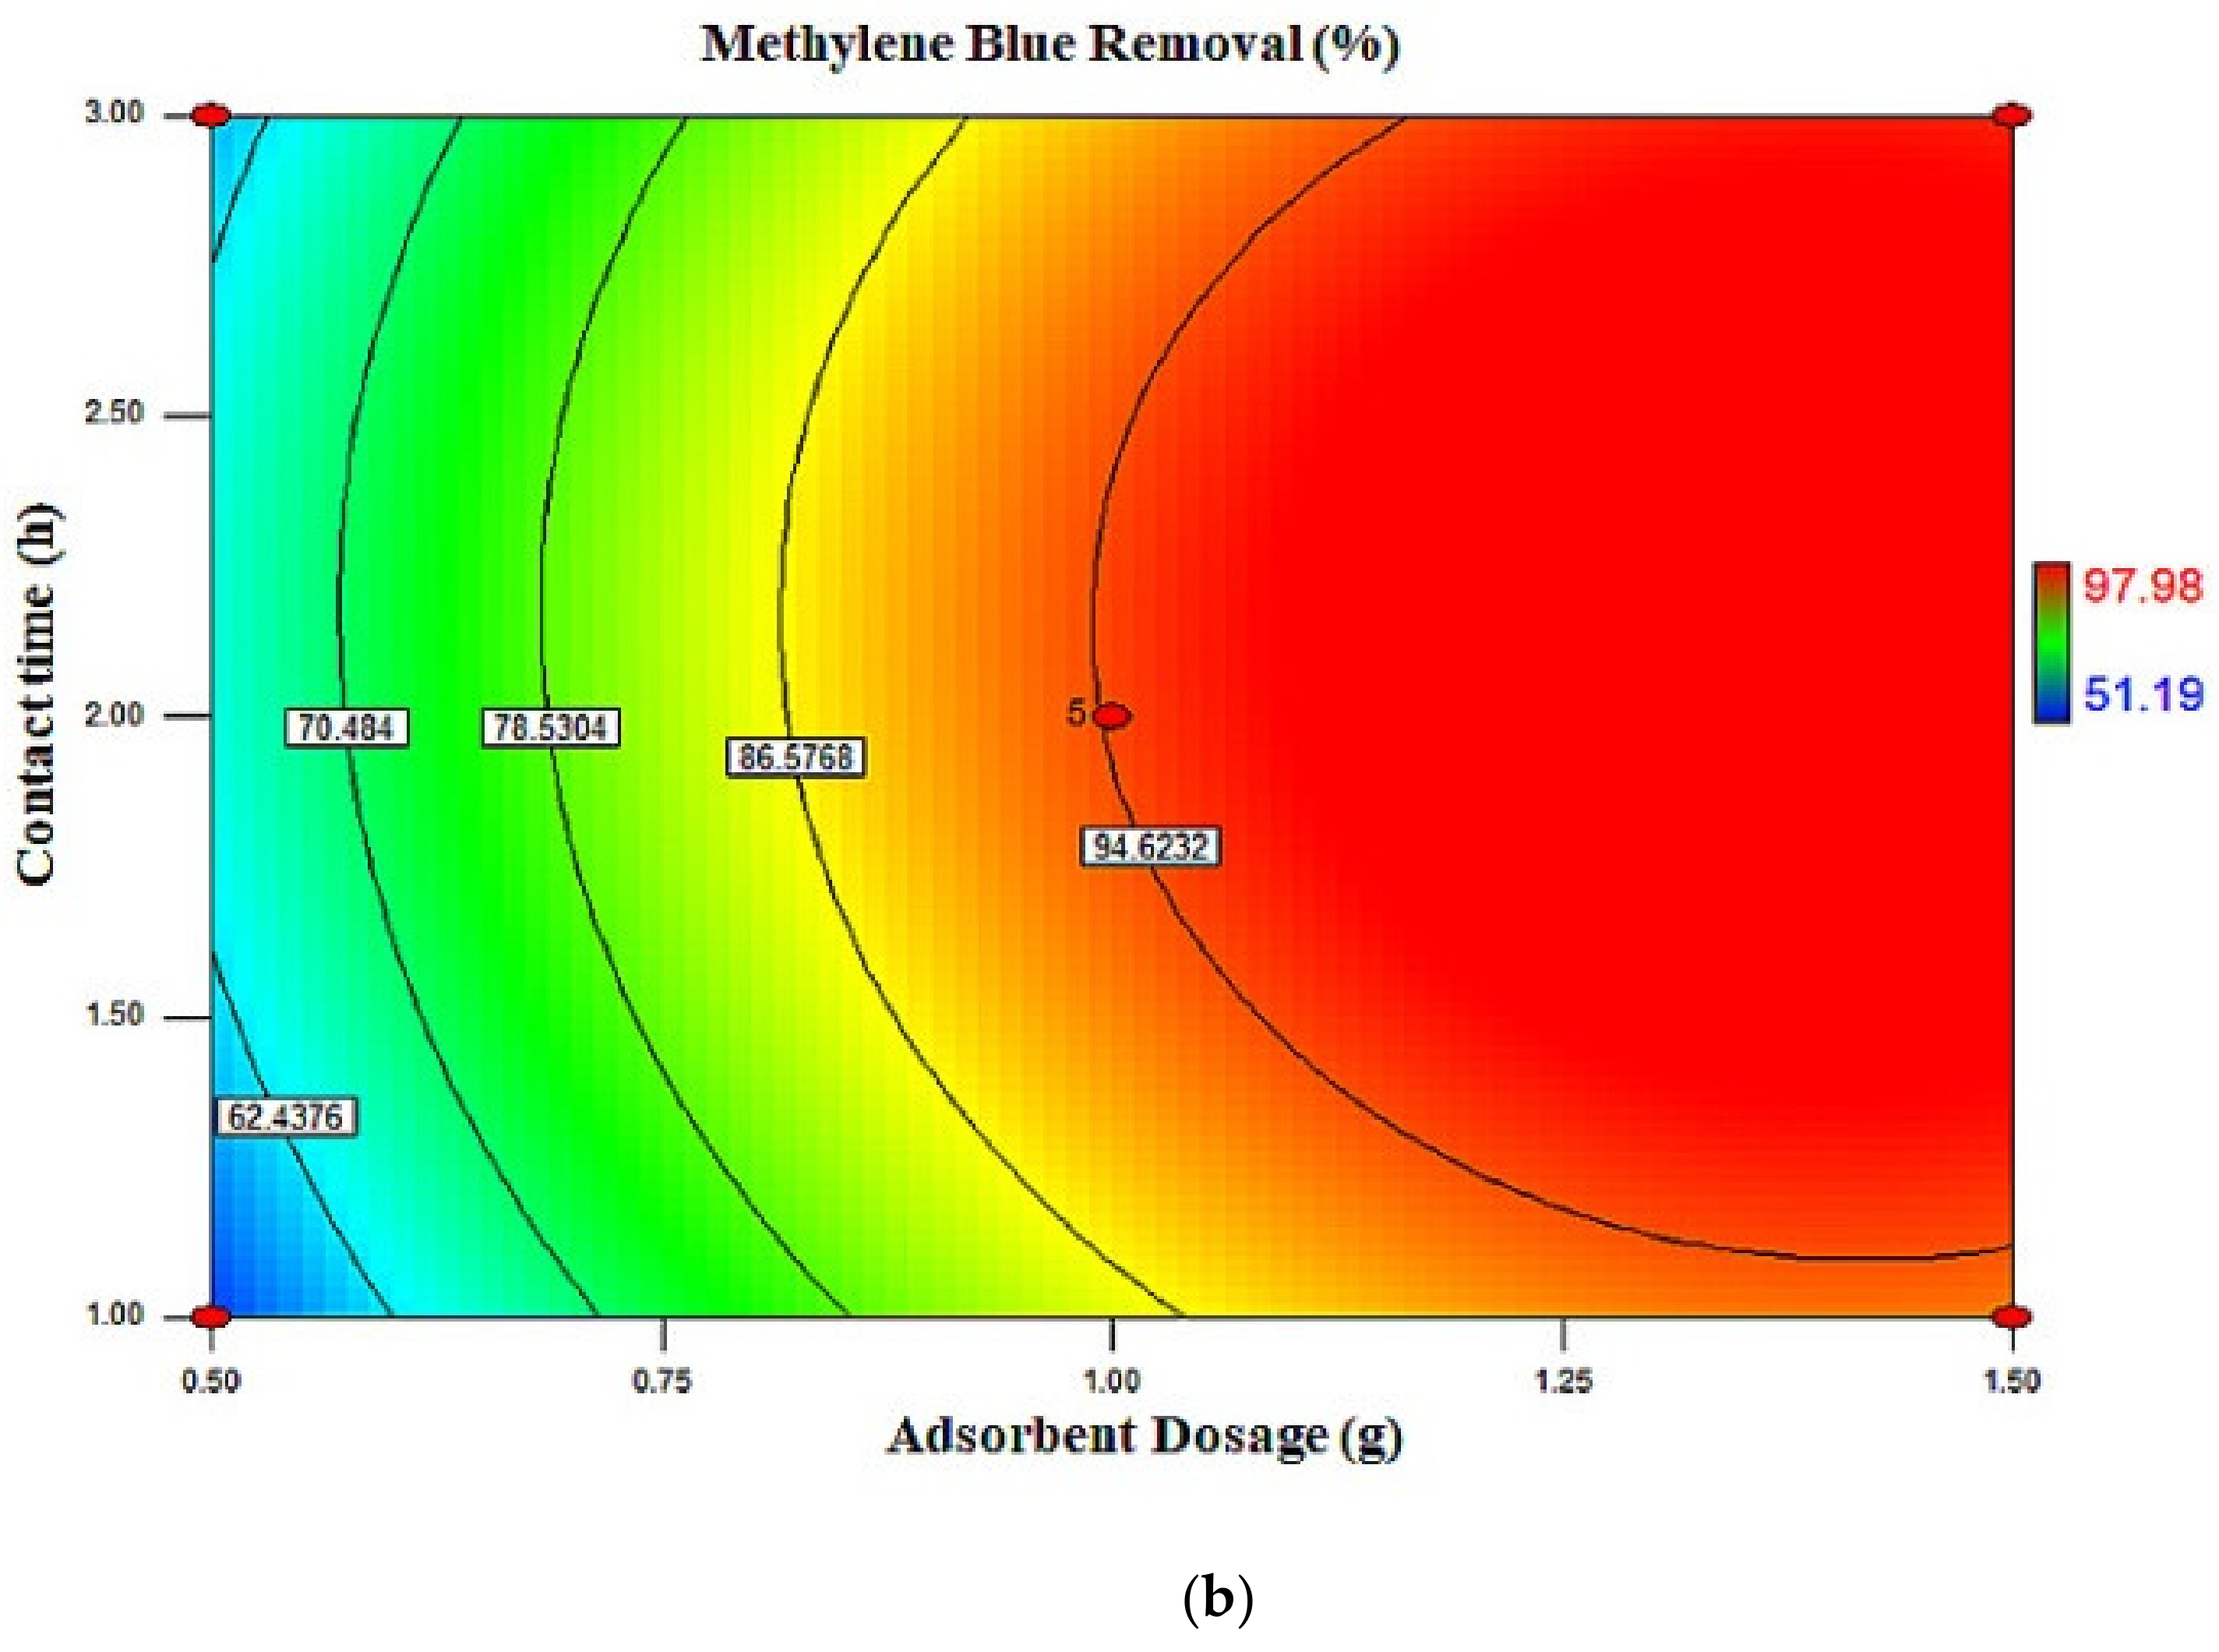
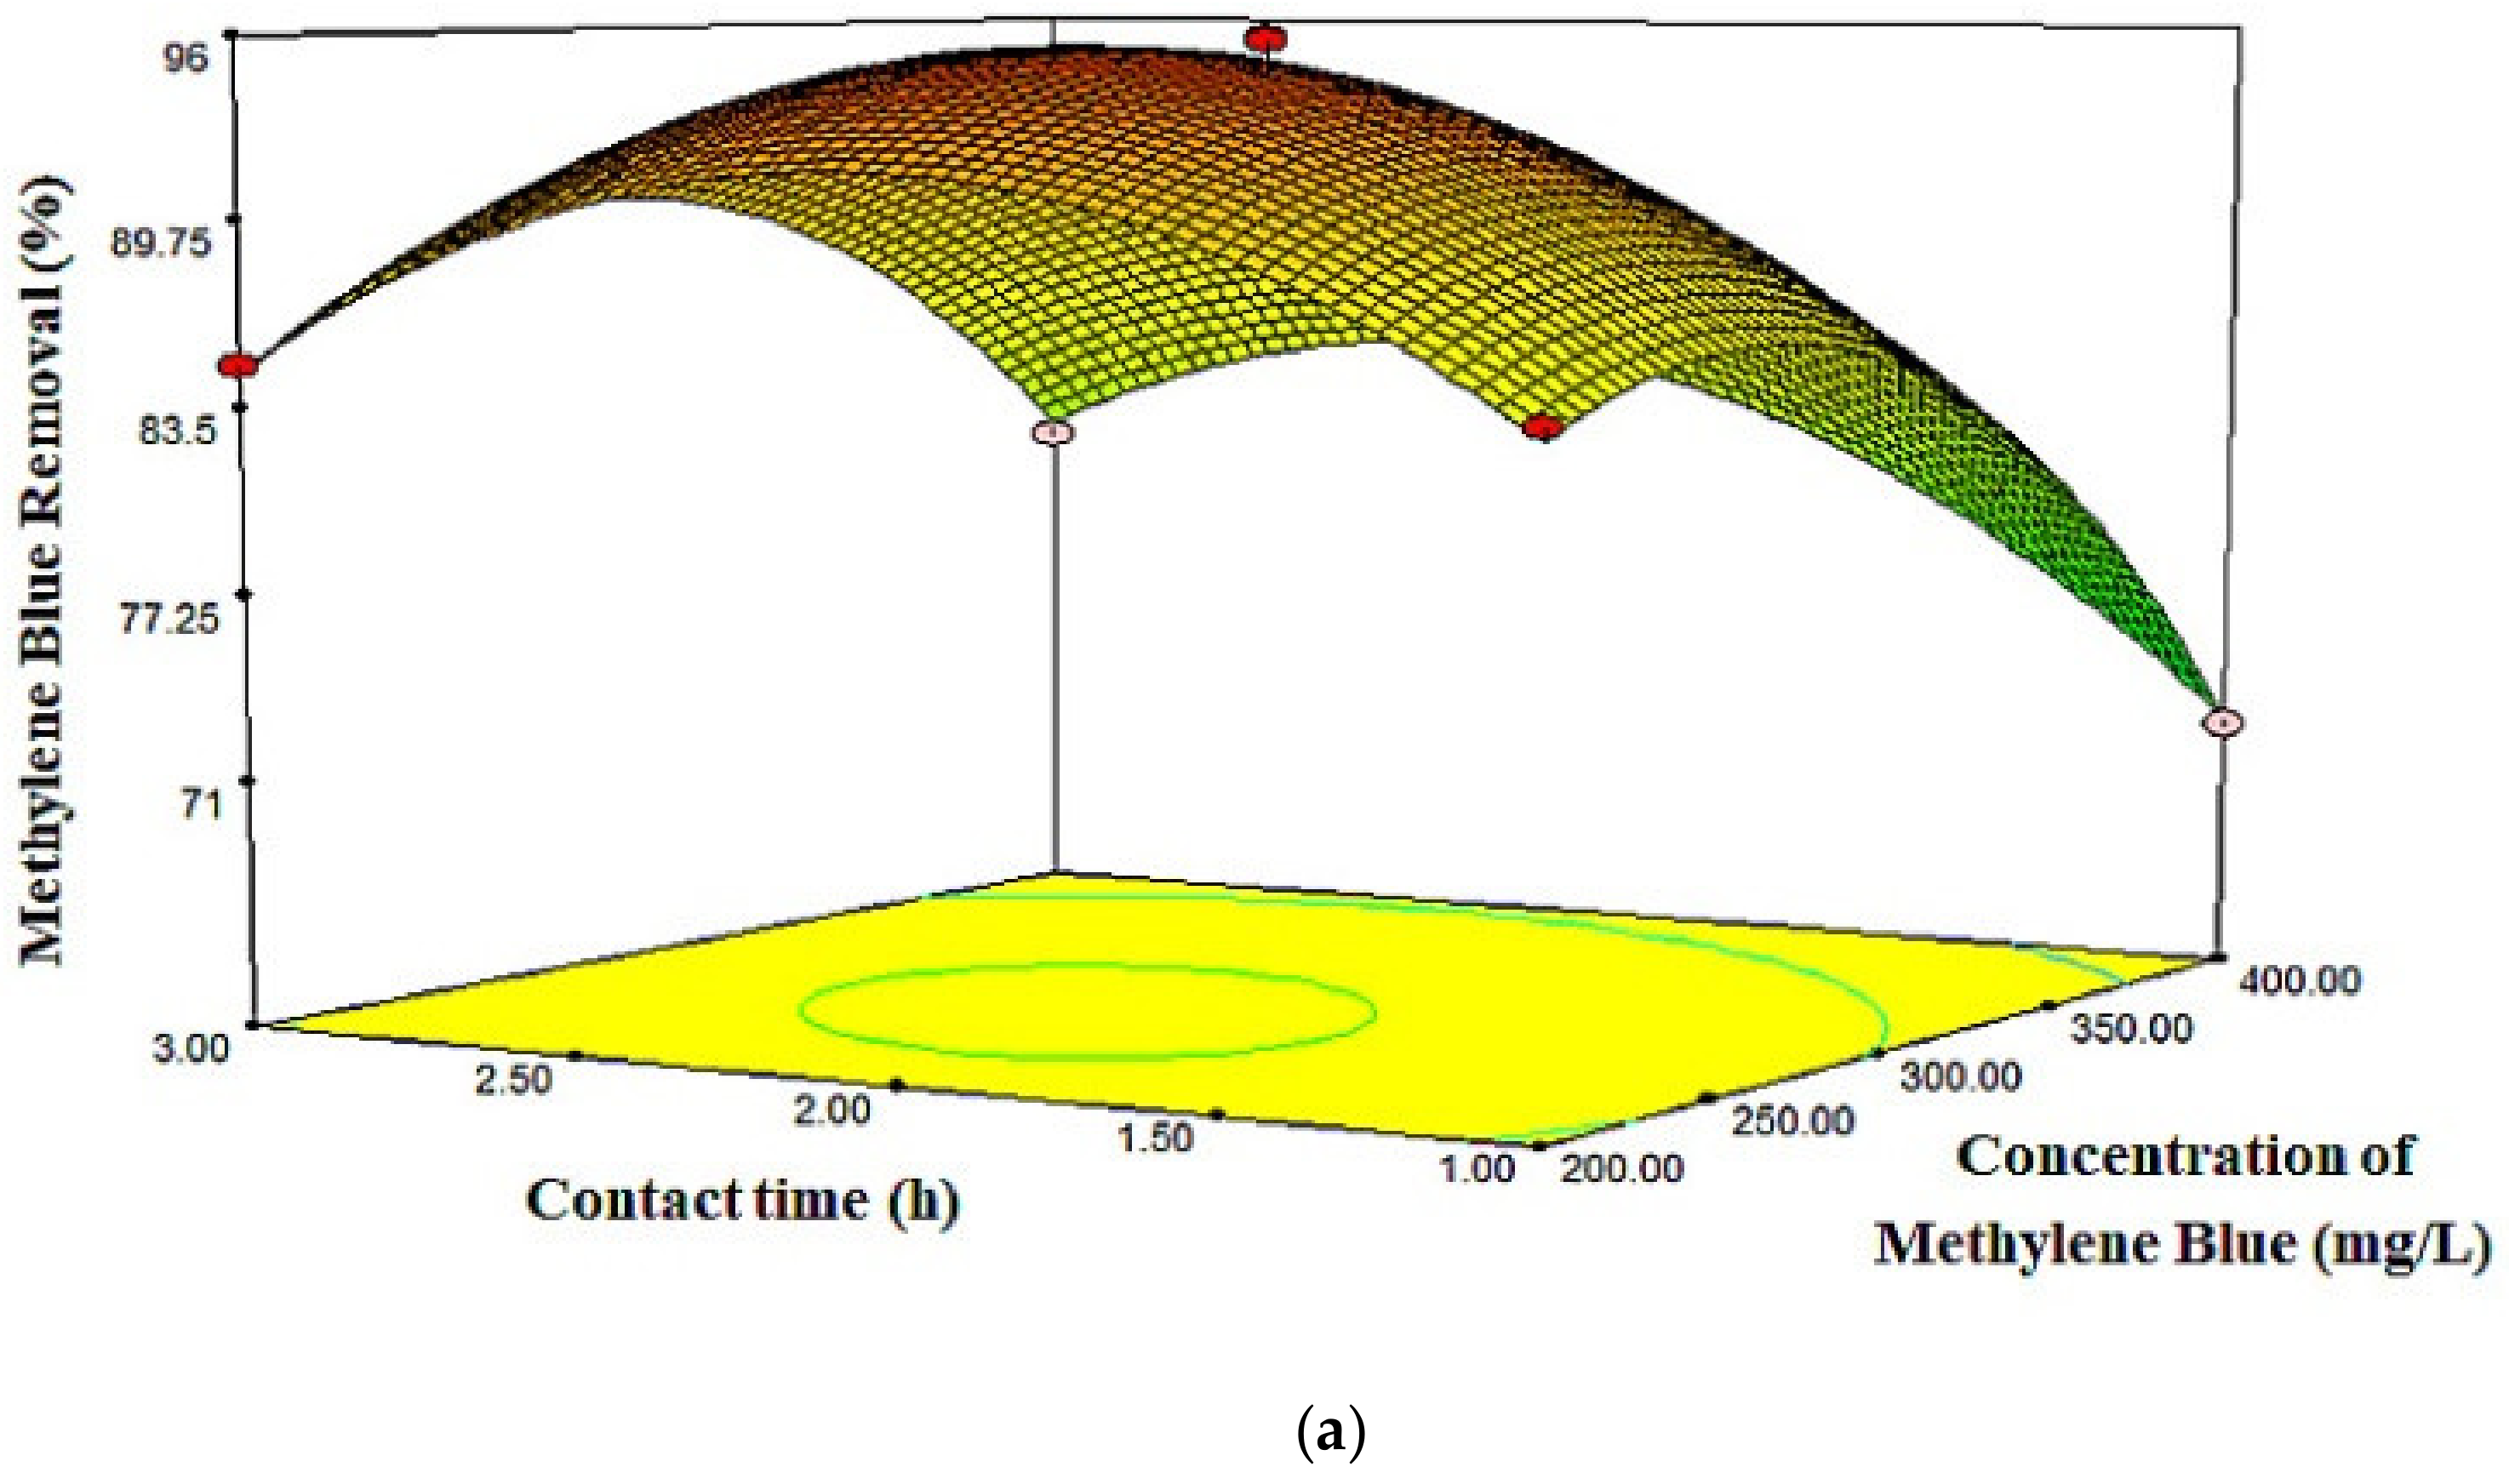
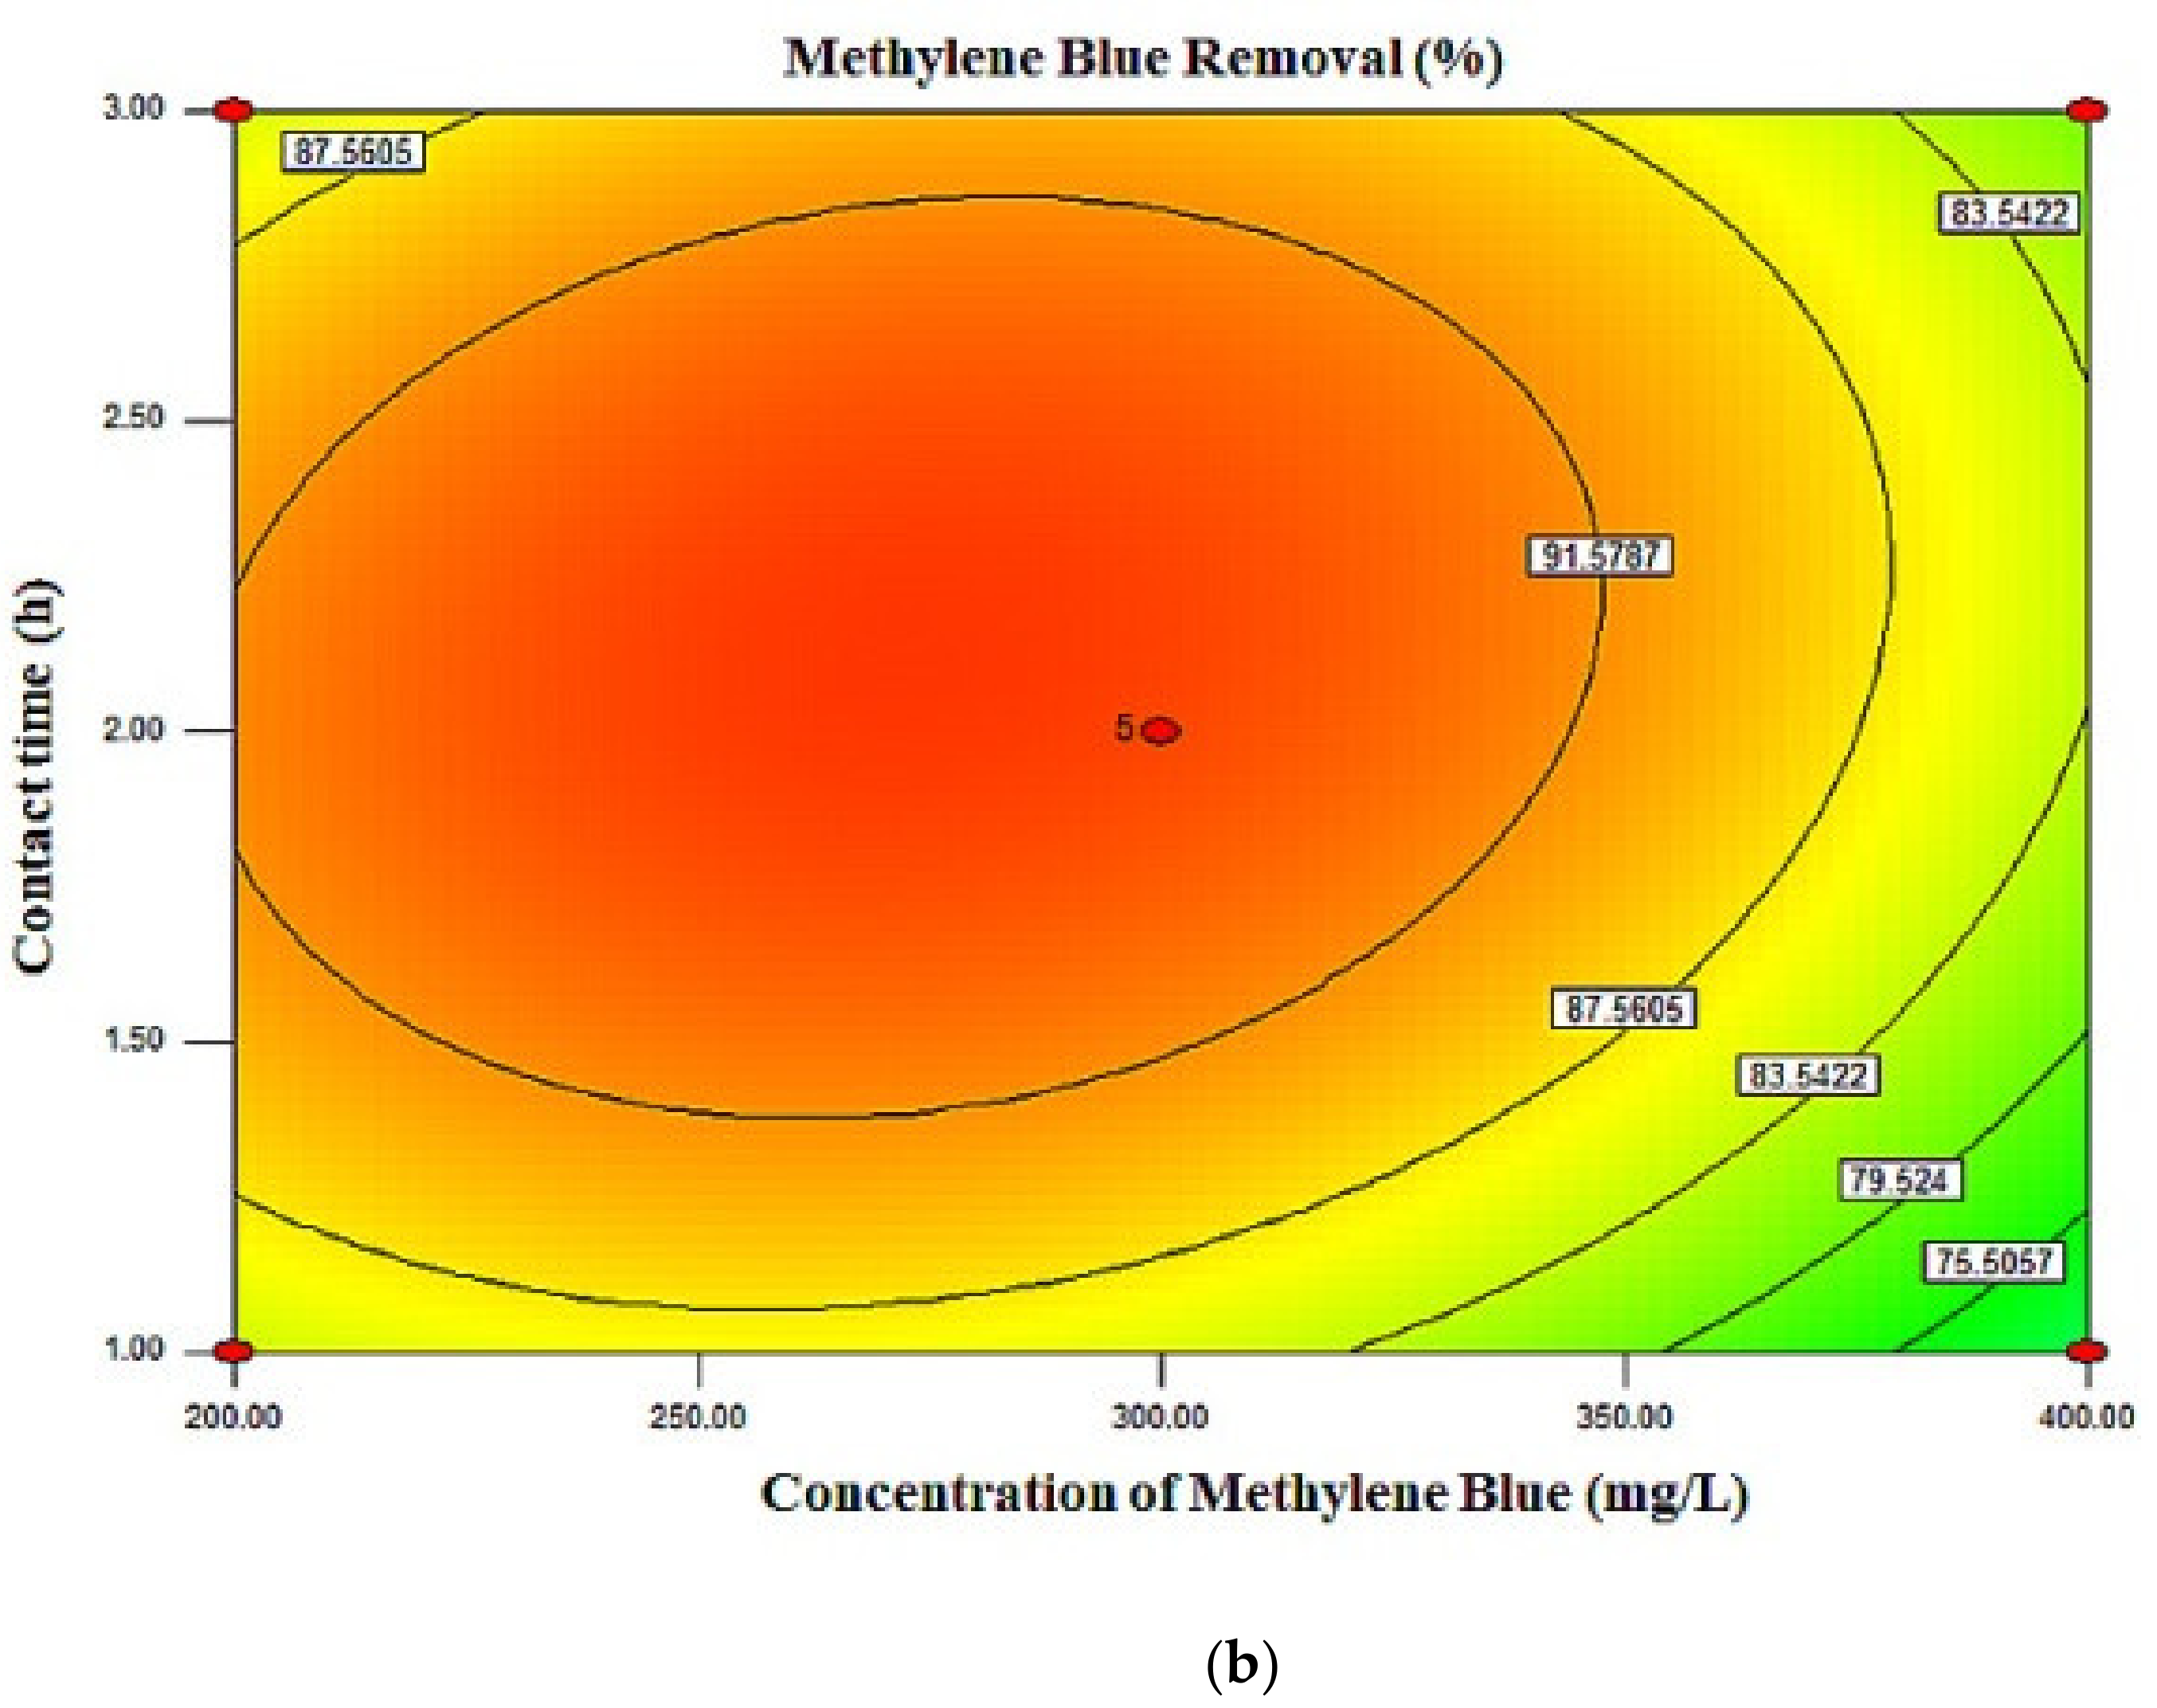
2.3. Response Surface Plots
3. Materials and Methods
3.1. Preparation of OPTAC
3.2. Dye Adsorption Study
3.3. Design of Experiment
4. Conclusions
Author Contributions
Funding
Institutional Review Board Statement
Informed Consent Statement
Data Availability Statement
Conflicts of Interest
Sample Availability
References
- Al-Ghouti, M.A.; Sweleh, A.O. Optimizing textile dye removal by activated carbon prepared from olive stones. Environ. Technol. Innov. 2019, 16, 100488. [Google Scholar] [CrossRef]
- Samarbaf, S.; Tahmasebi, B.Y.; Yazdani, M.; Babaei, A.A. A comparative removal of two dyes from aqueous solution using modified oak waste residues: Process optimization using response surface methodology. J. Ind. Eng. Chem. 2019, 73, 67–77. [Google Scholar] [CrossRef]
- Koo, W.K.; Gani, N.A.; Shamsuddin, M.S.; Subki, N.S. Comparison of Wastewater Treatment using Activated Carbon from Bamboo and Oil Palm: An Overview. J. Trop. Resour. Sustain. Sci. 2015, 3, 54–60. [Google Scholar]
- Favero, B.M.; Favero, A.C.; Taffarel, S.R.; Souza, F.S. Evaluation of the efficiency of coagulation/flocculation and Fenton process in reduction of colour, turbidity and COD of a textile effluent. Environ. Technol. 2020, 41, 1580–1589. [Google Scholar] [CrossRef] [PubMed]
- Ma, J.; Xia, W.; Fu, X. Magnetic flocculation of algae-laden raw water and removal of extracellular organic matter by using composite flocculant of Fe3O4/cationic polyacrylamide. J. Clean. Prod. 2020, 248, 119276. [Google Scholar] [CrossRef]
- Wei, T.; Wu, L.; Yu, F. pH-responsive chitosan-based flocculant for precise dye flocculation control and the recycling of textile dyeing effluents. RSC Adv. 2018, 8, 39334–39340. [Google Scholar] [CrossRef]
- Ilhan, F.; Ulucan-Altuntas, K.; Can, D.U.K. Treatability of raw textile wastewater using Fenton process and its comparison with chemical coagulation. Desalin. Water Treat. 2019, 162, 142–148. [Google Scholar] [CrossRef]
- Vijayaraghavan, G.; Shanthakumar, S. Effective removal of Reactive Magenta dye in textile effluent by coagulation using algal alginate. Desalin. Wat. Treat. 2018, 121, 22–27. [Google Scholar] [CrossRef]
- Oraeki, T.; Skouteris, G.; Ouki, S. Optimization of coagulation-flocculation process in the treatment of wastewater from the brick-manufacturing industry. Water Pract. Technol. 2018, 13, 780–793. [Google Scholar] [CrossRef]
- Riaz, S.; Park, S.J. An overview of TiO2-based photocatalytic membrane reactors for water and wastewater treatments. J. Ind. Eng. Chem. 2020, 84, 23–41. [Google Scholar] [CrossRef]
- Shi, W.; Zeng, X.; Li, H.; Zhang, H.; Qin, X.; Zhou, R. Removal of dyes by poly (p -phenylene terephthamide)/polyvinylidene fluoride hollow fiber in-situ blend membranes. J. Appl. Polym. Sci. 2020, 137, 48569. [Google Scholar] [CrossRef]
- Tara, N.; Siddiqui, S.I.; Rathi, G.; Chaudhry, S.A.; Inamuddin, A.A.M. Nano-engineered Adsorbent for the Removal of Dyes from Water: A Review. Curr. Anal. Chem. 2020, 16, 14–40. [Google Scholar] [CrossRef]
- Patil, K.; Jeong, S.; Lim, H.; Byun, H.-S.; Han, S. Removal of volatile organic compounds from air using activated carbon impregnated cellulose acetate electrospun mats. Environ. Eng. Res. 2018, 24, 600–607. [Google Scholar] [CrossRef]
- Senthil, K.P.; Joshiba, G.J.; Femina, C.C. A critical review on recent developments in the low-cost adsorption of dyes from wastewater. Desalin. Water Treat. 2019, 172, 395–416. [Google Scholar] [CrossRef]
- Desta, M.B. Batch Sorption Experiments: Langmuir and Freundlich Isotherm Studies for the Adsorption of Textile Metal Ions onto Teff Straw (Eragrostis tef) Agricultural Waste. J. Thermodyn. 2013, 2013, 1–6. [Google Scholar] [CrossRef]
- Hazzaa, R.; Hussein, M. Adsorption of cationic dye from aqueous solution onto activated carbon prepared from olive stones. Environ. Technol. Innov. 2015, 4, 36–51. [Google Scholar] [CrossRef]
- Eris, S.; Azizian, S. Extension of classical adsorption rate equations using mass of adsorbent: A graphical analysis. Sep. Purif. Technol. 2017, 179, 304–308. [Google Scholar] [CrossRef]
- Pardeep, S.; Pankaj, R.; Deepak; Pathania, G.S. Microwave induced KOH activation of guava peel carbon as an adsorbent for congo red dye removal from aqueous phase. Indian J. Chem. Technol. 2013, 20, 305–311. [Google Scholar]
- Abdullah, N.H.; Ghani, N.A.A.; Razab, M.K.A.A. Methyl orange adsorption from aqueous solution by corn cob based activated carbon. AIP Conf. Proc. 2019, 2068, 20036. [Google Scholar]
- Yahya, M.A.; Al-Qodah, Z.; Ngah, C.W.Z. Agricultural bio-waste materials as potential sustainable precursors used for activated carbon production: A review. Renew. Sustain. Energy Rev. 2015, 46, 218–235. [Google Scholar] [CrossRef]
- Islam, M.A.; Ahmed, M.J.; Khanday, W.A.; Asif, M.; Hameed, B.H. Mesoporous activated coconut shell-derived hydrochar prepared via hydrothermal carbonization-NaOH activation for methylene blue adsorption. J. Environ. Manag. 2017, 203, 237–244. [Google Scholar] [CrossRef] [PubMed]
- Arsyad, N.A.S.; Razab, M.K.A.A.; Noor, A.M.; Amini, M.H.M.; Yusoff, N.N.A.N.; Halim, A.Z.A.; Yusuf, N.A.A.N.; Masri, M.N.; Sulaiman, M.A.; Abdullah, N.H. Effect of chemical treatment on production of activated carbon from Cocos nucifera L. (Coconut) shell by microwave irradiation method. J. Trop. Resour. Sustain. Sci. 2016, 4, 112–116. [Google Scholar]
- Yaseen, M.; Ullah, S.; Ahmad, W.; Subhan, S.; Subhan, F. Fabrication of Zn and Mn loaded activated carbon derived from corn cobs for the adsorptive desulfurization of model and real fuel oils. Fuel 2021, 284, 119102. [Google Scholar] [CrossRef]
- Gopalakrishnan, Y.; Al-Gheethi, A.; Abdul Malek, M.; Marisa Azlan, M.; Al-Sahari, M.; Radin Mohamed, R.M.S.; Alkhadher, S.; Noman, E. Removal of Basic Brown 16 from Aqueous Solution Using Durian Shell Adsorbent, Optimisation and Techno-Economic Analysis. Sustainability 2020, 12, 8928. [Google Scholar] [CrossRef]
- Tham, Y.J.; Latif, P.A.; Abdullah, A.M.; Taufiq-YA, Y.H. Physical Characteristics of Activated Carbon Derived from Durian Shell. Asian J. Chem. 2010, 22, 772–780. [Google Scholar]
- Tran, T.D.H.; Charoensook, K.; Tai, H.C. Preparation of activated carbon derived from oil palm empty fruit bunches and its modification by nitrogen doping for supercapacitors. J. Porous Mater. 2021, 28, 9–18. [Google Scholar] [CrossRef]
- Maulina, S.; Iriansyah, M. Characteristics of activated carbon resulted from pyrolysis of the oil palm fronds powder. IOP Conf. Ser. Mater. Sci. Eng. 2018, 309, 12072. [Google Scholar] [CrossRef]
- Awalludin, M.F.; Sulaiman, O.; Hashim, R.; Nadhari, W.N.A.W. An overview of the oil palm industry in Malaysia and its waste utilization through thermochemical conversion, specifically via liquefaction. Renew. Sustain. Energy Rev. 2015, 50, 1469–1484. [Google Scholar] [CrossRef]
- Yuliansyah, A.T.; Hirajima, T.; Kumagai, S.; Sasaki, K. Production of Solid Biofuel from Agricultural Wastes of the Palm Oil Industry by Hydrothermal Treatment. Waste Biomass Valorization 2010, 1, 395–405. [Google Scholar] [CrossRef]
- Abdullah, N.H.; Wan Abu Bakar, W.A.; Hussain, R.; Bakar, M.B.; van Esch, J.H. Effect of homogeneous acidic catalyst on mechanical strength of trishydrazone hydrogels: Characterization and optimization studies. Arab. J. Chem. 2018, 11, 635–644. [Google Scholar] [CrossRef]
- Lékéné, R.B.N.; Nsami, J.N.; Rauf, A. Optimization Conditions of the Preparation of Activated Carbon Based Egusi Seed Shells for Nitrate Ions Removal from Wastewater. Am. J. Anal. Chem. 2018, 9, 439–463. [Google Scholar] [CrossRef]
- Inam, E.; Etim, U.J.; Akpabio, E.G.; Umoren, S.A. Process optimization for the application of carbon from plantain peels in dye abstraction. J. Taibah Univ. Sci. 2017, 11, 173–185. [Google Scholar] [CrossRef]
- Daud, F.A.; Ismail, N.; Ghazi, R. Response Surface Methodology Optimization of Methylene Blue Removal by Activated Carbon Derived from Foxtail Palm Tree Empty Fruit Bunch. J. Trop. Resour. Sustain. Sci. 2016, 4, 25–30. [Google Scholar]
- Radaei, E.; Moghaddam, M.R.A.; Arami, M. Removal of reactive blue 19 from aqueous solution by pomegranate residual-based activated carbon: Optimization by response surface methodology. J. Environ. Health Sci. Eng. 2014, 12, 65. [Google Scholar] [CrossRef] [PubMed]
- Danish, M.; Khanday, W.A.; Hashim, R.; Sulaiman, N.S.B.; Akhtar, M.N.; Nizami, M. Application of optimized large surface area date stone (Phoenix dactylifera) activated carbon for rhodamin B removal from aqueous solution: Box-Behnken design approach. Ecotoxicol. Environ. Saf. 2017, 139, 280–290. [Google Scholar] [CrossRef]
- Sadaf, S.; Bhatti, H.N.; Arif, M.; Amin, M.; Nazar, F.; Sultan, M. Box–Behnken design optimization for the removal of Direct Violet 51 dye from aqueous solution using lignocellulosic waste. Desalin. Water Treat. 2015, 56, 2425–2437. [Google Scholar] [CrossRef]
- Shojaei, S.; Shojaei, S.; Pirkamali, M. Application of Box–Behnken Design Approach for Removal of Acid Black 26 from Aqueous Solution Using Zeolite: Modeling, Optimization, and Study of Interactive Variables. Water Conserv. Sci. Eng. 2019, 4, 13–19. [Google Scholar] [CrossRef]
- Jawad, A.H.; Abdul Mubarak, N.S.; Nawawi, W.I. Optimization of Sorption Parameters for Color Removal of Textile Dye by Cross-linked Chitosan Beads Using Box-Behnken Design. MATEC Web Conf. 2016, 47, 5009. [Google Scholar] [CrossRef]
- Bello, O.S.; Ahmad, M.A. Adsorptive removal of a synthetic textile dye using cocoa pod husks. Toxicol. Environ. Chem. 2011, 93, 1298–1308. [Google Scholar] [CrossRef]
- Yakout, S.M.; Sharaf El-Deen, G. Characterization of activated carbon prepared by phosphoric acid activation of olive stones. Arab. J. Chem. 2016, 9, S1155–S1162. [Google Scholar] [CrossRef]
- Abioye, A.M.; Ani, F.N. The Characteristics of Oil Palm Shell Biochar and Activated Carbon Produced via Microwave Heating. Appl. Mech. Mater. 2014, 695, 12–15. [Google Scholar] [CrossRef]
- Ahmad, A.; Loh, M.; Aziz, J. Preparation and characterization of activated carbon from oil palm wood and its evaluation on Methylene blue adsorption. Dye. Pigment. 2007, 75, 263–272. [Google Scholar] [CrossRef]
- Sun, Y.; Li, H.; Li, G.; Gao, B.; Yue, Q.; Li, X. Characterization and ciprofloxacin adsorption properties of activated carbons prepared from biomass wastes by H3PO4 activation. Bioresour. Technol. 2016, 217, 239–244. [Google Scholar] [CrossRef] [PubMed]
- Jasper, E.E.; Ajibola, V.O.; Agbaji, E.B.; Onwuka, J.C. Optimization of the preparation of Millettia thonningii seed pods activated carbon for use in the remediation of dye-contaminated aqueous solutions. SN Appl. Sci. 2019, 1, 1351. [Google Scholar] [CrossRef]
- Altintig, E.; Arabaci, G.; Altundag, H. Preparation and characterization of the antibacterial efficiency of silver loaded activated carbon from corncobs. Surf. Coatings Technol. 2016, 304, 63–67. [Google Scholar] [CrossRef]
- Zhao, Y.; Wang, Z.Q.; Zhao, X.; Li, W.; Liu, S.X. Antibacterial action of silver-doped activated carbon prepared by vacuum impregnation. Appl. Surf. Sci. 2013, 266, 67–72. [Google Scholar] [CrossRef]
- El-Gendy, N.S.; Madian, H.R.; Amr, S.S.A. Design and Optimization of a Process for Sugarcane Molasses Fermentation by Saccharomyces cerevisiae Using Response Surface Methodology. Int. J. Microbiol. 2013, 2013, 1–9. [Google Scholar] [CrossRef]
- Senthilkumaar, S.; Varadarajan, P.R.; Porkodi, K.; Subbhuraam, C.V. Adsorption of methylene blue onto jute fiber carbon: Kinetics and equilibrium studies. J. Colloid Interface Sci. 2005, 284, 78–82. [Google Scholar] [CrossRef]
- Zamani, A.H.; Abdullah, N.H. Modeling and optimization of carbon dioxide methanation via in situ hydrogen generated from aluminum foil and alkaline water by Box–Behnken design. J. Taiwan Inst. Chem. Eng. 2018, 82, 156–162. [Google Scholar] [CrossRef]
- Myers, R.H.; Montgomery, D.C.; Anderson-Cook, C.M. Response Surface Methodology: Process and Product Optimization Using Designed Experiments, 4th ed.; Wiley: Hoboken, NJ, USA, 2016. [Google Scholar]


| Run | X1 (g) | X2 (mg/L) | X3 (h) | MB Removal (%) | |
|---|---|---|---|---|---|
| Actual | Predicted | ||||
| 1 | 1 | 400 | 1 | 71.22 | 71.49 |
| 2 | 0.5 | 400 | 2 | 51.19 | 51.54 |
| 3 | 0.5 | 300 | 1 | 55.01 | 54.39 |
| 4 | 1 | 300 | 2 | 95.78 | 94.86 |
| 5 | 1 | 300 | 2 | 95.66 | 94.86 |
| 6 | 1.5 | 300 | 1 | 91.9 | 92.74 |
| 7 | 1 | 200 | 3 | 85.01 | 84.74 |
| 8 | 0.5 | 300 | 3 | 60.74 | 59.9 |
| 9 | 0.5 | 200 | 2 | 62.05 | 63.15 |
| 10 | 1.5 | 200 | 2 | 97.98 | 97.63 |
| 11 | 1.5 | 400 | 2 | 93.3 | 92.2 |
| 12 | 1 | 300 | 2 | 93.67 | 94.86 |
| 13 | 1 | 400 | 3 | 79.91 | 80.39 |
| 14 | 1 | 300 | 2 | 93.57 | 94.86 |
| 15 | 1 | 200 | 1 | 84.67 | 84.19 |
| 16 | 1.5 | 300 | 3 | 96.07 | 96.69 |
| 17 | 1 | 300 | 2 | 95.64 | 94.86 |
| Source | Sum of Squares | Degree of Freedom | Mean Square | F-Value | p-Value |
|---|---|---|---|---|---|
| Model | 4160.28 | 9 | 462.25 | 304.23 | <0.0001 |
| X1 | 2822.26 | 1 | 2822.26 | 1857.43 | <0.0001 |
| X2 | 145.27 | 1 | 145.27 | 95.60 | <0.0001 |
| X3 | 44.79 | 1 | 44.79 | 29.48 | 0.0010 |
| X1X2 | 9.55 | 1 | 9.55 | 6.28 | 0.0406 |
| X1X3 | 0.61 | 1 | 0.61 | 0.40 | 0.5470 |
| X2X3 | 17.43 | 1 | 17.43 | 11.47 | 0.0116 |
| X12 | 557.16 | 1 | 557.16 | 366.69 | <0.0001 |
| X22 | 220.14 | 1 | 220.14 | 144.88 | <0.0001 |
| X32 | 232.49 | 1 | 232.49 | 153.0 | <0.0001 |
| Residual | 10.64 | 7 | 1.52 | ||
| Lack of Fit | 5.46 | 3 | 1.82 | 1.41 | 0.3636 |
| Pure Error | 5.17 | 4 | 1.29 | ||
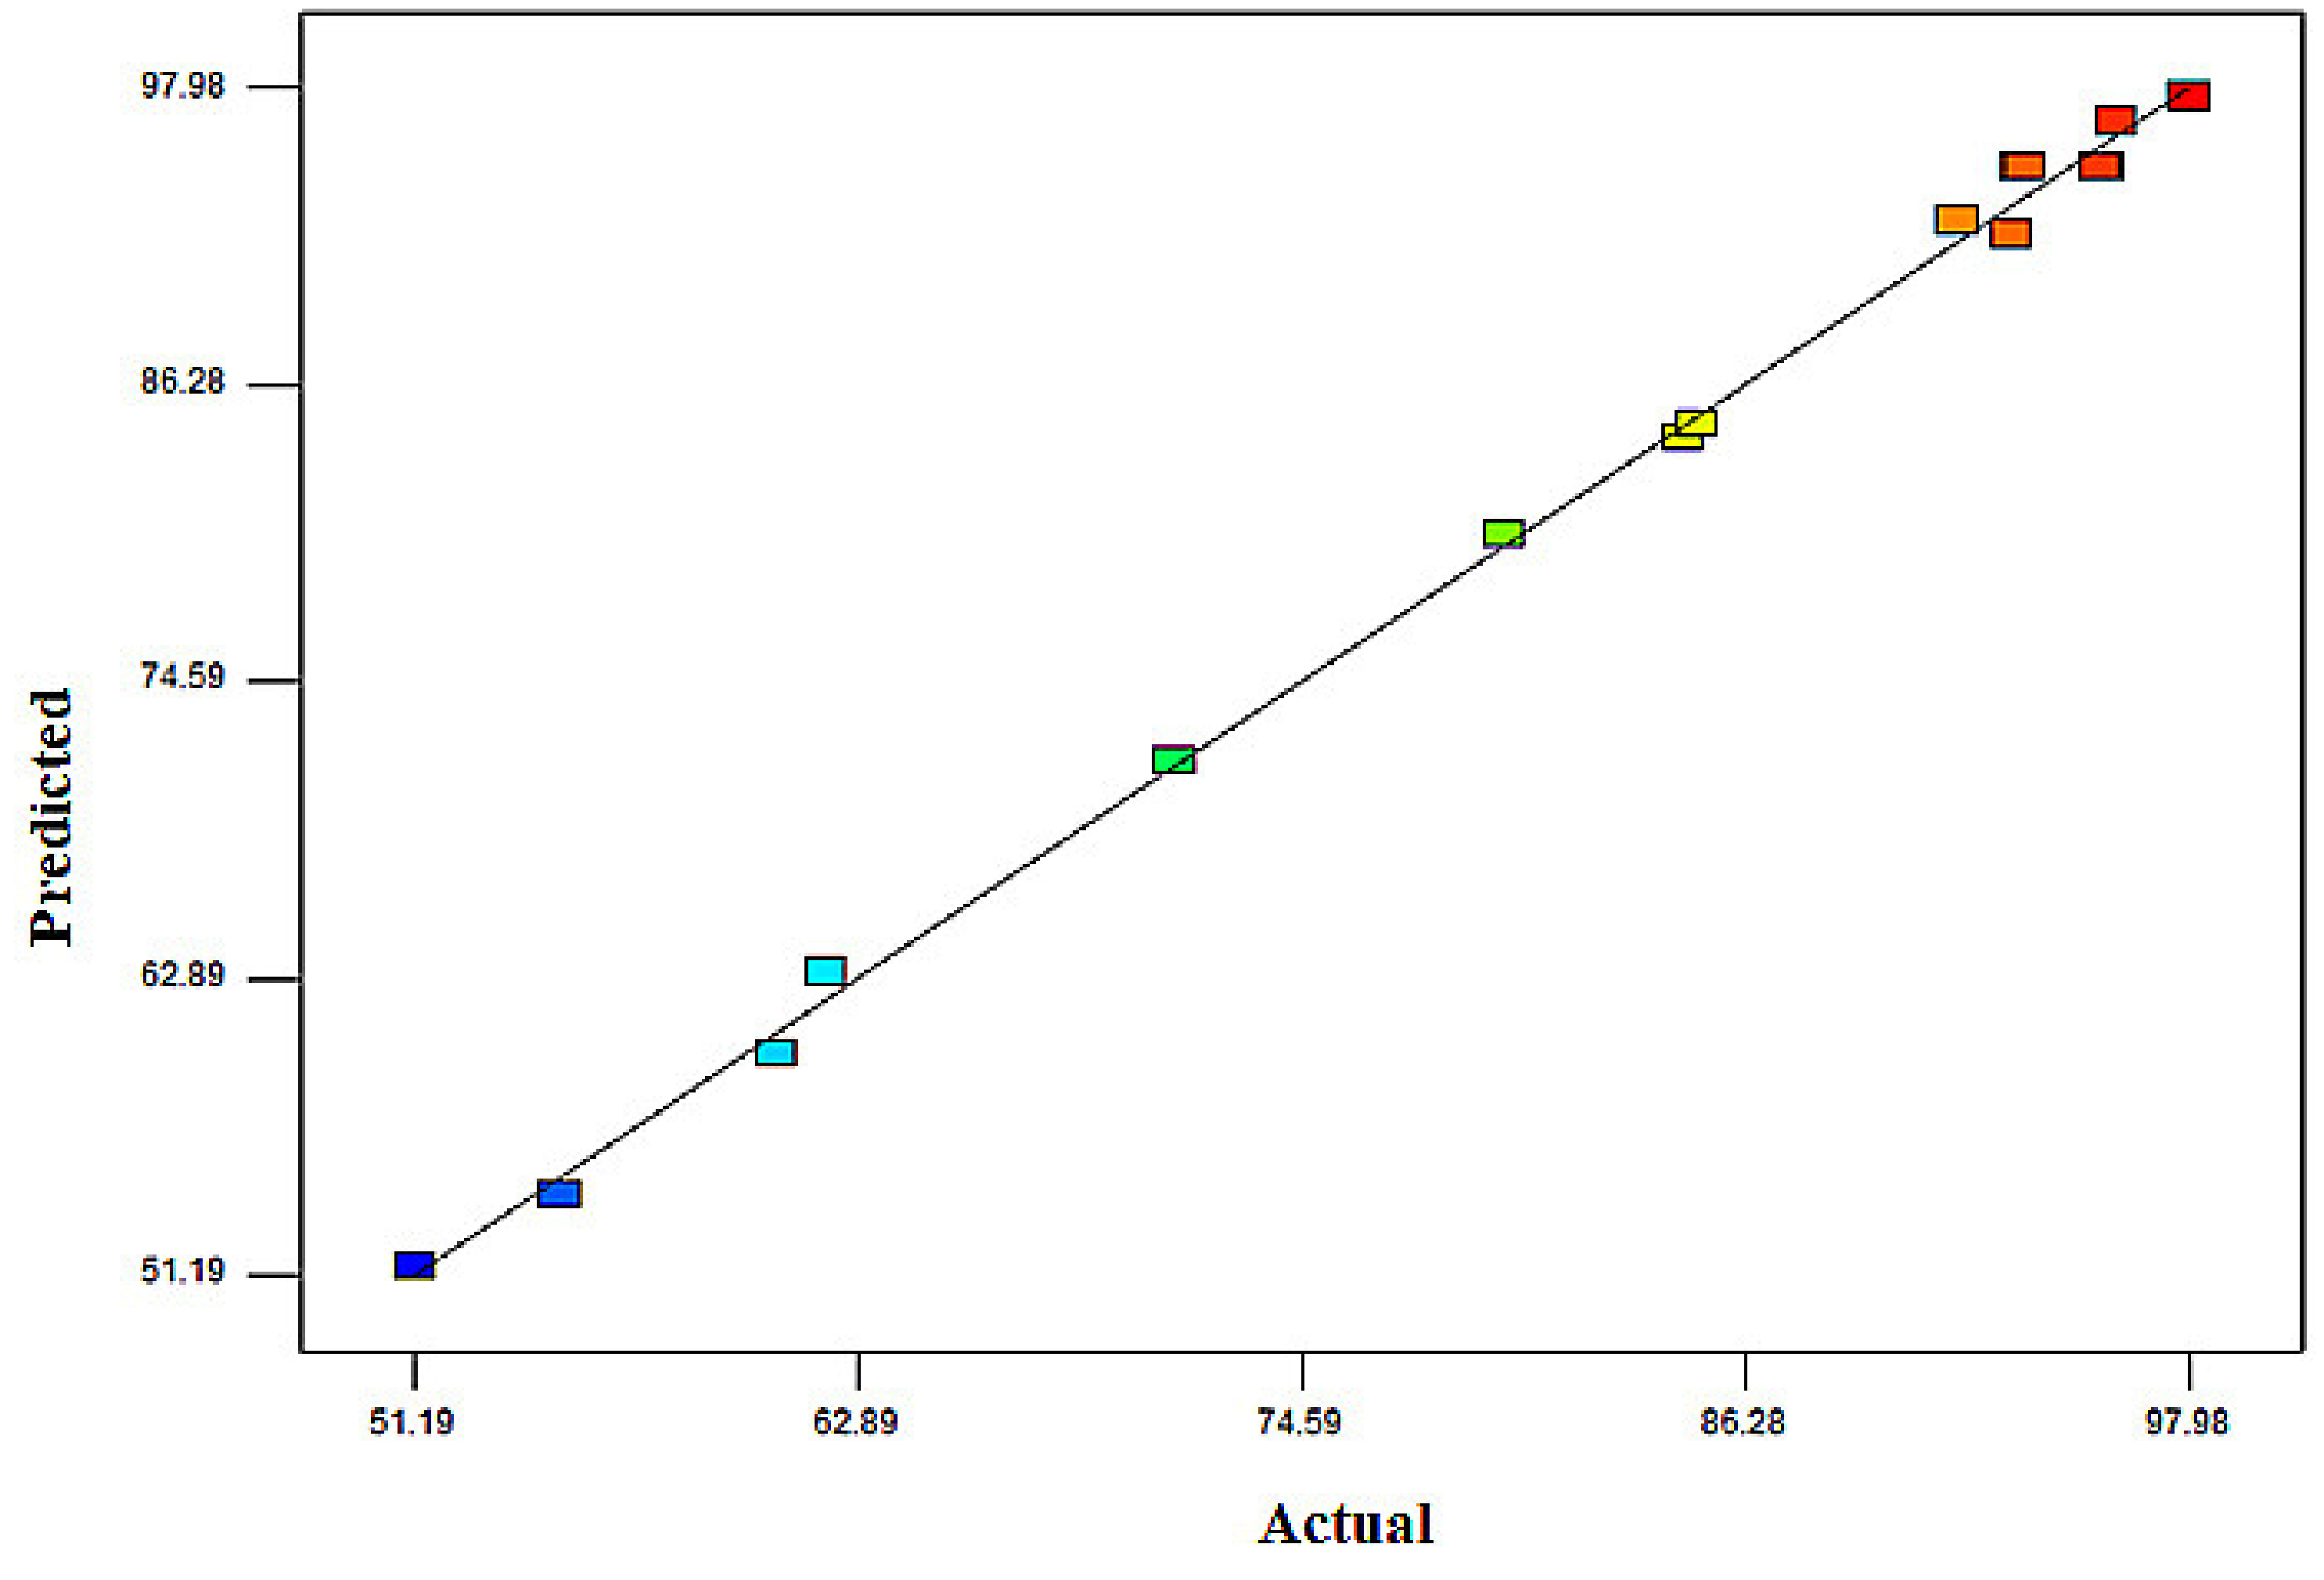
| Std. Dev. | 1.23 | 16 | R2 | 0.9974 | |
| Mean | 82.55 | Adj R2 | 0.9942 | ||
| Predicted R2 | 0.9771 |
| Independent Variables | Range and Level | ||
|---|---|---|---|
| −1 | 0 | 1 | |
| Adsorbent Dosage, X1 (g) | 0.5 | 1 | 1.5 |
| MB Concentration, X2 (mg/L) | 200 | 300 | 400 |
| Contact Time, X3 (h) | 1 | 2 | 3 |
| Parameters | Values |
|---|---|
| Percentage of MB Removal (%) | 95.50 |
| X1 (Adsorbent Dosage, g) | 1.25 |
| X2 (MB Concentration, mg/L) | 350 |
| X3 (Contact Time, h) | 2.15 |
Publisher’s Note: MDPI stays neutral with regard to jurisdictional claims in published maps and institutional affiliations. |
© 2021 by the authors. Licensee MDPI, Basel, Switzerland. This article is an open access article distributed under the terms and conditions of the Creative Commons Attribution (CC BY) license (https://creativecommons.org/licenses/by/4.0/).
Share and Cite
Abdullah, N.H.; Mohamed, M.; Mohd Shohaimi, N.A.; Mat Lazim, A.; Abdul Halim, A.Z.; Mohd Shukri, N.; Abdul Razab, M.K.A. Enhancing the Decolorization of Methylene Blue Using a Low-Cost Super-Absorbent Aided by Response Surface Methodology. Molecules 2021, 26, 4430. https://doi.org/10.3390/molecules26154430
Abdullah NH, Mohamed M, Mohd Shohaimi NA, Mat Lazim A, Abdul Halim AZ, Mohd Shukri N, Abdul Razab MKA. Enhancing the Decolorization of Methylene Blue Using a Low-Cost Super-Absorbent Aided by Response Surface Methodology. Molecules. 2021; 26(15):4430. https://doi.org/10.3390/molecules26154430
Chicago/Turabian StyleAbdullah, Nor Hakimin, Mazlan Mohamed, Norshahidatul Akmar Mohd Shohaimi, Azwan Mat Lazim, Ahmad Zamani Abdul Halim, Nurasmat Mohd Shukri, and Mohammad Khairul Azhar Abdul Razab. 2021. "Enhancing the Decolorization of Methylene Blue Using a Low-Cost Super-Absorbent Aided by Response Surface Methodology" Molecules 26, no. 15: 4430. https://doi.org/10.3390/molecules26154430
APA StyleAbdullah, N. H., Mohamed, M., Mohd Shohaimi, N. A., Mat Lazim, A., Abdul Halim, A. Z., Mohd Shukri, N., & Abdul Razab, M. K. A. (2021). Enhancing the Decolorization of Methylene Blue Using a Low-Cost Super-Absorbent Aided by Response Surface Methodology. Molecules, 26(15), 4430. https://doi.org/10.3390/molecules26154430