
Process Optimization and Modeling of Phenol Adsorption onto Sludge-Based Activated Carbon Intercalated MgAlFe Ternary Layered Double Hydroxide Composite


Abstract
:1. Introduction
2. Materials and Method
2.1. Sludge and Chemical Reagents
2.2. Synthesis of Ternary SBAC-MgAlFe LDH Composite
2.3. Characterization of Ternary SBAC-MgAlFe LDH Composite
2.4. RSM Experiments Design Matrix and Modeling
2.5. Phenol Adsorption Experiments
2.6. Adsorption Kinetics and Equilibrium
3. Results and Discussion
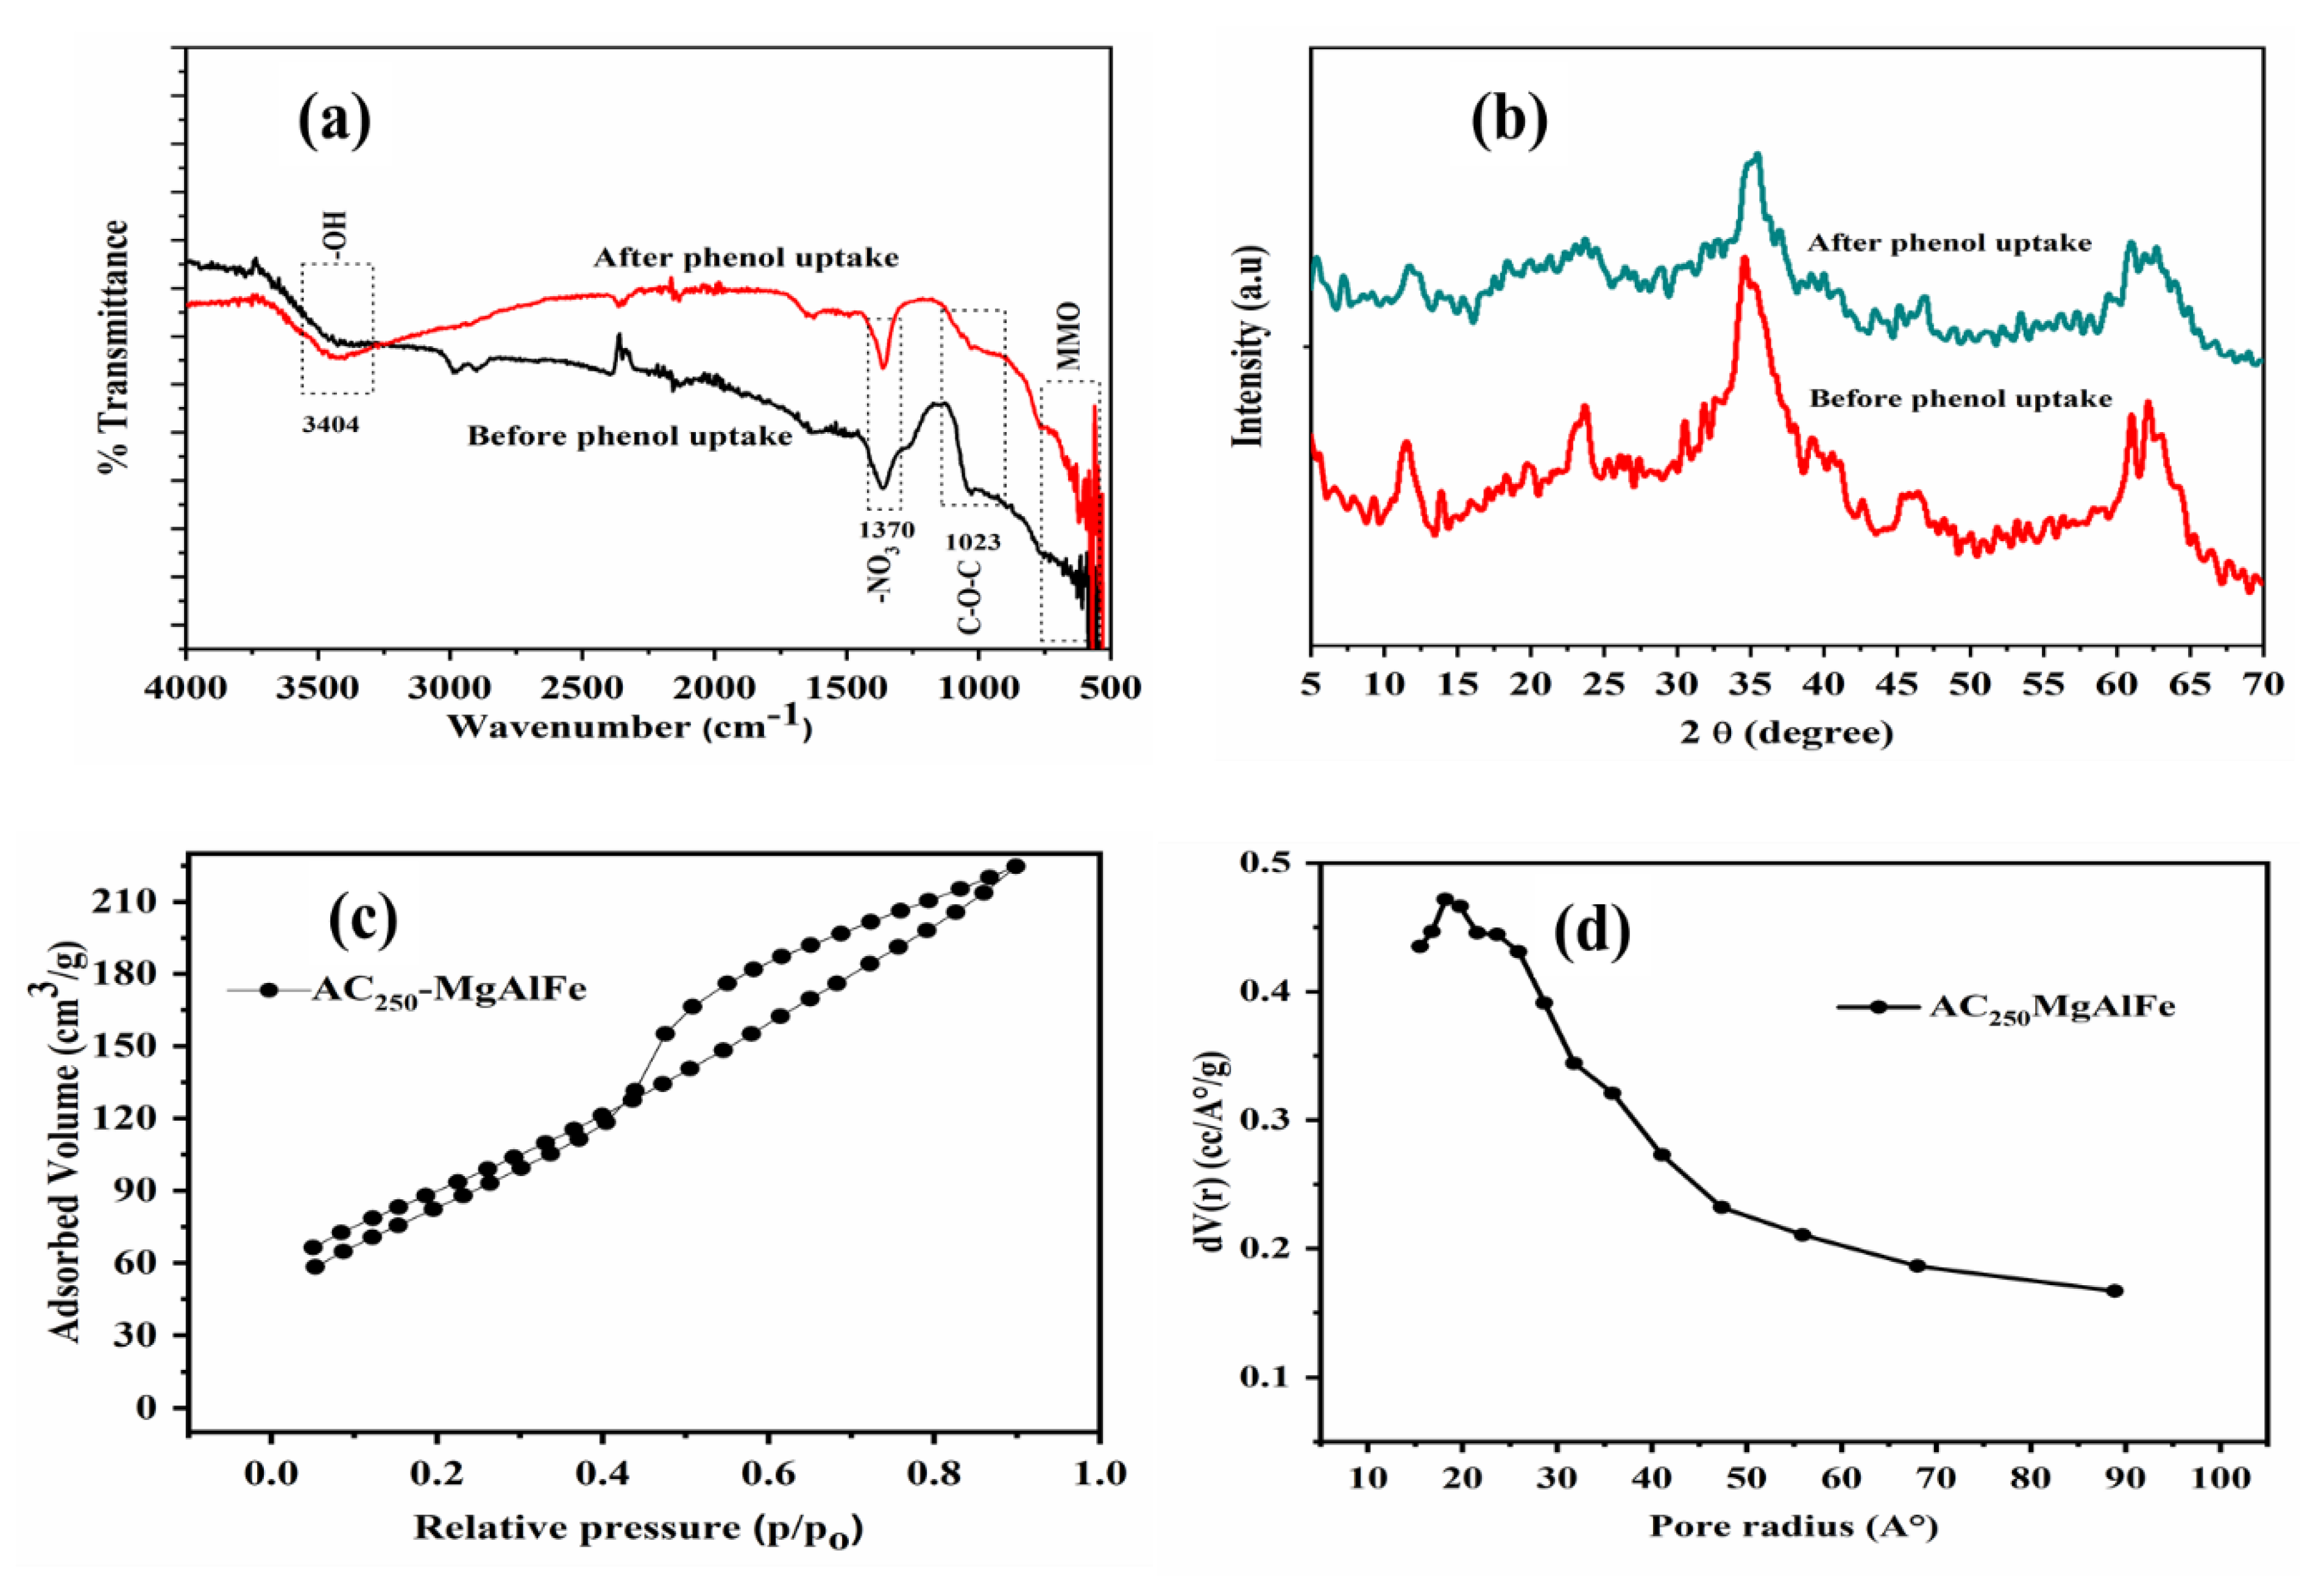
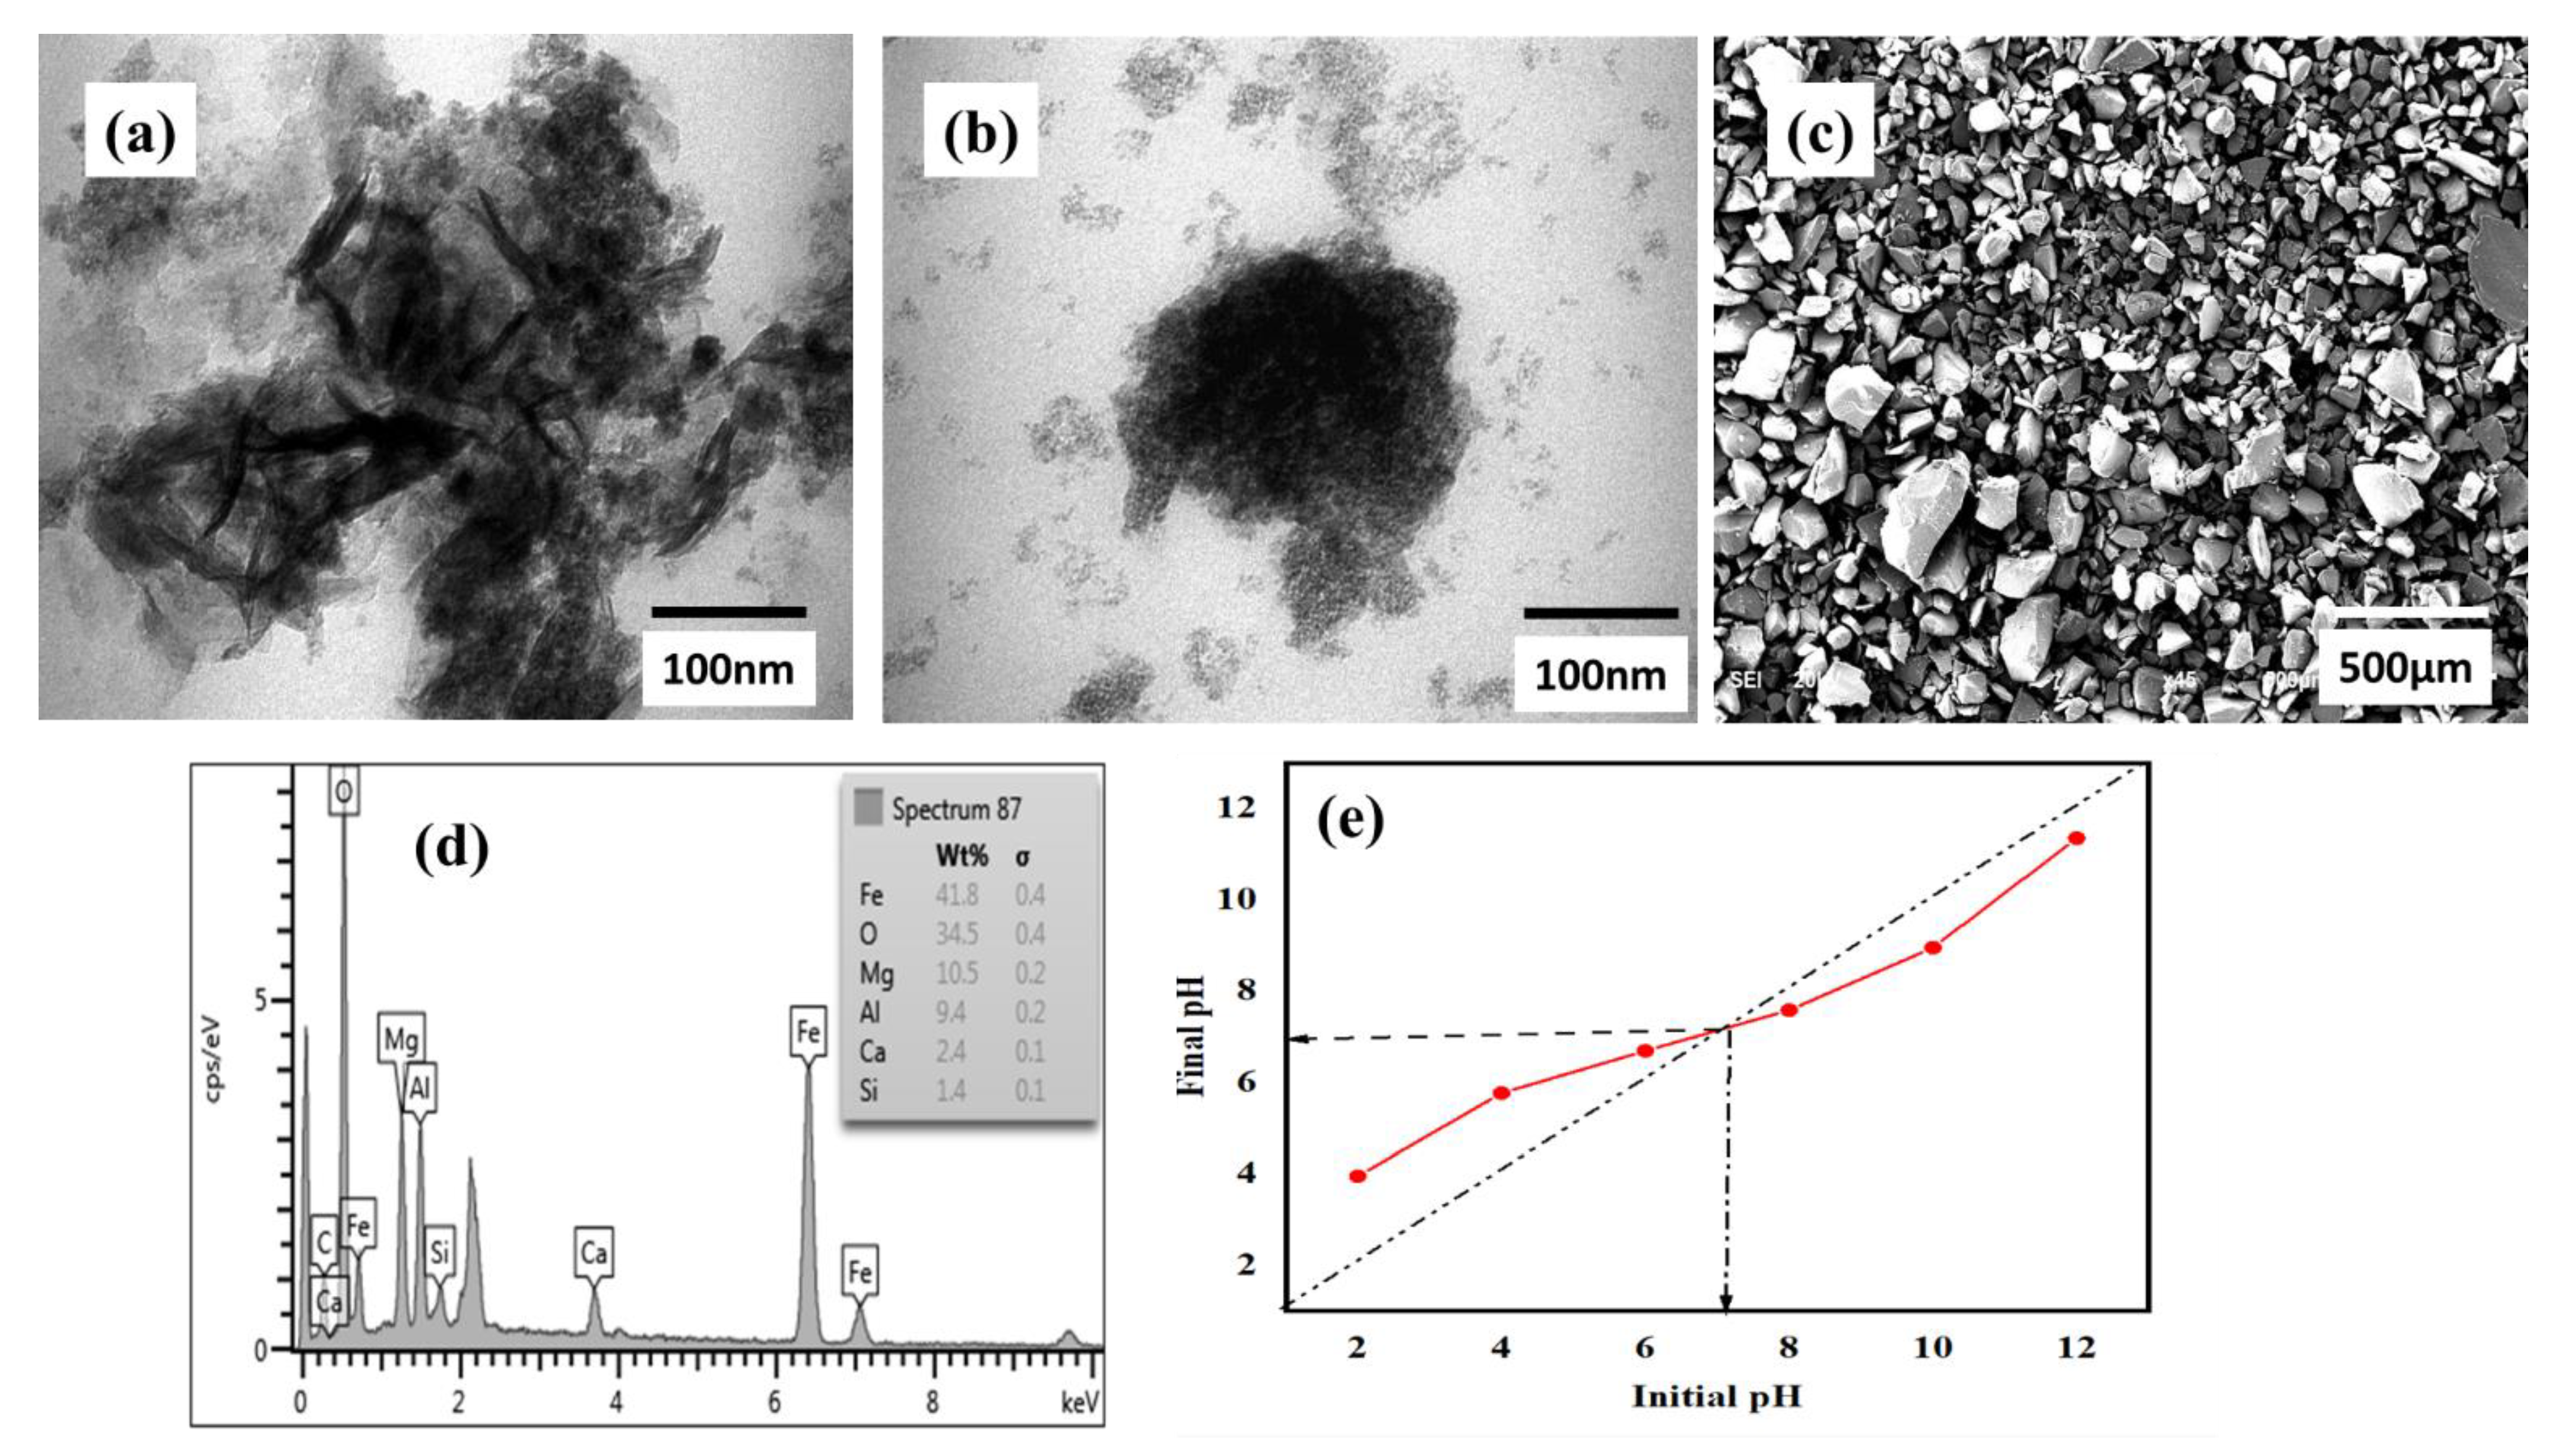
3.1. Characterization of Prepared Adsorbent before and after Phenol Uptake
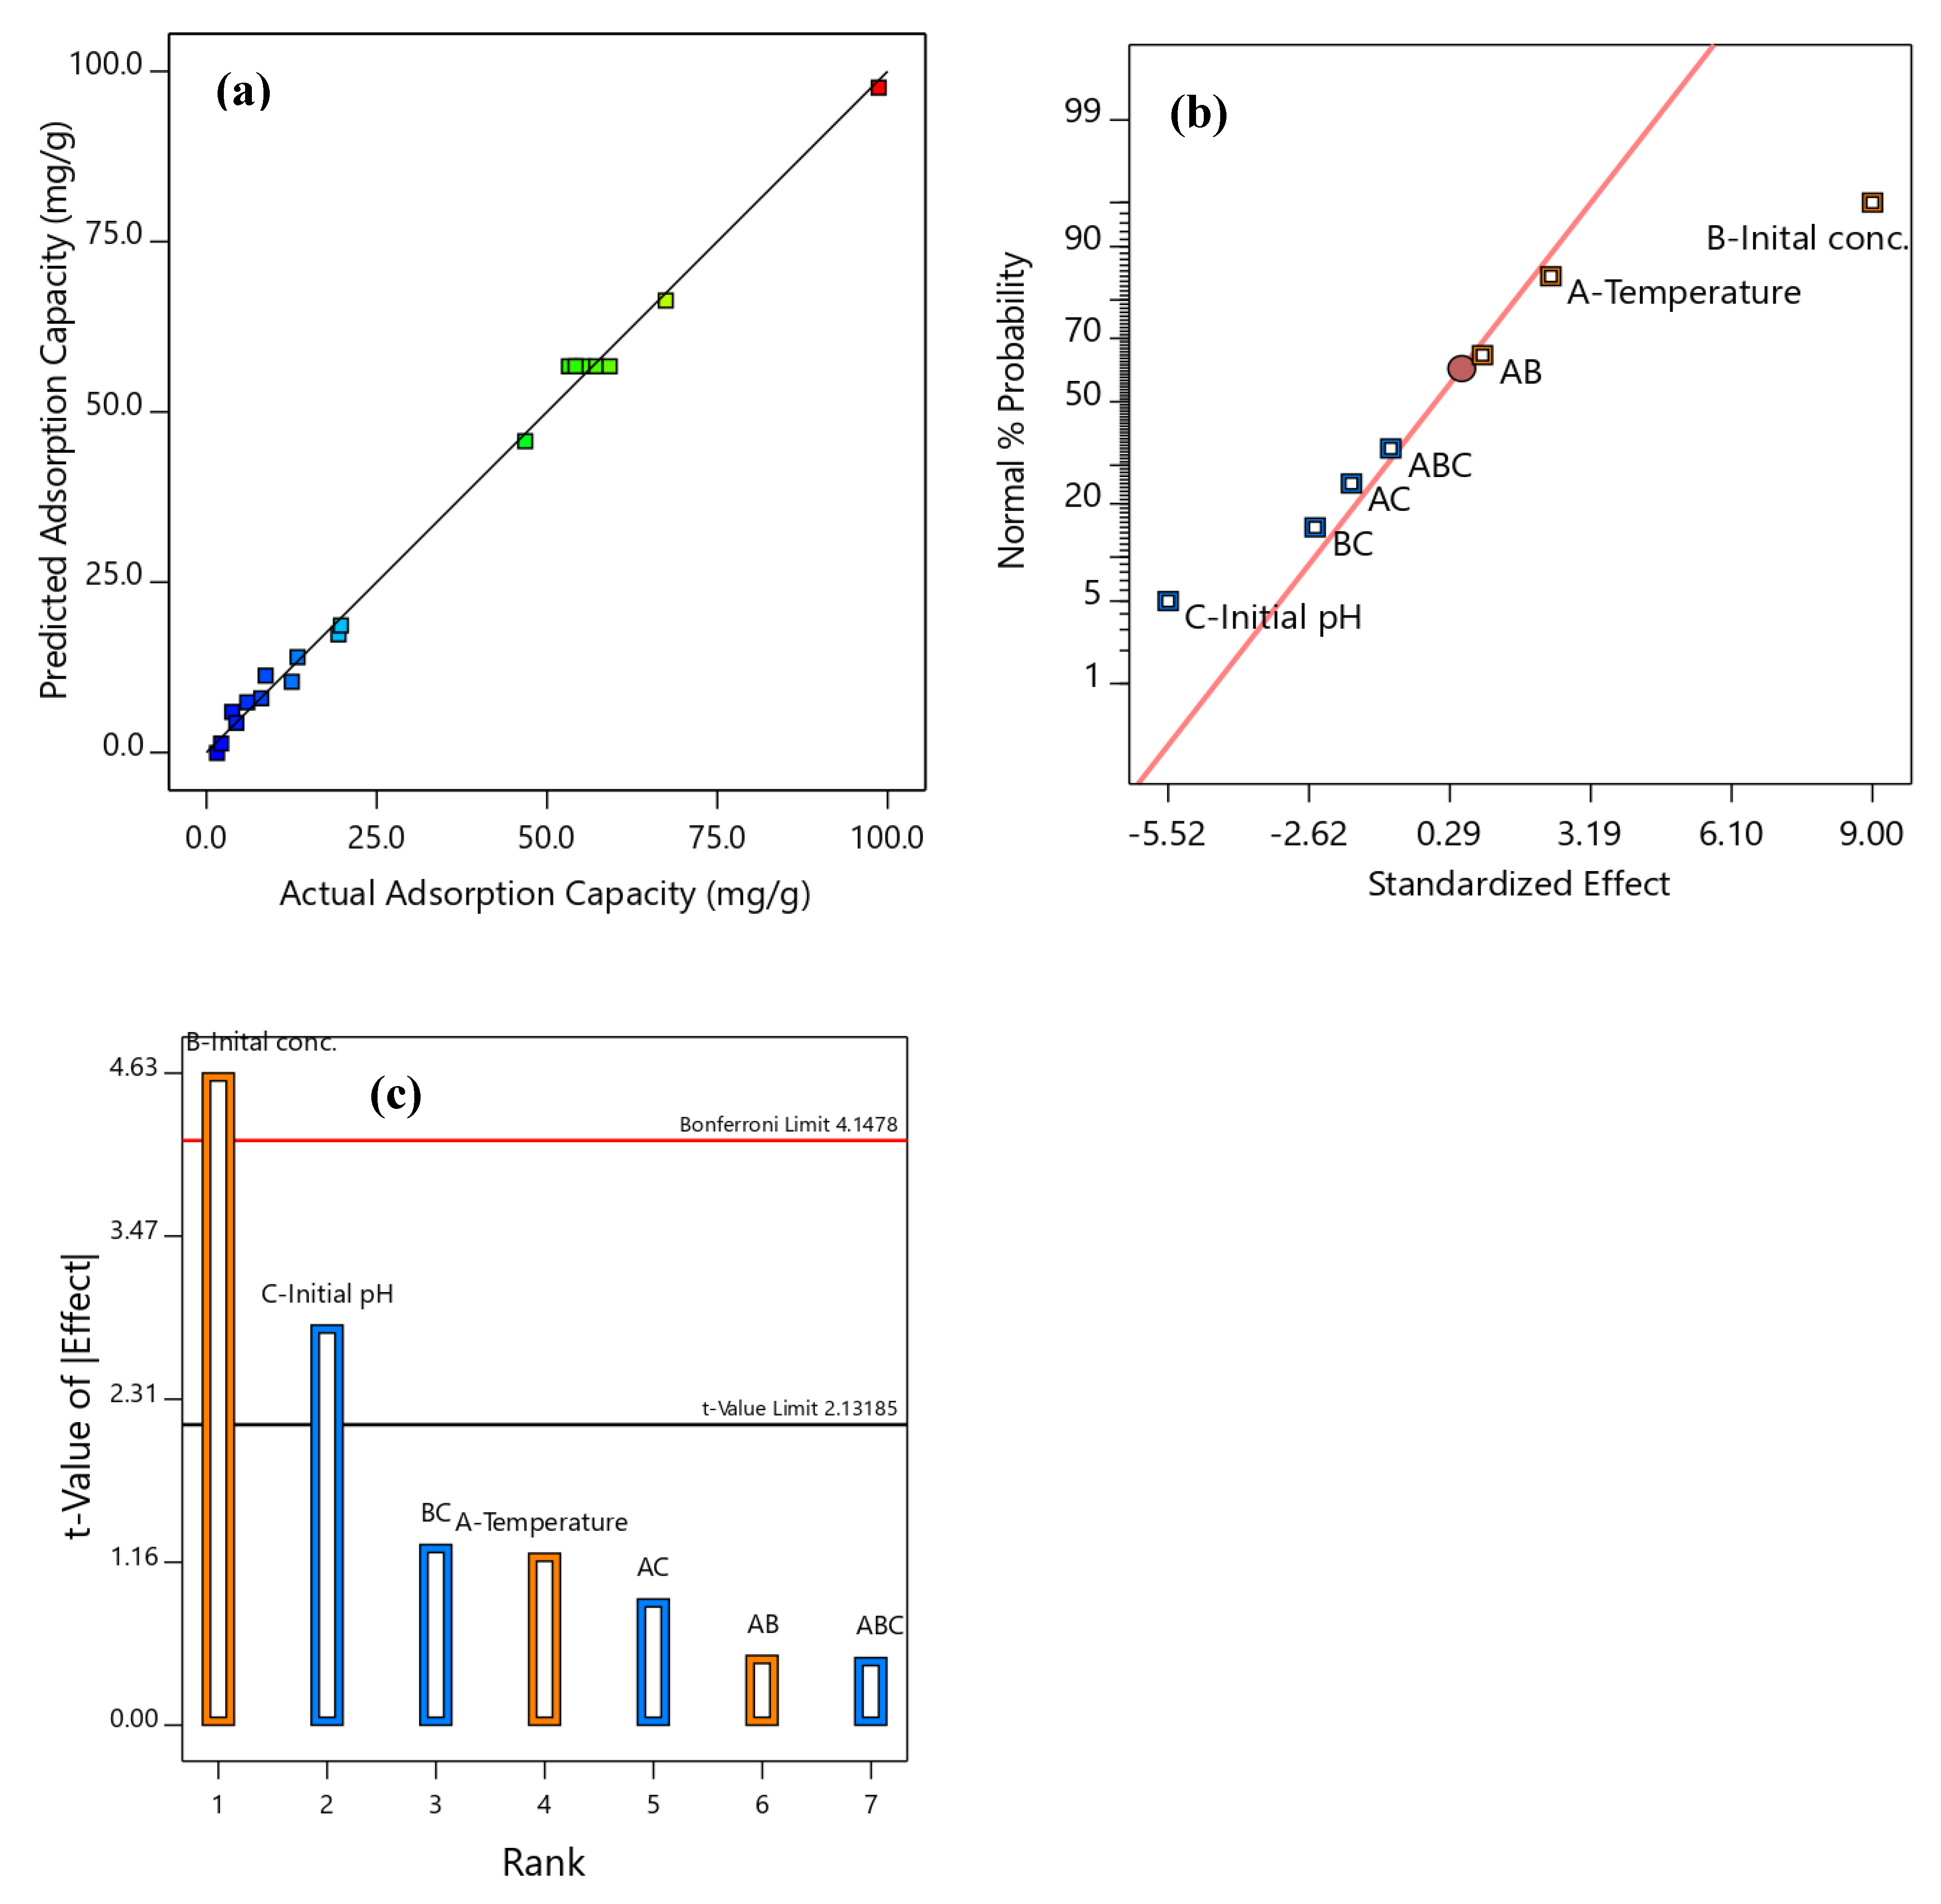
3.2. Development and Validation of RSM Model for Phenol Uptake
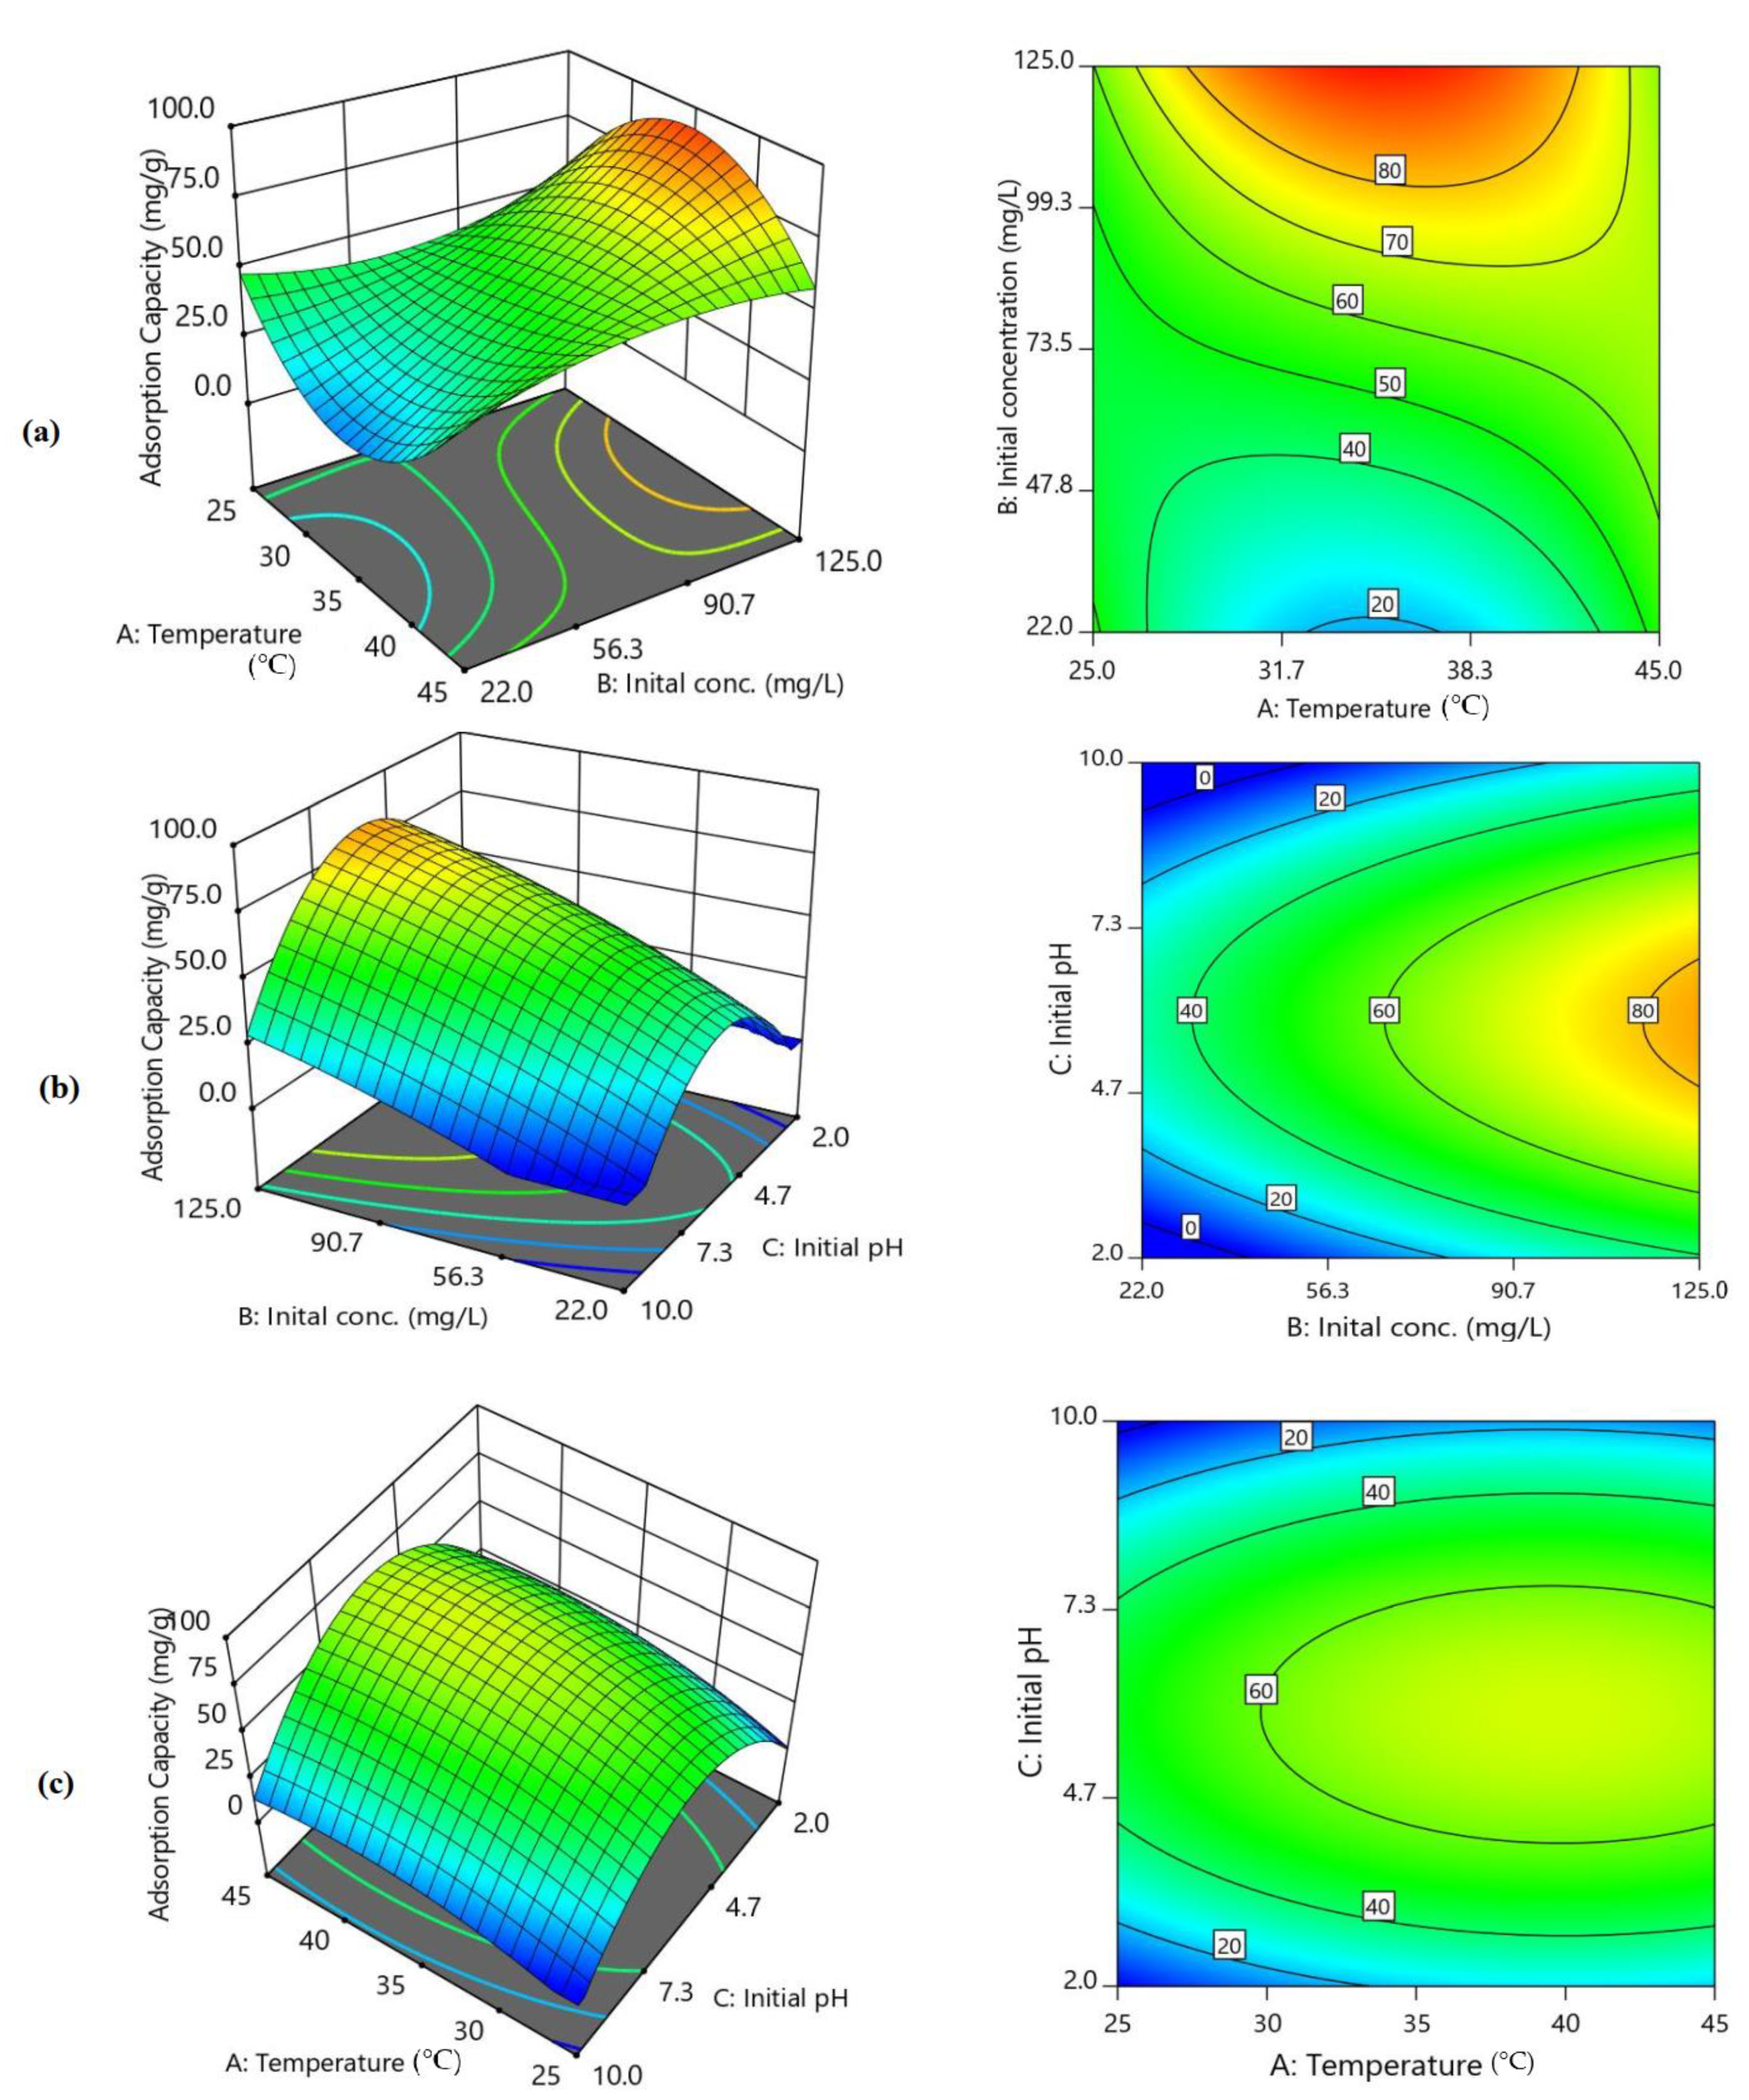
3.3. Influence of Operating Parameters on SBAC-MgAlFe-LDH Phenol Uptake
3.4. RSM Optimization
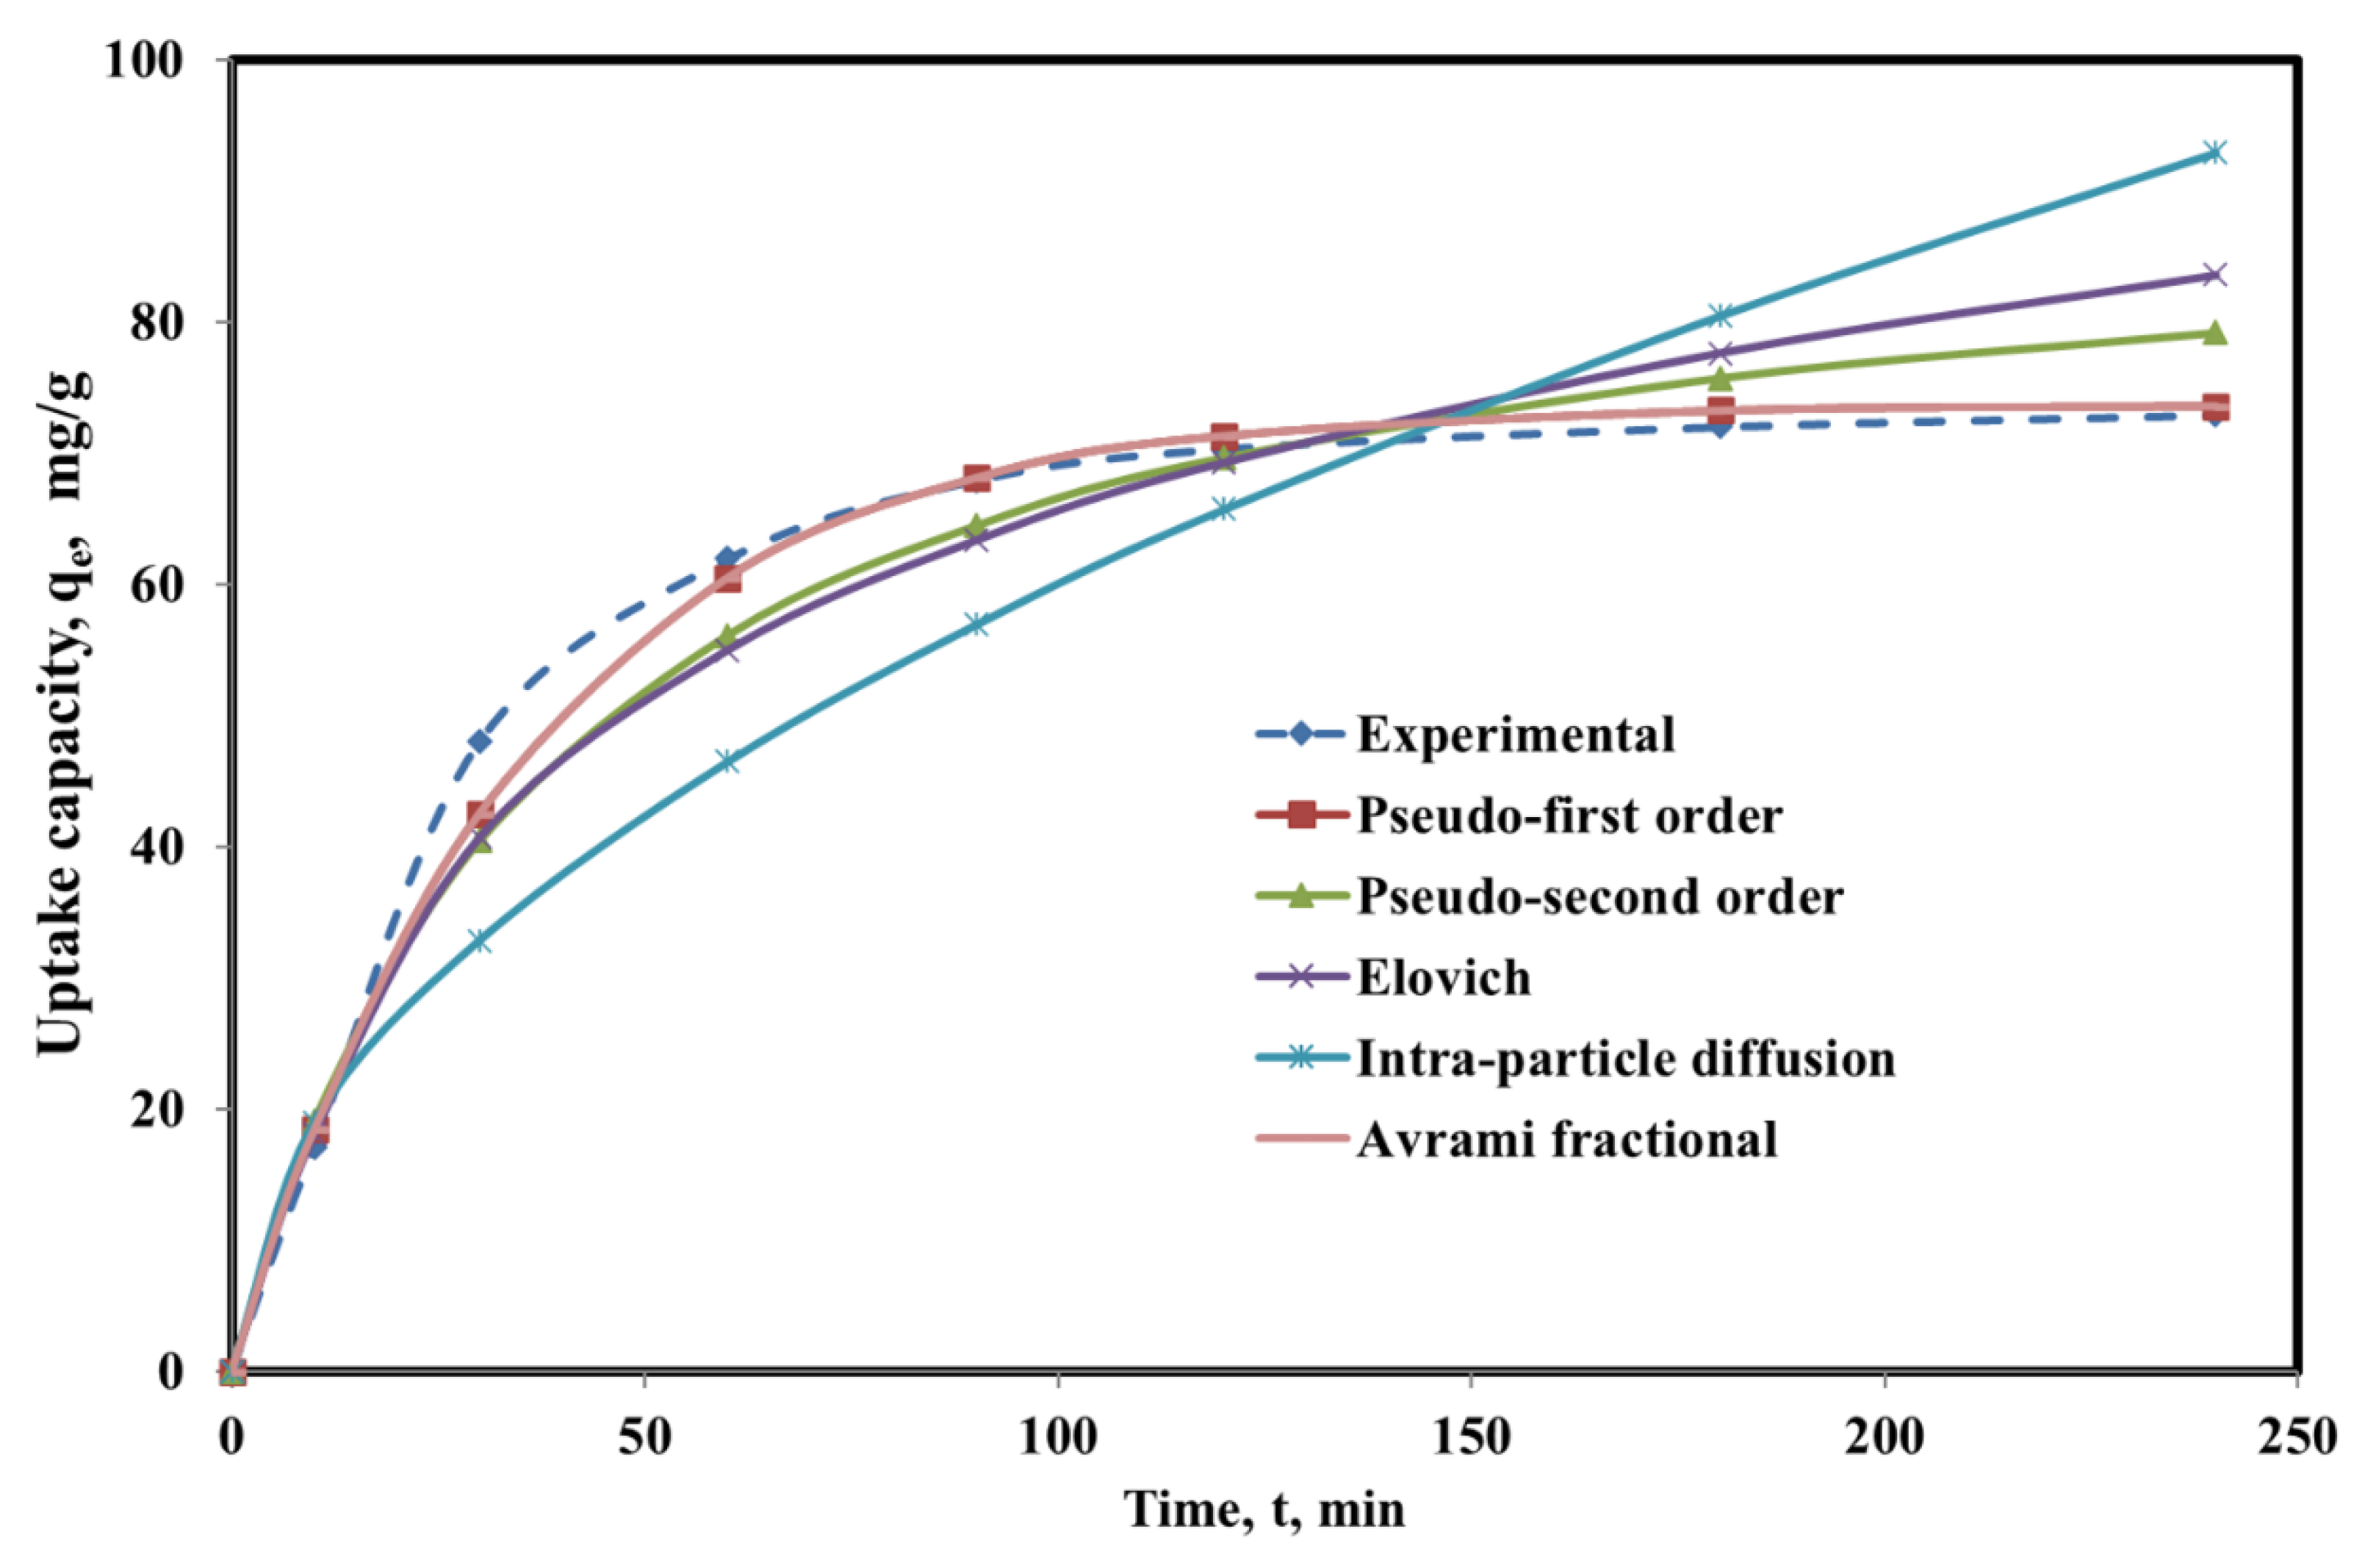
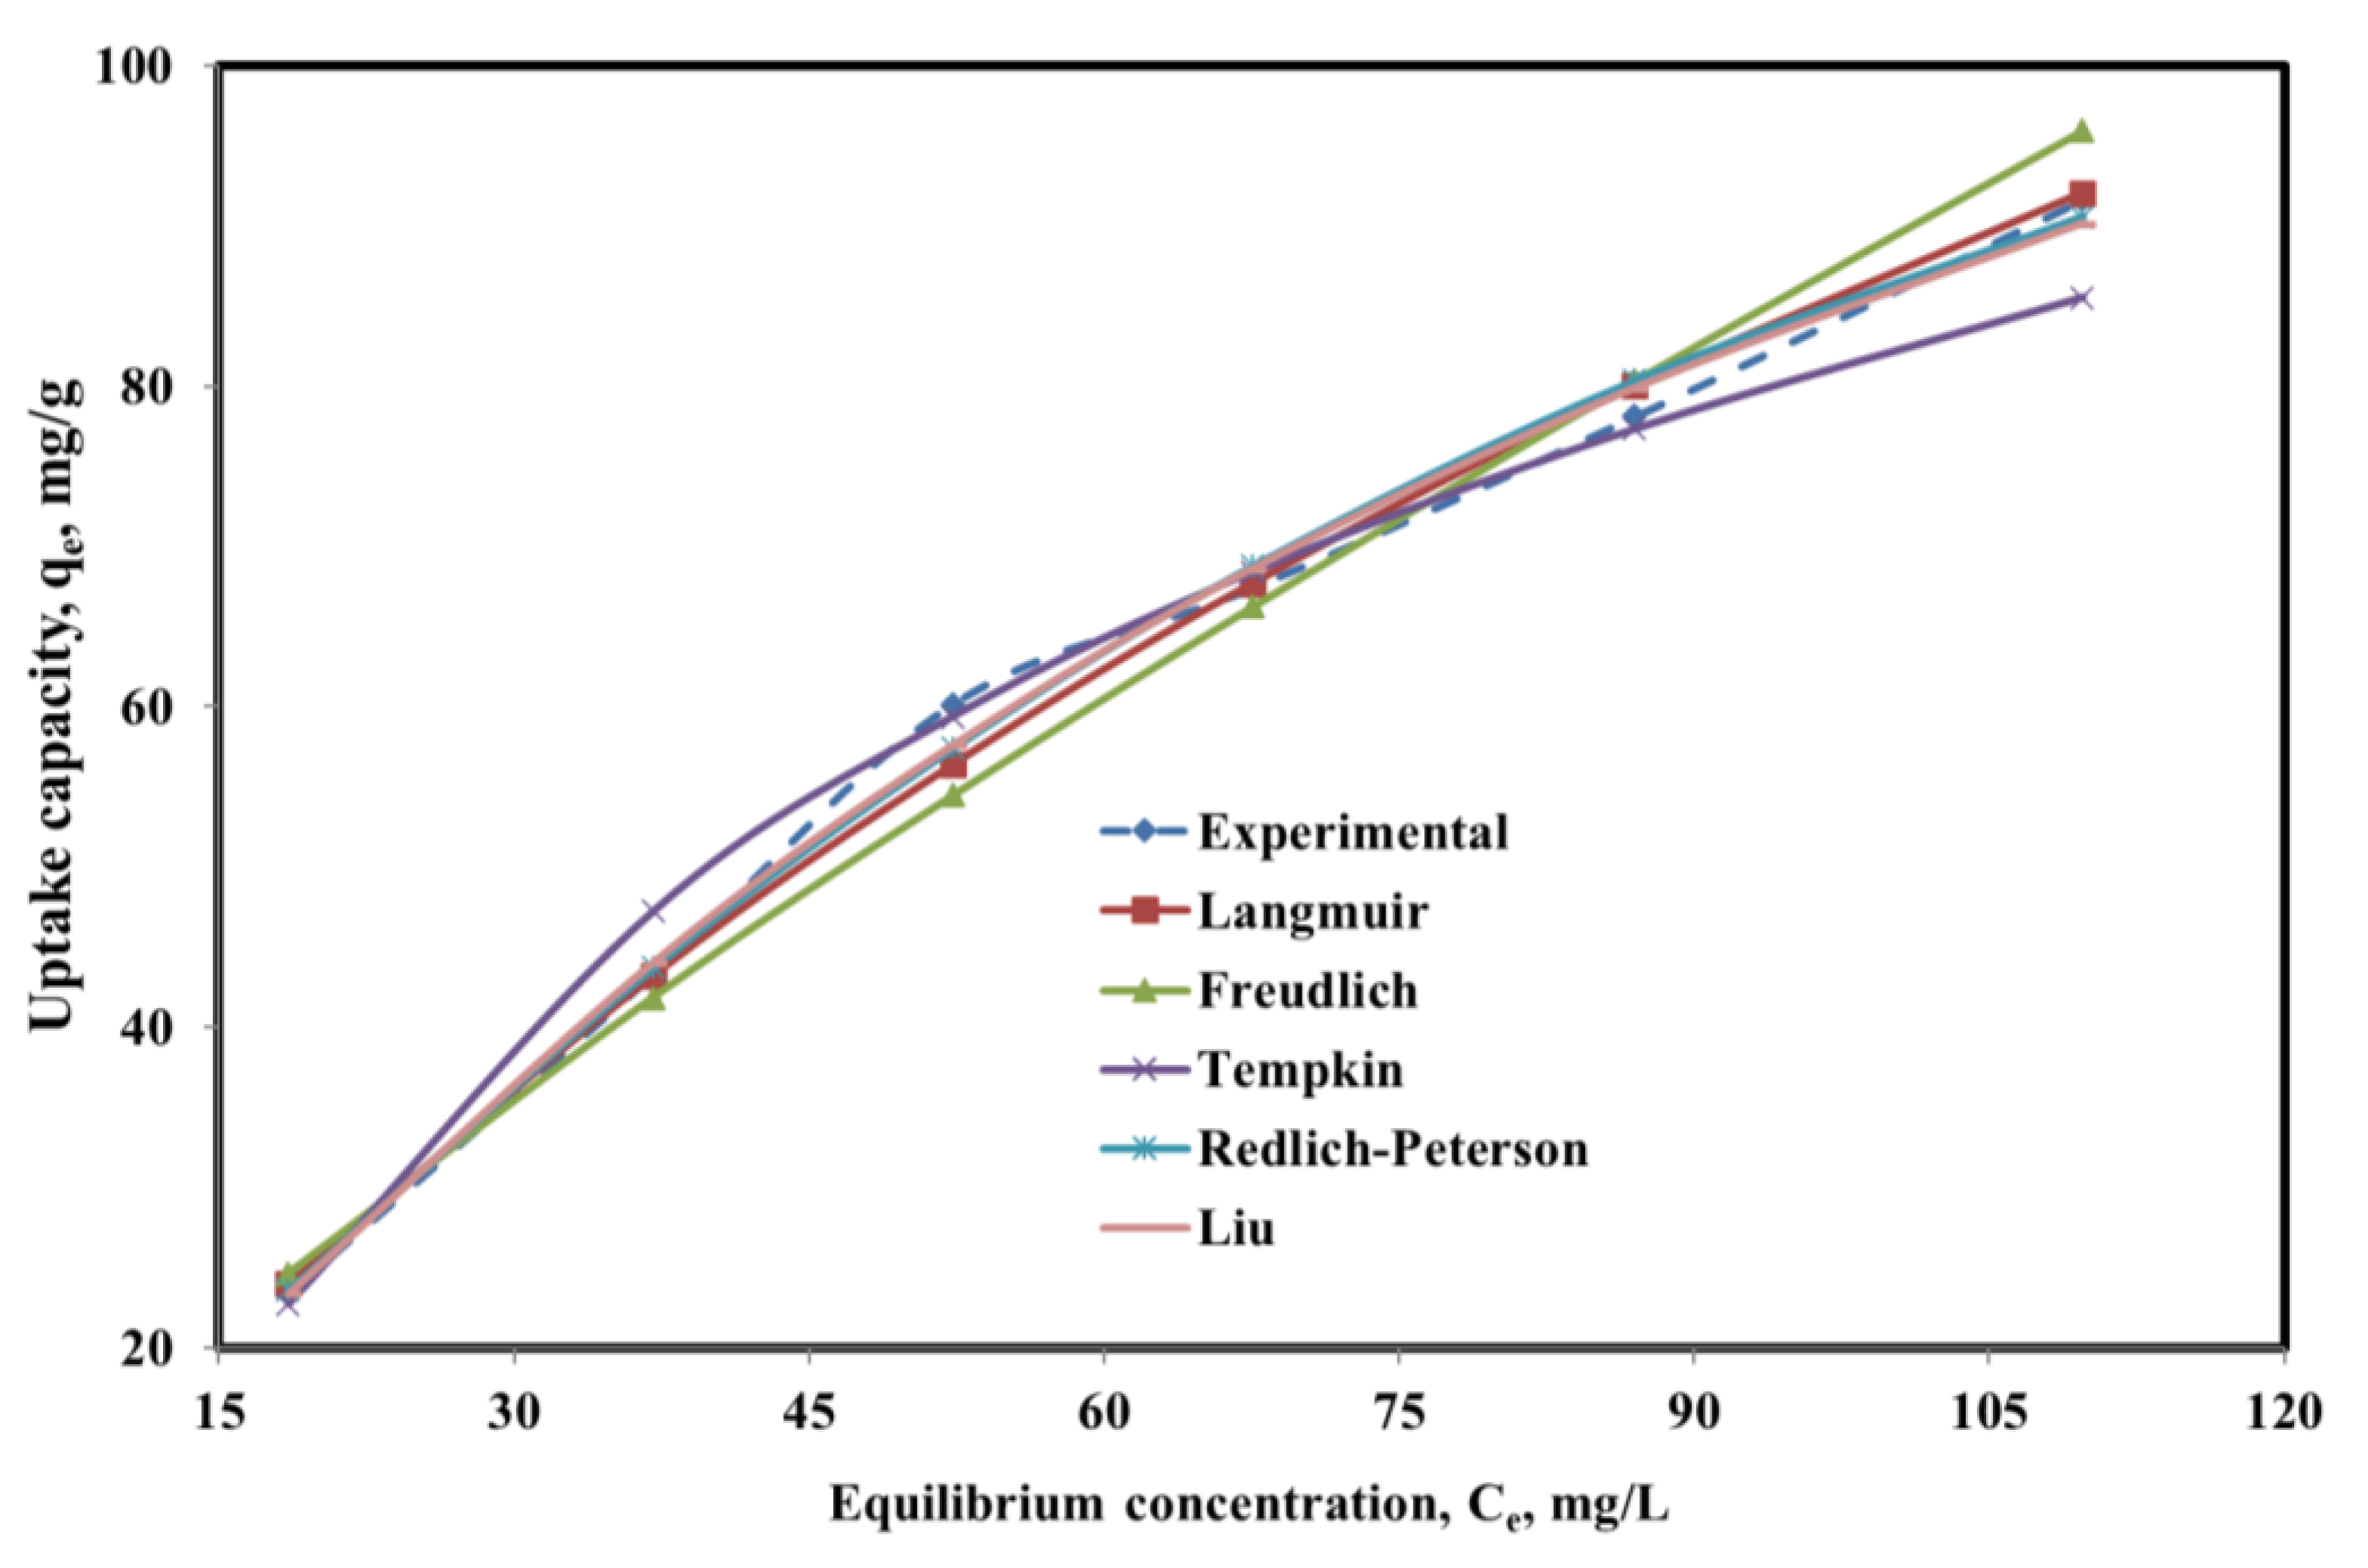
3.5. Adsorption Kinetics and Equilibrium Studies
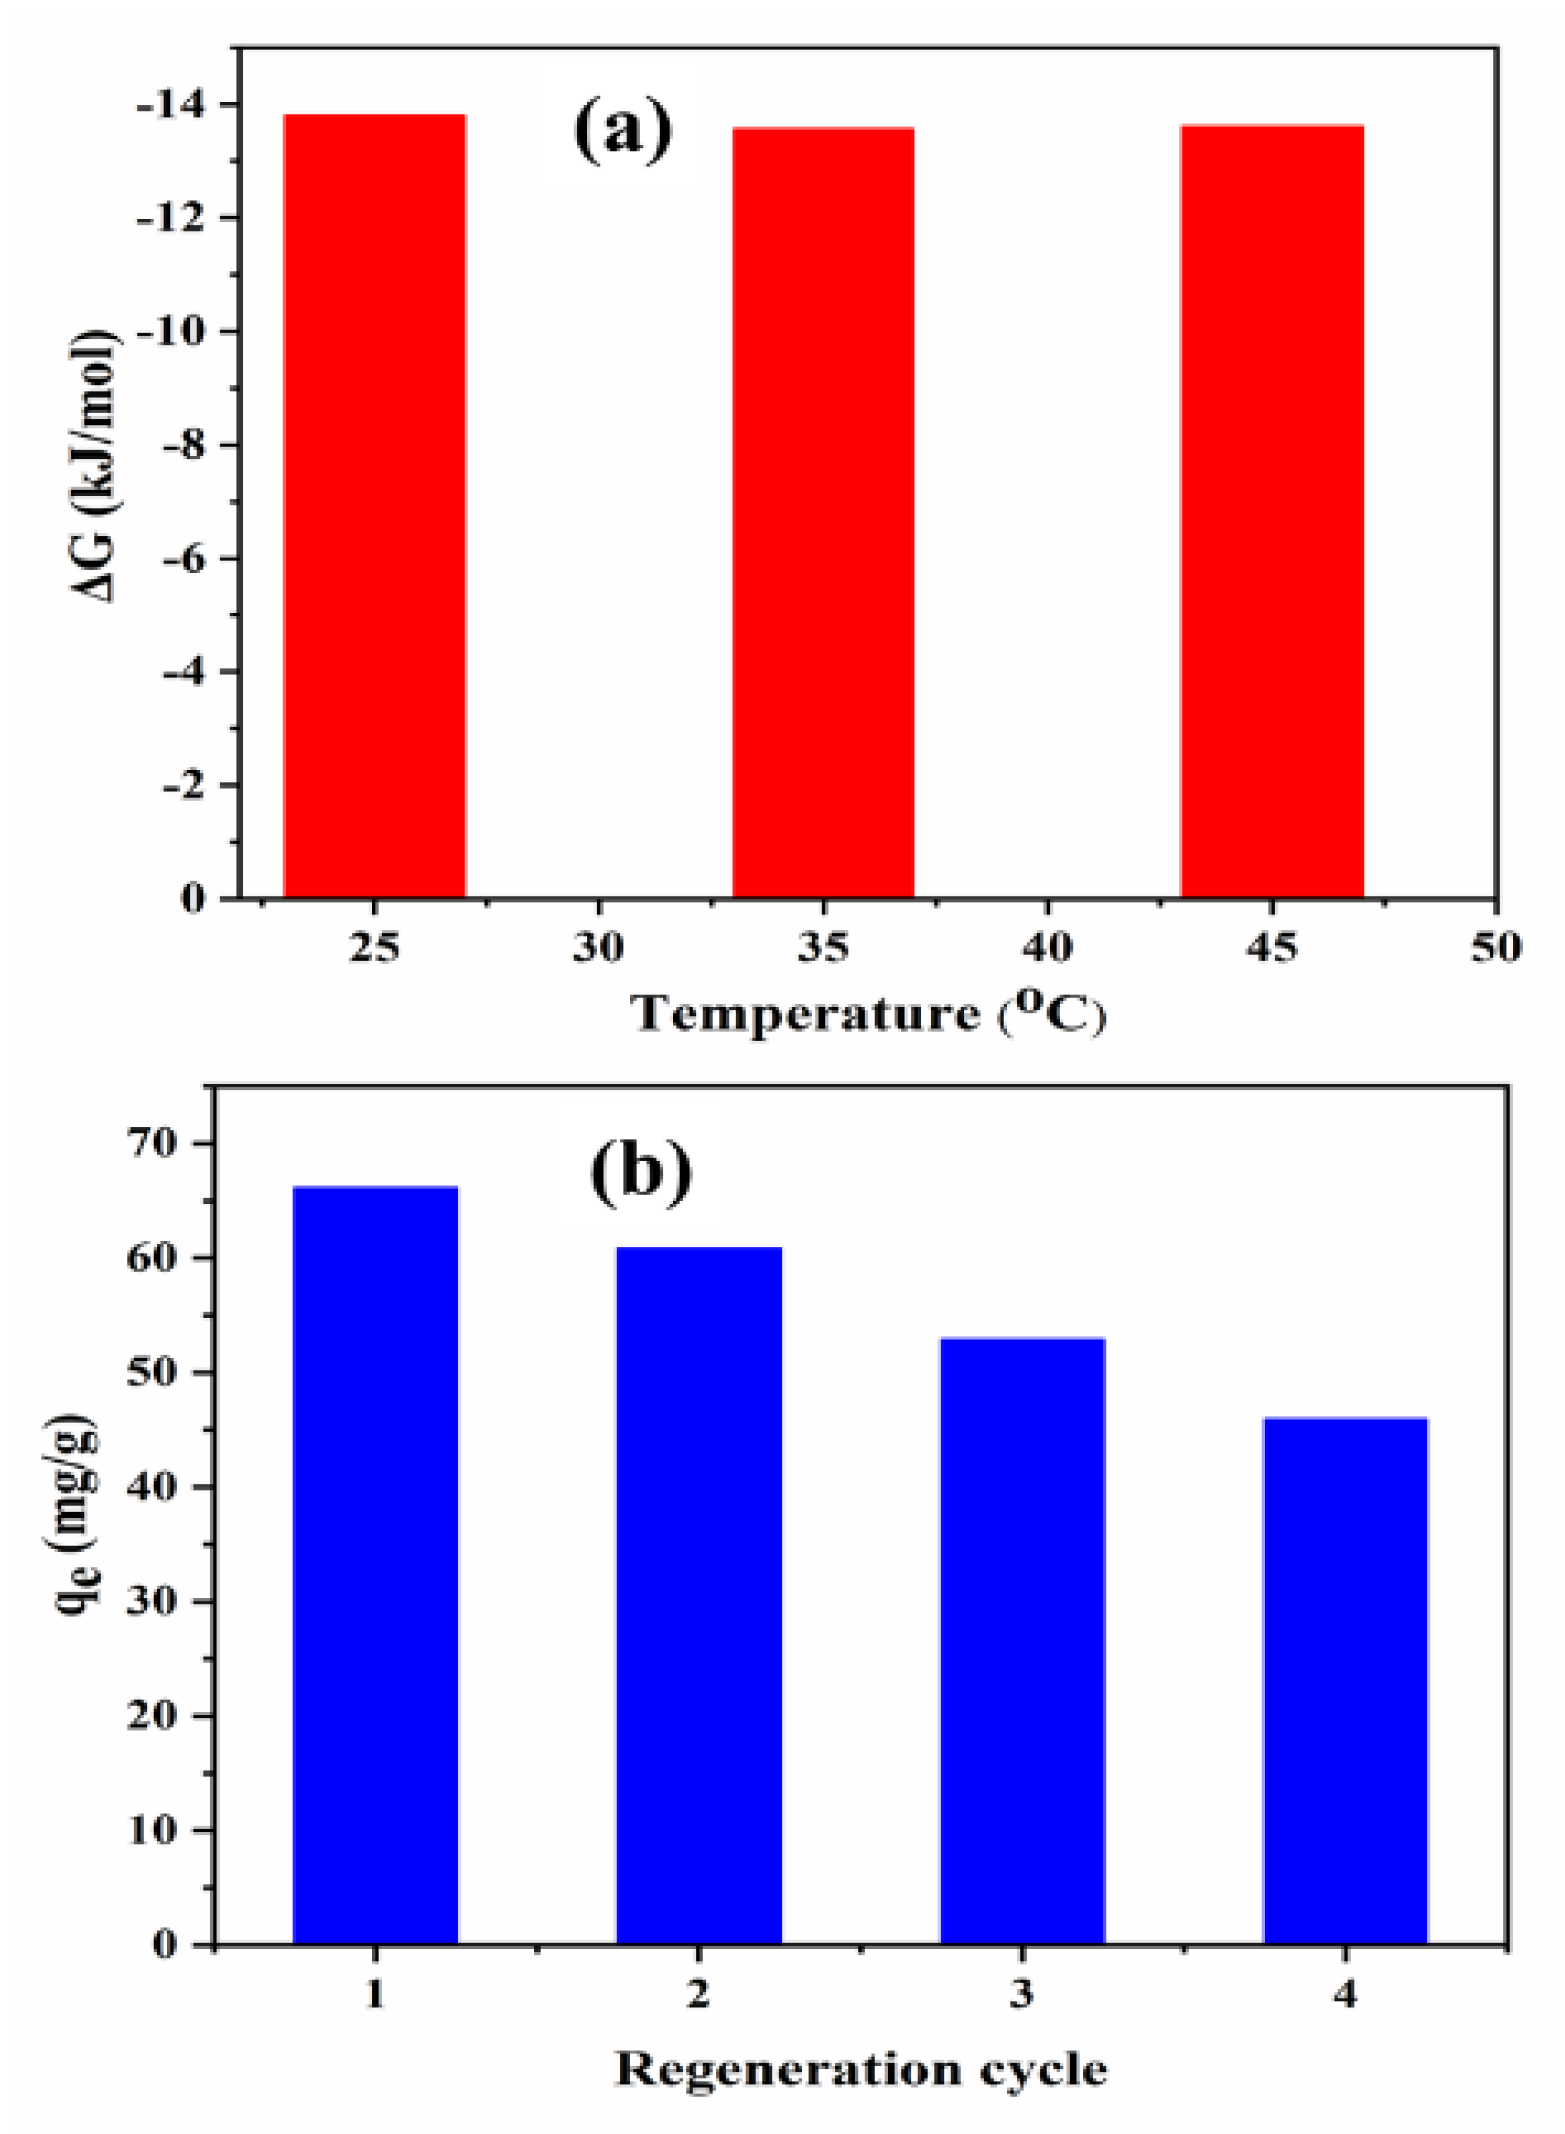
3.6. Thermodynamics and Regeneration Studies of SBAC-MgAlFe-LDH Composite
3.7. Possible Mechanisms of Phenol Uptake
4. Conclusions
Author Contributions
Funding
Institutional Review Board Statement
Informed Consent Statement
Data Availability Statement
Acknowledgments
Conflicts of Interest
Sample Availability
References
- Mu’azu, N.; Jarrah, N.; Zubair, M.; Alagha, O. Removal of Phenolic Compounds from Water Using Sewage Sludge-Based Activated Carbon Adsorption: A Review. Int. J. Environ. Res. Public Health 2017, 14, 1094. [Google Scholar] [CrossRef] [Green Version]
- USEPA. 2006 Edition of the Drinking Water Standards and Health Advisories; No. EPA 822-R-06-013; Office of Water U.S. Environmental Protection Agency: Washington, DC, USA, 2006. Available online: https://health.umsu.ac.ir/uploads/epa_drinking_water_standard.pdf (accessed on 1 March 2018).
- Mu’azu, N.D.; Alagha, O.; Anil, I. Systematic Modeling of Municipal Wastewater Activated Sludge Process and Treatment Plant Capacity Analysis Using GPS-X. Sustainability 2020, 12, 8182. [Google Scholar] [CrossRef]
- Ping, F.; Chaoping, C.; Dingsheng, C.; Zhixiong, T. Carbonaceous adsorbents prepared from sewage sludge and its application for Hg 0 adsorption in simulated flue gas. Chin. J. Chem. Eng. 2010, 18, 231–238. [Google Scholar]
- Silva, T.L.; Ronix, A.; Pezoti, O.; Souza, L.S.; Leandro, P.K.T.; Bedin, K.C.; Beltrame, K.K.; Cazetta, A.L.; Almeida, V.C. Mesoporous activated carbon from industrial laundry sewage sludge: Adsorption studies of reactive dye Remazol Brilliant Blue R. Chem. Eng. J. 2016, 303, 467–476. [Google Scholar] [CrossRef]
- Zubair, M.; Ihsanullah, I.; Aziz, H.A.; Ahmad, M.A.; Al-Harthi, M.A. Sustainable wastewater treatment by biochar/layered double hydroxide composites: Progress, challenges, and outlook. Bioresour. Technol. 2020, 319, 124128. [Google Scholar] [CrossRef]
- Zubair, M.; Daud, M.; McKay, G.; Shehzad, F.; Al-Harthi, M.A. Recent progress in layered double hydroxides (LDH)-containing hybrids as adsorbents for water remediation. Appl. Clay Sci. 2017, 143, 279–292. [Google Scholar] [CrossRef]
- Mu’azu, N.D.; Jarrah, N.; Kazeem, T.S.; Zubair, M.; Al-Harthi, M. Bentonite-layered double hydroxide composite for enhanced aqueous adsorption of Eriochrome Black T. Appl. Clay Sci. 2018, 161, 23–34. [Google Scholar] [CrossRef]
- Zubair, M.; Jarrah, N.; Khalid, A.; Manzar, M.S.; Kazeem, T.S.; Al-Harthi, M.A. Starch-NiFe-layered double hydroxide composites: Efficient removal of methyl orange from aqueous phase. J. Mol. Liq. 2018, 249, 254–264. [Google Scholar] [CrossRef]
- Kazeem, T.S.; Zubair, M.; Daud, M.; Mu’azu, N.D.; Al-Harthi, M.A. Graphene/ternary layered double hydroxide composites: Efficient removal of anionic dye from aqueous phase. Korean J. Chem. Eng. 2019, 36, 1057–1068. [Google Scholar] [CrossRef]
- Contreras-Ruiz, J.C.; Martínez-Gallegos, S.; García-Rivas, J.L.; Illescas, J.; González-Juárez, J.C.; Macedo Miranda, G.; Ordoñez Regil, E. Influence of the Textural Parameters of LDH-TiO2 Composites on Phenol Adsorption and Photodegradation Capacities. Int. J. Photoenergy 2019, 2019, 5783507. [Google Scholar] [CrossRef] [Green Version]
- Blaisi, N.I.; Zubair, M. Date palm ash-MgAl-layered double hydroxide composite: Sustainable adsorbent for effective removal of methyl orange and eriochrome black-T from aqueous phase. Environ. Sci. Pollut. Res. 2018, 25, 34319–34331. [Google Scholar] [CrossRef]
- Mu’azu, N.D.; Jarrah, N.; Zubair, M.; Manzar, M.S.; Kazeem, T.S.; Qureshi, A.; Haladu, S.A.; Blaisi, N.I.; Essa, M.H.; Al-Harthi, M.A. Mechanistic aspects of magnetic MgAlNi barium-ferrite nanocomposites enhanced adsorptive removal of an anionic dye from aqueous phase. J. Saudi Chem. Soc. 2020, 24, 715–732. [Google Scholar] [CrossRef]
- Xu, H.; Zhu, S.; Xia, M.; Wang, F. Rapid and efficient removal of diclofenac sodium from aqueous solution via ternary core-shell CS@PANI@LDH composite: Experimental and adsorption mechanism study. J. Hazard. Mater. 2021, 402, 123815. [Google Scholar] [CrossRef] [PubMed]
- Drewnowski, J.; Szeląg, B.; Xie, L.; Lu, X.; Ganesapillai, M.; Deb, C.K.; Szulżyk-Cieplak, J.; Łagód, G. The Influence of COD Fraction Forms and Molecules Size on Hydrolysis Process Developed by Comparative OUR Studies in Activated Sludge Modelling. Molecules 2020, 25, 929. [Google Scholar] [CrossRef] [Green Version]
- Kameda, T.; Horikoshi, K.; Kikuchi, H.; Kitagawa, F.; Kumagai, S.; Saito, Y.; Kondo, M.; Jimbo, Y.; Yoshioka, T. Kinetic and equilibrium analyses of lactate adsorption by Cu-Al and Mg-Al layered double hydroxides (Cu-Al LDH and Mg-Al LDH) and Cu-Al and Mg-Al layered double oxides (Cu-Al LDO and Mg-Al LDO). Nano-Struct. Nano-Objects 2021, 25, 100656. [Google Scholar] [CrossRef]
- Mu’azu, N.D.; Zubair, M.; Jarrah, N.; Alagha, O.; Al-Harthi, M.A.; Essa, M.H. Sewage Sludge ZnCl2-Activated Carbon Intercalated MgFe–LDH Nanocomposites: Insight of the Sorption Mechanism of Improved Removal of Phenol from Water. Int. J. Mol. Sci. 2020, 21, 1563. [Google Scholar] [CrossRef] [Green Version]
- Juretic, D.; Kusic, H.; Dionysiou, D.D.; Bozic, A.L. Environmental aspects of photooxidative treatment of phenolic compounds. J. Hazard. Mater. 2013, 262, 377–386. [Google Scholar] [CrossRef]
- Sun, Y.; Zhou, J.; Cai, W.; Zhao, R.; Yuan, J. Hierarchically porous NiAl-LDH nanoparticles as highly efficient adsorbent for p-nitrophenol from water. Appl. Surf. Sci. 2015, 349, 897–903. [Google Scholar] [CrossRef]
- He, X.; Wang, B.; Zhang, Q. Phenols removal from water by precursor preparation for MgAl layered double hydroxide: Isotherm, kinetic and mechanism. Mater. Chem. Phys. 2019, 221, 108–117. [Google Scholar] [CrossRef]
- Zhang, Z.; Sun, D.; Li, G.; Zhang, B.; Zhang, B.; Qiu, S.; Li, Y.; Wu, T. Calcined products of Mg–Al layered double hydroxides/single-walled carbon nanotubes nanocomposites for expeditious removal of phenol and 4-chlorophenol from aqueous solutions. Colloids Surf. A Physicochem. Eng. Asp. 2019, 565, 143–153. [Google Scholar] [CrossRef]
- Dos Reis, G.S.; Adebayo, M.A.; Sampaio, C.H.; Lima, E.C.; Thue, P.S.; de Brum, I.A.S.; Dias, S.L.P.; Pavan, F.A. Removal of phenolic compounds from aqueous solutions using sludge-based activated carbons prepared by conventional heating and microwave-assisted pyrolysis. Water Air Soil Pollut. 2017, 228, 33. [Google Scholar] [CrossRef]
- Sierra, I.; Iriarte-Velasco, U.; Gamero, M.; Aguayo, A.T. Upgrading of sewage sludge by demineralization and physical activation with CO2: Application for methylene blue and phenol removal. Microporous Mesoporous Mater. 2017, 250, 88–99. [Google Scholar] [CrossRef]
- Rozada, F.; Otero, M.; Parra, J.B.; Morán, A.; García, A.I. Producing adsorbents from sewage sludge and discarded tyres: Characterization and utilization for the removal of pollutants from water. Chem. Eng. J. 2005, 114, 161–169. [Google Scholar] [CrossRef]
- Liadi, M.A.; Mu’azu, N.D.; Jarrah, N.; Zubair, M.; Alagha, O.; Al-Harthi, M.A.; Essa, M.H. Comparative performance study of ZnCl2 and NaOH sludge based activated carbon for simultaneous aqueous uptake of phenolic compounds. Int. J. Environ. Anal. Chem. 2020, 1–25. [Google Scholar] [CrossRef]
- Kong, L.; Xiong, Y.; Sun, L.; Tian, S.; Xu, X.; Zhao, C.; Luo, R.; Yang, X.; Shih, K.; Liu, H. Sorption performance and mechanism of a sludge-derived char as porous carbon-based hybrid adsorbent for benzene derivatives in aqueous solution. J. Hazard. Mater. 2014, 274, 205–211. [Google Scholar] [CrossRef]
- Zou, J.; Dai, Y.; Wang, X.; Ren, Z.; Tian, C.; Pan, K.; Li, S.; Abuobeidah, M.; Fu, H. Structure and adsorption properties of sewage sludge-derived carbon with removal of inorganic impurities and high porosity. Bioresour. Technol. 2013, 142, 209–217. [Google Scholar] [CrossRef] [PubMed]
- Bousba, S.; Meniai, A.H. Removal of phenol from water by adsorption onto sewage sludge based adsorbent. Chem. Eng. Trans. 2014, 40, 235–240. [Google Scholar] [CrossRef]
- Xin, W.; Li, X.; Song, Y. Facile synthesis of sludge-based mesoporous carbon with flocculants: Effect of template on the synthetic behavior and improved phenol capture. J. Clean. Prod. 2021, 282, 124458. [Google Scholar] [CrossRef]
- Manzar, M.S.; Khan, G.; dos Santos Lins, P.V.; Zubair, M.; Khan, S.U.; Selvasembian, R.; Meili, L.; Blaisi, N.I.; Nawaz, M.; Abdul Aziz, H.; et al. RSM-CCD optimization approach for the adsorptive removal of Eriochrome Black T from aqueous system using steel slag-based adsorbent: Characterization, Isotherm, Kinetic modeling and thermodynamic analysis. J. Mol. Liq. 2021, 339, 116714. [Google Scholar] [CrossRef]
- Haladu, S.A.; Mu’azu, N.D.; Jarrah, N.; Zubair, M.; Ali, S.A. Investigation of biodegradable polyaspartate as an effective chelant for washing of lead from soil: Response surface methodology approach. Int. J. Environ. Anal. Chem. 2020, 1–18. [Google Scholar] [CrossRef]
- Usman, A.K.; Mu’azu, N.D.; Lukman, S.; Essa, M.H.; Bukhari, A.A.; Al-Malack, M.H. Removal of Lead and Copper from Contaminated Mixed Clay Soils Using Pulsed Electrokinetics. Soil Sediment Contam. Int. J. 2020, 29, 465–480. [Google Scholar] [CrossRef]
- Myers, R.H.; Montgomery, D.C.; Anderson-Cook, C.M. Response Surface Methodology: Process and Product Optimization Using Designed Experiments; John Wiley & Sons: New York, NY, USA, 2016; ISBN 1118916034. [Google Scholar]
- Anderson, M.J.; Whitcomb, P.J. RSM Simplified: Optimizing Processes Using Response Surface Methods for Design of Experiments; Productivity Press: New York, NY, USA, 2016; ISBN 1498745997. [Google Scholar]
- Alagha, O.; Manzar, M.S.; Zubair, M.; Anil, I.; Mu’azu, N.D.; Qureshi, A. Magnetic Mg-Fe/LDH intercalated activated carbon composites for nitrate and phosphate removal from wastewater: Insight into behavior and mechanisms. Nanomaterials 2020, 10, 1361. [Google Scholar] [CrossRef] [PubMed]
- Mu’azu, N.D.; Essa, M.H.; Lukman, S. Augmenting granular activated carbon with natural clay for multicomponent sorption of heavy metals from aqueous solutions. Water Sci. Technol. 2017, 76, 2213–2221. [Google Scholar] [CrossRef]
- Mu’azu, N.D.; Jarrah, N.; Zubair, M.; Manzar, M.S.; Kazeem, T.S.; Al-Harthi, M. Evaluation of novel Mg/Al/Ni-BaFe ternary layered hydroxides uptake of methyl orange dye from water. Korean J. Chem. Eng. 2019, 36, 2008–2022. [Google Scholar] [CrossRef]
- Ait-Amir, B.; Pougnet, P.; El Hami, A. 6—Meta-Model Development. In Embedded Mechatronic Systems 2, 2nd ed.; El Hami, A., Pougnet, P., Eds.; ISTE: London, UK, 2020; pp. 157–187. ISBN 978-1-78548-190-1. [Google Scholar]
- Ho, Y.S.; McKay, G. A Comparison of Chemisorption Kinetic Models Applied to Pollutant Removal on Various Sorbents. Process Saf. Environ. Prot. 1998, 76, 332–340. [Google Scholar] [CrossRef] [Green Version]
- Weber, W.J.; Morris, J.C. Kinetics of adsorption on carbon from solution. J. Sanit. Eng. Div. 1963, 89, 31–60. [Google Scholar] [CrossRef]
- Avrami, M. Kinetics of phase change. I General theory. J. Chem. Phys. 1939, 7, 1103–1112. [Google Scholar] [CrossRef]
- Johnson, R.D.; Arnold, F.H. The Temkin isotherm describes heterogeneous protein adsorption. Biochim. Biophys. Acta (BBA) Protein Struct. Mol. Enzymol. 1995, 1247, 293–297. [Google Scholar] [CrossRef]
- Freundlich, H.M.F. Over the adsorption in solution. J. Phys. Chem. 1906, 57, 1100–1107. [Google Scholar]
- Redlich, O.; Peterson, D.L. A useful adsorption isotherm. J. Phys. Chem. 1959, 63, 1024. [Google Scholar] [CrossRef]
- Langmuir, I. The constitution and fundamental properties of solids and liquids. Part, I. Solids. J. Am. Chem. Soc. 1916, 38, 2221–2295. [Google Scholar] [CrossRef] [Green Version]
- Liu, Y.; Xu, H.; Yang, S.-F.; Tay, J.-H. A general model for biosorption of Cd2+, Cu2+ and Zn2+ by aerobic granules. J. Biotechnol. 2003, 102, 233–239. [Google Scholar] [CrossRef]
- Zubair, M.; Manzar, M.S.; Mu’azu, N.D.; Anil, I.; Blaisi, N.I.; Al-Harthi, M.A. Functionalized MgAl-layered hydroxide intercalated date-palm biochar for Enhanced Uptake of Cationic dye: Kinetics, isotherm and thermodynamic studies. Appl. Clay Sci. 2020, 190, 105587. [Google Scholar] [CrossRef]
- Zubair, M.; Mu’azu, N.D.; Jarrah, N.; Blaisi, N.; Aziz, H.A.; Al-Harthi, M.A. Adsorption Behavior and Mechanism of Methylene Blue, Crystal Violet, Eriochrome Black T, and Methyl Orange Dyes onto Biochar-Derived Date Palm Fronds Waste Produced at Different Pyrolysis Conditions. Water Air Soil Pollut. 2020, 231, 240. [Google Scholar] [CrossRef]
- Hermosin, M.C.; Pavlovic, I.; Ulibarri, M.A.; Cornejo, J. Trichlorophenol adsorption on layered double hydroxide: A potential sorbent. J. Environ. Sci. Health Part A 1993, 28, 1875–1888. [Google Scholar] [CrossRef]
- Li, Y.; Bi, H.Y.; Mao, X.M.; Liang, Y.Q.; Li, H. Adsorption behavior and mechanism of core–shell magnetic rhamnolipid–layered double hydroxide nanohybrid for phenolic compounds from heavy metal–phenolic pollutants. Appl. Clay Sci. 2018, 162, 230–238. [Google Scholar] [CrossRef]
- Lukman, S.; Bukhari, A.; Al-Malack, M.H.; Mu’Azu, N.D.; Essa, M.H. Geochemical modeling of trivalent chromium migration in saline-sodic soil during Lasagna process: Impact on soil physicochemical properties. Sci. World J. 2014, 20. [Google Scholar] [CrossRef]
- Anderson, M.J.; Whitcomb, P.J. DOE Simplified: Practical Tools for Effective Experimentation; CRC Press: Boca Raton, FL, USA, 2017; ISBN 1498730906. [Google Scholar]
- Mu’azu, N.D.; Haladu, S.A.; Jarrah, N.; Zubair, M.; Essa, M.H.; Ali, S.A. Polyaspartate extraction of cadmium ions from contaminated soil: Evaluation and optimization using central composite design. J. Hazard. Mater. 2018, 342, 58–68. [Google Scholar] [CrossRef]
- Khalid, A.; Zubair, M. A comparative study on the adsorption of Eriochrome Black T dye from aqueous solution on graphene and acid-modified graphene. Arab. J. Sci. Eng. 2018, 43, 2167–2179. [Google Scholar] [CrossRef]
- Lupa, L.; Cocheci, L.; Pode, R.; Hulka, I. Phenol adsorption using Aliquat 336 functionalized Zn-Al layered double hydroxide. Sep. Purif. Technol. 2018, 196, 82–95. [Google Scholar] [CrossRef]
- Amayreh, M.; Chanbasha, B.; Alhooshani, K.; Mu’azu, N.D.; Lee, H.K. Determination of N-nitrosamines by automated dispersive liquid-liquid microextraction integrated with gas chromatography and mass spectrometry. J. Sep. Sci. 2015, 38, 1741–1748. [Google Scholar] [CrossRef] [PubMed]
- Thue, P.S.; Adebayo, M.A.; Lima, E.C.; Sieliechi, J.M.; Machado, F.M.; Dotto, G.L.; Vaghetti, J.C.P.; Dias, S.L.P. Preparation, characterization and application of microwave-assisted activated carbons from wood chips for removal of phenol from aqueous solution. J. Mol. Liq. 2016, 223, 1067–1080. [Google Scholar] [CrossRef]
- Manzar, M.S.; Zubair, M.; Khan, N.A.; Husain Khan, A.; Baig, U.; Aziz, M.A.; Blaisi, N.I.; Abdel-Magid, H.I.M. Adsorption behaviour of green coffee residues for decolourization of hazardous congo red and eriochrome black T dyes from aqueous solutions. Int. J. Environ. Anal. Chem. 2020. [Google Scholar] [CrossRef]
- Yu, Y.; Zhuang, Y.-Y.; Wang, Z.-H.; Qiu, M.-Q. Adsorption of water-soluble dyes onto modified resin. Chemosphere 2004, 54, 425–430. [Google Scholar] [CrossRef]
- Luo, Z.; Gao, M.; Yang, S.; Yang, Q. Adsorption of phenols on reduced-charge montmorillonites modified by bispyridinium dibromides: Mechanism, kinetics and thermodynamics studies. Colloids Surf. A Physicochem. Eng. Asp. 2015, 482, 222–230. [Google Scholar] [CrossRef]
- Liu, Q.-S.; Zheng, T.; Wang, P.; Jiang, J.-P.; Li, N. Adsorption isotherm, kinetic and mechanism studies of some substituted phenols on activated carbon fibers. Chem. Eng. J. 2010, 157, 348–356. [Google Scholar] [CrossRef]


| Factor | Lower Level (−1) | Mid-Level (0) | High-Lower (+1) | ||
| A | Temperature (°C) | 25 | 35 | 45 | |
| B | Initial phenol conc. (mg/L) | 22.4 | 73.7 | 125 | |
| C | Initial pH | 2 | 6 | 10 | |
| Operating Conditions | Responses | ||||
| Adsorption capacity (mg/g) | |||||
| Adsorption Test | A | B | C | Predicted | |
| 1 | 35 | 22 | 6 | 18.65 | |
| 2 | 35 | 73.5 | 6 | 56.7 | |
| 3 | 35 | 73.5 | 10 | 4.35 | |
| 4 | 25 | 73.5 | 6 | 45.71 | |
| 5 | 35 | 73.5 | 6 | 56.7 | |
| 6 | 35 | 125 | 6 | 97.61 | |
| 7 | 35 | 73.5 | 6 | 56.7 | |
| 8 | 25 | 125 | 2 | 14.38 | |
| 9 | 45 | 22 | 10 | 1.7 | |
| 10 | 45 | 22 | 2 | 7.00 | |
| 11 | 45 | 125 | 2 | 19.45 | |
| 12 | 25 | 125 | 10 | 7.58 | |
| 13 | 35 | 73.5 | 2 | 10.4 | |
| 14 | 25 | 22 | 2 | 3.85 | |
| 15 | 35 | 73.5 | 6 | 56.7 | |
| 16 | 45 | 125 | 10 | 9.17 | |
| 17 | 35 | 73.5 | 6 | 56.7 | |
| 18 | 25 | 22 | 10 | 2.03 | |
| 19 | 45 | 73.5 | 6 | 66.35 | |
| Variation Source | F-Value | p-Value |
|---|---|---|
| Model | 243.92 | <0.0001 a |
| A-Temperature | 38.26 | 0.0005 a |
| B-Initial conc. | 559.94 | <0.0001 a |
| C-Initial pH | 16.43 | 0.0049 a |
| AB | 0.3311 | 0.5830 b |
| A² | 0.2166 | 0.6558 b |
| B² | 1.01 | 0.3480 b |
| C² | 1194.05 | <0.0001 a |
| A²B | 351.66 | <0.0001 a |
| AB² | 23.98 | 0.0018 a |
| LOF | 0.9226 | 0.5066 a |
| R2 = 0.9978; | R2-Adjusted = 0.993; | R2-Predicted = 0. 959 |
| Operational Parameter | Target Goals for Each Scenario | Scenario Optimization Results | ||||||||
|---|---|---|---|---|---|---|---|---|---|---|
| 1 | 2 | 3 | 4 | 5 | 1 | 2 | 3 | 4 | 5 | |
| A | In range | minimize | minimize | minimize | In range | 45 | 25 | 25 | 28.5 | 35 |
| B | 22.4 | 22.4 | 73.7 | 125 | In range | 22.5 | 22.4 | 73.7 | 125 | 125 |
| C | In range | In range | In range | In range | In range | 5.89 | 5.963 | 5.91 | 5.848 | 5.82 |
| Phenol Uptake, qe, mg/g | maximize | maximize | maximize | maximize | maximize | 53.91 | 52.138 | 45.731 | 81.831 | 97.728 |
| Desirability | - | - | - | - | - | 0.539 | 0.722 | 0.674 | 0.824 | 0.990 |
| Model | Mathematical Representation | Parameter | Value |
|---|---|---|---|
| Pseudo-First Order | ) | qe (mg/g) | 73.65 |
| k1 | 0.0287 | ||
| R2 | 0.980 | ||
| RMSE | 2.706 | ||
| Pseudo-Second Order | qe (mg/g) | 91.7331 | |
| k2 | 0.0003 | ||
| R2 | 0.9401 | ||
| RMSE | 5.6701 | ||
| Elovich | α | 4.9400 | |
| β | 0.0485 | ||
| R2 | 0.9290 | ||
| RMSE | 125.2419 | ||
| Intra-Particle Diffusion | qt = kd t1/2 + C | Kd | 5.9960 |
| C | 0.0009 | ||
| R2 | 0.7063 | ||
| RMSE | 11.6561 | ||
| Avrami Fractional | qe= qmax [(1 − exp(Kav t)]n | qe | 73.65 |
| Kav | 0.0379 | ||
| n | 0.758 | ||
| R2 | 0.980 | ||
| RSME | 2.717 |
| Model | Mathematical Representation | Parameter | Value |
|---|---|---|---|
| Langmuir | qmax, (mg/g) | 216.76 | |
| KL | 0.0067 | ||
| R2 | 0.9976 | ||
| RMSE | 1.9100 | ||
| Freundlich | KF | 2.6567 | |
| 1/n | 0.7635 | ||
| R2 | 0.9867 | ||
| RMSE | 2.9146 | ||
| Tempkin | A | 0.1030 | |
| B | 35.2738 | ||
| R2 | 0.9832 | ||
| RMSE | 0.0041 | ||
| Redlich-Peterson | KR | 1.458 | |
| aR | 0.0009 | ||
| G | 0.989 | ||
| R2 | 0.9948 | ||
| RMSE | 1.910 | ||
| Liu | qmax | 153.94 | |
| Kg | 0.01227 | ||
| nL | 1.1602 | ||
| R2 | 0.996 | ||
| RMSE | 1.670 |
| SBAC Type/Activation Agent | Uptake Capacity (mg/g) | Operational Conditions | Reference | ||||
|---|---|---|---|---|---|---|---|
| Initial Conc. (mg/L) | pH | Dosage (mg) | Temp (°C) | Time (min) | |||
| ZnCl2-SBAC | 20.95 | 60 | 8 | 100 | 25 | 360 | [25] |
| NaOH-SBAC | 17.82 | 60 | 8 | 100 | 25 | 360 | [25] |
| ZnCl2-SBAC-MgFe–LDH | 138.69 | 100 | 6 | 10 | 25 | 180 | [17] |
| NaOH-SBAC-MgAlFe–LDH | 216.76 | 100 | 6 | 10 | 35 | 125 | This study |
| Conventional furnace activated SBAC | 34.36 | 200 | - | 30 | 25 | 120 | [22] |
| Microwave-activated SBAC | 32.96 | 200 | - | 30 | 25 | 120 | [22] |
| CO2-activated sludge | 32.4 | 250 | 5 | 15 | 20 | 72h | [23] |
| H2SO4 SBAC | 26.16 | 200 | - | 5g/L | 20 | 120 | [28] |
| Citric acid–ZnCl2-SBAC | 189.16 | 0.5 to 50 mmol | 4 | 1 g /L | 30 | 6 h | [26] |
| NaOH-SBAC | 96.15 | - | - | 10 | 25 | 60 | [27] |
| ZnCl2-SBAC | 81.6 | 2000 | - | 1 g/100 mL | 25 | 48 h | [24] |
| Polymer flocculants activated SBAC | 132.33 | 75 | 5 | − | 40 | − | [29] |
Publisher’s Note: MDPI stays neutral with regard to jurisdictional claims in published maps and institutional affiliations. |
© 2021 by the authors. Licensee MDPI, Basel, Switzerland. This article is an open access article distributed under the terms and conditions of the Creative Commons Attribution (CC BY) license (https://creativecommons.org/licenses/by/4.0/).
Share and Cite
Mu’azu, N.D.; Zubair, M.; Ihsanullah, I. Process Optimization and Modeling of Phenol Adsorption onto Sludge-Based Activated Carbon Intercalated MgAlFe Ternary Layered Double Hydroxide Composite. Molecules 2021, 26, 4266. https://doi.org/10.3390/molecules26144266
Mu’azu ND, Zubair M, Ihsanullah I. Process Optimization and Modeling of Phenol Adsorption onto Sludge-Based Activated Carbon Intercalated MgAlFe Ternary Layered Double Hydroxide Composite. Molecules. 2021; 26(14):4266. https://doi.org/10.3390/molecules26144266
Chicago/Turabian StyleMu’azu, Nuhu Dalhat, Mukarram Zubair, and Ihsanullah Ihsanullah. 2021. "Process Optimization and Modeling of Phenol Adsorption onto Sludge-Based Activated Carbon Intercalated MgAlFe Ternary Layered Double Hydroxide Composite" Molecules 26, no. 14: 4266. https://doi.org/10.3390/molecules26144266
APA StyleMu’azu, N. D., Zubair, M., & Ihsanullah, I. (2021). Process Optimization and Modeling of Phenol Adsorption onto Sludge-Based Activated Carbon Intercalated MgAlFe Ternary Layered Double Hydroxide Composite. Molecules, 26(14), 4266. https://doi.org/10.3390/molecules26144266