
The Effects of Food on Cannabidiol Bioaccessibility

 ,
, 
Abstract

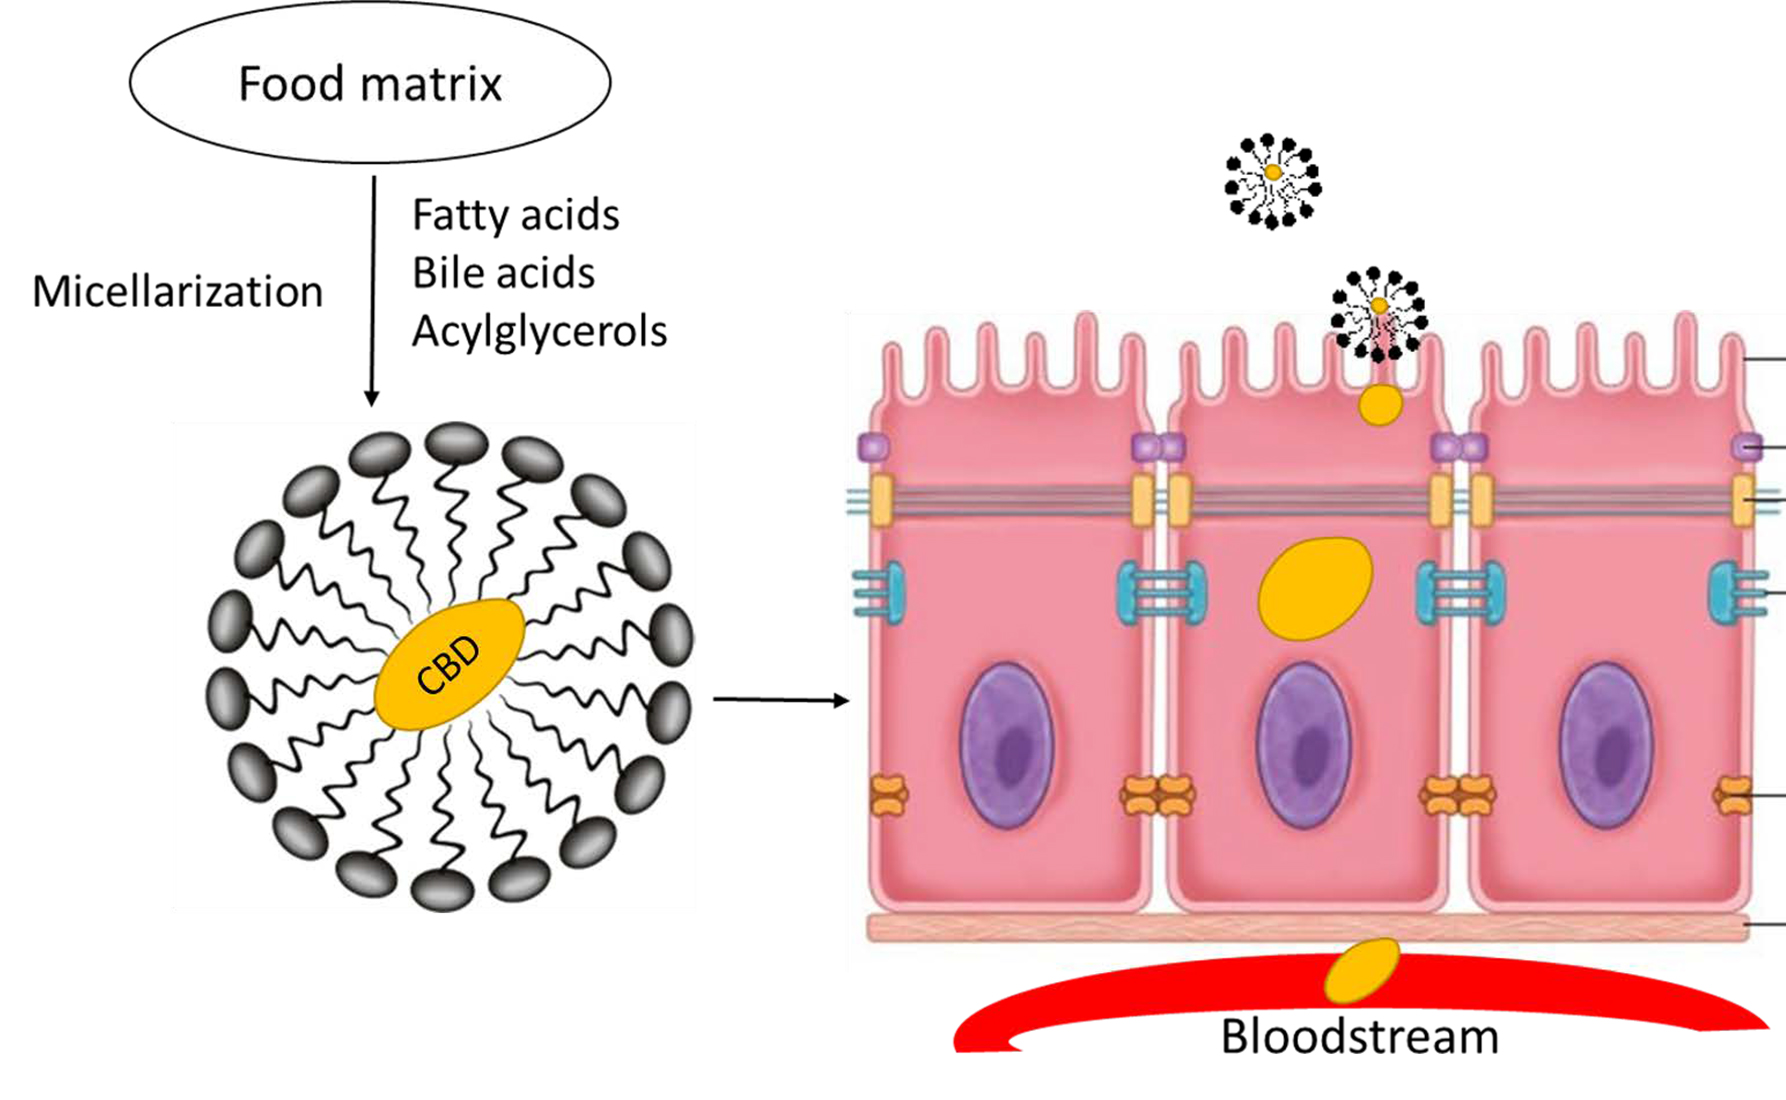
1. Introduction
2. Materials and Methods
2.1. Reagents and Chemicals
2.2. Gastric and Intestinal Phase Lipase Activity
2.3. Fasted State In Vitro Digestion of CBD
2.4. Fed State In Vitro Digestion of CBD
2.5. UPLC-MS Chromatograms of CBD Standard
2.6. Digestion Extractions of CBD and UPLC-MS Analysis
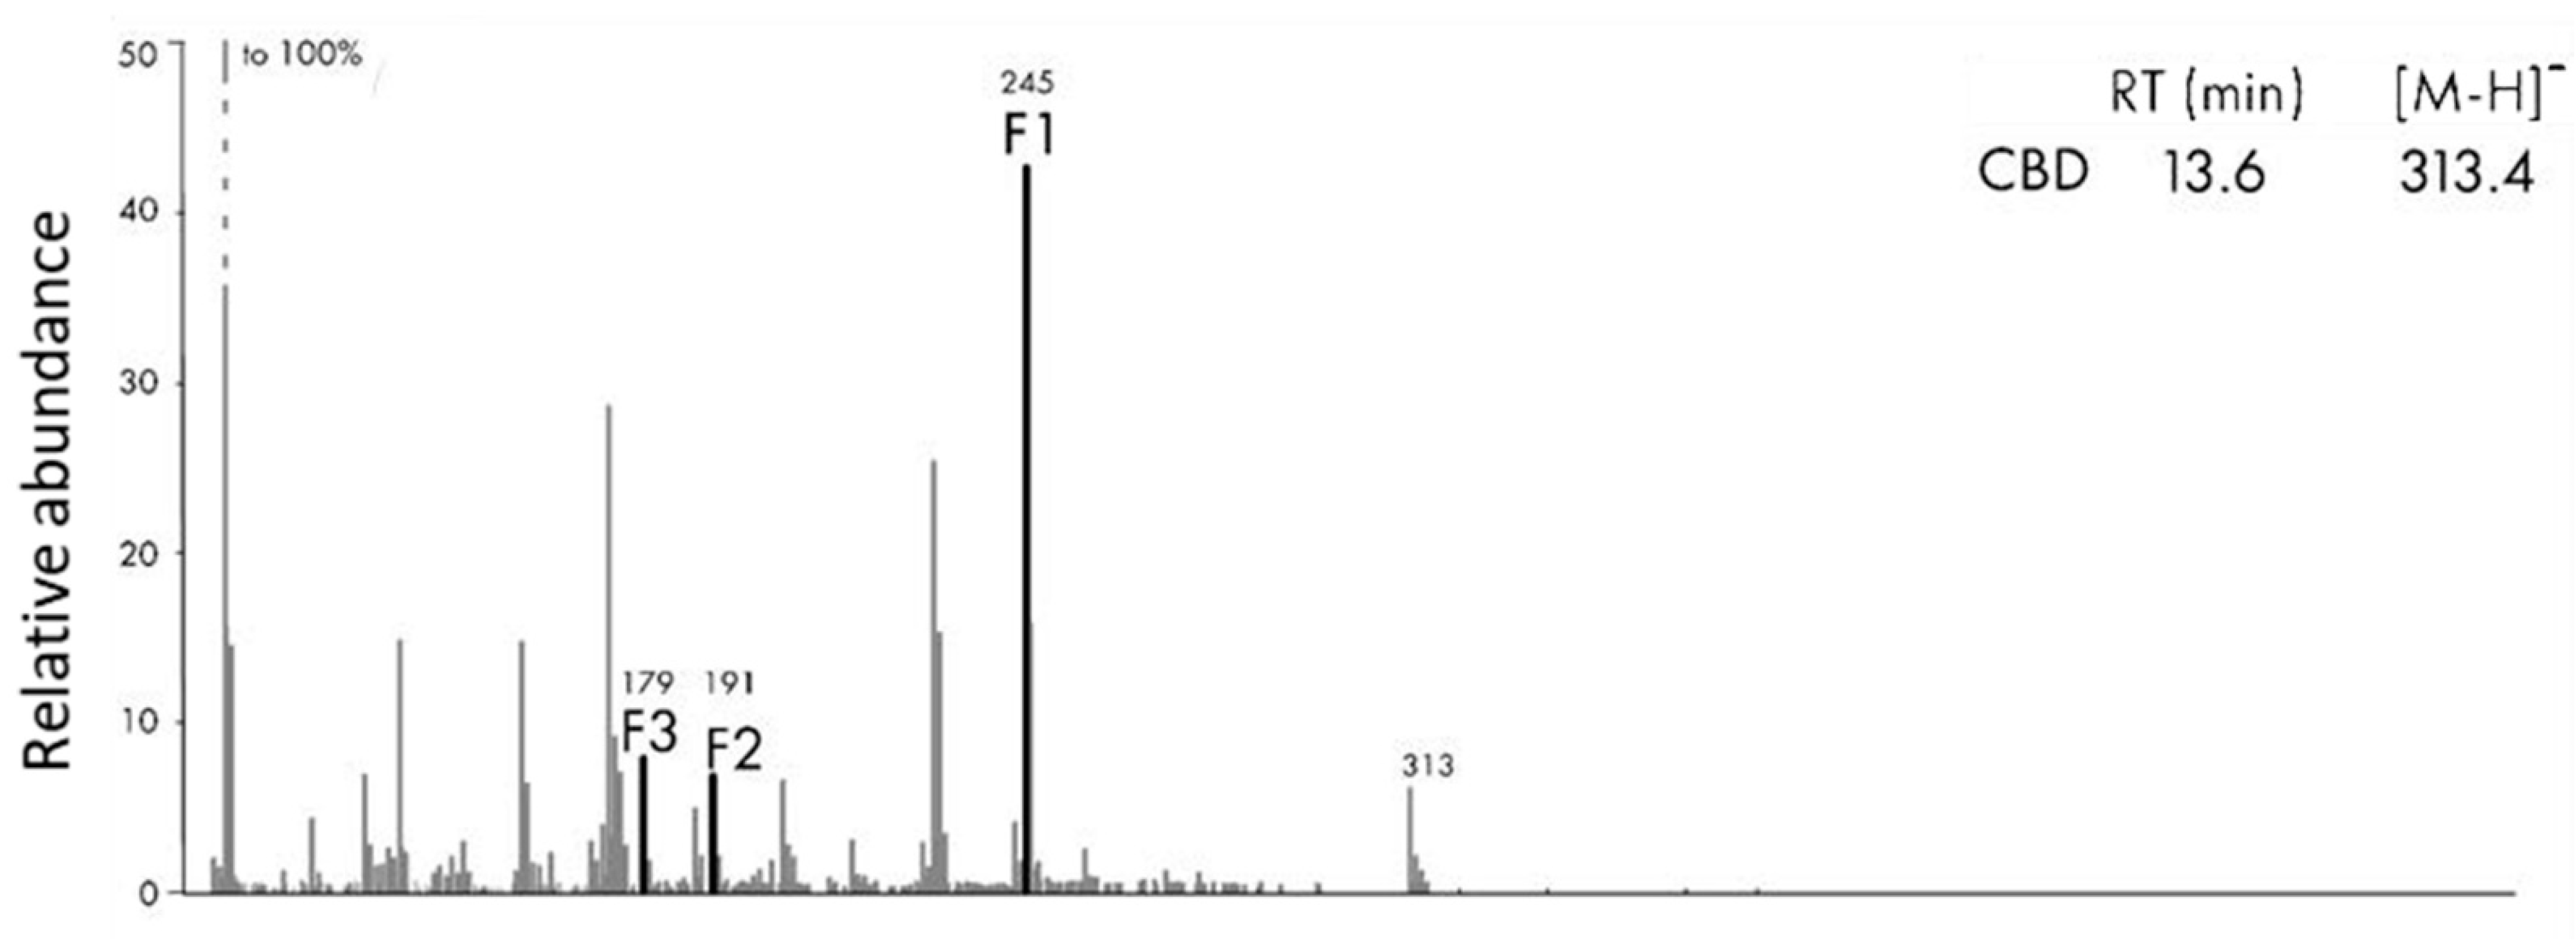
2.7. MS/MS Survey of Metabolites
3. Results
3.1. Gastric and Intestinal Phase Lipase Activity
3.2. Fasted State In Vitro Digestion of CBD
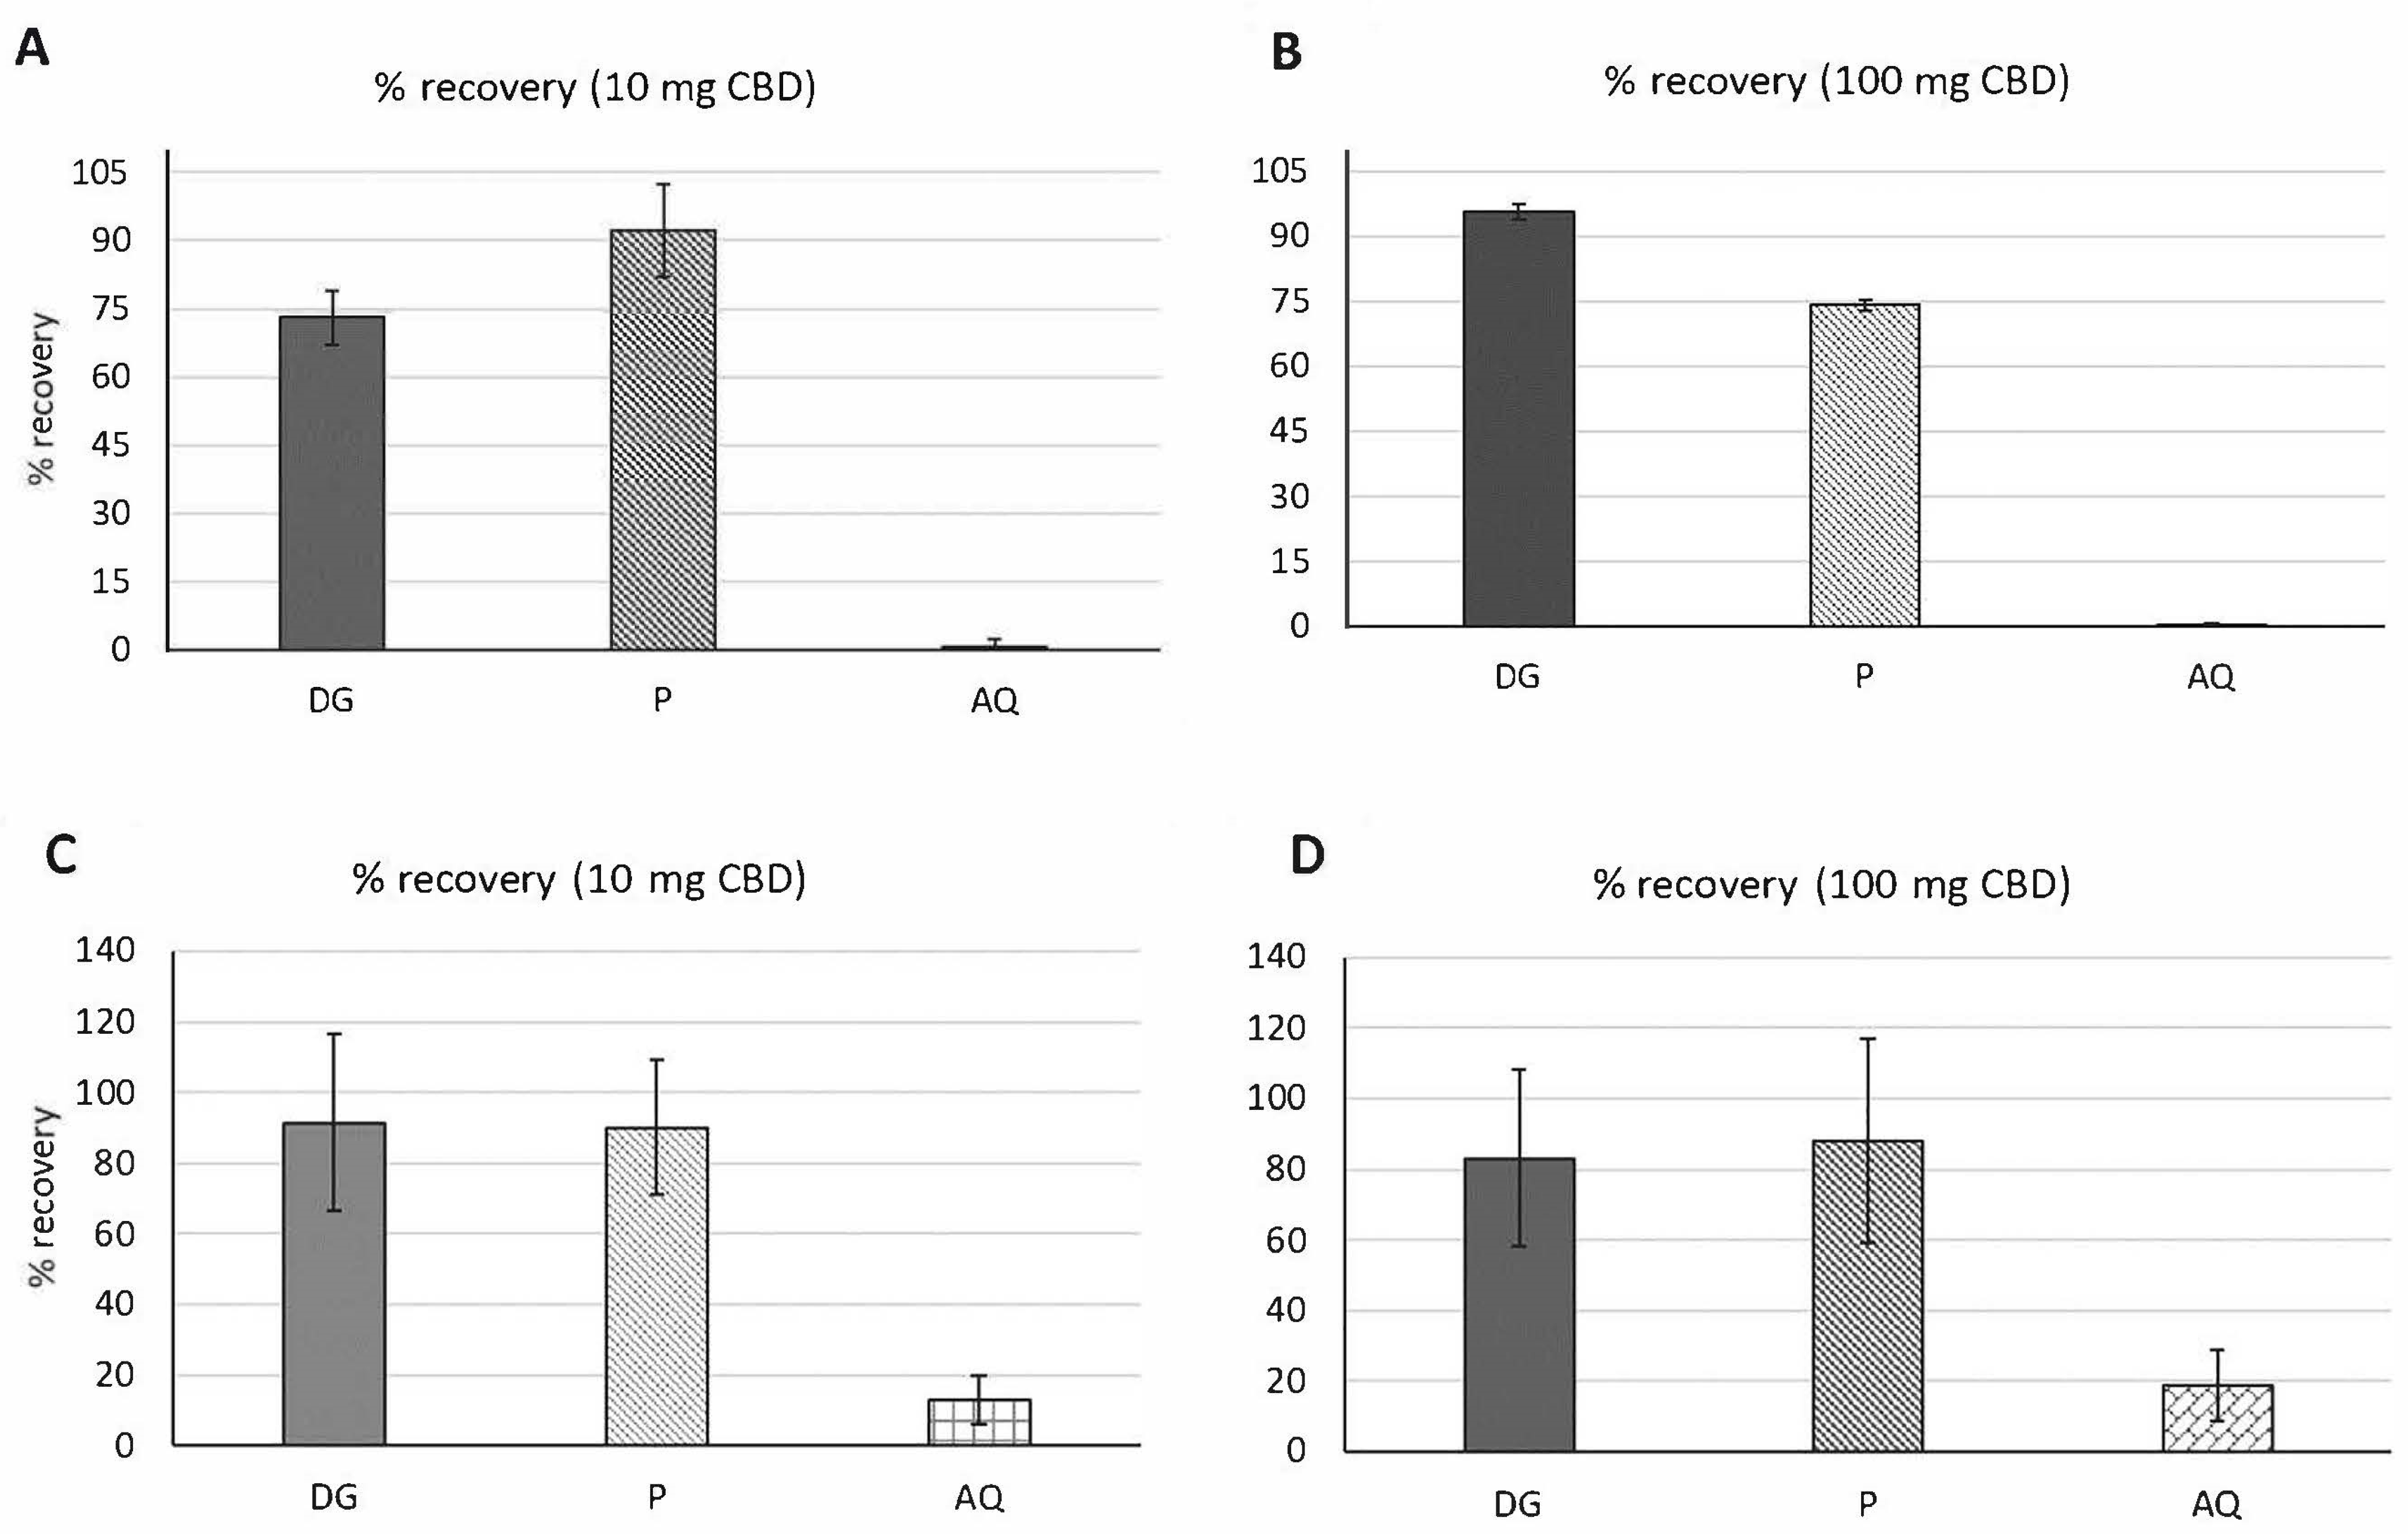
3.2.1. Percent (%) Recovery
3.2.2. Bioaccessibility
3.3. Fed State In Vitro Digestion of CBD
3.3.1. Percent (%) Recovery
3.3.2. Bioaccessibility
3.4. MS/MS Survey of Metabolites
4. Conclusions
Supplementary Materials
Author Contributions
Funding
Institutional Review Board Statement
Informed Consent Statement
Data Availability Statement
Acknowledgments
Conflicts of Interest
Sample Availability
References
- Andre, C.M.; Hausman, J.-F.; Guerriero, G. Cannabis sativa: The plant of the thousand and one molecules. Front. Plant Sci. 2016, 7, 19. [Google Scholar] [CrossRef]
- Thomas, B.F.; Elsohly, M. The Analytical Chemistry of Cannabis: Quality Assessment, Assurance, and Regulation of Medicinal Marijuana and Cannabinoid Preparations; Elsevier: Amsterdam, The Netherlands, 2015; pp. 27–41. ISBN 9780128046463. [Google Scholar]
- Pellati, F.; Borgonetti, V.; Brighenti, V.; Biagi, M.; Benvenuti, S.; Corsi, L. Cannabis sativa L. and nonpsychoactive cannabinoids: Their chemistry and role against oxidative stress, inflammation, and cancer. BioMed Res. Int. 2018, 2018, 1691428. [Google Scholar] [CrossRef]
- Morgan, C.J.; Das, R.K.; Joye, A.; Curran, H.V.; Kamboj, S.K. Cannabidiol reduces cigarette consumption in tobacco smokers: Preliminary findings. Addict. Behav. 2013, 38, 2433–2436. [Google Scholar] [CrossRef]
- Gobira, P.H.; Vilela, L.R.; Gonçalves, B.D.; Santos, R.P.; de Oliveira, A.C.; Vieira, L.B.; Aguiar, D.C.; Crippa, J.A.; Moreira, F.A. Cannabidiol, a Cannabis sativa constituent, inhibits cocaine-induced seizures in mice: Possible role of the mTOR pathway and reduction in glutamate release. Neurotoxicology 2015, 50, 116–121. [Google Scholar] [CrossRef] [PubMed]
- Alvarez, F.J.; Lafuente, H.; Rey-Santano, M.C.; Mielgo, V.E.; Gastiasoro, E.; Rueda, M.; Pertwee, R.G.; Castillo, A.I.; Romero, J.; Martinez-Orgado, J. Neuroprotective effects of the nonpsychoactive cannabinoid cannabidiol in hypoxic-ischemic newborn piglets. Pediatr. Res. 2008, 64, 653–658. [Google Scholar] [CrossRef] [PubMed]
- Juice, V.; Care, A.S.; Care, P. Understanding CBD: The Calming and Sleep Promoting Benefits of Cannabidiol. Available online: https://thesleepdoctor.com/2017/08/10/understanding-cbd/ (accessed on 8 June 2021).
- Holtkamp, M.; Hamerle, M. Cannabis use in epilepsy—Risks and benefits. In Handbook of Cannabis and Related Pathologies; Elsevier: London, UK, 2017; pp. 431–438. [Google Scholar]
- Batalla, A.; Janssen, H.; Gangadin, S.S.; Bossong, M.G. The potential of cannabidiol as a treatment for psychosis and addiction: Who benefits most? A systematic review. J. Clin. Med. 2019, 8, 1058. [Google Scholar] [CrossRef]
- Hartsel, J.A.; Eades, J.; Hickory, B.; Makriyannis, A. Cannabis sativa and Hemp. In Nutraceuticals; Efficacy, Safety and Toxicity, 1st ed.; Academic Press: San Diego, CA, USA, 2016; pp. 735–754. ISBN 978-0-12-802147-7. [Google Scholar]
- Campos, A.C.; Fogaça, M.V.; Sonego, A.B.; Guimarães, F.S. Cannabidiol, neuroprotection and neuropsychiatric disorders. Pharmacol. Res. 2016, 112, 119–127. [Google Scholar] [CrossRef]
- Izzo, A.A.; Borrelli, F.; Capasso, R.; Di Marzo, V.; Mechoulam, R. Non-psychotropic plant cannabinoids: New therapeutic opportunities from an ancient herb. Trends Pharmacol. Sci. 2009, 30, 515–527. [Google Scholar] [CrossRef] [PubMed]
- Appendino, G.; Chianese, G.; Taglialatela-Scafati, O. Cannabinoids: Occurrence and medicinal chemistry. Curr. Med. Chem. 2011, 18, 1085–1099. [Google Scholar] [CrossRef] [PubMed]
- Howlett, A.C.; Abood, M.E. CB1 and CB2 receptor pharmacology. Adv. Pharmacol. 2017, 80, 169–206. [Google Scholar] [PubMed]
- Janee’M, H.; Brooke, R.T.; Zipp, B.J. Cannabinoid glycosides: In vitro production of a new class of cannabinoids with improved physicochemical properties. bioRxiv 2017. [Google Scholar] [CrossRef]
- Gamble, L.-J.; Boesch, J.M.; Frye, C.W.; Schwark, W.S.; Mann, S.; Wolfe, L.; Brown, H.; Berthelsen, E.S.; Wakshlag, J.J. Pharmacokinetics, safety, and clinical efficacy of cannabidiol treatment in osteoarthritic dogs. Front. Vet. Sci. 2018, 5, 165. [Google Scholar] [CrossRef]
- Deiana, S.; Watanabe, A.; Yamasaki, Y.; Amada, N.; Arthur, M.; Fleming, S.; Woodcock, H.; Dorward, P.; Pigliacampo, B.; Close, S.; et al. Plasma and brain pharmacokinetic profile of cannabidiol (CBD), cannabidivarine (CBDV), Δ 9-tetrahydrocannabivarin (THCV) and cannabigerol (CBG) in rats and mice following oral and intraperitoneal administration and CBD action on obsessive–compulsive behaviour. Psychopharmacology 2012, 219, 859–873. [Google Scholar] [PubMed]
- Paudel, K.S.; Hammell, D.C.; Agu, R.U.; Valiveti, S.; Stinchcomb, A.L. Cannabidiol bioavailability after nasal and transdermal application: Effect of permeation enhancers. Drug Dev. Ind. Pharm. 2010, 36, 1088–1097. [Google Scholar] [CrossRef] [PubMed]
- Silmore, L.H.; Willmer, A.R.; Capparelli, E.V.; Rosania, G.R. Food effects on the formulation, dosing, and administration of cannabidiol (CBD) in humans: A systematic review of clinical studies. Pharmacother. J. Hum. Pharmacol. Drug Ther. 2021, 41, 405–420. [Google Scholar] [CrossRef] [PubMed]
- Galanakis, C. What Is the Difference between Bioavailability Bioaccessibility and Bioactivity of Food Components. SciTech Connect 2017. Available online: http://scitechconnect.elsevier.com/bioavailability-bioaccessibility-bioactivity-food-components/ (accessed on 27 April 2017).
- Millar, S.A.; Stone, N.L.; Yates, A.S.; O’Sullivan, S.E. A systematic review on the pharmacokinetics of cannabidiol in humans. Front. Pharmacol. 2018, 9, 1365. [Google Scholar] [CrossRef] [PubMed]
- Eisenberg, E.; Ogintz, M.; Almog, S. The pharmacokinetics, efficacy, safety, and ease of use of a novel portable metered-dose cannabis inhaler in patients with chronic neuropathic pain: A phase 1a study. J. Pain Palliat. Care Pharmacother. 2014, 28, 216–225. [Google Scholar] [CrossRef]
- Rosenkrantz, H.; Fleischman, R.W.; Grant, R.J. Toxicity of short-term administration of cannabinoids to rhesus monkeys. Toxicol. Appl. Pharmacol. 1981, 58, 118–131. [Google Scholar] [CrossRef]
- Samara, E.; Bialer, M.; Mechoulam, R. Pharmacokinetics of cannabidiol in dogs. Drug Metab. Dispos. 1988, 16, 469–472. [Google Scholar]
- Cherniakov, I.; Izgelov, D.; Domb, A.J.; Hoffman, A. The effect of Pro NanoLipospheres (PNL) formulation containing natural absorption enhancers on the oral bioavailability of delta-9-tetrahydrocannabinol (THC) and cannabidiol (CBD) in a rat model. Eur. J. Pharm. Sci. 2017, 109, 21–30. [Google Scholar] [CrossRef]
- Dai, J.-Y.; Yang, J.-L.; Li, C. Transport and metabolism of flavonoids from Chinese herbal remedy Xiaochaihu-tang across human intestinal Caco-2 cell monolayers. Acta Pharmacol. Sin. 2008, 29, 1086–1093. [Google Scholar] [CrossRef]
- Rein, M.J.; Renouf, M.; Cruz-Hernandez, C.; Actis-Goretta, L.; Thakkar, S.K.; da Silva Pinto, M. Bioavailability of bioactive food compounds: A challenging journey to bioefficacy. Br. J. Clin. Pharmacol. 2013, 75, 588–602. [Google Scholar] [CrossRef]
- Bordenave, N.; Hamaker, B.R.; Ferruzzi, M.G. Nature and consequences of non-covalent interactions between flavonoids and macronutrients in foods. Food Funct. 2014, 5, 18–34. [Google Scholar] [CrossRef]
- Neilson, A.P.; Goodrich, K.M.; Ferruzzi, M.G. Bioavailability and metabolism of bioactive compounds from foods. In Nutrition in the Prevention and Treatment of Disease; Elsevier: London, UK, 2017; pp. 301–319. [Google Scholar]
- Hornero-Méndez, D.; Mínguez-Mosquera, M.I. Bioaccessibility of carotenes from carrots: Effect of cooking and addition of oil. Innov. Food Sci. Emerg. Technol. 2007, 8, 407–412. [Google Scholar] [CrossRef]
- Lakshminarayana, R.; Baskaran, V. Influence of olive oil on the bioavailability of carotenoids. Eur. J. Lipid Sci. Technol. 2013, 115, 1085–1093. [Google Scholar] [CrossRef]
- Zgair, A.; Wong, J.C.; Lee, J.B.; Mistry, J.; Sivak, O.; Wasan, K.M.; Hennig, I.M.; Barrett, D.A.; Constantinescu, C.S.; Fischer, P.M.; et al. Dietary fats and pharmaceutical lipid excipients increase systemic exposure to orally administered cannabis and cannabis-based medicines. Am. J. Transl. Res. 2016, 8, 3448–3459. [Google Scholar] [PubMed]
- Peoples, M.S.; Koide, R.T. Considerations in the storage of soil samples for enzyme activity analysis. Appl. Soil Ecol. 2012, 62, 98–102. [Google Scholar] [CrossRef]
- Zarinviarsagh, M.; Ebrahimipour, G.; Sadeghi, H. Lipase and biosurfactant from Ochrobactrum intermedium strain MZV101 isolated by washing powder for detergent application. Lipids Health Dis. 2017, 16, 177. [Google Scholar] [CrossRef]
- Salvia-Trujillo, L.; Sun, Q.; Um, B.H.; Park, Y.; McClements, D.J. In vitro and in vivo study of fucoxanthin bioavailability from nanoemulsion-based delivery systems: Impact of lipid carrier type. J. Funct. Foods 2015, 17, 293–304. [Google Scholar] [CrossRef]
- Goltz, S.R.; Ferruzzi, M.G. Carotenoid bioavailability: Influence of dietary lipid and fiber. In Carotenoids and Human Health; Springer: New York, NY, USA, 2013; pp. 111–128. [Google Scholar]
- Failla, M.L.; Chitchumronchokchai, C.; Ferruzzi, M.G.; Goltz, S.R.; Campbell, W.W. Unsaturated fatty acids promote bioaccessibility and basolateral secretion of carotenoids and α-tocopherol by Caco-2 cells. Food Funct. 2014, 5, 1101–1112. [Google Scholar] [CrossRef] [PubMed]
- Ferruzzi, M.G.; Lumpkin, J.L.; Schwartz, S.J.; Failla, M. Digestive stability, micellarization, and uptake of β-carotene isomers by Caco-2 human intestinal cells. J. Agric. Food Chem. 2006, 54, 2780–2785. [Google Scholar] [CrossRef]
- Moghimipour, E.; Ameri, A.; Handali, S. Absorption-enhancing effects of bile salts. Molecules 2015, 20, 14451–14473. [Google Scholar] [CrossRef]
- Torcello-Gómez, A.; Foster, T.J. Interactions between cellulose ethers and a bile salt in the control of lipid digestion of lipid-based systems. Carbohydr. Polym. 2014, 113, 53–61. [Google Scholar] [CrossRef] [PubMed]
- Maldonado-Valderrama, J.; Wilde, P.; Macierzanka, A.; Mackie, A. The role of bile salts in digestion. Adv. Colloid Interface Sci. 2011, 165, 36–46. [Google Scholar] [CrossRef]
- Krogdahl, Å. Digestion and absorption of lipids in poultry. J. Nutr. 1985, 115, 675–685. [Google Scholar] [CrossRef]
- Hall, B.; Muller, D. Studies on the bile salt stimulated lipolytic activity of human milk using whole milk as source of both substrate and enzyme. I. Nutritional implications. Pediatr. Res. 1982, 16, 251–255. [Google Scholar] [CrossRef] [PubMed]
- Da Silva, T.C.; Polli, J.E.; Swaan, P.W. The solute carrier family 10 (SLC10): Beyond bile acid transport. Mol. Asp. Med. 2013, 34, 252–269. [Google Scholar] [CrossRef] [PubMed]
- Wang, T.; Collet, J.-P.; Shapiro, S.; Ware, M.A. Adverse effects of medical cannabinoids: A systematic review. CMAJ 2008, 178, 1669–1678. [Google Scholar] [CrossRef]
- Berman, P.; Futoran, K.; Lewitus, G.M.; Mukha, D.; Benami, M.; Shlomi, T.; Meiri, D. A new ESI-LC/MS approach for comprehensive metabolic profiling of phytocannabinoids in Cannabis. Sci. Rep. 2018, 8, 14280. [Google Scholar] [CrossRef] [PubMed]


| Substrate | Assay Components (% Mole Conversion) | |
|---|---|---|
| 1:2 lipase:pancreatin | 1:2:3 lipase:pancreatin:bile | |
| 0.1 mM pNPP | 93.6 ± 0.3% | 95.5 ± 7.6% |
| 1 mM pNPP | 20.6 ± 0.07% | 58.6 ± 5.7% |
| Samples | Amount of Metabolite in Fasted Digestion | Amount of Metabolite in Fed State Digestion | ||
|---|---|---|---|---|
| 10 mg CBD | 100 mg CBD | 10 mg CBD | 100 mg CBD | |
| DG | 72.99 ± 6% | 95.67 ± 2% | 91.39 ± 25% | 83.1 ± 25% |
| P | 92.22 ± 10% | 74.10 ± 1.3% | 90.15 ± 18% | 87.94 ± 29% |
| AQ | 0.69 ± 1.5% | 0.15 ± 1% | 12.93 ± 7% | 18.59 ± 10% |
| Digestive Stabilities | ||||
| 72.99 ± 6% | 95.67 ± 2% | 91.39 ± 25% | 83.1 ± 25% | |
| Micellarization Efficiencies | ||||
| 0.65 ± 0.7% | 0.14 ± 0.1% | 14.15 ± 0.6% | 22.67 ± 2.1% | |
Publisher’s Note: MDPI stays neutral with regard to jurisdictional claims in published maps and institutional affiliations. |
© 2021 by the authors. Licensee MDPI, Basel, Switzerland. This article is an open access article distributed under the terms and conditions of the Creative Commons Attribution (CC BY) license (https://creativecommons.org/licenses/by/4.0/).
Share and Cite
Mozaffari, K.; Willette, S.; Lucker, B.F.; Kovar, S.E.; Holguin, F.O.; Guzman, I. The Effects of Food on Cannabidiol Bioaccessibility. Molecules 2021, 26, 3573. https://doi.org/10.3390/molecules26123573
Mozaffari K, Willette S, Lucker BF, Kovar SE, Holguin FO, Guzman I. The Effects of Food on Cannabidiol Bioaccessibility. Molecules. 2021; 26(12):3573. https://doi.org/10.3390/molecules26123573
Chicago/Turabian StyleMozaffari, Khadijeh, Stephanie Willette, Ben F. Lucker, Sarah E. Kovar, Francisco Omar Holguin, and Ivette Guzman. 2021. "The Effects of Food on Cannabidiol Bioaccessibility" Molecules 26, no. 12: 3573. https://doi.org/10.3390/molecules26123573
APA StyleMozaffari, K., Willette, S., Lucker, B. F., Kovar, S. E., Holguin, F. O., & Guzman, I. (2021). The Effects of Food on Cannabidiol Bioaccessibility. Molecules, 26(12), 3573. https://doi.org/10.3390/molecules26123573