Article

Phytochemical Characterization and Bioactivity of Asparagus acutifolius: A Focus on Antioxidant, Cytotoxic, Lipase Inhibitory and Antimicrobial Activities

by
Amel Hamdi
1,2,
Sara Jaramillo-Carmona
1,
Rocío Rodríguez-Arcos
1,
Ana Jiménez-Araujo
1,
Mokhtar Lachaal
2,
Najoua Karray-Bouraoui
2 and
Rafael Guillén-Bejarano
1,*
1
Phytochemicals and Food Quality Group, Instituto de la Grasa (CSIC), 41013 Seville, Spain
2
Unité de Physiologie et de Biochimie de la Réponse des Plantes aux Contraintes Abiotiques, FST Campus, Université Tunis El Manar, 1068 Tunis, Tunisia
*
Author to whom correspondence should be addressed.
Molecules 2021, 26(11), 3328; https://doi.org/10.3390/molecules26113328
Submission received: 26 April 2021 / Revised: 19 May 2021 / Accepted: 24 May 2021 / Published: 1 June 2021
(This article belongs to the Special Issue Bioactive Compounds from Asparagus Species)

Abstract

:
The phytochemical composition of leaves, stems, pericarps and rhizomes ethanolic extracts of Asparagus acutifolius were characterized by HPLC-DAD-MS. A. acutifolius samples contain at least eleven simple phenolics, one flavonon, two flavonols and six steroidal saponins. The stem extracts showed the highest total phenolic acid and flavonoid contents, where cafeic acid and rutin were the main compounds. No flavonoids were detected in the leaf, pericarp or rhizome while caffeic acid and ferulic acid were the predominant. Steroidal saponins were detected in the different plant parts of A. acutifolius, and the highest contents were found in the rhizome extracts. The stem extracts exhibited the highest antioxidant activity against 2,2-diphenyl-1-picrylhydrazyl (DPPH) and ferric reducing antioxidant power (FRAP) and the highest 2,2-azino-bis (3 ethylbenzothiazoline-6-sulphonic acid) (ABTS) scavenging activity was found in the pericarp extracts. The rhizome and leaf extracts showed a potent cytotoxic activity against HCT-116 and HepG2 cell lines. Moreover, the pericarp and rhizome extracts revealed a moderate lipase inhibitory activity. The leaf and rhizome extracts were screened for their antimicrobial activity against human pathogenic isolates. The leaf extract exhibited a powerful inhibitory activity against all the bacteria and fungi tested.

Graphical Abstract

1. Introduction

In recent decades, an increasing interest has been focused on wild edible plants to broaden the diversity of the human diet because of their nutritional and medicinal values [1,2]. In the Mediterranean basin, wild plants rich in antioxidants have been harvested and eaten seasonally for many generations. They have been used as food, medicine, dye and ornaments and are also an important source of income for local people in different regions. Among edible wild plants, the Asparagus genus has a relevant position, including over 250 species of both food and medicinal interest [3]. Among these, Asparagus acutifolius L., is an herbaceous, perennial species widely distributed in the Mediterranean area, and mainly known for the fine flavor of its spears. It is generally sold in local markets at relatively high prices and used in typical restaurant dishes. From the nutritional point of view, A. acutifolius spear, which is the edible part of the plant, is rich in antioxidant phenolics, Vitamin C, folates, ascorbic acid and dietary fiber [4]. Among phenolics, the major compounds found are Quercitin-3-O-rutinoside and Isorhamnetin-3-O-rutinoside and to a lesser extend Kaempherol-3-O-rutinoside [5]. Aqueous extracts of A. acutifolius, rich in these compounds, have been shown to possess significant antiproliferative and pro-apoptotic activity against bladder and lung cancer lines [6]. Di maro et al. [7] have found rutin (3-O-Quercitin-rutinoside) as the main flavonoid along with high levels of isoquercitrin (Quercitin-glucoside). They have also found important antiproliferative activities against neuroblastoma and liver, cervical and lung cancer cells. This plant is also used for its medicinal properties which are related to the presence of different bioactives in various plant parts including phenolics, saponin and polysaccharides [8]. For instance, a decoction of the root has been used traditionally by the ethnomedicine as a diuretic [9].
However, in recent years, wild edible food sources, particularly wild A. acutifolius, have fallen into neglect since their traditional uses are being lost. The revalorization of these wild vegetables as potential sources of functional food ingredients and/or including their consumption in modern diets could contribute to the preservation of their traditional knowledge and culinary uses, as well as to improve the biodiversity and rural sustainability of the collection areas.
Among plant secondary metabolites, phenolic compounds have been extensively studied and are commonly used as antioxidants because they might retard the oxidative degradation of lipids and thereby improve the quality and nutritional value of food [10]. Asparagus contains flavonoids (mainly rutin) and other phenolic compounds which possess strong antioxidant properties [11,12,13,14]. The potential health benefits of the antioxidants in asparagus include reducing the risk of cancer, cardiovascular and cerebrovascular diseases [15,16,17].
As far as we know there is no report on either the biological activity or the phytochemical composition of the leaf, stem, pericarp or rhizome of A. acutifolius. Except for a report on the characterization of the root’s saponin [8], the available studies in the literature describe the nutritional assessment, phenolic composition and antioxidant properties of only the edible portion of this plant [18,19,20]. However, considering the presence of different compounds in different portions of the plant, it seems interesting to study the different organs as possible sources of bioactives with different types of applications in sectors such as food, cosmetics or pharmaceuticals. Therefore, the aim of this study was to characterize the bioactive compounds of the A. acutifolius leaf, stem, pericarp and rhizome, paying special attention to the functional properties (antioxidant, cytotoxic, lipase inhibitory and antimicrobial activities) of their ethanolic extracts.

2. Results and Discussion

2.1. Analysis of Phenolic Compounds

A total of 16 different phenolic compounds were identified and quantified in the ethanolic extracts of different plant parts of A. acutifolius (Table 1).
In particular, seven components were recognized as p-hydroxybenzoic acid derivatives (vanillic acid, p-hydroxybenzaldehyde, p-hydroxybenzoic acid, vanillin, syringic acid, protocatechuic acid, and gallic acid), four as hydroxycinnamic acids (ferulic acid, caffeic acid, p-coumaric, and sinapic acids) and five as flavonoids (naringenin, quercetin, kaempferol, rutin and narcissin). The profiles of phenolic compounds varied markedly among the samples. The results showed that the total content of simple phenolics (p-hydroxybenzoic acid derivatives and hydroxycinnamic acids) was 1.3, 1.9 and 2 times higher in the stem than in the rhizome, pericarp and leaf, respectively (Table 1). In the different plant parts, caffeic acid was the predominant phenolic acid, and its value was 72% of the total simple phenolics quantified in the stem, 31% in the pericarp, 19% in the leaf and 16% in the rhizome extracts (Table 1). The results of our analysis are in accordance with those of Salvatore et al. [18], who found that caffeic acid was the main phenolic acid in A. acutifolius spear and A. officinalis root. In addition to caffeic acid, significantly higher amounts of other simple phenolics (p-hydroxybenzaldehyde, p-hydroxybenzoic, vanillic, syringic, coumaric, ferulic and sinapic acids) were found in the rhizome extract compared to the other organs (Table 1). Different results were found in the work of Lake et al. [21] and Symes et al. [22], which showed that vanillic and ferulic acids were not identified in the root of A. officinalis. However, Billau et al. [23] observed only low levels of vanillic acid and did not detect ferulic acid in storage roots of white asparagus. Concerning flavonol glycoside, significant quantities of rutin and narcissin were quantified from the stem, but they were not detected in the leaf, pericarp or rhizome (Table 1). Barros et al. [19] also reported that the flavonoid profile of the young stems of A. acutifolius from Portugal was comprised of rutin, narcissin and nicotiflorin. In addition, the rhizome was richer in flavonols (quercetin and kaempferol) than the other extracts. Naringenin was the only flavanone quantified, being present in the highest amount in the stem. This flavanone has also been detected and isolated from Asparagus sprengeri [24].
The results of this study showed statistically significant differences in the content of total phenolics among wild A. acutifolius organs. More than 80% of the total amount quantified is simple phenolics in the leaf, rhizome and pericarp, but only 44% in the stem, where flavonoids were the most abundant.

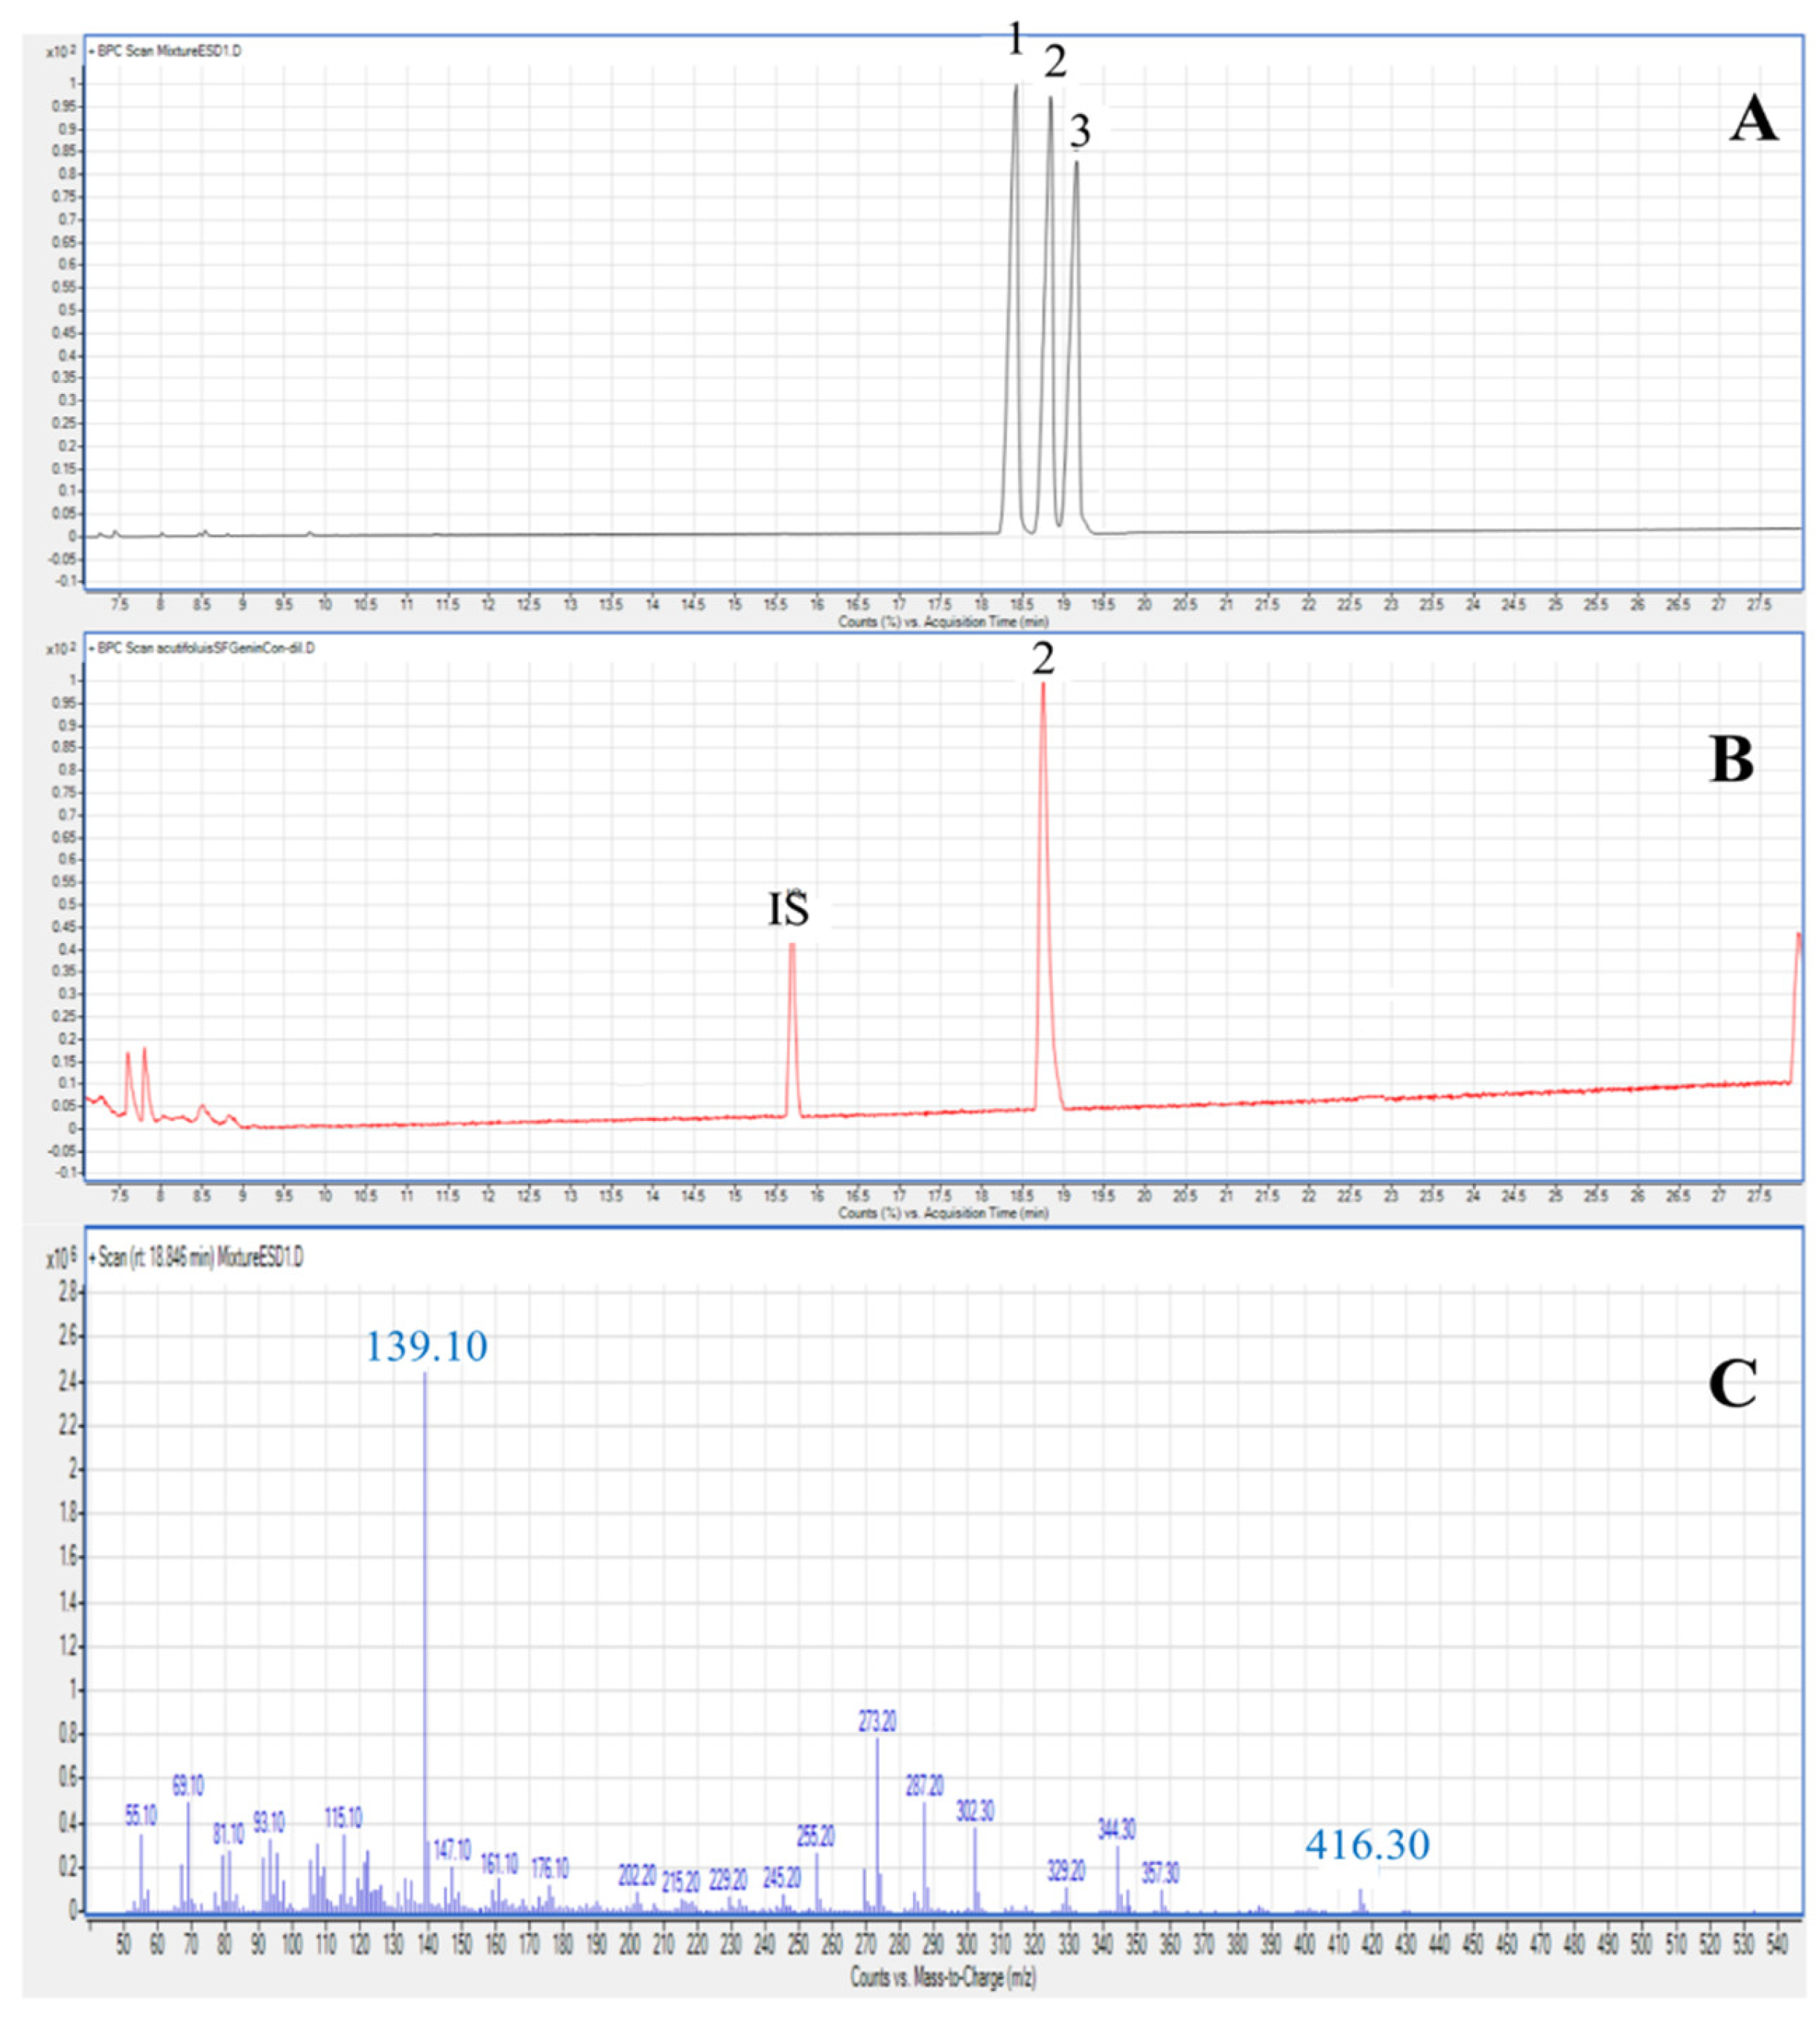
2.2. Saponins in the Different Plant Parts of A. acutifolius

Six saponins were identified in the sample of A. acutifolius, three of them (HTSAP-1, HTSAP-3 and HTSAP-6) were previously identified in triguero HT [25,26,27] and other three saponins were identified as new structures (from ACSAP-1 to ACSAP-3). Those saponins were identified by their retention time, molecular ion (m/z), and fragmentation pathway. The fragmentation pathway has been studied through the mass spectrum obtained in negative (100 V−) and positive (50 V+) modes (Table 2).
ACSAP-1 showed the same molecular ion and pathway fragmentation model as that reported for HTSAP-1 [25] but presented a different retention time (Table 2). This saponin was detected in the different plant parts of A. acutifolius except in the rhizome. ACSAP-1 exhibited a quasi-molecular ion peak in negative ion mode [M-H]- at m/z 1051 and molecular formula C50H83O23. Other fragment ion peaks can be seen at m/z 919, 757, 595 and 433, resulting from consecutive losses of one pentose and three hexoses. In the case of the positive spectrum mode, it showed the ions at m/z 1075 (sodium adduct), m/z 1035 (loss of one H2O molecule), and m/z 873, 711, 579 and 417 corresponding to the loss of a hexose, a hexose, a pentose and a hexose, respectively.
In addition, two new saponins (ACSAP-2 and ACSAP-3) were identified only in the rhizome extract of A. acutifolius in very small amounts, being 3% and 5% of the total saponin contents, respectively. According to the molecular weight and fragmentation pathway of ACSAP-2 and ACSAP-3 summarized in Table 2, those saponins could be similar to those described in the root of A. acutifolius by Sautour et al. [7], where both of them have a hydroxysarsapogenin as aglycon. In our study, the negative mode of ACSAP-2 showed an ion fragment at m/z 887 [M-H]- and the molecular formula C44H71O18. Ion peaks at m/z 755, 593 and 431 were also observed, which correspond to the loss of two hexoses and one pentose. The positive mode spectrum showed the ions at m/z 911 (adduct where a molecule forms with sodium), m/z 871 (loss of one H2O molecule), and m/z 709, 577, and 415, which correspond to the loss of a hexose, a pentose and a hexose, respectively.
ACSAP-3 in positive and negative mode was compatible with a saponin containing two pentoses and one hexose. In negative ion mode, an ion peak at m/z 857. [M-H]-, indicating a molecular formula of C43H69O17, was observed. Other ion peaks were also observed, such as m/z 725, 593 and 431, which correspond to the loss of a pentose, a pentose and a hexose respectively. In the case of the positive spectrum mode, it showed ions at m/z 881 (adduct where a molecule forms with sodium), m/z 841 (loss of one H2O molecule), and m/z 709, 577 and 415, which correspond to the loss of a pentose, a pentose and a hexose, respectively.
In order to confirm the genin of the saponins previously described in our study, a GC/MS method was used. Steroidal sapogenins have been obtained by acid hydrolysis of the crude saponin fraction and the major saponins isolated from the different organs of A. acutifolius. The ESI-MS obtained during GC/MS were characterized by the appearance of the base peak at m/z 139 (Figure 1C). Several other diagnostic ions were also observed, which coincide with others previously described by Sauvaire et al. [28]. The identification of sarsasapogenin (peak 2, M+ 416) was also based on the comparison of retention times and mass spectra to those of authentic standards of these sapogenins (Figure 1A,B).
This genin was the major one found in our samples as it is commonly found in the Asparagaceae family [7,8,9,10,11,12,13,14,15,16,17,18,19,20,21,22,23,24,25,26,27,28,29]. The glycosidic composition was also analyzed in order to obtain more information about the structural characteristics of the identified saponins, especially the major ones such as HTSAP-1, ACSAP-1, HTSAP-3 and HTSAP-6. The monosaccharides obtained after the hydrolysis of the major saponins isolated from A. acutifolius were glucose and xylose in HTSAP-1, ACSAP-1 and HTSAP-3 (Figure 2B,D). However, glucose, xylose and rhamnose were identified in HTSAP-6 (Figure 2C).
The saponins have also been quantified in the ethanolic extracts from the different plant organs by the external standard method (Table 3). The results show that the total content of saponins in the rhizome were 3, 5 and 24 times higher than in the pericarp, leaf and stem, respectively. The leaf, pericarp and stem mainly contained HTSAP-6, which represent 75%, 63% and 59% of their total contents, respectively. A high amount of the new saponin (ACSAP-1), which represented 12%, 16% and 25% of the total saponin contents in the leaf, stem and pericarp extracts, respectively, was also detected. The ethanolic extract from the rhizome was mainly comprised of three saponins, as previously described in triguero HT asparagus, HTSAP-3 (47%), HTSAP-1 (24%) ad HTSAP-6 (21%) [25]. Two minor peaks were also identified in the rhizome extract, as previously described by Sautour et al. [7] (ACSAP-2 and ACSAP-3) or described in this work as tentative new saponins based on the mass spectra. ACSAP-2 and ACSAP-3 present only 3% and 5%, respectively, of the total saponin contents in the rhizome extracts of A. acutifolius.
Among the different parts of A. acutifolius, the content of each saponin was always the highest in the rhizome, followed by the pericarp, leaf and then stem. This observation was consistent with previous studies [30,31]. In accordance with our previous work [31], a high content of saponins was also detected in the rhizome of A. albus compared to the leaf and pericarp, probably due to the need for protection against pathogen attacks in the soil. Working with a saponin-deficient oat mutant, Papadopoulou et al. [32] concluded that saponins may have general significance as antimicrobial phytoprotectans.
In summary, both quantitative and qualitative studies suggested that the rhizome was significantly different from the other parts. It contained the highest contents of individual saponin and total saponins, clearly pointing to this part as a raw material for the manufacture of saponin-based products. The leaf and stem also showed clear differences and contained the lowest contents of saponins. Different results were reported for Bacopa monnieri, in which the highest content of saponins was found in the leaf and shoot compared to the root [33]. These differences between organs could also justify the differential functional properties which have been attributed to the different plant parts from ancient times.

2.3. Evaluation of Antioxidant Capacity

In the current study, for the determination of antioxidant capacity, ABTS, FRAP and DPPH assays were performed. The results obtained from the three methods are shown in Figure 3. For DPPH and FRAP assays, leaf and stem extracts exhibited the highest values and pericarp the lowest. Surprisingly, in the ABTS test, the pericarp was the most active extract. In the literature, most of the research on the antioxidant activity of A. acutifolius extracts was carried out on extracts obtained from the shoots, which are the edible parts [17,18,19,20]. However, its different organs (leaf, stem, rhizome and fruit) have no commercial value and very little research has been carried out on them. In a previous work, our research group characterized the same plant parts from A. albus [31]. In that case, similar results were found for the rhizome, but not for the pericarp or leaf, which also presented a very different composition of phytochemicals.

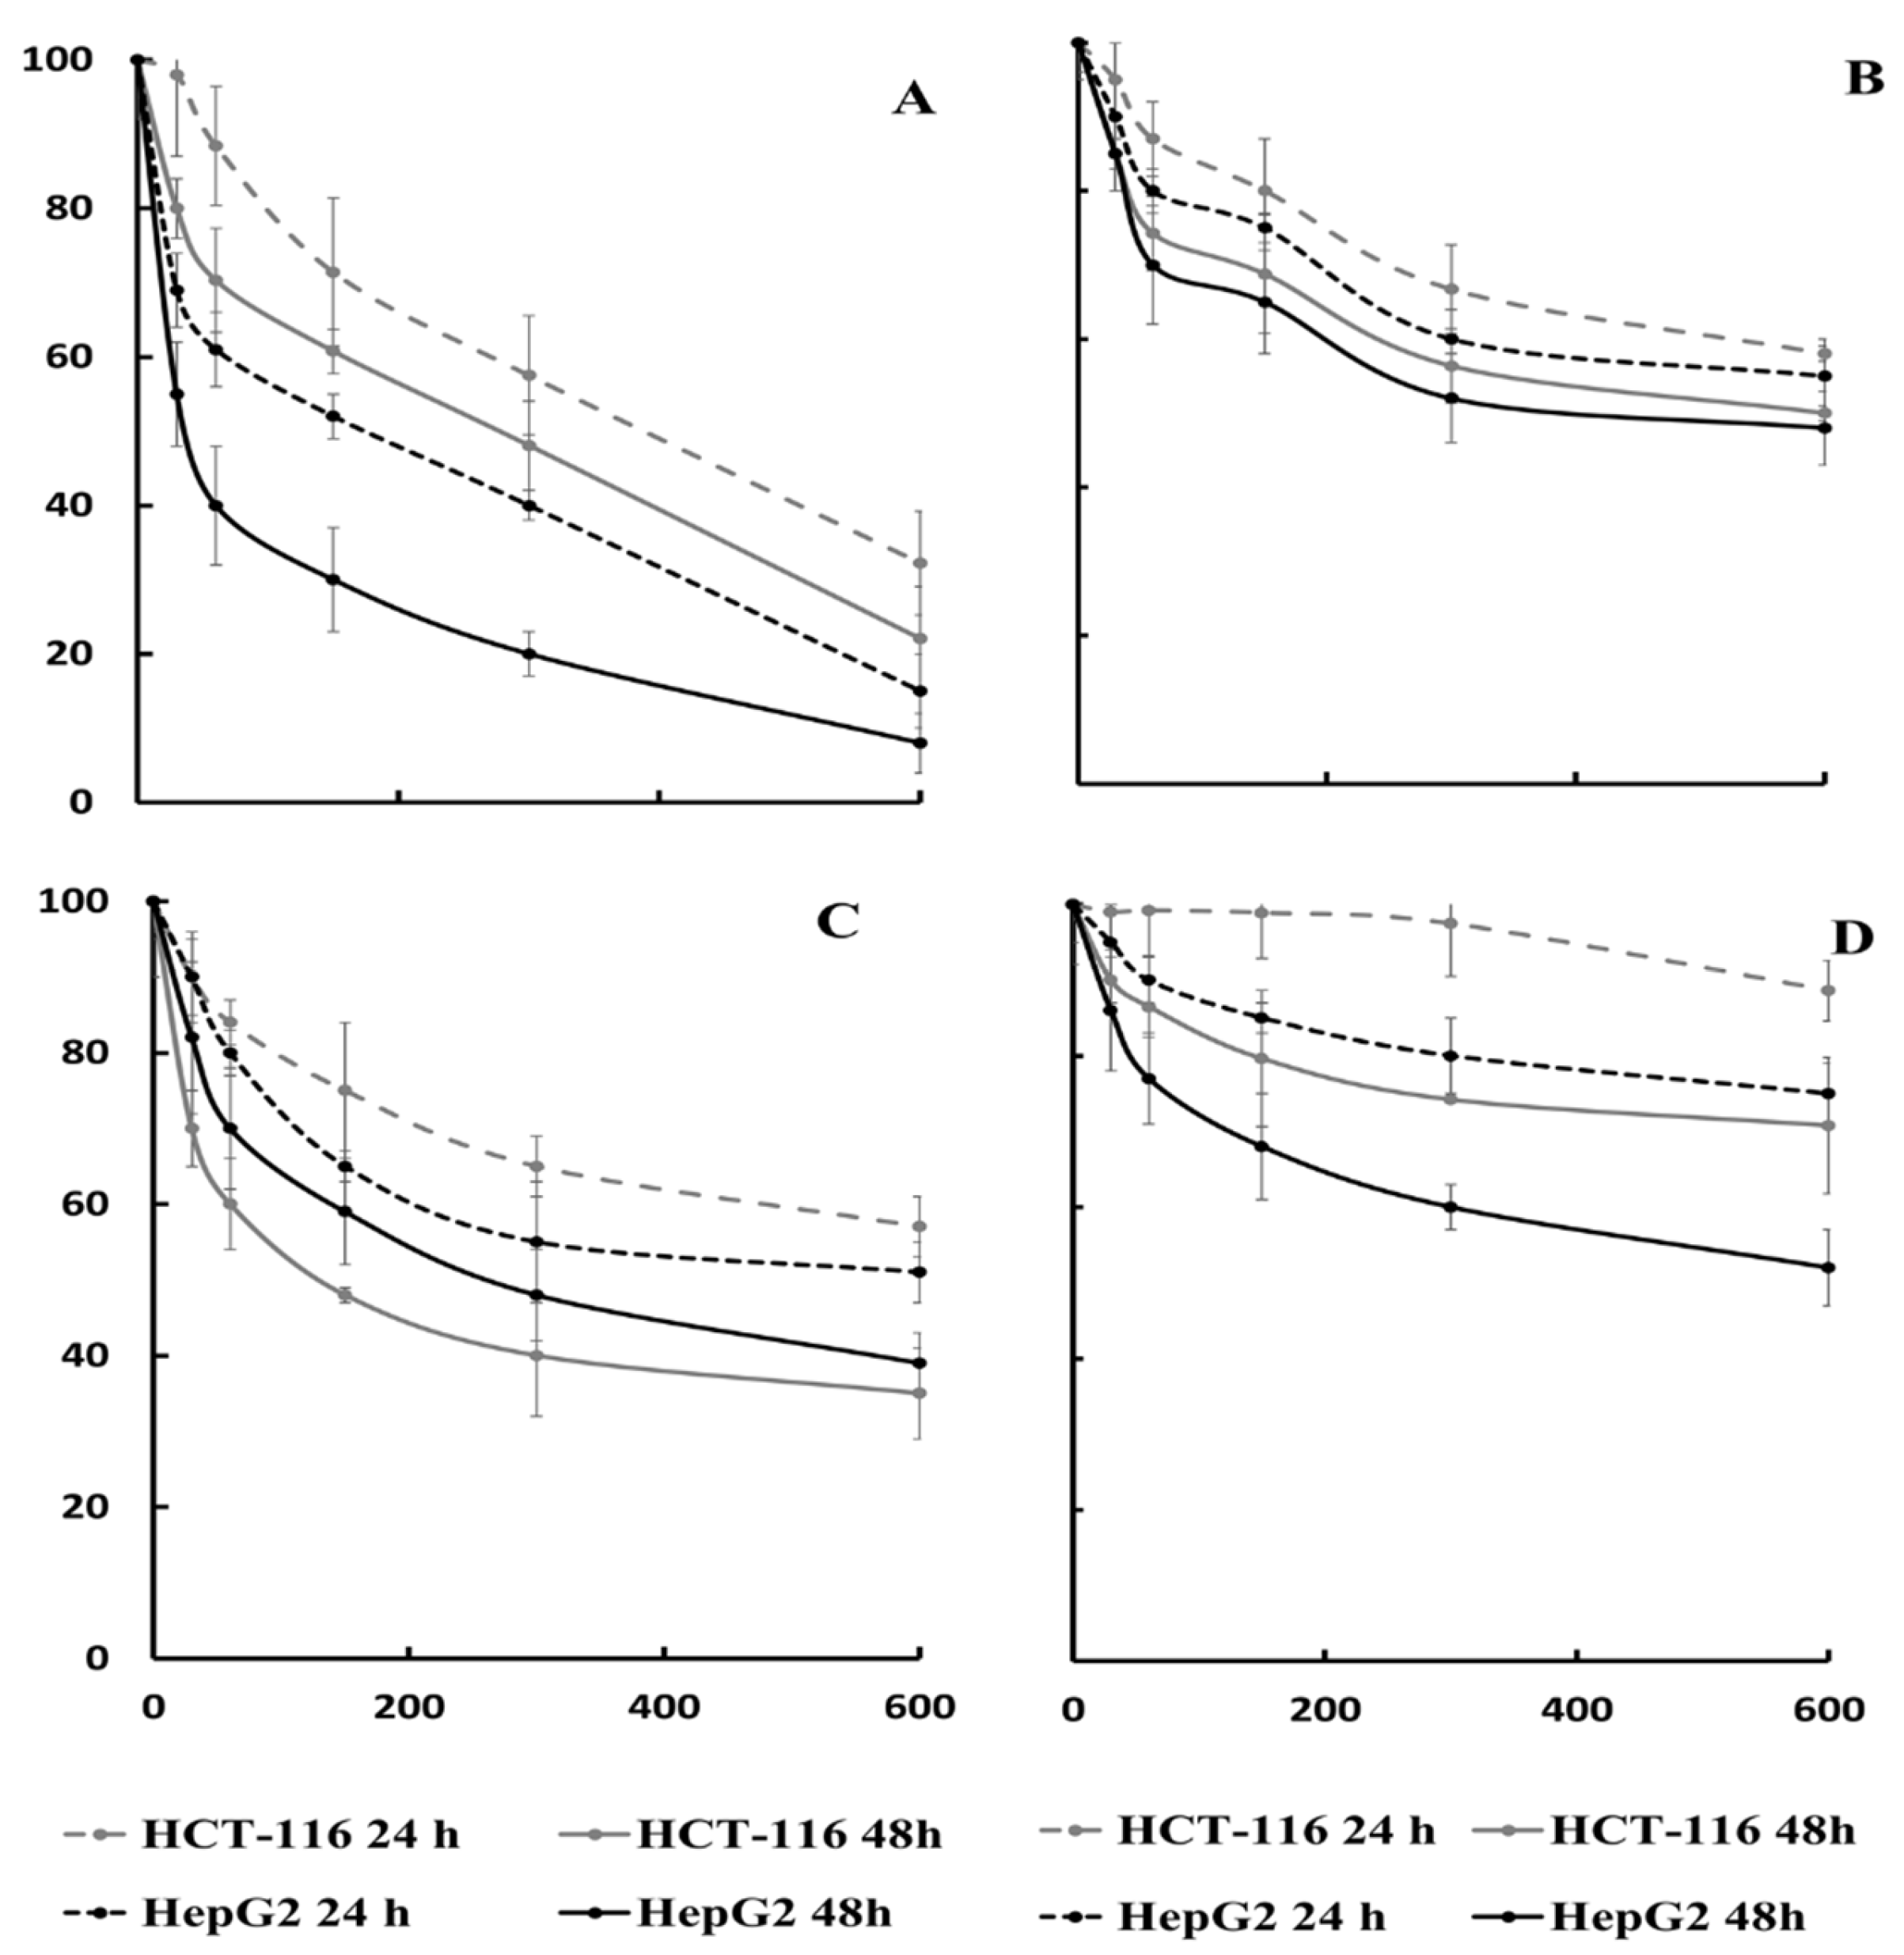
2.4. Cytotoxic Activity

The cytotoxic activity of the extracts from different plant parts was tested in two distinct human cancer cell lines, colon cancer (HCT-116) and liver cancer (HepG2) lines, using the MTT assay, a method for screening anti-proliferative agents. Figure 4 shows cell viability dose-response curves for each extract after cells were incubated for 24 and 48 h.
The rhizome extract was cytotoxic in the two cell lines tested. The concentration producing 50% cell death (IC50) on HCT-116 cells was 388.5 µg/mL for 24 h and 245.14 µg/mL for 48 h (Figure 4). Surprisingly, the leaf extract was more cytotoxic than the rhizome for 48 h (IC50 116.54 µg/mL) (Figure 4). The stem and pericarp extracts did not show cytotoxic activity in the tested conditions. For the HepG2 cell line, the rhizome had a very important cytotoxic effect at 48 h (IC50 45.14 µg/mL), but the leaf also showed a moderate effect (IC50 315.20 µg/mL) at 48 h (Figure 4).
Several studies have shown that saponins from asparagus are associated with a reduced risk of colorectal cancer by inducing cytotoxicity and apoptosis [34,35]. The IC50 value described for the rhizome extract was better than the saponins extracted from by-products of A. officinalis in the same cell line (902 µg/mL) [16], probably due to a different saponin composition or also to synergistic effects with other phytochemicals presents in the A. acutifolius extract. However, lower IC50 values (40 µg/mL) were found when working with the rhizome extract of A. albus, while the leaf extracts from these two asparagus species had similar IC50 values for HCT-116 cells [31]. Likewise, the rhizome from A. acutifolius showed an important cytotoxic activity against the HepG2 cell line and similar values were reported by other authors for A. adscendent [36] and A. filicinius [37], who related this activity to the presence of saponins and their genins.
The remarkable cytotoxicity observed in the current study against two carcinoma cell lines suggests that the rhizome and leaf from A. acutifolius could be exploited as a potential source of cytotoxic compounds with putative anticancer potential.

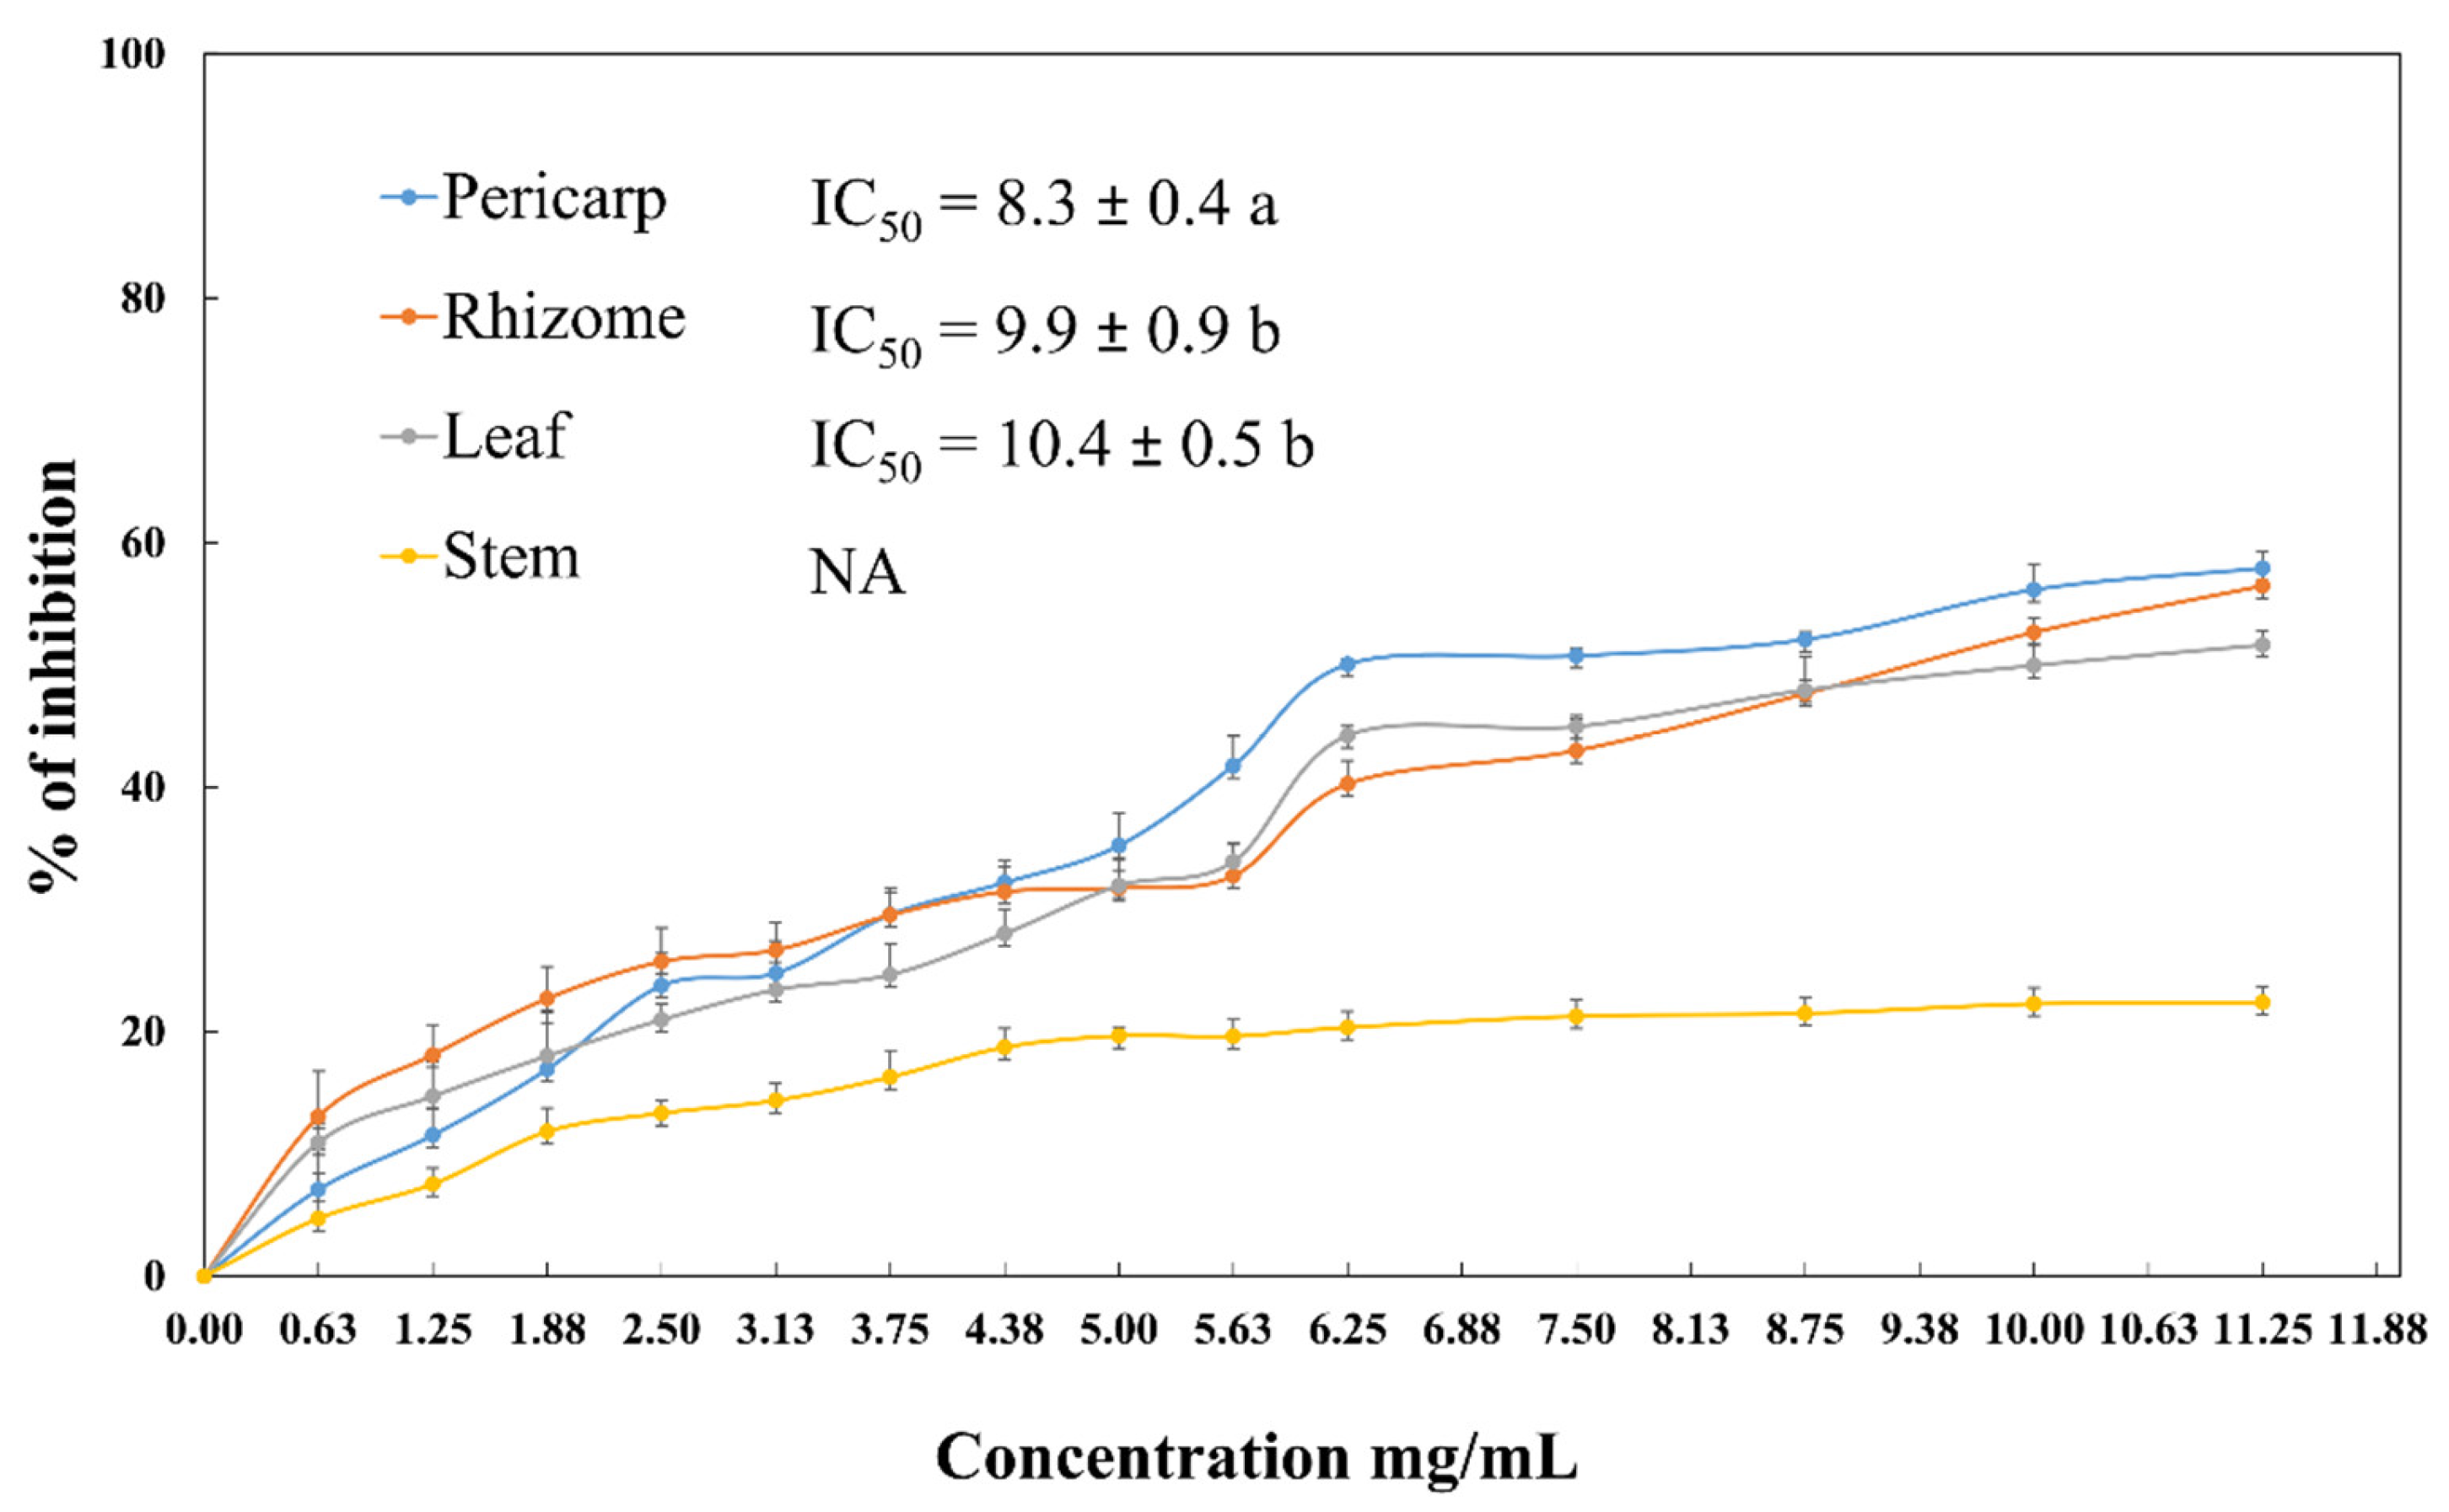
2.5. Lipase Inhibitory Activity

In the present study, the ethanolic extracts of A. acutifolius leaf, stem, pericarp and rhizome were evaluated for their inhibitory effect on porcine pancreatic lipase enzyme using an in vitro assay. As shown in Figure 5, A. acutifolius pericarp, rhizome and leaf extracts exhibited concentration dependent activity. The concentration which inhibited 50% of the lipase activity (IC50) was 8.3 mg/mL in the pericarp extracts, 9.9 mg/mL in the rhizome extracts and 10.4 mg/mL in the leaf extracts. However, no inhibition effect on the lipase activity was found in the stem extract.
Very little research has been carried out on in vitro lipase inhibitory activity in the different Asparagus species. However, previous studies have demonstrated the hypolipidaemic action of asparagus in animal models [38,39].
In previous studies, the administration of triguero HT spears to hypercholesterolemic rats improved the plasma lipid profile and prevented hepatic oxidative damage [15]. In addition, Visavadiya and Narasimhacharya [38], working with rats fed with a high-cholesterol diet, reported that the steroid-type saponins of Asparagus racemosus root seemed to be mainly responsible for the plasma cholesterol-lowering effect due to reduction in the absorption of cholesterol. The findings of Zhu et al. [39] also showed that the ethanolic and aqueous extracts from asparagus by-products had a strong hypolipidaemic effect and that they could be used as a supplement in healthcare foods and drugs or in combination with other hypolipidaemic drugs.
These results show that some A. acutifolius organs exhibited a moderate lipase inhibitory activity and they could be considered to use to improve the plasma lipid profile and to reduce the level of cholesterol.

2.6. Antimicrobial Activity

A preliminary essay showed that the leaf and rhizome ethanolic extracts of A. acutifolius exhibited a promising antimicrobial activity. For this reason, we screened those two organs for their inhibitory activities against 15 bacteria and 5 fungi isolated from various patients and the results are illustrated in Table 4.
The leaf ethanolic extracts showed a potent antimicrobial activity against all the Gram-positive and Gram-negative bacteria and the fungi tested with a zone of inhibition ranging from 14 to 22 mm for the bacteria and 13 to 27 mm for the fungi. The leaf extract showed the highest antibacterial activity against Salmonella typhimurium with an inhibition zone (22 mm) and against Staphylococcus aureus (MR) (18 mm), Klebsiella pneumonia (MR) (18 mm), Escherichia cloacae (18 mm), Esclerichia faecalis (17 mm), Esclerichia faecium (17 mm), Listeria monocytogenes (17 mm) and Esclerichia coli (17 mm).
Moreover, compared to the two antibiotics, gentamicin and streptomycin, leaf extracts showed better activity against Listeria monocytogenes, Esclerichia faecalis, and Esclerichia coli (ESBL). Compared to the leaf extracts, Salmonella aureus, Listeria monocytogenes, Esclerichia coli (BLSE) and Proteus mirabilis were not susceptible to the rhizome ethanol extracts; however, the later organ exhibited a higher activity only against Esclerichia faecium compared to the leaf extracts. The two organ extracts showed a higher activity against all the fungi than Amphotericin B. Geotricum capitatum was more susceptible to the leaf extracts than the rhizome extracts.
Nevertheless, the rhizome showed better activity against Candida galabrata than the leaf extracts. In accordance with our previous work [31], the leaf ethanolic extracts of Asparagus albus also exhibited a potent antimicrobial activity compared to the pericarp and rhizome extracts. In addition, the leaf ethanolic extracts of A. acutifolius showed a high antibacterial activity than the leaf ethanolic extracts of A. albus. However, the leaf and rhizome extracts of A. albus have higher antifugal activity against Candida albicans than those found in A. acutifolius [31]. The minimal inhibition concentrations (MICs) and the minimal bactericidal concentration (MBCs) values of A. acutifolius leaf and rhizome extracts tested against all strains are summarized in Table 5. The results indicate that the leaf was the most effective organ. In the two organs, the values of MICs and MBCs ranged from 0.195 to 3.12 mg/mL and from 3.125 to 50 mg/mL, respectively, against all strains. The ethanolic extracts of the leaf and rhizome were the most active against Salmonella typhimurium (for leaf extracts) and Esclerichia faecium (for rhizome extracts) with MIC of 0.195 mg/mL and MBC of 3.125 mg/mL.
Concerning yeasts, the results showed a concentration range of 0.096 to 0.390 mg/mL for MIC and 0.195 to 0.390 mg/mL for MFC in the two organ extracts and leaf ethanolic extracts showed greater antifungal activity against Geotricum capitum and Candida parapsilosis (MIC = 0.096 mg/mL and MFC = 0.195 mg/mL). However, the rhizome extract was most active against Candida parapsilosis (MIC = 0.096 mg/mL and MFC = 0.195 mg/mL).

3. Materials and Methods

3.1. Chemicals and Reagents

Authentic standards of quercetin, kaempferol and rutin (quercetin-3-O-rutinoside), naringenin, gallic acid, p-hydroxybenzoic acid, p-hydroxybenzaldehyde, vanillin, caffeic acid, p-hydroxyphenylacetic acid, ferulic acid, sinapic acid and 2,2-diphenyl-1-picrylhydrazyl (DPPH free radical), ferric chloride, 2,2′-dipyridyl (99% minimum purity), Trolox (97% purity), porcine pancreatic lipase, p-nitrophenyl butyrate (p-NPB), methylthiazolyldiphenyl-tetrazolium bromide (MTT), ethanol, formic acid (96%) and acetonitrile (HPLC grade), vanillic acid, p-coumaric acid, protocatechuic acid, syringic acid, sarsasapogenin, diosgenin, smilagenin and trichloroacetic acid were purchased from Sigma-Aldrich Quimica (Madrid, Spain). Isorhamnetin-3-O-rutinoside (narcissin) was purchased from Extrasynthese (Genay, France). Protodioscin (97% purity) and shatavarin (98.6% purity) were purchased from Chromadex Chemical Co. (Barcelona, Spain). All cell culture reagents were purchased from Gibco (Madrid, Spain). The extraction solvent ethyl acetate was obtained from Romil Ltd. (Waterbeach, UK). Pure deionized water was obtained from a Milli-Q50 system (Millipore Corporation, Bedford, MA, USA).

3.2. Plant Material

A. acutifolius L. plants were collected in January 2015 from Borj Cedria (22 km north Tunis). The plant materials were identified and authenticated by Mr. Mounir Kassri and voucher specimens (PLM 53) were deposited at the Herbarium of the Department of Biology, Faculty of Science of Tunis, Tunisia.
Samples of the leaf, stem, pericarp (fruits without seeds) and rhizome (minimum 1 Kg fresh weight each) of A. acutifolius L. were cleaned and washed thoroughly with distilled water. Each organ was then left at room temperature in the dark until dryness, and ground to a fine powder in a Mettler AE 200 (Dangoumau type) grinder. All samples were stored at −20 °C until analysis.

3.3. Preparation of Ethanolic Extract

Ethanolic extraction was performed using ethanol:water (80:20, v/v) in a ratio 1:40 (w/v). The mixture was homogenized in an Ultraturrax (Ultra-Turrax T25, Janke & Kunkel/IKA Labortechnik, Munich, Germany) for 1 min at maximum speed and filtered through filter paper. The residue was extracted again in the same conditions. Ethanolic extracts were pooled together and stored at −20 °C until analysis. All extractions were made in duplicate.

3.4. Analysis of Phenolic Compounds

3.4.1. Extraction and Quantification of Free Phenolics

The extraction methods were adapted from Weidner et al. [40] and Sosulski et al. [41] with the following modifications: 20 mL of 80% ethanolic extracts containing soluble phenolics were concentrated to dryness using a rotatory evaporator at 35 °C and 5 mL of distilled water were added. These aqueous solutions were adjusted to pH 2 and filtered through Whatman paper no. 1. The sample was extracted three times with ethyl acetate. The ethyl acetate phase was dried using a rotavapor and dissolved in 1 mL of 96% ethanol. The final extracts were stored at −18 °C prior to analysis.
A Jasco-LC-Net II ADC (Jasco, Madrid, Spain) liquid chromatograph system equipped with a DAD was used. Separation was carried out in a Mediterranea Sea C18 reverse-phase analytical column (25 cm length × 4.6 mm i.d., 5 µm particle size; Teknokroma, Barcelona, Spain). An elution gradient was used with solvents A (water with 1% formic acid) and B (acetonitrile with 1% formic acid): the proportion of solvent B was increased from 0% to 15% in 10 min, then maintained at 15% for 5 min, then raised to 20% over the next 10 min, maintained at 20% for 5 min, and raised to 100% over the next 5 min, maintained at 100% B for 5 min and finally returned to the initial conditions over the following 5 min. The column end was connected directly to a diode array detector (DAD) (Waters 996, Millipore, Manchester, UK). Spectra from all peaks were recorded in the 200–600 nm range and the chromatograms were acquired and quantified at 280 nm.
Stock standard solutions of each compound were prepared by dissolving 10 mg of each analytical standard in 10 mL of 80% ethanol. All solutions were stored at 4 °C. An intermediate solution containing all standard compounds (62.5 μg/mL) was prepared in 80% ethanol, and dilutions from this solution were made at different levels for calibration curves between 0 and 250.

3.4.2. Analysis and Quantification of Flavonoids by HPLC–DAD

Flavonoids were quantified directly from the ethanolic extracts. A Jasco-LC-Net II ADC liquid chromatograph system equipped with a DAD was used. Separation was carried out in a Mediterranea Sea C18 reverse-phase analytical column (25 cm length × 4.6 mm i.d., 5 µm particle size; Teknokroma, Barcelona, Spain). A gradient of solvent A (water with 1% formic acid) and solvent B (acetonitrile with 1% formic acid) was used: the proportion of solvent B was increased from 0% to 20% in 20 min, then to 21% over the next 8 min, maintained at 21% for 2 min, then to 30% over the next 10 min, and to 100% over the next 5 min, maintained at 100% B for 5 min and finally returned to the initial conditions over the next 5 min. The flow rate was 1 mL/min and the column temperature was 30 °C. Spectra from all peaks were recorded in the 200–600 nm range and the chromatograms were acquired at 360 nm for flavonoid glycosides and 370 nm for their aglycones.
The quantification of flavonoids was carried out as described by Fuentes-Alventosa et al. [42]. The identification of individual flavonoid glycosides was based on their retention times (tR) and spectroscopic data. The quantification of individual flavonoid monoglycosides and flavonoid diglycosides was directly performed by HPLC-DAD using an eight-point regression curve in the range of 0–250 μg on the basis of standards. Results were calculated from the mean of three replicates.

3.5. Analysis of Saponins

3.5.1. Characterization and Quantification of Saponins by LC-MS

The evaluation of the saponin content was carried out as described by Vázquez-Castilla et al. [25]. An HPLC Waters Alliance (Manchester, UK) system fitted to a Mediterranean Sea C18 reverse-phase analytical column (25 cm length × 4.6 mm i.d., 5 μm particle size; Teknokroma, Barcelona) was used. An elution gradient was used with solvents A (water with 1% formic acid) and B (acetonitrile with 1% formic acid): 0–30 min, 20% B; 30–60 min, linear gradient to 30% B; 60 to 70 min, linear gradient to 100% B; and 70–80 min, linear gradient to 20% B. Saponins were detected using an online connected quadrupole mass analyzer (ZMD4, Micromass, Waters, Inc., Manchester, UK) the flow in the MS was regulated using a split (flow 0.3 mL/min). ESI mass spectra were obtained at ionization energies of 50 and 100 eV (negative mode) and 50 eV (positive mode) with scans from m/z 200 to 1200. The capillary voltage was 3 kV; the desolvation temperature was 200 °C; the source temperature was 100 °C and the extractor voltage was 12 V.
Two different external standards were used: protodioscin and shatavarin IV. For each standard, 10 dilutions from 0 to 500 μg/mL were prepared and injected into the LC−MS system. For each standard, the selected ion chromatogram corresponding to its molecular ion in negative mode at 100 eV was integrated and the peak area was plotted against the concentration and subjected to regression analysis.

3.5.2. Determination of Exact Mass

For the exact mass determination saponin extract was injected in a high resolution LC/MS system. The liquid chromatograph was Dionex Ultimate 3000 HPLC (Thermo Fisher Scientific, Waltham, MA, USA). Chromatographic separation was achieved in the same conditions than low resolution LC-MS (previous section). A split post-column of 0.4 mL/min was introduced directly on the mass spectrometer ion source. Mass spectrometry was performed using a micrOTOF-QII High Resolution Time-of-Flight mass spectrometer (UHR-TOF) with qQ-TOF geometry (Bruker Daltonics, Bremen, Germany) equipped with an ESI. The instrument was operated in negative ion mode using a scan range of m/z 50–1200. Mass spectra were acquired through broad-band Collision Induced Dissociation bbCID mode, providing MS and MS/MS spectra, simultaneously. The instrument control was performed using Bruker Daltonics HyStar 3.2.

3.5.3. Preparation of Saponin Extract and Purification of Individual Saponins

The dried ethanolic extract of the different plant parts of A. acutifolius was dissolved in water and loaded onto a column of Amberlite XAD-16. The column was washed with water followed by 20%, 40% and 96% ethanol, using a ratio of 1/4 (v/v) versus the loaded sample. The saponins were eluted with 40% ethanol. The saponin fraction was repetitively subjected to preparative scale reverse phase HPLC, on an ODS column (Shimadzu Prep K, 2.0 × 25.0 m), eluted with acetonitrile:water (1:1 v/v) at a flow rate of 20 mL/min.

3.5.4. Hydrolysis of Saponins

One hundred µg of each purified saponin and 1 mg of total saponin fractions were separately treated with 2 mL of 1 M H2SO4 in 70% 2-propanol for 2 h at 100 °C. Cholesterol (50 µg) was added as internal standard. Three mL of water were then added. Aglycones were extracted 3 times with 2 mL dichloromethane (CH2Cl2). The organic solution was treated 2 times with 1 mL NH4OH 1 M and the solvent was eliminated. The CH2Cl2 extracts were evaporated to dryness in a rotary evaporator. The obtained aglycones were dissolved in CH2Cl2 (200 µL) and analyzed by gas chromatograph (GC) (Agilent technologies 7820A) coupled to a mass spectrometer (MS) (Agilent technologies 5977E). The column used was an Agilent HP-5MS capillary column (30 m × 0.25 mm i.d., 0.25 μm phase thickness). Helium was used as carrier gas at 1 mL/min. The injector temperature was 260 °C, and the mass spectrometer ion source and interface temperatures were 230 and 280 °C, respectively. The injection volumes (1 μL) were performed in splitless mode. The samples were injected direct (30 s) at an initial oven temperature of 200 °C. After 1 min, the temperature rose at 10 °C/min to 270 °C for 8 min and then at 1 °C/min to 290 °C. The column was held at 290 °C for 28 min. The mass spectra were obtained by electronic impact at 70 eV. Identification of compounds was performed according to those of pure commercial compounds.
The glycosidic part of the saponin was hydrolyzed with trifluoroacetic acid [43] and the released sugars analyzed as alditol acetates [44].

3.6. Determination of Antioxidant Capacity

The antioxidant capacity was determined according to the method of 2,2-diphenyl-1-picrylhydrazyl (DPPH) [45]: ten µL of extract were added to 190 µL of DPPH (3.8 mg/50 mL methanol); after 30 min in the dark, the absorbance was measured (in triplicate) at 480 nm. The efficient concentration EC50, which represents the amount of antioxidant necessary to decrease the initial absorbance by 50%, was calculated from a calibration curve by linear regression for each sample. The activity was expressed as millimoles of Trolox equivalent antioxidant capacity (TEAC) per kilogram of dry sample by means of a dose response curve for Trolox.
The method of 2,2-azino-bis (3 ethylbenzothiazoline-6-sulphonic acid) (ABTS) was also applied and the ABTS assay was performed according to the method of Gonçalves et al. [46], with some modifications [47]. Aliquots of 13 μL of each extract and their dilutions were added to 187 μL of the ABTS•+ solution in a 96-well microplate in triplicate. For each sample, a blank with ethanol instead of ABTS•+ solution was included. A delay of 30 min was programmed into the reader before readings at 414, 655, and 750 nm. The results were expressed in terms of mmol Trolox/Kg of dry sample.
For the determination of ferric reducing antioxidant power, a modification of the Psarra et al. [48] method was applied. FeCl3 was employed as oxidant. Fe2+ ion produced from the redox reaction formed a colored product with 2,2′-dipyridyl. For the determination of the reducing power of extracts, a microplate reader was used. Ten microliters of each extract and their dilutions, and 10 μL of 6 mM FeCl3 in 5 mM citric acid were placed in each microplate well in quadruplicate. For each sample, a blank without FeCl3 was included. After dosification, the microplate was incubated for 20 min at 50 °C in an oven. Then, 180 μL of 5 g/L dipyridyl solution in 1.2% trichloroacetic acid were added to each well. Afterward, a delay of 30 min was programmed into the reader before reading at 490 nm. The results were expressed as millimoles of Trolox equivalent (TE) antioxidant capacity per kilogram of dry sample by means of a dose response curve for Trolox.

3.7. Cytotoxicity against Cancer Cell Lines

Two cancer cell lines were included in the present study. Human colon cancer HCT-116 and human liver cancer HepG2 cell lines were purchased from the American Type Culture Collection (ATCC, Manassas, VA, USA). Cell culture media were as follows: HCT-116: McCoy’s 5A medium supplemented with 10% heat-inactivated fetal bovine serum (FBS), 100 U/mL penicillin, and 100 µg/mL streptomycin; HepG2: Eagle’s Minimum Essential Medium supplemented with 10% heat-inactivated FBS, 100 U/mL penicillin, and 100 µg/mL streptomycin. All cell lines were cultured at 37 °C and 5% CO2 incubators.
Cell viability was assayed based on the ability of live cells to reduce MTT. HCT-116 human colon cancer cells were cultured in 96-well plates in triplicate at a density of 104 cells/well in 200 μL of medium. The cells were grown to 70–80% confluence and then treated with increasing concentrations of plant extracts (ranging from 0 to 600 μg/mL) dissolved in water.
The cells were incubated for 48 h, and then 20 μL of the MTT solution (5 mg/mL in phosphate buffered saline) were added to each well. The cells were incubated for 3 h at 37 °C in a humidified chamber with 5% CO2. The supernatant was then sucked off, after which 100 μL of DMSO were added to each well. The culture plate was gently agitated (about 30 min) to make the purple formazan dissolve completely. The concentration of formazan was measured at 490 nm using a Multiskan Spectrum microplate reader (ThermoLab systems, Boston, MA, USA). The IC50 values were calculated from the regression curves of % cell viability vs extract concentration for each assay. All MTT assays were carried out in three separate trials, each experiment including five replicate sets.

3.8. Pancreatic Lipase Inhibitory Activity Assay In Vitro

Lipase activity was measured using p-NPB (p-nitrophenyl butyrate) as substrate. The method was modified from the one previously described by Kim et al. [49]. Briefly, an enzyme buffer was prepared by the addition 20 μL of solution of porcine pancreatic lipase (20 mg/mL in TRIS buffer, pH 7) to 160 μL of Tris buffer (100 mM Tris-HCl and 5 mM CaCl2, pH 7.0). Then, increasing concentrations of various extracts (ranging from 0 to 11.25 mg/mL) dissolved in TRIS buffer were mixed with 20 μL of the enzyme buffer and incubated for 30 min at 37 °C. Twenty µL of substrate (10 mM p-NPB in dimethyl formamide) were then added. Lipase activity was determined by measuring the hydrolysis of p-NPB to p-nitrophenol at 405 nm using an ELISA reader. The inhibition of lipase activity was expressed as the percentage of absorbance decrease when porcine pancreatic lipase was incubated with the test compounds. Lipase inhibition (%) was calculated according the following formula:
Inhibitory activity (I %) = (A − B)/A × 100
where A is the lipase activity in the reaction solution without sample and B is the lipase activity in the reaction solution containing sample. The measurements were made in triplicate and the IC50 (inhibitory concentration at which 50% inhibition of enzyme activity occurs) values of the test samples were determined by performing the assay as above with varying concentrations of test samples. The IC50 values were determined from the regression curves of inhibition percentage vs extract concentration.

3.9. Antimicrobial Activity

3.9.1. Microbial Strains

The antibacterial activities of the ethanolic extracts of A. acutifolius L. leaves and rhizomes were tested against 15 clinical bacterial (Gram-positive and Gram-negative) and fungal species isolated from various patients and identified at the Charles Nicolle University Hospital of Tunisia. The Gram-positive bacteria were Staphylococcus aureus, Staphylococcus epidermidis, Enterococcus faecalis, Enterococcus faecium, Listeria monocytogenes and methicillin resistant S. aureus (MR). The Gram-negative bacteria included Klebsiella pneumoniae, multidrug resistant Klebsiella pneumoniae (MDR), Salmonella typhimurium, Escherichia coli, Proteus mirabilis, Citrobacter koseri, multidrug resistant Pseudomonas aeruginosa (MDR), Enterobacter cloacae and ß-lactamase-producing E. coli (ESBL) and the fungal species were Geotricum capitatum, Candida albicans, Candida galabrata, Candida parapsilosis and Candida tropicalis. All isolates were identified by cultural, morphological, and biochemical tests. All the strains tested were kept at 4 °C in Mueller–Hinton Agar for bacteria and Sabouraud dextrose agar for fungus they were sub-cultured every month.

3.9.2. Well Diffusion Method

The antibacterial activity of organ extracts was assessed by the agar disk diffusion assay [31] against 15 human pathogenic bacteria. Inoculums were prepared with fresh cultures of microbial strains, cultured on Mueller–Hinton broth (MHB) for 5 h at 37 °C. The agar well diffusion method was used for the determination of inhibition zones. One milliliter of inoculums was mixed with 19 mL of Mueller–Hinton agar (the final concentration of bacteria was 106 CFU/mL). After 10 min, wells (d = 6 mm) were made in the Petri plates. Sixty micro-liters of the filter-sterilized ethanolic extracts of the selected plants parts were dropped into each well (at 100 mg/mL). In order to accelerate the diffusion of the ethanolic extracts of the leaves, pericarps and rhizomes into the agar, the plates were incubated at 4 °C for 1 h followed by incubation at 37 °C for 24 h [31]. The results of the diffusion method displayed as zones of growth inhibition were calculated as the mean of 3 experiments. Gentamicin and spectromicin were used as antibacterial and Amphotericin B as antifungal.
For the antifungal activity, five fungal strains were cultured on Sabouraud Dextrose broth (MHB) for 5 h at 37 °C. The agar well diffusion method was used for the determination of inhibition zones. One milliliter of inoculums was mixed with 19 mL of Sabouraud Dextrose agar for (the final concentration of fungal was 106 CFU/mL). After 10 min, wells (d = 6 mm) were made in the Petri plates. Sixty micro-liters of the filter-sterilized ethanolic extracts of the selected plants parts were dropped into each well (at 100 mg/mL). In order to accelerate the diffusion of the ethanolic extracts of the leaves and rhizomes into the agar, the plates were incubated at 4 °C for 1 h followed by incubation at 37 °C for 24 h. As for the antibacterial activity, the antifungal one was evaluated by measuring the diameter of the growth inhibition zone around the well [31]. The susceptibility of the standard was determined using a disc paper containing 20 µg of amphoterecin B. Each experiment was carried out in triplicate and the mean diameter of the inhibition zone was recorded.

3.9.3. MIC and MBC Determinations for Bacteria

Minimum inhibitory concentration (MIC) and minimum bactericidal concentration (MBC) were determined in the Mueller–Hinton broth (MHB), using the 2-fold macro-dilution method in the Mueller–Hinton broth (MHB) as described by the Clinical and Laboratory Standards Institute (CLSI). The final concentration of bacteria in each macro-broth dilution tube was 5 × 10⁵ CFU/mL of MHB. Serial dilutions of filter-sterilized ethanolic extract (100 to 0.195 mg/mL) were used. The MIC was defined as the lowest concentration of sample that resulted in no visible growth after 24 h of incubation at 37 °C. A total of 100 μL from clear tubes was plated onto Mueller–Hinton agar (MHA) plates [31]. The MBC was defined as the lowest concentration of sample that resulted in ≥ 99.9% kill of the initial inoculums.

3.9.4. MIC and MFC Determinations for Fungal

Minimum inhibitory concentration (MIC) and Minimum Fungicidal Concentration (MFC) were determined in the Sabouraud Dextrose Broth (SDB), using the 2-fold macro-dilution method in the the Sabouraud Dextrose Broth (SDB) as described by the Clinical and Laboratory Standards Institute (CLSI). The final concentration of fungal in each macro-broth dilution tube was 5 × 10⁵ CFU/mL of SDB. Serial dilutions of filter-sterilized ethanolic extract (100 to 0.195 mg/mL) were used. The MIC was defined as the lowest concentration of sample that resulted in no visible growth after 24 h of incubation at 37 °C. A total of 100 μL from clear tubes was plated onto the Sabouraud Dextrose Broth (SDB) plates [31]. The minimum fungicidal concentration was regarded as the lowest extract concentration that hindered visible growth of the subculture (did not yield any fungal growth on the solid medium used).

3.10. Statistical Analysis

All data presented are the mean ± standard errors from three measurements. Comparisons of means were determined by one-way ANOVA, followed by the Duncan Test. Differences were considered significant at p < 0.05. The Statistic 7.0 package was used.

4. Conclusions

The present study showed, for the first time, the bioactive composition of different A. acutifolius organs and their antioxidant, cytotoxic, lipase inhibitory and antimicrobial properties. The results reveal that the stem from this plant contains high amounts of total flavonoids and simple phenolics. Caffeic acid was the major phenolic acid in the ethanolic extracts of the different plant parts of A. acutifolius, followed by significant amounts of ferulic, p-hydroxybenzoic and protocatechuic acids. Flavonoids were detected in all the organs, but their glycosides were only found in the stems. The distribution of saponins varied greatly among A. acutifolius plant parts, with the highest amount being found in the rhizome extract followed by the pericarp, leaf and stem. Stem extracts showed the best antioxidant activity in ferric reducing antioxidant power, and DPPH radical assays. However, the pericarp had the best antioxidant activity in ABTS radical assays. Moreover, the rhizome and leaf extracts exhibited significant cytotoxicity against two carcinoma cell lines (colon cancer HCT-116 and liver cancer HepG2). The pericarp, leaf and rhizome showed good lipase inhibitory activity. The leaf and rhizome extracts were screened for their antimicrobial activity against human bacterial and yeast isolates and the result showed that the leaf extracts exhibited a high inhibition against all the bacteria and yeast tested.
Our study provides valuable evidence that several unused parts of A. acutifolius plants could be great sources of bioactive phytochemicals. These findings also support the proposal that this plant could have great potential as ingredients for functional foods, as they possess protective functions against oxidant-induced damage, obesity, different kinds of cancer, bacteria and yeast. As saponins were the major compounds in the different plant parts of A. acutifolius, further work is needed including the structural characterization of purified saponins obtained in this study, as well as their specific cytotoxic activity against different human cancer cell types.

Author Contributions

A.H. collected test data, interpreted the results, and drafted the manuscript. R.R.-A., S.J.-C. and A.J.-A. helped to draft the manuscript and prepared the figures and tables. N.K.-B. and M.L. performed the statistical analyses. R.G.-B. designed the study and interpreted the results. All authors have read and agreed to the published version of the manuscript.

Funding

This research was funded by the Tunisian Ministry of Scientific Research and Technology and by the Ministerio de Ciencia e Innovación of Spain (AGL2017-82428-R).

Institutional Review Board Statement

Not applicable.

Informed Consent Statement

Not applicable.

Acknowledgments

This work was supported by the Tunisian Ministry of Scientific Research and Technology and by the Ministerio de Ciencia e Innovación of Spain (AGL2017-82428-R). The authors are enormously grateful to Ilhem Boutiba Ben Boubaker (Antibiotic resistance laboratory, Faculty of Medicine of Tunisia) and Saadia Gargouri (Department of parasitology, Military Hospital of Tunis) for their assistance during the antimicrobial analysis and to Mounir Kasri for botanical identification of the plants.

Conflicts of Interest

The authors declare no conflict of interest.

Sample Availability

Samples of the compounds are available from the authors.

References

  1. Barucha, Z.; Pretty, J. The roles and values of wild foods in agriculture systems. Phil. Trans. R. Soc. B. 2010, 365, 2913–2926. [Google Scholar] [CrossRef] [Green Version]
  2. Sánchez-Mata, M.C.; Cabrera, R.D.; Morales, P.; Fernández-Ruiz, V.; Cámara, M.; Díez, C.; Pardode-Santaya, M.; Tardío, J. Wild vegetables of the Mediterranean area as valuable sources of bioactive compounds. Genet. Resour. Crop. Evol. 2011, 59, 431–443. [Google Scholar] [CrossRef]
  3. Guarrera, P.M.; Savo, V. Perceived health properties of wild and cultivated food plants in local and popular traditions of Italy: A review. J. Ethnopharmacol. 2013, 146, 659–680. [Google Scholar] [CrossRef]
  4. García-Herrera, P.; Morales, P.; Cámara, M.; Fernández-Ruiz, V.; Tardío, J.; Cortes Sánchez-Mata, M. Nutritional and Phytochemical Composition of Mediterranean Wild Vegetables after Culinary Treatment. Foods 2020, 9, 1761. [Google Scholar] [CrossRef]
  5. Sergio, L.; Boari, F.; Pieralice, M.; Linsalata, V.; Cantore, V.; Di Venere, D. Bioactive Phenolics and Antioxidant Capacity of Some Wild Edible Greens as Affected by Different Cooking Treatments. Foods 2020, 9, 1320. [Google Scholar] [CrossRef] [PubMed]
  6. Bilušić, T.; Šola, I.; Rusak, G.; Poljuha, D.; Čikeš Čulić, V. Antiproliferative and pro-apoptotic activities of wild asparagus (Asparagus acutifolius L.), black bryony (Tamus communis L.) and butcher’s broom (Ruscus aculeatus L.) aqueous extracts against T24 and A549 cancer cell lines. J. Food Biochem. 2019, 43, e12781. [Google Scholar] [CrossRef] [PubMed]
  7. Di Maro, A.; Pacifico, S.; Fiorentino, A.; Galasso, S.; Gallicchio, M.; Guida, V.; Severino, V.; Monaco, P.; Parente, A. Raviscanina wild asparagus (Asparagus acutifolius L.): A nutritionally valuable crop with antioxidant and antiproliferative properties. Food Res. Int. 2013, 53, 180–188. [Google Scholar] [CrossRef]
  8. Sautour, M.; Miyamoto, T.; Lacaille-Dubois, M.A. Stereoidal saponins from Asparagus acutifolius. Phytochemistry 2007, 68, 2554–2562. [Google Scholar] [CrossRef]
  9. Maccioni, S.; Monti, G.; Flamini, G.; Cioni, P.L.; Morelli, I.; Guazzi, E. Ethnobotanical researches in liguria. the lerrone and the Lower Arroscia Valleys. Atti Soc. Tosc. Sci. Nat. Mem. Ser. B 2004, 111, 129–134. [Google Scholar]
  10. Do, Q.D.; Angkawijaya, A.E.; Tran-Nguyen, P.L.; Huynh, L.H.; Soetaredjo, F.E.; Ismadji, S.; Ju, Y.H. Effect of extraction solvent on total phenol content total flavonoid content and antioxidant activity of Limnophila aromatic. J. Food Drug Anal. 2014, 22, 296–302. [Google Scholar] [CrossRef] [Green Version]
  11. Makris, D.P.; Rossiter, J.T. Domestic processing of onion bulbs and asparagus spears: Effect of flavonol content and antioxidant status. J. Agric. Food Chem. 2001, 49, 3216–3222. [Google Scholar] [CrossRef]
  12. Guillén, R.; Rodríguez, R.; Jaramillo, S.; Rodríguez, G.; Espejo, J.A.; Fernández-Bolaños, J.; Heredia, A.; Jiménez, A. Antioxidants from asparagus spears: Phenolics. Acta Hortic. 2008, 776, 247–253. [Google Scholar] [CrossRef]
  13. Lee, J.W.; Lee, J.H.; Yo, I.H.; Gorinstein, S.; Bae, J.H.; Ku, Y.G. Bioactive compounds, antioxidant and binding activities and spear yield of Asparagus officinalis L. Plant. Foods Hum. Nutr. 2014, 69, 175–181. [Google Scholar] [CrossRef] [PubMed]
  14. Solana, M.; Boschiero, I.; Dall’Acqua, S.; Bertucco, A. A comparison between supercritical fluid and pressurized liquid extraction methods for obtaining phenolic compounds from Asparagus officinalis L. J. Supercrit Fluids 2015, 100, 201–208. [Google Scholar] [CrossRef]
  15. García Giménez, M.D.; De la Puerta, R.; Sáenz, M.T.; Marquez-Martín, A.; Fernández-Arche, M.A. Hypocholesterolemic and hepatoprotective effects of “Triguero” asparagus from Andalusian in rats fed a high cholesterol diet. Evid. Based Complementary Altern. Med. 2012, 814752. [Google Scholar] [CrossRef]
  16. Wang, J.; Liu, Y.; Zhao, J.; Zhang, W.; Pang, X. Saponins extracted from by-product of Asparagus officinalis L. suppress tumour cell migration and invasion through targeting Rho GTPase signalling pathway. J. Sci. Food Agric. 2013, 93, 1492–1498. [Google Scholar] [CrossRef] [PubMed]
  17. Palfi, M.; Jurković, Z.; Ćosić, J.; Tomić-Obrdalj, H.; Jurković, V.; Knežević, N.; Vrandečić, K. Total polyphenol content and antioxidant activity of wild and cultivated asparagus in Croatia. Poljoprivreda 2017, 23, 56–62. [Google Scholar] [CrossRef]
  18. Salvatore, S.; Pellegrini, N.; Brenna, O.V.; Del Rio, D.; Frasca, G.; Brighenti, F.; Tumino, R. Antioxidant characterization of some Sicilian edible wild greens. J. Agric. Food Chem. 2005, 53, 9465–9471. [Google Scholar] [CrossRef] [PubMed]
  19. Barros, L.; Dueñas, M.; Ferreira, I.C.F.R.; Carvalho, A.M.; Santos-Buelga, C. Use of HPLC-DAD-ESI/MS to profile phenolic compounds in edible wild greens from Portugal. Food Chem. 2011, 127, 169–173. [Google Scholar] [CrossRef]
  20. Ferrara, L.; Dosi, R.; Di Maro, A.; Guida, V.; Cafarelli, G.; Pacifico, S.; Mastellone, C.; Fiorentino, A.; Rosati, A.; Parente, A. Nutritional values, metabolic profile and radical scavenging capacities of wild asparagus (A. acutifolius L.). J. Food Compos. Anal. 2011, 24, 326–333. [Google Scholar] [CrossRef]
  21. Lake, R.; Falloon, P.; Cook, D. Replant problem and chemical components of asparagus roots. N. Z. J. Crop. Hortic. Sci. 1993, 21, 53–58. [Google Scholar] [CrossRef]
  22. Symes, A.; Shavandi, A.; Zhang, H.; Mohamed Ahmed, I.A.; Al-Juhaimi, F.Y.; Alaa El-Bekhit, D.A. Antioxidant Activities and Caffeic Acid Content in New Zealand Asparagus (Asparagus officinalis) Roots Extracts. Antioxidants 2018, 7, 52. [Google Scholar] [CrossRef] [Green Version]
  23. Billau, W.; Buchloh, G.; Geiger, H.; Hartmann, H.D. HPLC analysis of phenolic compounds in storage roots of white asparagus (Asparagus officinalis L.) during the vegetation-period. Asparagus Res. Newslett. 1987, 5, 18–19. [Google Scholar]
  24. Hassan, R.A.; Tawfeek, W.A.; Habeeb, A.A.; Mohamed, M.S.; Abdelshafeek, K.A. Investigation of some chemical constituents and antioxidant activity of Asparagus sperngeri. Int. J. Pharm. Pharm. Sci. 2014, 6, 46–51. [Google Scholar]
  25. Vázquez-Castilla, S.; Jaramillo-Carmona, S.; Fuentes-Alventosa, J.M.; Jiménez-Araujo, A.; Rodríguez-Arcos, R.; Cermeño-Sacristán, P.; Espejo-Calvo, J.A.; Guillén-Bejarano, R. Optimization of a method for the profiling and quantification of saponins in different green asparagus genotypes. J. Agric. Food Chem. 2013, 61, 6250–6258. [Google Scholar] [CrossRef]
  26. Vázquez-Castilla, S.; Jaramillo-Carmona, S.; Fuentes-Alventosa, J.M.; Jiménez-Araujo, A.; Rodríguez-Arcos, R.; Cermeño-Sacristán, P.; Espejo-Calvo, J.A.; Guillén-Bejarano, R. Saponin Profile of green asparagus genotypes. J. Agric. Food Chem. 2013, 61, 11098–11108. [Google Scholar] [CrossRef]
  27. Jaramillo-Carmona, S.; Rodriguez-Arcos, R.; Jiménez-Araujo, A.; López, S.; Gil, J.; Moreno, R.; Guillén-Bejarano, R. Saponin Profile of Wild Asparagus Species. Food Sci. 2017, 82, 638–646. [Google Scholar] [CrossRef] [PubMed] [Green Version]
  28. Sauvaire, Y.; Ribes, G.; Baccou, J.C.; Loubatieres-Mariani, M.M. Implication of steroid saponins and sapogenins in the hypocholesterolemic effect of fenugreek. Lipids 1991, 26, 191–197. [Google Scholar] [CrossRef]
  29. Zhu, G.L.; Hao, Q.; Li, R.T.; Li, H.Z. Steroidal Saponins from the Roots of Asparagus Cochinchinensis. Chin. J. Nat. Med. 2014, 12, 213–217. [Google Scholar] [CrossRef]
  30. Podolak, I.; Hubicka, U.; Żuromska-Witek, B.; Janeczko, Z.; Krzek, J. Quantification of saponins in different plant parts of Lysimachia L. Species by validated HPTLC-densitometric method. J. Planar Chromatogr. Mod. TLC 2013, 26, 248–253. [Google Scholar] [CrossRef]
  31. Hamdi, A.; Jaramillo-Carmona, S.; SrairiBeji, R.; Tej, R.; Zaouia, S.; Rodríguez-Arcos, R.; Jiménez-Araujo, A.; Kasri, M.; Lachaal, M.; KarrayBouraoui, N.; et al. The phytochemical and bioactivity profiles of wild Asparagus albus L. plant. Int. Food Res. J. 2017, 99, 720–729. [Google Scholar] [CrossRef]
  32. Papadopoulou, K.; Melton, R.E.; Leggettt, M.; Daniels, M.J.; Osbourn, A.E. Compromised disease resistance in saponin-deficient plants. Proc. Natl. Acad. Sci. USA 1999, 96, 12923–12928. [Google Scholar] [CrossRef] [PubMed] [Green Version]
  33. Phrompittayarat, W.; Jetiyanon, K.; Wittaya-Areekul, S.; Putalun, W.; Tanaka, H.; Khan, I.; Ingkaninan, K. Influence of seasons, different plant parts, and plant growth stages on saponin quantity and distribution in Bacopa monnieri. Warasan Songkhla Nakharin. 2011, 33, 193–199. [Google Scholar]
  34. Jaramillo, S.; Muriana, F.J.G.; Guillen, R.; Jimenez-Araujo, A.; Rodriguez-Arcos, R.; Lopez, S. Saponins from edible spears of wild asparagus inhibit AKT, p70S6K, and ERK signalling, and induce apoptosis through G0/G1 cell cycle arrest in human colon cancer HCT-116 cells. J. Funct. Foods 2016, 26, 1–10. [Google Scholar] [CrossRef] [Green Version]
  35. Bousserouel, S.; Le Grandois, J.; Gossé, F.; Werner, D.; Barth, S.W.; Marchioni, E.; Marescaux, J.; Raul, F. Methanolic extract of white asparagus shoots activates TRAIL apoptotic death pathway in human cancer cells and inhibits colon carcinogenesis in preclinical model. Int. J. Oncol. 2013, 43, 394–404. [Google Scholar] [CrossRef] [Green Version]
  36. Khan, K.M.; Nahar, L.; Mannan, A.; Arfan, M.; Khan, G.A.; Al-Groshi, A.; Evans, A.; Dempster, N.M.; Ismail, F.M.D.; Sarker, S.D. Liquid chromatography mass spectrometry analysis and cytotoxicity of Asparagus adscendens roots against human cancer cell lines. Pharmacogn. Mag. 2017, 13, S890–S894. [Google Scholar]
  37. Liu, W.; Ning, R.; Chen, R.N.; Huang, X.F.; Dai, Q.S.; Hu, J.H.; Wang, Y.W.; Wu, L.L.; Xiong, J.; Hu, G.; et al. Aspafilioside B induces G2/M cell cycle arrest and apoptosis by up-regulating H-Ras and N-Ras via ERK and p38 MAPK signaling pathways in human hepatoma HepG2 cells. Mol. Carcinog. 2015, 55, 440–457. [Google Scholar] [CrossRef]
  38. Visavadiya, N.P.; Narasimhacharya, A.V. Asparagus root regulates cholesterol metabolism and improves antioxidant status in hypercholesterolemic rats. Evid. Based Compl. Alt. Med. 2007, 6, 219–226. [Google Scholar] [CrossRef] [PubMed] [Green Version]
  39. Zhu, X.; Zhang, W.; Zhao, J.; Wang, J.; Qu, W. Hypolipidaemic and hepatoprotective effects of ethanolic and aqueous extracts from Asparagus officinalis L. by-products in mice fed a high-fat diet. J. Sci. Food Agric. 2010, 90, 1129–1135. [Google Scholar] [CrossRef]
  40. Weidner, S.; Paproka, J.; Lukaszewicz, D. Change in free, sterified and glycosidic phenolic acids in cereal grains during the after-ripening. Seed Sci. Technol. 1996, 24, 107–114. [Google Scholar]
  41. Sosulski, F.; Krygier, K.; Hogge, L. Free, esterified, and insoluble- bound phenolic acids 3. Composition of phenolic acids in cereal and potatoe flours. J. Agric. Food Chem. 1982, 30, 337–340. [Google Scholar] [CrossRef]
  42. Fuentes-Alventosa, J.M.; Rodríguez, G.; Cermeño-Sacristán, P.; Jiménez, A.; Guillén, R.; Fernández-Bolaños, J.; Rodríguez-Arcos, R. Identification of flavonoid diglycosides in several genotypes of asparagus from the Huétor Tájar population variety. J. Agric. Food Chem. 2007, 55, 10028–10035. [Google Scholar] [CrossRef] [PubMed]
  43. De Ruiter, J.; Burns, J. Characterization of trifluoroacetic acid hydrolyzed subtropical forage grass cell walls. J. Agric. Food Chem. 1987, 4, 308–316. [Google Scholar] [CrossRef]
  44. Englyst, H.N.; Cummings, J.H. Simplified method for the measurement of total non-starch polysaccharides by gas-liquid chromatography of constituent sugars as alditol acetates. Analyst 1984, 109, 937–942. [Google Scholar] [CrossRef]
  45. Rodriaguez, R.; Jaramillo, S.; Rodriaguez, G.; Espejo, J.A.; Guillean, R.; Fernaandez-Bolanos, J.; Heredia, A.; Jimeanez, A. Antioxidant Activity of Ethanolic Extracts from Several Asparagus Cultivars. J. Agric. Food Chem. 2005, 53, 5212–5217. [Google Scholar] [CrossRef] [PubMed]
  46. Gonçalves, B.; Falco, V.; Moutinho-Pereira, J.; Bacelar, E.; Peixoto, F.; Correia, C. Effects of elevated CO2 on grapevine (Vitis Vinifera L.): Volatile composition, phenolic content, and in vitro antioxidant activity of red wine. J. Agric. Food Chem. 2009, 57, 265–273. [Google Scholar] [CrossRef] [PubMed]
  47. Rubio-Senent, F.; Rodríguez-Gutiérrez, G.; Lama-Muñoz, A.; Fernández-Bolaños, J. New phenolic compounds hydrothermally extracted from the olive oil by-product alperujo and their antioxidative activities. J. Agric. Food Chem. 2012, 60, 1175–1186. [Google Scholar] [CrossRef]
  48. Psarra, E.; Makris, D.P.; Kallithraka, S.; Kefalas, P. Evaluation of the antiradical and reducing properties of selected Greek whitewines: Correlation with polyphenolic composition. J. Sci. Food Agric. 2002, 82, 1014–1020. [Google Scholar] [CrossRef]
  49. Kim, J.; Jang, D.S.; Kim, H.; Kim, J.S. Anti-lipase and lipolytic activities of ursolic acid isolated from the roots of Actinidia arguta. Arch. Pharm. Res. 2009, 32, 983–987. [Google Scholar] [CrossRef]
Figure 1. Chromatographic profile acquired by GC-MS of genin standards (A), hydrolyzed acid of saponin fraction of A. acutifolius organs (B) and mass spectra of sarsasapogenin (C). 1: Esmilagenin, 2: Sarsasapogenin, 3: Diosgenin, IS: Internal standard cholesterol.
Molecules 26 03328 g001
Figure 2. Chromatographic profile acquired by GC-MS of sugar standards (A), the major saponins detected in the hydrolyzed acid of A. acutifoius organs; (B), HTSAP-3, (C), HTSAP-6, (D), HTSAP-3 and ACSAP-1. 1: Rhamnose, 2: Fucose, 3: Arabinose, 4: Xylose, 5; Mannose, 6: Galactose, 7: Glucose, IS: Inter- standard; Inositol.
Molecules 26 03328 g002
Figure 3. Antioxidant activities, expressed as mmol Trolox equivalent/Kg of dry weight in A. acutifolius leaf, stem, pericarp and rhizome ethanolic extracts, determined by DPPH, FRAP and ABTS assays. DPPH: DPPH radical scavenging activity; FRAP: Ferric reducing antioxidant power; ABTS: ABTS radical scavenging activity. Results correspond to the mean ± standard deviation of three replicates. Different letters (a–d) indicate that the values are significantly different (p < 0.05). The comparison is for different samples with the same method.
Molecules 26 03328 g003
Figure 4. Cell viability assay on colon cancer (HCT-116) and human hepatocellular carcinoma (HepG2) cells after 24 and 48 h incubation with serial concentrations of the different organs’ ethanolic extracts from A. acutifolius. (A) Rhizome, (B) Stem, (C) Leaf and (D) Pericarp. The effect was measured by the MTT cell viability assay and the cytotoxic activities expressed as IC50 μg/mL of dry weight. Results correspond to the mean ± standard deviation of three replicates.
Molecules 26 03328 g004
Figure 5. Pancreatic lipase inhibitory activity of leaf, stem, pericarp and rhizome ethanolic extracts of A. acutifolius. The pancreatic lipase inhibitory activity was expressed as IC50 μg/mL of dry weight. Results correspond to the mean ± standard deviation of three replicates IC50 values followed by different letters are statistically different. NA: no activity.
Molecules 26 03328 g005
Table 1. Flavonoids and simple phenolic compositions of different plant part extracts from A. acutifolius.
PhenolicsLeafStemPericarpRhizome
Gallic acid36.63 ± 0.54 and36.24 ± 0.07 a36.81 ± 0.73 a
Protocatechuic acid14.62 ± 0.06 a25.92 ± 0.27 d18.63 ± 0.07 c16.51 ± 0.06 b
p-hydroxybenzoic acid23.51 ± 0.04 b15.26 ± 0.09 a25.05 ± 0.10 c36.72 ± 0.18 d
Vanillic acid8.94 ± 0.07 b10.61 ± 0.05 c3.70 ± 0.10 a41.11 ± 0.02 d
Caffeic acid39.42 ± 0.11 a297.05 ± 5.89 d67.78 ± 0.33 c48.82 ± 0.26 b
p-hydroxybenzaldehyde11.36 ± 0.09 b9.97 ± 0.22 a12.26 ± 0.14 c17.67 ± 0.09 d
Syringic acid9.36 ± 0.05 b0.67 ± 0.14 and37.98 ± 0.20 c
Vanillin13.95 ± 0.09 b12.07 ± 0.05 and12.76 ± 0.65 a
p-Coumaric acid2.95 ± 0.24 a6.79 ± 0.13 b13.58 ± 0.10 c15.34 ± 0.12 d
t-ferulic acid34.73 ± 0.11 c27.53 ± 0.02 a30.06 ± 0.11 b34.90 ± 0.17 c
t-Sinapic acid9.75 ± 0.11 b9.11 ± 0.04 a9.59 ± 0.22 b13.17 ± 0.05 c
Rutinnd316.27 ± 31.63ndnd
Narcissinnd154.10 ± 6. 86ndnd
Quercetinndnd9.08 ± 0.20 a9.60 ± 0.09 b
Naringenin22.89 ± 0.29 c61.27 ± 0.09 d1.51 ± 0.05 a4.88 ± 0.34 b
Kaempferol22.08 ± 0.22 b4.94 ± 0.15 and27.06 ± 0.11 c
Total simple phenolics205.23 ± 1.28 a414.99 ± 6.90 d216.88 ± 1.25 b311.80 ± 1.23 c
Total flavonoids44.98 ± 0.51 c536.55 ± 25.01 d10.59 ± 0.26 a41.54 ± 0.54 b
Total phenolics250.20 ± 1.79 b951.54 ± 31.91 d227.47 ± 1.50 a353.34 ± 1.77 c
Data mg/kg dry leaves, pericarp, stem and rhizome are the mean of three replicates. Results correspond to the mean ± standard deviation. Different letters within the same row (a–d) mean that there are significant differences (p < 0.05). nd, not detected.
Table 2. Characterization of the saponins tentatively identified by LC-MS (+/−) of the ethanolic extracts of different organs from A. acutifolius.
Molecular Ion (m/z)Ion Fragmentation
SaponinRt a (min)Formula[M − H]-Experimental[M − H]-
Theoretical
Error
(ppm)
Neg ModePos Mode
HTSAP-124.9C50H83O231051.53311051.52844.4b Pen919-c Hex757-Hex595-Hex433[-Na-H2O]1035-Hex873-Hex711-Pen579-Hex417 e
ACSAP-127.8C50H83O231051.53311051.53062.4Pen919-Hex757-Hex595-Hex433[-Na-H2O]1035-Hex873-Hex711-Pen579-Hex417
HTSAP-329.6C49H83O221021.52251021.52121.2Pen889-Pen757-Hex595-Hex433[-Na-H2O]1005-Pen873-Hex711-Pen579-Hex417
HTSAP-632.9C50H83O231035.53811035.53830.1Pen903-d DoHex757-Hex595-Hex433 e[-Na-H2O]1019-DoHex873-Pen741-Hex579-Hex417
ACSAP-242.2C44H71O18887.4646887.46015Pen755-Hex593-Hex431 e[-Na-H2O]871-Hex709-Pen577-Hex415 e
ACSAP-344.1C43H69O17857.4540857.45034.3Pen725-Pen593-Hex431[-Na-H2O]841-Pen709-Pen577-Hex415
a Rt: retention time. b Pen: Pentose. c Hex: Hexose. d DoHex: Deoxyhexose. e 433,431,417,415: Genins.
Table 3. Saponins identified in the leaf, stem, pericarp and rhizome ethanolic extracts of A. acutifolius, calculated from the molecular ion of the peak area obtained by HPLC-MS.
SaponinLeafStemPericarpRhizome
HTSAP-1530.4 ± 8.1
7%
254.3 ± 27.6
18%
215.5 ± 4.5
2%
8355.0 ± 607.8
24%
ACSAP-1882.1 ± 37.6
12%
220.0 ± 2.7
16%
2988.3 ± 132.1
25%
nd
HTSAP-3353.7 ± 2.3
5%
96.3 ± 5.6
7%
509.9 ± 51.5
4%
16,273.6 ± 493.0
47%
HTSAP-65354.1 ± 10.8
75%
899.5 ± 48.2
63%
6935.1 ± 348.3
59%
7169.2 ± 157.7
21%
ACSAP-2ndndnd928.9 ± 39.6
3%
ACSAP-3ndndnd1704.02 ± 134.3
5%
Total saponins7120.4 ± 20.9 b1418.6 ± 72.9 a10,648.7 ± 563.4 c34,430.8 ± 1353.2 d
Data mg/kg dry leaves, pericarp, stem and rhizome are the mean of three replicates. Results correspond to the mean ± standard deviation of three replicates. Different letters within the same row (a–d) mean that there are significant differences (p < 0.05). nd: not detected.
Table 4. Antibacterial and antifungal activities of leaf and rhizome ethanol extracts of A. acutifolius.
Zone of Inhibition (mm)
Bacteria
(Clinical Isolate)
Ethanolic ExtractStandard Antibiotics
LeafRhizomeGentStrepto
Gram+
Staphylococcus aureus16 ± 4.3 a0 ± 026 ± 1.6 c21 ± 0.0 b
Methicillin resistant Staphylococcus aureus (MR)18 ± 1.6 c13 ± 1.2 a16 ± 1.6 b21 ± 0.0 d
Staphylococcus epidermidis14 ± 2.8 a13 ± 1.4 a 36 ± 0.0 c25 ± 0.0 b
Enterococcus faecalis17 ± 2.8 c14 ± 4.3 b12 ± 0.0 a0 ± 0
Enterococcus faecium17 ± 7.1 a20 ± 7.1 b45 ± 0.0 d30 ± 0.0 c
Listeria monocytogenes17 ± 3.2 c0 ± 014 ± 0.0 b12 ± 0.0 a
Gram-
Klebsiella pneumonia14 ± 2.8 b11 ± 00 a35 ± 0.0 d30 ± 0.0 c
Multidrug resistant Klebsiella pneumoniae (MDR)18 ± 2.8 b 12 ± 1.6 a21± 0.0 c0 ± 0
Salmonella typhimurium22 ± 4.3 c12 ±1.6 a26 ± 0.0 d16 ± 0.0 b
Escherichia coli17 ± 8.511 ±1.620 ± 0.012 ± 0.0
Extended spectrum ß-lactamase producing (ESBL) Escherichia coli 15 ± 4.3 b0 ± 010 ± 1.6 a0 ± 0
Enterobacter cloacae18 ± 5.8 c11 ± 0 a22 ± 0.0 d16 ± 0.0 b
Multidrug resistant Pseudomonas aeruginosa (MDR)16 ± 3.2 b14 ± 4.3 a22 ± 0.0 c14 ± 0.0 a
Citrobacter koseri16 ± 5.6 b12 ± 1.6 a24 ± 0.0 d18 ± 0.0 c
Proteus mirabilis14 ± 3.2 a0 ± 030 ± 0.0 b0 ± 0
Fungal Amph B
Geotricum capitatum26 ± 3.2 c16 ± 7.1 a22 ± 0.0 b
Cándida albicans13 ± 1.6 b13 ± 1.6 b11 ± 0.0 a
Cándida galabrata15 ± 2.8 a19 ± 3.2 b14 ± 0.0 a
Cándida parapsilosis27 ± 4.3 b26 ± 7.1 b18 ± 0.0 a
Cándida tropicalis21 ± 9 b21 ± 1.6 b12 ± 0.0 a
Results correspond to the mean ± standard deviation of three replicates. Different letters within the same row mean that there are significant differences (p < 0.05). Gent: gentamicine. Strepto: streptomicin, Amph B: amphotericine B. Diameter of disc used is equal to 6 mm.
Table 5. Minimal inhibition concentrations (MICs), minimal bactericidal concentrations (MBCs) (mg/mL) and minimal fungicidal concentration (MFC) of selected extracts of A. acutifolius against bacteria and fungi.
Bacteria
(Clinical Isolate)
Ethanolic Extract
LeafRhizome
Gram+MICMBCMICMBC
Staphylococcus aureus0.7812.5--
Methicillin resistant Staphylococcus aureus (MR)0.396.253.1250
Staphylococcus epidermidis1.56253.1250
Enterococcus faecalis0.396.251.5625
Enterococcus faecium0.396.250.1953.125
Listeria monocytogenes0.396.25--
Gram-
Klebsiella pneumonia1.56253.1250
Multidrug resistant (MDR) Klebsiella pneumonia 0.396.253.1250
Salmonella typhimurium0.1953.1253.1250
Escherichia coli0.396.253.1250
Extended spectrum ß-lactamase producing (ESBL) Escherichia coli 1.5625--
Enterobacter cloacae0.396.253.1250
Multidrug resistant Pseu-domonas aeruginosa (MDR)0.7812.51.5625
Citrobacter koseri0.7812.53.1250
Proteus mirabilis1.5625--
FungalMICMFCMICMFC
Geotricum capitatum0.0960.1950.1950.390
Cándida albicans0.1950.3900.1950.390
Cándida galabrata0.1950.3900.1950.390
Cándida parapsilosis0.0960.1950.0960.195
Cándida tropicalis0.1950.3900.1950.390
Publisher’s Note: MDPI stays neutral with regard to jurisdictional claims in published maps and institutional affiliations.

