Abstract
The dimeric dihydropyrimidine dehydrogenase (DPD), metalloenzyme, an adjunct anti-cancer drug target, contains highly specialized 4 × Fe2+4S2−4 clusters per chain. These clusters facilitate the catalysis of the rate-limiting step in the pyrimidine degradation pathway through a harmonized electron transfer cascade that triggers a redox catabolic reaction. In the process, the bulk of the administered 5-fluorouracil (5-FU) cancer drug is inactivated, while a small proportion is activated to nucleic acid antimetabolites. The occurrence of missense mutations in DPD protein within the general population, including those of African descent, has adverse toxicity effects due to altered 5-FU metabolism. Thus, deciphering mutation effects on protein structure and function is vital, especially for precision medicine purposes. We previously proposed combining molecular dynamics (MD) and dynamic residue network (DRN) analysis to decipher the molecular mechanisms of missense mutations in other proteins. However, the presence of Fe2+4S2−4 clusters in DPD poses a challenge for such in silico studies. The existing AMBER force field parameters cannot accurately describe the Fe2+ center coordination exhibited by this enzyme. Therefore, this study aimed to derive AMBER force field parameters for DPD enzyme Fe2+ centers, using the original Seminario method and the collation features Visual Force Field Derivation Toolkit as a supportive approach. All-atom MD simulations were performed to validate the results. Both approaches generated similar force field parameters, which accurately described the human DPD protein Fe2+4S2−4 cluster architecture. This information is crucial and opens new avenues for in silico cancer pharmacogenomics and drug discovery related research on 5-FU drug efficacy and toxicity issues.
1. Introduction
Dihydropyrimidine dehydrogenase (DPD; EC 1.3.1.2) is the initial rate-limiting enzyme in the triple-step pyrimidine-based catabolic pathway [1,2]. The enzyme is involved in the degradation of pyrimidine bases (thymine and uracil) via a NADPH-dependent reaction to 5,6-dihydrothymine and 5,6 dihydrouracil, respectively [1]. Besides its biological nucleotide catabolizing function, the enzyme is an adjunct anti-cancer drug target [3]. It is solely responsible for the phase 1 metabolism of 5-fluorouracil (5-FU), a commonly prescribed pyrimidine-like anti-cancer drug. During 5-FU metabolism, the bulk (80–85%) of the administered dose is rapidly inactivated to dihydroflourouracil (DHFU). Additionally, a small proportion (1–3%) of the administered drug is activated to fluorodeoxyuridine monophosphate (FdUMP) and fluorouridine triphosphate (FUTP), leading to inhibition of DNA synthesis and RNA processing. The remaining 12–19% unmetabolized 5-FU form is excreted in the urine [4]. As such, deficiency or reduced levels of DPD enzyme, as well as sequence variation due to mutations, have been reported to cause fluoropyrimidine associated toxicity effects [5,6]. Thus, understanding the implication of mutations for the catalytic mechanism of DPD can improve treatment approaches for oncology patients. Although there is a growing interest in molecular investigations of DPD enzyme, especially via computational approaches such as molecular dynamics (MD) simulations [7], a significant hindrance of the implementation of such studies is the presence of four iron-sulfur (Fe2+4S2−4) clusters in the homodimeric form of the DPD structure, which require additional force field parameters.
1.1. DPD Structure and Mechanism of Action
In this study, our interest is in the human DPD protein. However, since we used the crystal structure of a pig homolog to build the 3D human model, we will define the structural features from the template structure.
The 222 kDa homodimeric DPD pig structure (PDB ID: 1H7X) [2,8] enzyme consists of one ligand (5-FU represented as URF), a cofactor (nicotinamide adenine dinucleotide phosphate (NADPH)), two protein-bound organic cofactors (flavin adenine dinucleotide (FAD) and flavin mononucleotide (FMN)), and four inorganic Fe2+4S2−4 clusters. Each of the 1020 residue monomers has five domains: domain one (residues 27–173, 2 × Fe2+4S2−4 clusters); domain two (residues 174–286 and 442–524) and three (residues 287–441) are the NADPH- and FAD-binding domains, respectively; domain four (FMN, URF residue 535–847; active-site loop residues 675–679) and domain five (residues 1–26 and 848–1017; 2 × Fe2+4S2−4) (Figure 1) [1,2,9,10]. Additionally, the two Fe2+4S2−4 (hetero atoms 1028 and 1029) clusters in domain four of the same chain are in very close proximity to domain five Fe2+4S2−4 (hetero atoms 1026 and 1027) clusters of the opposite chain [9,10]. The FMN/pyrimidine binding domain of each chain is closely positioned to the corresponding C-terminal domain (2 x Fe2+4S2−4 clusters) [1,2,10]. This arrangement is crucial for the electron transfer pathway from the NADPH donor molecule to pyrimidine binding sites [1,2,10]. However, the exact mechanism of how these redox cofactors participate in the reaction is largely unknown [11]. Previous studies have indicated that the Fe2+4S2−4 clusters tend to form a bridge between FMN and FAD cofactors for electron transport to the active site [9,12,13,14].
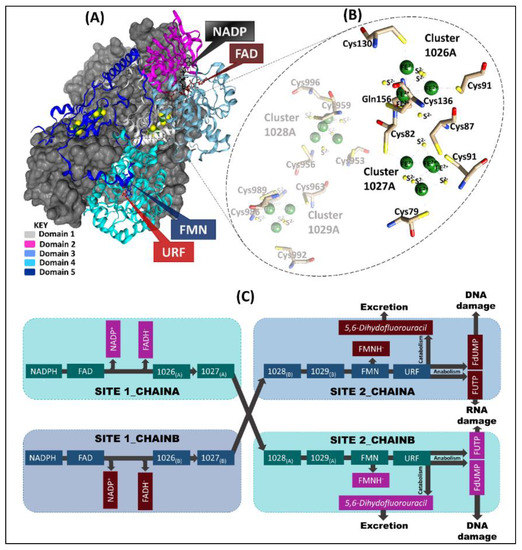
Figure 1.
A comprehensive representation of chain-A and chain-B of the pig DPD template (PDB ID: 1H7X) crystal structure. (A) Chain-A domains (1–5) are colored (teal, magenta, light grey, and light and dark blue, respectively) and the cofactors are represented as sticks. The grey surface represents chain-B, which is a mirror image of chain-A. (B) Highlights the Fe2+4S2−4 clusters coordinating environment of chain-A. (C) The electron transport process in which 2 electrons are lost from nicotinamide-adenine-dinucleotide phosphate (NADPH) via flavin adenine dinucleotide (FAD) and Fe2+4S2−4 (1026 and 1027) clusters in site 1 of both chains, for the reduction of URF (5-FU) in site 2 of the opposite chain via Fe2+4S2−4 (1028 and 1029) clusters and flavin mononucleotide (FMN).
The Fe2+4S2−4 clusters manifest a distorted tetrahedron cubane-like geometry [1,2,15]. Each Fe2+ in three of the clusters (1027, 1028, and 1029) is coordinated by cysteine residues and connected by disulfide bridges ([Fe2+4S2−4 (S-Cys)4]). However, cluster 1026 depicts a unique coordination, in which four Fe2+ atoms are inter-connected by disulfide bridges, three of which are bound to the protein backbone by a cysteine residue side chain, while the fourth is bound via a glutamine residue ([Fe2+4S2−4 (S-Cys)3(S-Gln)]) side chain [1,2,9,10,15].
1.2. The Study
Although there is an increased interest in the protein metal interactions, prompted by the essential physiological roles played by metal ions [15,16,17], the Fe–S (Gln) coordination in cluster 1026 is yet to be reported in other Fe2+4S2−4 cluster containing proteins [1,2]. Metal ions such as iron (Fe2+) are crucial components of a protein’s electron transportation, as they trigger the activation process in the catalytic subunit. Additionally, they perform important stabilization and homeostatic functions in a protein [18]. As a result, these metal ions form a highly organized geometric arrangement with specific highly conserved residues [19].
We can gain insights into metal coordinating environments through computational studies, especially via molecular dynamics (MD) simulation. However, MD calculations are highly dependent on force fields derived through quantum mechanics (QM), and molecular mechanics (MM) approaches [20,21]. MM methods employ classical-type models to predict the amount of energy in a molecule, based on its conformation [22]. Compared to QM approaches, MM methods are computationally cheaper and sufficient for describing atomic interactions and dynamics of a purely organic system. However, most of the available MM force fields cannot accurately describe the metal/organic interface occurring in metalloproteins, as they ignore their induced explicit electronic degree of freedom [23]. To account for the electronic effects of the metals, de novo QM/MM calculations have been employed to describe the precise electron structure of atoms around a metal center [24,25,26]. Due to the importance of metals in protein function, the development of novel force field parameters using either hybrid QM/MM or pure QM approaches for describing various transition metal architectures is gaining pace [27]. This has led to numerous modified force fields that have been incorporated in several force field families, such as the optimized potentials for liquid simulations (OPLS-AA) [28], Gronigen molecular simulation (GROMOS) [29], chemistry at Harvard molecular mechanics (CHARMM) [30,31], and assisted model building with energy refinement (AMBER) [32]. Both CHARMM and AMBER are widely used. They give a large palette of atom types, allowing several organic molecules to be represented by assigning atom types based on chemical similarity [33,34]. OPLS-AA [35,36] optimizations focus on the condensed phase properties of small molecules, and have since been extended to include a diverse set of small molecule model compounds. However, atom type assignment must be done manually. It worth noting that a commercial implementation of OPLS-AA with atom typing functionality is available [37]. On the other hand, CHARMM has been enhanced with the CHARMM general force field (CGenFF), which not only covers a wide range of chemical groups found in biomolecules and drug-like molecules, but also many heterocyclic scaffolds [38,39]. Furthermore, a web interface for automatic atom typing and analogy-based parameter and charge assignment is now available [40,41]. The GROMOS force field atom type palette offers a pool of diversity for the construction of small molecule models with a force field derived from biopolymer parameters [29]. The general AMBER force field (GAFF) [42] and the antechamber toolkit are now included in AMBER [33,43,44] allowing the user to generate an AMBER [32,45] force field model for any input molecule. Besides the associated simulation speeds and exportable parameters, the development of a Python-based metal parameter builder (MCPB.py) [46], which supports various AMBER force fields and >80 metal ions, has made the parametrization of inorganic constituents in proteins more facile. These advantages make AMBER the most preferred platform for the development of metal parameters for use in simulations involving metalloproteins. Hitherto, various methods, such as the polarization model, and non-bonded, semi-bonded, and bonded models, have been implemented to characterize metalloproteins. The non-bonded model uses non-covalent (van der Waals and electrostatic forces) interaction to define metal centers [43,44], whereas, semi-bonded [47,48] models put dummy atoms around metals to resemble electron orbitals. However, these two methods are incapable of taking into account charge transfer and polarization effects around the metal centers [49]. These shortcomings have been solved by incorporating the charge transfer and polarization effects in potential energy function models [50,51]. Contrastingly, the bonded model utilizes defined harmonic energy terms, which have been introduced into possible energy function to account for the bond formation between atoms and metal centers [48,52,53][ The approaches mentioned above have been extensively used in studies to characterize Fe2+ centers in a range of metalloproteins [52,53,54,55]. Among other Fe2+ clusters, Carvalho and colleagues [54] satisfactorily generated AMBER force field parameters for Fe2+4S2−4 clusters coordinated by cysteine residues. However, none of these parameters featured glutamine residue coordination to the Fe2+ center or developed parameters for the structures of composite multiple clusters, besides applying two approaches. To the best of our knowledge, this is the first study to determine the human DPD protein metal force field parameters.
Collectively, the current study integrates MM with QM techniques to determine accurate force field parameters for 8 × Fe2+4S2−4 cluster complexes of the modeled human DPD proteins. We utilized the bonded method of QM and Seminario techniques in our calculations [27]. More specifically, the density functional theory (DFT) of the QM approach was used to derive Fe2+ center AMBER parameters for two models using different Seminario methods. The first method (viz. Model 1) used the original Seminario [56] method [46], whereas the second method (viz. Model 2) used collation features Visual Force Field Derivation Toolkit (VFFDT) Seminario [57]. A comparison of the parameters from the two methods was performed and their reliability evaluated via all atom MD simulations. For the first time, the current study reports novel force field parameters for multiple Fe2+4S2−4 clusters, coordinated to both cysteine and glutamine residues. Furthermore, the reliability of the two parameter generation approaches was also evaluated and found to be comparable. The newly derived force field parameters can be adopted by other systems depicting a similar Fe2+ coordinating environment. More importantly, the establishment of these parameters creates an avenue for further molecular studies to fully understand the functional mechanism of the human DPD protein, and to decipher the effects of missense mutations on drug metabolism and cancer drug toxicity issues. As part of our ongoing investigations about the effects of known variants in human DPD, especially on its structure and stability, the reliability of the current parameters has been confirmed and the findings will be published as a follow-up study. Furthermore, different methods, such as the identification of new mutants, coupled with structural analysis and clinical studies, i.e., phenotyping of DPD, has had a great impact on the understanding of the structural and functional effects of these mutations [6]. Together, these results will be crucial, not only for understanding how mutations lead to 5-FU toxicities, but also to better inform the implementation of precision medicine in cancer treatment.
2. Results and Discussion
2.1. Human DPD 3D Wild Type (WT) Complete Structure Determined via Homology Modeling Approaches
The availability of accurate and complete 3D structural information is a fundamental aspect for molecular studies aimed at understanding protein function. With the absence of the human DPD X-ray structure in the protein data bank (PDB) [8], homology modeling approaches were used to calculate accurate models of the human DPD enzyme using MODELLER v9.15 [58], DiscoveryStudio4.5 [59], and pig X-ray structure (PDB ID: 1H7X, 2.01 Å) as a template [1,2]. The choice of the template was guided by the high sequence identity (93%) with the target human DPD enzyme. Additionally, it was in complex with the drug of interest (5-FU) and had a complete query coverage of 100%. Using the very slow refinement level in MODELLER v9.15, 100 apo protein models were generated. The three best models, with the lowest z-DOPE scores of −1.36, −1.36, and −0.88, were chosen for further validation. z-DOPE score evaluates the closeness of a model in comparison with the native structure, based on atomic distance-displacement statistical potential, with a score of ≤−1.0 being considered as a near-native structure [60,61]. Consequently, holo (apo and cofactors) and holo-drug (5-FU) complex structures were generated by incorporating the non-protein coordinates from the template in Discovery Studio 4.5 [59]. Additional model quality assessment (Table S1) was performed using the VERIFY3D webserver [62], qualitative model energy analysis (QMEAN) [63], protein structure analysis (ProSA) [64], and program to check the stereochemical quality of protein structures (PROCHECK) [65]. VERIFY3D utilizes pairwise interaction derived energy potentials to evaluate the local quality of a model, based on each residue structure environment [62]. High-quality structures are predicted to have more than 80% of their residues with a 3D-1D score of 0.2 or higher [62]. The modeled structures had 3D-ID scores of 0.2 or higher (Table S1) in 85.01% of its residues. QMEAN estimates the quality of the submitted model based on its physicochemical properties, then derives a value corresponding to the overall quality of the structure and compares it to the calculated QMEAN-scores of 9766 high-resolution experimental structures [63]. The modelled structures of DPD holo and holo–drug complexes had a QMEAN-score of 0.90 and 0.89, which is similar to that of high-resolution experimental structures. ProSA assesses the quality of the submitted model by calculating its potential energy and comparing the resulting score to that of the experimental structures available in PDB [64]. The Z-score of each monomer of the holo and holo–drug complexes was between −13.41 and −13.56, which is similar to NMR structures of the same size.
PROCHECK assesses the stereochemical quality of the submitted protein models based on their phi/psi angle arrangement and then produces Ramachandran plots, which show the protein residues positions on the most favored, allowed, and disallowed regions [65]. Each generated model had more than 83.8%, 16.0%, and 0.2% of their residues in the most favored, allowed, and disallowed regions, respectively, suggesting a good distribution of torsion angles (Table S1). Overall, constructed holo and holo–drug complexes with consistently high-quality scores were obtained.
To remove steric clashes in the generated models (holo and holo-drug), 100 steps of minimization, with the steepest descent algorithm using the GROMACS 5.14 MD simulation package [66], were performed and determined to be suitable for subsequent calculations.
2.2. AMBER Force Field Parameters Generated Using Bonded Approaches
The metal coordination geometries in proteins are highly dependent on the protonation states of the residues involved. Thus, to achieve the correct geometry arrangements in the human DPD protein, the protonation states of all titratable resides were determined at a pH of 7.5, using the H++ webserver (http://biophysics.cs.vt.edu/H++, accessed on 12 December 2019) [67] (Table S2). To ensure correct protonation, a visual inspection of all titratable residues was performed and corrected using Schrödinger Maestro version 11.8 [68]. Table 1 shows the protonation states of residues forming a bond with the metal ions in the Fe2+4S2−4 clusters. Cys was protonated as CYM and interacted with the Fe2+ center through a sulfur (SG) bond. On the other hand, Gln was protonated as GLH to coordinate with the Fe2+ ion through the oxygen (OE) atom.

Table 1.
The protonation states and their pKa values of metal coordinating residues in human DPD protein model.
The AMBER force field parameters of the Fe2+4S2−4 clusters in the human DPD protein were calculated using two approaches: the original Seminario method (Model 1) and the collation features Seminario approach in visual-force field derivation tool (VFFDT) (Model 2). In each chain, two distinct residue coordinating environments were identified. Cluster 1026 (4 × Fe2+, 4 × S2−, 3 × Cys and 1 × Gln) coordination was different from those of clusters 1027, 1028, and 1029 (4 × Fe2+, 4 × S2− and 4 × Cys). The four Fe2+ (FE1, FE2, FE3, FE4) bonded to the four S2− (S1, S2, S3, S4) ions to form internal coordinates. Whereas, four cysteine bounded the four Fe2+ (FE1, FE2, FE3, FE4) via a sulfide link (Cys [SG]) to form external coordinates of clusters 1027, 1028, and 1029. However, cluster 1026 coordinated externally to the four Fe2+ (FE1, FE2, FE3, FE4) through three Cys [SG] and the oxygen atom of Glutamine (Gln [OE]). Since the two monomers were a mirror image of each other, the Fe2+4S2−4 clusters with the same geometry orientation were given a similar number, with a different letter representing their respective chains: chain-A (1026-A, 1027-A, 1028A, and 1029-A) and chain-B (1026-B, 1027-B, 1028B, and 1029-B). The subset structures representing all the possible coordination environments for Fe2+ centers in DPD protein were used for QM calculation. Using this approach, the computational time and resources utilized were greatly reduced compared to if all the clusters were considered. QM values for Fe2+4S2−4 subset clusters (1026-A and 1027-A) (Figure 2A) were generated for the Model 1 using Becke three-parameter hybrid exchange and Lee Yang Parr (B3LYP) correlation function level of theory [69,70,71]. Model 2 calculations failed at the B3LYP level of theory, therefore, the parameters for single internal coordinates (S3 and FE3) were obtained using a Los Alamos double-zeta basis (LSDA/LANL2DZ) approach [72]. However, those for the external coordinates ((Cys and Fe2+) and (Gln and Fe2+)) were derived using a geometry, frequency, noncovalent, extended TB (GFN1-xTB) method (Figure S1) [73,74].
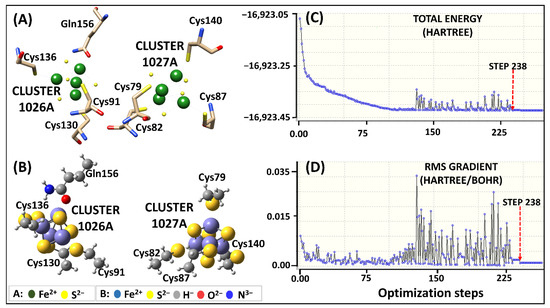
Figure 2.
Human DPD Fe2+4S2−4clusters parameterization using original Seminario approach. (A) 3D representation of Fe2+4S2−4 coordinating geometry. (B) The optimized geometry of Model 1 human DPD subset at B3LYP/6-31G* level of theory. (C,D) Visualization of the energy potential using GaussView, showing the starting point of optimization at the lowest energy level (step 238).
2.2.1. Geometry Optimization
The subset structures for Model 1 attained the local minima at step number 238 initiating the optimization process (Figure 2C,D). During the optimization process, a significant energy variation between steps 120 and 230 was observed. The main cause of the energy variation was the formation of a repulsive bond between Fe2+ and Fe2+ ions instead of the Fe2+ and S2− ions in cluster 1026. Nevertheless, the subset structures achieved correct optimization, while maintaining their geometry, as seen in Figure 2B.
The original Seminario method derived individual point value parameters for the subsets in Model 1 (Table S3). Contrastingly, the VFFDT (Model 2) approach/method generated average related parameters for internal bond length and angles, whereas the external parameters were averaged manually (Table S4). The equilibrium bond length and angle values obtained from QM (Models 1 and 2) showed some deviation of the crystal structure (Table 2, Table 3 and Table 4). These disparities might have been due to deficient phase information on the x-ray structure, since they give a static snapshot of the dynamic structure, contributing to spurious values [75]. Moreover, the disparity might have resulted from the lack of solvent effects and intermolecular interactions during the QM gas-phase optimization step [75,76]. As expected, the average bond length and angle for Model 2 were within the range of those obtained from Model 1. Furthermore, consistent with previous studies, in both models, the bond distances between Gln(OE)-Fe2+ were seemingly lower (Model 1: 1.92 Å and Model 2: 1.93 Å) (Table 2) compared to the bond between Cys(S)-Fe2+, with force constants of 60.40 and 24.97 kcal·mol−·Å−, respectively. The short bond length might be attributed to the smaller atom radius of oxygen in Gln compared to that of sulfur in Cys [1,2]. These values coincided with those obtained from previous related studies concerning Fe2+ and Cys [54,77,78]. However, there is limited literature on Fe2+ and Gln force field interactions, which has been sufficiently addressed in this study.
Table 2.
Comparison of average bond length (Å) calculated with X-ray, 2 DFT 4 (B3LYP), and 5 (LSDA) methods for the molecular cluster model ([Fe2+4S2−4 (S-Cys)3(S-Gln)]) and ([Fe2+4S2−4 (S-Cys)4]) of native DPD protein.
Table 3.
Comparison of average internal angles (°) calculated with X-ray, 2 DFT 4 (B3LYP), and 5 (LSDA) methods for the molecular cluster model ([Fe2+4S2−4(S-Cys)3(S-Gln)]) and ([Fe2+4S2−4(S-Cys)4]) of native DPD protein.
Table 4.
Comparison of average external angles (°) calculated with X-ray, 2 DFT 4 (B3LYP), and 5 (GFN1-xTB) methods for the molecular cluster model ([Fe2+4S2−4(S-Cys)3(S-Gln)]) and ([Fe2+4S2−4(S-Cys)4]) of native DPD protein.
Despite the slight differences, the values of force constant from both systems (Model 1 and 2) were within the same range, and consistent with those obtained from previous studies [54,78]. Commonly, force field parameter values of a model conducted under different systems are not exact, but fall within an expected range [56,57,79]. In generating new parameters, the state of the structural geometry optimization is thought to be a contributing factor to the varied observations [80]. Previous findings [81] ascribed the discrepancies to the different methods used in obtaining the force constant and the opposite manners in which the connectivity’s were defined. Most importantly, the derived values showed that both models maintained the subsets structural geometry following the optimization step.
2.2.2. RESP Charges
Partial atomic charge calculations were derived for each atom interacting with the Fe2+ center for the optimized subset structures. Figure S2 and Table S5, illustrate differences in the WT DPD atomic charge distribution in the oxidized subsets. The RESP method derived these charges by fitting the molecular electrostatic potential obtained from the QM calculation, based on the atom-centered point charge model. In their oxidized state, atoms within the DPD Fe2+ (S2−, Gln and Cys) center exhibited varied atomic charges due to the large electrostatic environment around the protein’s metal sphere. Such variations are known to influence charge transfer at the redox center bringing stability around the coordinating sphere of metalloproteins [79]. As such, they are vital components in the achievement of accurate inter- and intra-molecular potential electrostatic interaction [75].
2.2.3. Inferring the Generated QM Force Fields Parameters to the Corresponding Identical Clusters
The newly generated Fe2+ force field parameters for subsets 1026-A and 1027-A (Tables S6 and S7) were inferred to the remaining Model 1 DPD clusters corresponding to their geometries mentioned earlier. Similarly, the generated internal and external parameters (Table S4) for Model 2 were also inferred to the corresponding clusters, accordingly. At the end, each model featured a holo and a holo-drug (5-FU cancer drug) protein complex, totaling 64 internal (Fe-S) and 32 external (30 Cys-Fe; 2 Gln-Fe) parameter calculations for the DPD (Fe2+4S2−4) clusters. In terms of energy profile and range of force constants for Model 1 and 2, there were no significant differences observed in terms of DPD Fe2+ ion coordination to Cys, Gln residues, and S2− ions. Table 2, Table 3 and Table 4 show a summary of equilibrium bond length, angle, and related force constants, with detailed information available in the supporting information (Tables S6 and S7). Dihedral-related force constants were derived manually from the respective structures (Table S8).
2.3. Genereted Force Field Parameters Validated Using MD Simulations
2.3.1. Analysis of Protein Stability and Flexibility through RMSD, RMSF, and Rg
Accurate parameters are necessary for maintaining the coordinating geometry of a metal center in metalloproteins [55]. Therefore, to evaluate the accuracy and reliability of the derived parameters (Model 1 and 2), all atom MD simulations (150 ns) for holo system and holo–drug complexes were performed. The derived parameters were validated by assessing the root mean square deviation (RMSD) (Figure 3A), the radius of gyration (Rg) (Figure 3B), and root mean square fluctuation (RMSF) (Figure 3C). Simulations of both models for holo and holo–ligand complexes showed minimal deviation from their initial structures, which were maintained across the simulation process (Figure 3A). Model 1 systems (holo and holo-drug) displayed a multimodal RMSD density distribution, implying they sampled various local minima, whereas each of the Model 2 proteins attained a single local minimum (unimodal distribution). The Rg (Figure 3B) revealed that the compactness of the various protein models remained the same during dynamics. However, differences were observed between the holo and holo-drug bound proteins. The ligand-bound protein was seen to generally have a higher Rg than the non-ligand bound protein in both model systems. This may be attributed to the presence of the drug. Proteins from both models exhibited similar RMSF profiles (Figure 3C). However, the ligand-bound proteins appeared slightly more flexible than the non-ligand bound ones. As expected, the loop regions, which constitute ~43% of the entire protein structure, including the active-site loop (residues 675–679), were the most flexible regions, while the metal site residues displayed minimal fluctuation (Figure S3). Visualization of the different trajectories through visual molecular dynamics (VMD) [82] verified a high conformational change of the loop areas, while the protein central core containing Fe2+ clusters had vibrational-like movements.
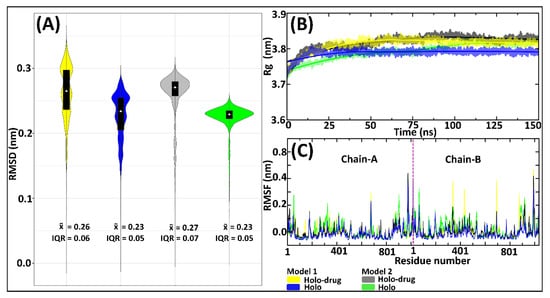
Figure 3.
Evaluation of the DPD protein stability by RMSD, Rg, and RMSF of the 150 ns MD simulations for Model 1 and Model 2, drug (5-FU) and non-drug bound systems. Model 1 is represented by yellow (drug) and blue (non-drug) bound systems. Model 2: grey (drug) and green (non-drug) bound systems. (A) Backbone RMSDs showing an overlay of boxplots on kernel density estimation graphs. Box-plots show the median, upper, and lower quartiles. The non-parametric kernel density plots are represented as median and interquartile ranges (IQR). (B) Rg line graphs showing the compactness of all systems. (C) RMSF illustrating the fluctuation of residues, with the purple line separating chain-A and chain-B.
The profiles of the RMSDs (Figure 3A) exhibited higher variation in conformational changes across all systems. These variations were more apparent in the Model 1 system’s proteins compared to the Model 2 system. Considering the similarity of protein behavior with drug binding, it is apparent that both models showed similar atomic tendencies in the drug and non-drug bound systems. The disparities arising from conformational changes were because of the slight differences in the approaches used in the models’ preparation. For instance, fixed bond parameters were assigned between Fe-S, Fe-Fe, and the connecting residues (Fe-Cys or Fe-Gln) of Model 2, based on averages of crystallographic structure (Table S2), whereas Model 1 parameters were attained from single point atom calculation of the crystallographic structure. The RMSF values of both the holo and holo-drug bound complexes demonstrated a region of higher flexibility between residues in all models (Figure 3C).
Proteins are dynamic entities and as such they undergo conformational changes as part of their functionality. Elucidating these changes is necessary for understanding how their functionality is maintained [83]. Hence, we evaluated the conformational variations sampled by each system during the simulation by plotting the free energy of each system snapshot as a function of RMSD and Rg using the Boltzmann constant (Figure 4). In both models, free energy investigations revealed similar tendencies to the kernel density map in all the systems. Both holo and holo-drug bound proteins populated three main conformations in Model 1. However, the holo bound protein attained three energy minima at 0.18, 0.20, and 0.25 nm, while the drug-bound protein energy minima were attained later, at 0.22, 0.25, and 0.35 nm. On the other hand, Model 2 equilibrated at single energy minima for both the drug (0.28 nm) and holo (0.22 nm) bound complexes. Model 1 proteins repeatedly attempted to find a high probability region that guaranteed more thermodynamic stability for its conformational state than Model 2. However, upon drug binding the conformation entropy was increased in both models, which destabilized the transitional state and simultaneously slowed down the protein equilibration. Visualization of the trajectories in VMD for establishing the cause of the trimodal ensemble showed alternating movements in the loop regions, including the C-terminal, N-terminal, and active-site loop areas. More importantly, the Fe2+4S2−4 cluster’s geometry was maintained during the simulation (Figure S4).
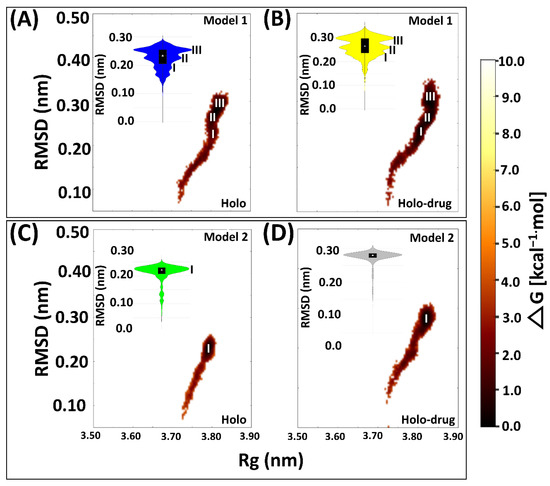
Figure 4.
Free energy landscape of the four system snapshots plotted as RMSD and Rg values derived from the Boltzmann constant in relation to the kernel density plot. (A) Drug bound system (Model 1) showing three (I, II, and III) major conformational changes sustained by the protein during MD simulation. (B) Holo bound system (Model 1) showing three (I, II, and III) major conformational changes. (C) Drug bound system (Model 2) showing one (I) major conformational change. (D) Holo bound system (Model 1) protein exhibiting one major conformational change during 150 ns simulation. Model 1: 5-FU drug bound protein (yellow); holo bound protein (blue). Model 2: Holo-drug bound protein (grey) and holo bound protein (green). Free energy landscape (maroon).
2.3.2. Fe2+4S2−4 Clusters Exhibited Stability during MD Simulations
Assessment of the inter- or intra-molecular distances between groups of interest can be used to investigate stability changes during MD simulations [84]. In this study, distances between the center of mass (COM) of; 1) the entire DPD protein and each of the eight Fe2+4S2−4 clusters (Figure 5A); 2) each chain and the four Fe2+4S2−4 clusters therein (Figure 5B); and 3) the active site of each chain and its Fe2+4S2−4 clusters, were evaluated (Figure 5C) for each model (Model 1 and 2: holo and holo-drug). From these calculations, the overall stability of the key components involved in the electron transfer process was evaluated. Generally, the inter-COM distances between the various groups in both models were nearly the same (Figure 5A–C). Moreover, data were distributed with a less standard deviation (uni-modal distribution), as seen from most kernel density plots, suggesting the distances within metal clusters remained in the same range across the 150 ns simulation and maintained stability within the metal clusters. Thus, the two methods can reliably be used to achieve accurate parameters for other metalloproteins.
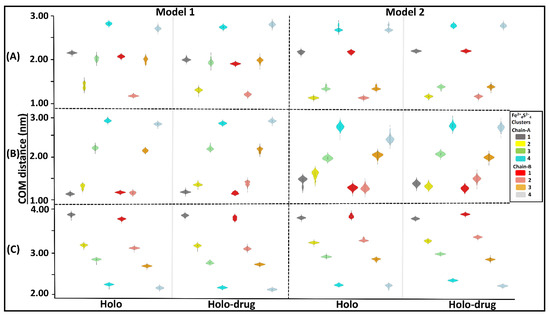
Figure 5.
Kernel density showing distribution of COM distances across different Fe2+4S2−4 clusters and the protein, the chains (A and B), and the active sites. Grey represents cluster 1 (1026A), yellow: cluster 2 (1027A), green: cluster 3 (1028A), cyan: cluster 4 (1029A), red: cluster 5 (1026B), salmon: cluster 6 (1027B), orange: cluster 7 (1028B), and light blue: cluster 8 (1027B). The interquartile range and the median are shown inside the kernel density plot. (A) The distribution of COM distance between different clusters and the proteins, (B) chain-A (cluster 1, 2, 3, and 4) chain-B (cluster 5, 6, 7 and 8), and (C) active-site. Generally, a uni-modal distribution was seen across all clusters in both models. The distance between the Fe2+ cluster and backbone of the protein remained within the same range during dynamics. Cluster compactness is an indication of the system stability. Respective clusters are colored accordingly.
In addition to the group inter-COM distance calculations, the distances between the Fe2+ centers and the coordinating residues were also determined for the holo-drug complexes in both models (Figure 6). Using this approach, the integrity of the coordinating geometry could be accessed during simulations. From the results, a high bond length consistency was observed within all Fe2+4S2−4 centers; an indication that the derived parameters were accurately describing the cluster geometries. Furthermore, the obtained bond lengths were in agreement with those reported previously [54,55]. The maintenance of the bond distances signified that the desired functionality and stability had not been jeopardized given that this is dependent on the protein environment [54]. Notably, Zheng et al.’s protocol for the evaluation of metal-binding structure confirmed that the coordinating tetrahedral geometry of Fe2+4S2−4 clusters was maintained during the entire simulation run. Although our calculations agreed with previous findings [54,56,77,78], it is worth noting that, to the best of the authors’ knowledge, none of the studies featured the force field parameters for glutamine interaction with a single or multiple Fe2+4S2−4 cluster in a single protein.
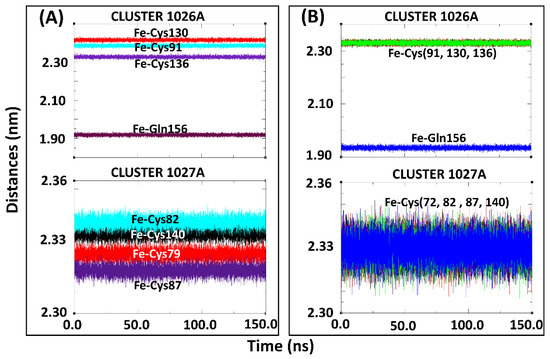
Figure 6.
Coordination of subset structure residues to the Fe2+ centers for the holo-drug bound systems of Model 1 and Model 2 during 150-ns MD simulations. (A) Cluster 1026A and 1027A of Model 1 the holo-ligand system. (B) Cluster 1026A and 1027A of Model 2, the holo-drug bound system. The coordinating distances between the Fe2+ and the connecting residue was seen to be maintained throughout the simulation in both models.
2.3.3. Validation of Derived Parameters in IH7X Crystal Structure
The derived Fe2+4S2−4 parameters coordinated uniquely to Cys and Glu residues were inferred to the template structure (PDB ID: 1H7X) for additional validation purposes. As with the modelled human structures, the four Fe2+4S2−4 clusters in each chain of the template maintained the correct geometry, as shown in Figure S5.
2.4. Essential Motions of Protein in Phase Space
Proteins are dynamic entities, whose molecular motions are associated with many biological functions, including redox reactions. Collective coordinates derived from atomic fluctuation principal component analysis (PCA) are widely used to predict a low-dimensional subspace in which essential protein motion is expected to occur [85]. These molecular motions are critical in biological function. Therefore, PCA was calculated to investigate the 3D conformational study and internal dynamics of the holo and holo–drug complexes of both models (Model 1 and Model 2). The first (PC1) and the second (PC2) principal components captured the dominant protein motions of all atoms in the 150 ns MD simulation (Figure 7). Both holo structures (Model 1 and Model 2) showed a U-shaped time evolution from an unfolded state (yellow) emerging from simple Brownian motion and ending in a native state (dark blue), over 150 ns. Strikingly, the projection of holo-drug complexes from both models (1 and 2) adopted a V-shaped time evolution space, emerging from an unfolded state (yellow) and ending in a native state (dark blue). Model 1 and Model 2 holo structures accounted for 44.95% of the total global structural variances. The holo–drug complexes displayed 48.95% and 36.5% of global total variance for Model 1 and Model 2, respectively. In overall, the holo–drug complexes (Model 1 and Model 2) exhibited an altered conformational evolution over time in-comparison to their respective holo structure, suggesting that the newly derived force field parameters in both models did not alter protein function.
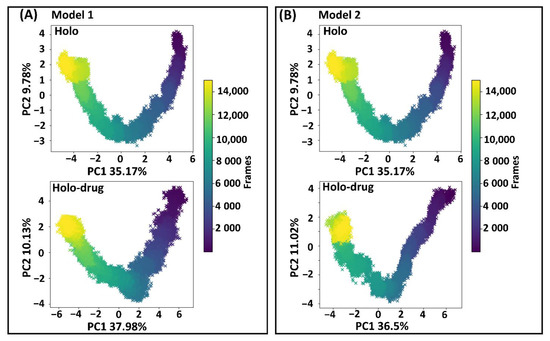
Figure 7.
Principal component analysis. First and second principal component analysis (PC1 and PC2) of human DPD wild type extracted from essential dynamics. The time evolution of the transition from unfolded state of the DPD protein (yellow) emerging from simple Brownian motion and ending in the native state (dark blue) over 150 ns. (A) The first two PCs of Model 1, accounting for 44.95% and 48.95% of the total structural variance of the holo and holo–drug complexes, respectively. (B) The first two PCs of Model 2 accounting for 44.95% and 47.52% of the total structural variance of the holo and holo–drug complexes, respectively.
3. Materials and Methods
A graphical workflow of the methods and tools used in this study is presented in Figure 8.
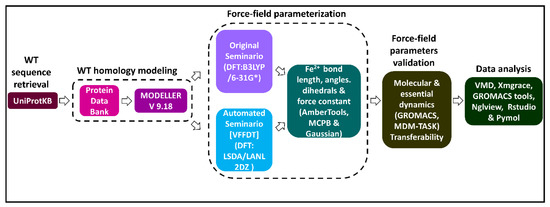
Figure 8.
A flow diagram illustrating a summary of methods and tools used in the generation and validation of Fe2+4S2−4 force field parameters for a human DPD protein model. Two approaches (original Seminario and automated Seminario) were used to determine the bond lengths, angles, and dihedrals around the Fe2+4S2−4 centers. The reliability of the generated parameters for describing the coordination geometry of the Fe2+4S2−4 centers was evaluated using all atom MD simulations.
3.1. Software
AMBER and AmberTools17, University of California, San Francisco, CA, USA; AutoDock4.2 software, The Scripps Research Institute, San Diego, CA, USA; Discovery Studio v4.5, Dassault Systems BIOVIA, San Diego, CA, USA; GaussView 5.0.9, Carnegie Mellon University Gaussian, Wallingford, Connecticut, USA; GROMACS v5.1.5., University of Groningen, Uppsala Sweden; RStudio v1.1.456, R Core Team, Boston, MA, USA; PyMOL Molecular Graphics System, v1.8.2.3 Schrödinger, New York, NY, USA and MODELLER, University of California, San Francisco, CA 94143, USA.
3.2. Homology Modeling of Native DPD Protein.
Due to the absence of human DPD protein crystal structural information in the Protein Data Bank (PDB) database [10], a homology modeling approach was used to obtain a complete 3D structure using MODELLER v9.15 [61]. This technique has become indispensable for obtaining 3D model structures of proteins with unknown structures and their assemblies by satisfying spatial constraints based on similar proteins with known structural information [86]. The restraints are derived automatically from associated structures and their alignment with the target sequence. The input consists of the alignment of the sequence to be modeled with a template protein whose structure has been resolved, and a script file (Table S9). At first, the target sequence (human DPD enzyme: UniProt accession: Q12882) was obtained from the Universal Protein Resources [87]. Both HHPred [88] and PRIMO [89] were used to identify a suitable template for modeling the human DPD protein. From the potential templates listed by the two webservers, PDB 1H7X, a DPD crystal structure from pig with a resolution 2.01 Å, was identified as the top structural template having a sequence identity of 93% [1,2]. A pir alignment file was prepared between the Uniprot (UniProt accession: Q12882) target sequence and that of template using multiple sequence comparison by log-expectation (MUSCLE). Therefore, the template PDB ID: 1H7X was utilized. In MODELLER v9.15 [90], a total of 100 human DPD holo models were generated at the “very-slow” refinement level, guided by the selected template. The resulting models, devoid of both drugs (5-FU and cofactors), were ranked based on their lowest normalized discrete optimized protein energy (z-DOPE) score [60], and the top three models were selected for further modeling. To incorporate the non-protein structural information, each of the selected models was separately superimposed onto the template in Discovery Studio 4.5 [59], and all non-protein information was copied. The coordinates for cofactors and the drug were then transferred directly to the modeled structures. Further quality assessment of the resulting complexes was performed using VERIFY3D [62], PROCHECK [65], QMEAN [63], and ProSA [64]. The best model showing a consistently high-quality score across the different validation programs was chosen for further studies.
3.3. Protonation of Titrarable Residues.
To account for the correct protonation states of the system, all DPD titratable residues were protonated at pH 7.5 [1], a system salinity of 0.5 M, and internal and external default dielectric constants of 80 and 10, respectively, in the H++ web server [67]. System coordinates (crd) and topology (top) files were used to build protonated protein structure files. A visual inspection of all titratable residues was performed, and incorrect protonation corrected using Schrödinger Maestro version 11.8.
3.4. New Force Field Parameter Generation.
Prior to the parameter generation process, the residue coordinations present in chain-A and chain-B Fe2+4S2−4 centers were evaluated to identify representative subsets. Two unique coordination subset arrangements, viz. 1026A (4 × Fe2+, 4 × S2−, 3 × Cys and 1 × Gln) and 1027B (4 × Fe2+, 4 × S2− and 4 × Cys), were identified. The two subsets (1026A and 1027B) represented the coordinating geometry of all Fe2+4S2−4 clusters in the protein. Subsequently, force field parameters describing the coordinating interactions in these unique centers were determined via two approaches. First, the original Seminario method (Model 1) was implemented using the bonded model approach in AmberTools16 [57] and Python-based metal center parameter builder (MCPB) [46]. Gaussian 09 [91,92] input files (com) of the protonated protein incorporating the subsets structures (1026A and 1027B) were prepared. Thereafter, their geometries were optimized utilizing the hybrid DFT method at a B3LYP correlation function level of theory. This process utilized double split-valence with a polarization [6-32G(d)] basis set [71,92] (Table S1). Sub-matrices of Cartesian Hessian matrix were used in the derivation of the metal geometry force field parameters [56]. Bond and angle force constants were obtained via fitting to harmonic potentials. The potential energy of the relative position for each atom in the system was determined by AMBER force field parameters calculated from Equation (1) below:
where the bond lengths, angles values, torsion values, and the interatomic distances were obtained. The first and second term of the harmonic potential energy function relates to bond bending and bond stretching, respectively, whereas the torsion angles are described by the third term. Lastly, the van der Waals forces and electrostatic interaction are given by the non-bonded energy function involving the Lennard Jones (12–6) potential and Coulomb potential, respectively [32,56]. The optimized/minimized structures were then visualized in GaussView 5.0.9 [93] to confirm that the bonds in the centers were intact. The atomic charges of the optimized subset structures were then derived from electrostatic potential (ESP). However, ESP assigns unreasonably charged values to the buried atoms, which impair their conformational transferability. Therefore, the restrained electrostatic potential (RESP) fitting technique, which considers the Coulomb potential for the calculation of electrostatic interaction, was employed to address these issues. This method has been highly regarded and widely used for assigning partial charges to various molecules utilizing B3LYP/6-31G(d) gas phase [45]. Restraints, in terms of penalty functions, are applied on the buried atoms, leading to multiple possible charged values. Hence, the quality of fit to the QM ESP is not compromised [94]. Herein, a default Merz–Kollman restrained electrostatic potential (RESP) radius of 2.8 Å was allocated to the metal centers. An additional approach (herein named as Model 2) using the collation features Seminario: VFFDT program was used [57]. Analysis data were acquired following optimization of subset Fe2+-S2−, Fe2+-Cys, and Fe2+-Gln coordination; the calculations were performed using density functional theory (DFT) featuring the LSDA/LANL2DZ (Table S2) [72]. This factored in the internal covalent bonds; note that the calculation was not successful at the B3LYP level of theory [69]. The external non-covalent bond calculation was determined by GFN1-xTB [73,74]. Retrieval of the force field parameters for the entire molecule was done through the Protocol menu item “FF” for the whole “General Small Molecule”. Since the system in this study was symmetrical, the atom types were left identical to Fe or S. The AMBER force field parameters for Fe2+ metal center bond and angles were then generated automatically. Individual detailed statistics were derived but only the final values were utilized for further calculations. The obtained parameters were then inferred to the other clusters in the modeled structures, as well as the template crystal structure (PDB ID: 1H7X) using the LEaP [95] program. This was based on the similarity of the clusters coordinating geometry. As such, cluster 1026A was inferred to 1029B, and those for 1027A were inferred to 1027B, 1028A, 1028B, 1029A, and 1029B, as they depict an identical coordination geometry. In total, 2 × ([Fe2+4S2−4(S-Cys)3(S-Gln)]) and 6 × ([Fe2+4S2−4 (S-Cys)4]) cluster parameters were derived for each model. No other 3D structure with metal centers, such as the human DPD coordinating environment, was available in the PDB. Therefore, the pig crystal structure was used to validate the reliability and accuracy of the newly generated force field parameters.
3.5. Force Field Parameters Validation and Analysis
To evaluate the reliability of the generated parameters derived from the original and automated Seminario approaches, duplicate all-atom MD simulations were conducted using the GROMACS 5.14 MD package [66]. For each model system (Model 1, Model 2, 1H7X crystal structure), the holo (protein with only cofactors) and holo–drug (5-FU) complexes were considered for simulation studies. At first, AMBER topologies for each system were generated by Leap modeling with the AMBER ff14SB force field to incorporate all the generated parameters [96]. The resulting system topologies were converted to GROMACS-compatible input files for the structure (gro) and the topology (top), with the correct atom types and charges using the AnteChamber Python Parser interface (ACPYPE) tool [97]. The infinite systems were then solvated in an octahedron box system using the simple point charge (SPCE216) water model [98], and with a padding distance of 10 Å set between the protein surface and the box face. The net charge for all systems was subsequently neutralized by adding 0.15 M NaCl counter-ions [99]. The neutralized systems were then subjected to an energy minimization phase (without constraints) using the steepest descent integrator 0.01 nm, and a maximum force tolerance of 1000 kJ·mol−T·nm−m was attained. This was necessary to get rid of steric clashes that may have resulted during incorporation of the parameters and water molecules. Subsequently, the systems were equilibrated to ensure that they attained the correct temperature and pressure using a two-step conical ensemble (each 100 ps). First, the temperature was set at 300 K (NVT-number of particles, volume, and temperature) using a modified Berendsen thermostat. This was followed by pressure equilibration at 1 atm (NPT-number of particles, volume and temperature) using the Parrinello–Rahman barostat algorithm [100]. The ensembles utilized the revised coulomb type for long range electrostatic interactions with a gap cut of 8.0 Å, as described by the particle mesh Ewald (PME) [101] method, and the LINCS algorithm was used to constrain bonds between all atoms [102]. Finally, production MD simulations of 150 ns were performed for all the systems at the Centre for High Performance Computing (CHPC) in Cape Town South Africa using 72 Linux CPU cores, with time integrations step of 2 fs. Coordinates were written to file every 10 ps. The obtained MD trajectories were stripped off all periodic boundary conditions (PBC) and fitted to the reference starting structure.
3.5.1. Root Mean Square, Root Mean Square Fluctuation, and Radius of Gyration Analysis
Global and local conformational behaviors of the replicate ensembles were determined using various GROMACS modules, viz. gmx rms, gmx rmsf, gmx gyrate, gmx distance, and analyzed in RStudio [103]. These packages were used to analyze the root mean square deviation (RMSD), root mean square fluctuation (RMSF), the radius of gyration (Rg), and the inter-center of mass between groups of interest, respectively. The overall conformational changes per system were observed using visual molecular dynamics (VMD) [82] to ensure that the derived parameters correctly maintained the geometry of the various Fe2+4S2−4 clusters.
3.5.2. Principal Component Analysis
Principal component analysis (PCA) was conducted in MDM-TASK-web to investigate the time evolution of the protein’s conformational changes in MD trajectories [85,104]. PCA is a linear transformation technique that extracts the most important element from a data set by using a covariance matrix built from atomic coordinates defining the protein’s accessible degree of freedom. The calculations of the coordinate covariance matrix for the Cα and Cβ atoms were implemented after RMS best-fit of the trajectories was applied to an average structure [85,104]. Corresponding eigenvectors and eigenvalues were then obtained from a diagonalized matrix. Protein coordinates were then projected using eigenvectors. PC1 versus PC2 plots were then derived from the normalized primary and secondary projections.
3.5.3. Additional Analytical Approaches
Molecular graphics were then prepared with PyMOL v1.8 [105], Anaconda 4.3.1 Jupyter Notebooks [106], and various open-source Python libraries, such as matplotlib [107], Seaborn, Pandas [108], NumPy [109], and NGLview [110].
To ascertain how accurate the generated force field parameters were, the average bond lengths and force constants from the derived parameters were compared to those of the x-ray structure. All statistical calculations were performed using Welch t-test in RStudio v1.1. 456 [103], where a p-value (<0.05) was considered significant.
4. Conclusions
In addition to the nucleotide metabolizing function of the DPD metalloenzyme in humans, the dimeric protein also serves as an important anti-cancer drug target [4,5,6]. Deficiency or dysfunction of the enzyme, because of mutations, results in increased exposure to active fluoropyrimidines metabolites, leading to severe toxicity effects. Computational approaches such as MD simulations have become integral components of elucidating protein function, as well as the effects of mutations [4]. MD simulations allow the elucidation of the conformational evolution of protein systems over time during a reaction process [26,31,32]. MD simulations require the appropriate mathematical functions and a set of parameters collectively known as force fields, which describe the protein energy as a function of its atomic coordinates. In cases where adequate parameters are lacking, especially those describing non-protein components in a system, additional descriptors are necessary. In this work, which forms a platform for future studies towards anti-cancer personalized medicine, we reported new validated AMBER parameters that can be used to accurately describe the complex Fe2+4S2−4 clusters in the DPD protein and related systems. This was motivated by the absence of ready to use force field parameters enabling in silico studies on the DPD system. The development of combined QM/MM methods has provided the most effective, accurate, and theoretical description of the molecular system [92]. They enable a comprehensive analysis of the structural, functional, and coordinating environment in metal-binding sites [26]. Thus, we highlighted the two similar methods’ capabilities, yet with different approaches and aspects of the algorithms for deriving authentic force field parameters for Fe2+ centers in DPD protein.
First and foremost, we reported the generation of force field parameters using the original Seminario method [56]. We went further and exploited the collation features of the VFFDT Seminario method for obtaining the force field parameters of the same Fe2+ ions as a supportive measure [57]. This was performed by considering the dimeric functionality of the human DPD protein, which relies on the well-organized inter-chain electron transfer across an eight Fe2+4S2−4 cluster complex. A double displacement reaction across the two chains leads to the activation and deactivation of the third most commonly prescribed anticancer (5-FU) drug globally [111]. It was remarkable that we successfully derived the desired force constants and bond distances for the Fe2+ centers using both Seminario approaches. The parameters obtained from other studies [54] did not address the coordinating geometry of the clusters in this study. Moreover, none of the studies focused on force field parameters for multiple clusters in a protein. Therefore, from the range of force field parameters generated from both approaches, it would be best to obtain averages of such force fields for future use in other similar systems. These averaged values will allow for some degree of transferability.
Above all, the derived parameters could easily be incorporated into consolidated MM packages. Furthermore, we ascertained that irrespective of the DFT (B3LYP HF/6-31G* and (LSDA/LANL2DZ and GFN1-xTB) logarithm application, the original Seminario approach is not inferior to the modified Seminario (collation features VFFDT) approach. Despite the role of DFT calculations (such as B3LYP) in deciphering the reactivity mechanisms of the DPD systems, the method is faced with the major limitation of neglecting dispersion interactions [112]. As a result, additional correction approaches, such as DFT-D3 [113], DFT-D [114], and BJ-damping [115] methods, are included in the calculations. In calculations where the dispersion interactions were most critical in Model 2, the DFT-D3 correction, which is part of the Grimme’s GFN1-xTB, was used. However, for Model 1, consideration of the most DFT correction method will be applied in future calculations. Owing to the possible occurrence of paramagnetism effects, due to the presence of unpaired electrons in the non-trivial DPD system Fe2+4S2−4 clusters, an attempt at implementing unrestricted calculations in Model 2 resulted in a higher energy compared to under restricted conditions.
The validation of the Fe2+ force field parameters obtained from this study using MD simulations produced satisfactory results. This will provide more insight into atomistic or electronic information, regarding the effects of site-specific interactions on the reaction path, in the DPD protein and the detrimental mutants [26,31,32].
Most importantly, concerning the generation of AMBER force field parameters, the authors acknowledge no other compatible parameters for this unique system. The derived novel force field parameters have paved the way for further simulations and enhanced the mechanistic understanding of metal cluster function in the human DPD protein through higher-level MD simulation methods. Additionally, the derived parameters are currently being applied to study the structural and changes in stability effects due to existing mutations in the human DPD protein. Together, the results from these studies will provide the atomistic details of mutation effects involving the DPD protein. This will open a platform for the implementation of in silico cancer pharmacogenomics and drug discovery research on 5-FU drug efficacy and toxicity effects.
Supplementary Materials
Figure S1: An illustration Fe2+ center parameterization in the native human DPD Model 2, utilizing automated (VFFDT) Seminario approach, Figure S2: An illustration of charge allocation to all the atoms coordinating with the metal center of subset clusters 1026A and 1027A for Model 1, Figure S3: A representation of the root mean square of fluctuation (RMSF) for ligand bound (complex) and non-ligand bound (holo) DPD Model 1 during 150 ns simulation. (A) Fe2+4S2−4 clusters in 1026 and 1027 located in domain 1. (B) Fe2+4S2−4 clusters in 1028 and 1029 located in domain 5. The area of fluctuation coincides to the protein loop area while the iron cluster remains intact, Figure S4: 3D structures of Model 2 MD simulations snapshots (timeframes) from regions exhibiting higher conformational changes with atomistic details represented (A) at 110.0 ns for drug bound protein and (B) at 70.4 ns for holo proteins (without 5-fluorouracil drug). The Fe2+ clusters remained intact throughout the different conformation timelines, Figure S5: Color coded violin plots showing the crystal structure bond distances between the Fe2+ and S2− derived by original (Model 1) and VFFDT [automated] (Model 2) Seminario method during 150 ns MD simulation. In Model 1, the orange and pink violin plots represent the holo and holo-drug bound complexes, respectively. In Model 2, the yellow and grey violin plots represent the holo and holo –drug complexes, respectively. The two clusters (1026 and 1027) represent the crystal structures (1H7X) unique Fe2+4S2−4 clusters coordination, Table S1: Quality assessment of Human DPD protein modeled structures, Table S2: Titratable residues in the human DPD protein and their respective pKa values, Table S3: A representation of human DPD parameters and coordinate files for Model 1 (B3LYP/6-31G*): AMBER parameter file, Table S4: A representation of human DPD parameters and coordinate files for Model 2 (LSDA/LANL2DZ): AMBER_VFFDT parameter file, Table S5: Listing of charge allocation to all the atoms interacting with the metal center (B3LYP/6-31G*), Table S6: Comparison of A bond length, B internal and C external angles (Å) calculated with X-ray, DFT (B3LYP) and (LSDA/LANL2DZ) method for the molecular cluster model ([Fe2+4S2−4 (S-Cys)3(S-Gln)]) 1026A of Native DPD protein, Table S7: Comparison of A bond length, B internal and C external angles (Å) calculated with X-ray, DFT (B3LYP) and (LSDA/LANL2DZ) method for the molecular cluster model ([Fe4S4(S-Cys)4]) 1027A of native DPD protein, Table S8: Dihedral related force constants for X-ray and post-MD simulation for both models’ clusters ([Fe4S4(S-Cys)3(S-Gln)]) and ([Fe4S4(S-Cys)4]) of Native DPD protein, Table S9: DPD pir sequence file used for modeling human dihydropyrimidine dehydrogenase structure based on pig crystal structure template and human target sequence.
Author Contributions
Conceptualization, Ö.T.B.; Formal analysis, M.B.T., L.C.-B., T.M.M. and Ö.T.B.; Funding acquisition, Ö.T.B.; Methodology, M.B.T., L.C.-B., K.L., T.M.M. and Ö.T.B.; Resources, Ö.T.B.; Supervision, T.M.M. and Ö.T.B.; Validation, M.B.T.; Visualization, M.B.T.; Writing—original draft, M.B.T.; Writing—review & editing, L.C.-B., T.M.M. and Ö.T.B. All authors have read and agreed to the published version of the manuscript.
Funding
This work has been funded by H3ABioNet (U24HG006941) which is supported by National Institutes of Health. H3ABioNet is a Pan African Bioinformatics Network for the Human Heredity and Health in Africa (H3Africa) consortium. L.C.-B. is funded by DELTAS Africa Initiative under Wellcome Trust (DELGEME grant number 107740/Z/15/Z) for PhD fellowship. The DELTAS Africa Initiative is an independent funding scheme of the African Academy of Sciences (AAS)’s Alliance for Accelerating Excellence in Science in Africa (AESA) and supported by the New Partnership for Africa’s Development Planning and Coordinating Agency (NEPAD Agency) with funding from the Wellcome Trust (DELGEME grant 107740/Z/15/Z) and the UK government. T.M.M. is funded as a postdoctoral fellow by Grand Challenges Africa program (GCA/DD/rnd3/023). Grand Challenges Africa is a program of the African Academy of Sciences (AAS) implemented through the Alliance for Accelerating Excellence in Science in Africa (AESA) platform, an initiative of the AAS and the African Union Development Agency (AUDA-NEPAD). GC Africa is supported by the Bill & Melinda Gates Foundation (BMGF), Swedish International Development Cooperation Agency (SIDA), German Federal Ministry of Education and Research (BMBF), Medicines for Malaria Venture (MMV), and Drug Discovery and Development Centre of University of Cape Town (H3D). Expressed views, and conclusion drawn for the content of the publication are those of the author’s and are not necessarily credited the funder’s official views.
Data Availability Statement
The modelled human DPD protein, the derived force field parameters and the molecular dynamics data are freely available upon request. All other supporting data has been provided as Supplementary Material.
Acknowledgments
The authors thank to the Center for High Performance Computing (CHPC), South Africa, for computational clusters and RUBi colleagues for their constructive discussions.
Conflicts of Interest
The authors declare no conflict of interest. The funders had no role in the study design, collection, analysis or interpretation of the data and decision to publish the data.in the writing of the manuscript, or in the decision to publish the results.
Sample Availability
Samples of the compounds are not available from the authors.
Abbreviations
| 3D | Three-dimensional |
| 5-FU | Five-fluorouracil |
| ACPYPE | Ante-Chamber Python Parser interface |
| CHPC | Center for high performance computing |
| CPU | Central processing unit |
| DPD | Dihydropyrimidine dehydrogenase |
| FAD | Flavin adenine dinucleotide |
| FMN | Flavin mononucleotide |
| MCBP | Metal center parameter builder |
| MD | Molecular dynamics |
| MM | Molecular mechanics |
| NADP | Nicotinamide adenine dinucleotide phosphate |
| PBC | Periodic boundary conditions |
| PDB | Protein Data bank |
| PME | Particle mesh Ewald |
| RESP | Restricted electrostatic potential |
| QM | Quantum mechanics |
| URF | Five fluorouracil |
| VFFDT | Visual force field derivation toolkit |
| WT | Wild type |
References
- Dobritzsch, D.; Ricagno, S.; Schneider, G.; Schnackerz, K.D.; Lindqvist, Y. Crystal Structure of the Productive Ternary Complex of Dihydropyrimidine Dehydrogenase with NADPH and 5-Iodouracil. J. Biol. Chem. 2002, 277, 13155–13166. [Google Scholar] [CrossRef]
- Dobritzsch, R.; Schneider, G.; Schnackerz, K.D.; Lindqvist, Y. Crystal structure of dihydropyrimidine dehydrogenase, a major determinant of the pharmacokinetics of the anti-cancer drug 5-fluorouracil. EMBO J. 2001, 20, 650–660. [Google Scholar] [CrossRef]
- Miteva-Marcheva, N.N.; Ivanov, H.Y.; Dimitrov, D.K.; Stoyanova, V.K. Application of pharmacogenetics in oncology. Biomark. Res. 2020, 8, 1–10. [Google Scholar] [CrossRef]
- Mazzuca, F.; Borro, M.; Botticelli, A.; Mazzotti, E.; Marchetti, L.; Gentile, G.; La Torre, M.; Lionetto, L.; Simmaco, M.; Marchetti, P. Pre-treatment evaluation of 5-fluorouracil degradation rate: Association of poor and ultra-rapid metabolism with severe toxicity in a colorectal cancer patients cohort. Oncotarget 2016, 7, 20612–20620. [Google Scholar] [CrossRef]
- Wigle, T.J.; Tsvetkova, E.V.; Welch, S.A.; Kim, R.B. DPYD and Fluorouracil-Based Chemotherapy: Mini Review and Case Report. Pharmaceutics 2019, 11, 199. [Google Scholar] [CrossRef]
- García-González, X.; Kaczmarczyk, B.; Abarca-Zabalía, J.; Thomas, F.; García-Alfonso, P.; Robles, L.; Pachón, V.; Vaz, Á.; Salvador-Martín, S.; Sanjurjo-Sáez, M.; et al. New DPYD variants causing DPD deficiency in patients treated with fluoropyrimidine. Cancer Chemother. Pharmacol. 2020, 86, 45–54. [Google Scholar] [CrossRef] [PubMed]
- Tozer, T.; Heale, K.; Chagas, C.M.; Barros, A.L.B.; Alisaraie, L. Interdomain twists of human thymidine phosphorylase and its active–inactive conformations: Binding of 5-FU and its analogues to human thymidine phosphorylase versus dihydropyrimidine dehydrogenase. Chem. Biol. Drug Des. 2019, 94, 1956–1972. [Google Scholar] [CrossRef] [PubMed]
- Berman, H.M.; Westbrook, J.; Feng, Z.; Gilliland, G.; Bhat, T.N.; Weissig, H.; Shindyalov, I.N.; Bourne, P.E. The Protein Data Bank. Nucleic Acids Res. 2000, 28, 235–242. [Google Scholar] [CrossRef] [PubMed]
- Mander, L.; Liu, H.-W. Comprehensive Natural Products II: Chemistry and Biology; Elsevier: Oxford, UK, 2010; Volume 3, pp. 205–236. [Google Scholar]
- Fagan, R.L.; Palfey, B.A. Flavin-Dependent Enzymes; Elsevier Ltd.: New York, NY, USA, 2010; pp. 38–43. [Google Scholar]
- Schnackerz, K.D.; Dobritzsch, D.; Lindqvist, Y.; Cook, P.F. Dihydropyrimidine dehydrogenase: A flavoprotein with four iron–sulfur clusters. Biochim. Biophys. Acta (BBA) Proteins Proteom. 2004, 1701, 61–74. [Google Scholar] [CrossRef]
- Lohkamp, B.; Voevodskaya, N.; Lindqvist, Y.; Dobritzsch, D. Insights into the mechanism of dihydropyrimidine dehydrogenase from site-directed mutagenesis targeting the active site loop and redox cofactor coordination. Biochim. Biophys. Acta (BBA) Proteins Proteom. 2010, 1804, 2198–2206. [Google Scholar] [CrossRef]
- Podschun, B.; Wahler, G.; Schnackerz, K.D. Purification and characterization of dihydropyrimidine dehydrogenase from pig liver. JBIC J. Biol. Inorg. Chem. 1989, 185, 219–224. [Google Scholar] [CrossRef]
- Podschun, B.; Cook, P.F.; Schnackerz, K.D. Kinetic mechanism of dihydropyrimidine dehydrogenase from pig liver. J. Biol. Chem. 1990, 265, 12966–12972. [Google Scholar] [CrossRef]
- Dudev, T.; Lim, C. Metal Binding Affinity and Selectivity in Metalloproteins: Insights from Computational Studies. Annu. Rev. Biophys. 2008, 37, 97–116. [Google Scholar] [CrossRef] [PubMed]
- Ziller, A.; Yadav, R.K.; Capdevila, M.; Reddy, M.S.; Vallon, L.; Marmeisse, R.; Atrian, S.; Palacios, Ò.; Fraissinet-Tachet, L. Metagenomics analysis reveals a new metallothionein family: Sequence and metal-binding features of new environmental cysteine-rich proteins. J. Inorg. Biochem. 2017, 167, 1–11. [Google Scholar] [CrossRef]
- Jing, Z.; Liu, C.; Qi, R.; Ren, P. Many-body effect determines the selectivity for Ca2+ and Mg2+ in proteins. Proc. Natl. Acad. Sci. USA 2018, 115, E7495–E7501. [Google Scholar] [CrossRef] [PubMed]
- Valasatava, Y.; Rosato, A.; Furnham, N.; Thornton, J.M.; Andreini, C. To what extent do structural changes in catalytic metal sites affect enzyme function? J. Inorg. Biochem. 2018, 179, 40–53. [Google Scholar] [CrossRef]
- Barber-Zucker, S.; Shaanan, B.; Zarivach, R. Transition metal binding selectivity in proteins and its correlation with the phylogenomic classification of the cation diffusion facilitator protein family. Sci. Rep. 2017, 7, 16381. [Google Scholar] [CrossRef] [PubMed]
- Lopes, P.E.M.; Guvench, O.; MacKerell, A.D. Current Status of Protein Force Fields for Molecular Dynamics Simulations. Methods Mol. Biol. 2015, 1215, 47–71. [Google Scholar] [CrossRef]
- Robustelli, P.; Piana, S.; Shaw, D.E. Developing a molecular dynamics force field for both folded and disordered protein states. Proc. Natl. Acad. Sci. USA 2018, 115, E4758–E4766. [Google Scholar] [CrossRef]
- Singh, S.; Singh, V.K. Molecular Dynamics Simulation: Methods and Application. In Frontiers in Protein Structure, Function, and Dynamics; Springer Science and Business Media LLC: Berlin/Heidelberg, Germany, 2020; pp. 213–238. [Google Scholar]
- Shi, W.; Chance, M.R. Metalloproteomics: Forward and reverse approaches in metalloprotein structural and functional characterization. Curr. Opin. Chem. Biol. 2011, 15, 144–148. [Google Scholar] [CrossRef] [PubMed]
- Musyoka, T.; Bishop, Ö.T.; Lobb, K.; Moses, V. The determination of CHARMM force field parameters for the Mg2+ containing HIV-1 integrase. Chem. Phys. Lett. 2018, 711, 1–7. [Google Scholar] [CrossRef]
- Bray, S.; Furriols, M. Notch pathway: Making sense of Suppressor of Hairless. Curr. Biol. 2001, 11, R217–R221. [Google Scholar] [CrossRef]
- Carloni, P.; Rothlisberger, U.; Parrinello, M. The Role and Perspective of Ab Initio Molecular Dynamics in the Study of Biological Systems. Accounts Chem. Res. 2002, 35, 455–464. [Google Scholar] [CrossRef] [PubMed]
- Li, P.; Merz, J.K.M. Metal Ion Modeling Using Classical Mechanics. Chem. Rev. 2017, 117, 1564–1686. [Google Scholar] [CrossRef] [PubMed]
- Durell, S.R.; Brooks, B.R.; Ben-Naim, A. Solvent-Induced Forces between Two Hydrophilic Groups. J. Phys. Chem. 1994, 98, 2198–2202. [Google Scholar] [CrossRef]
- Oostenbrink, C.; Villa, A.; Mark, A.E.; Van Gunsteren, W.F. A biomolecular force field based on the free enthalpy of hydration and solvation: The GROMOS force-field parameter sets 53A5 and 53A6. J. Comput. Chem. 2004, 25, 1656–1676. [Google Scholar] [CrossRef]
- Best, R.B.; Zhu, X.; Shim, J.; Lopes, P.E.M.; Mittal, J.; Feig, M.; MacKerell, J.A.D. Optimization of the Additive CHARMM All-Atom Protein Force Field Targeting Improved Sampling of the Backbone ϕ, ψ and Side-Chain χ1 and χ2 Dihedral Angles. J. Chem. Theory Comput. 2012, 8, 3257–3273. [Google Scholar] [CrossRef]
- MacKerell, A.D.; Bashford, D.; Bellott, M.; Dunbrack, R.L.; Evanseck, J.D.; Field, M.J.; Fischer, S.; Gao, J.; Guo, H.; Ha, S.; et al. All-Atom Empirical Potential for Molecular Modeling and Dynamics Studies of Proteins. J. Phys. Chem. B 1998, 102, 3586–3616. [Google Scholar] [CrossRef]
- Cornell, W.D.; Cieplak, P.; Bayly, C.I.; Gould, I.R.; Merz, K.M.; Ferguson, D.M.; Spellmeyer, D.C.; Fox, T.; Caldwell, J.W.; Kollman, P.A. A Second Generation Force Field for the Simulation of Proteins, Nucleic Acids, and Organic Molecules. J. Am. Chem. Soc. 1995, 117, 5179–5197. [Google Scholar] [CrossRef]
- Guvench, O.; MacKerell, A.D., Jr. Comparison of Protein Force Fields for Molecular Dynamics Simulations. Adv. Struct. Saf. Stud. 2008, 443, 63–88. [Google Scholar] [CrossRef]
- Vanommeslaeghe, K.; Guvench, O. Molecular mechanics. Curr. Pharm. Des. 2014, 20, 3281–3292. [Google Scholar] [CrossRef] [PubMed]
- Kaminski, G.A.; Friesner, R.A.; Tirado-Rives, J.; Jorgensen, W.L. Evaluation and Reparametrization of the OPLS-AA Force Field for Proteins via Comparison with Accurate Quantum Chemical Calculations on Peptides. J. Phys. Chem. B 2001, 105, 6474–6487. [Google Scholar] [CrossRef]
- Price, M.L.P.; Ostrovsky, D.; Jorgensen, W.L. Gas-phase and liquid-state properties of esters, nitriles, and nitro compounds with the OPLS-AA force field. J. Comput. Chem. 2001, 22, 1340–1352. [Google Scholar] [CrossRef]
- Mohamadi, F.; Richards, N.G.J.; Guida, W.C.; Liskamp, R.; Lipton, M.; Caufield, C.; Chang, G.; Hendrickson, T.; Still, W.C. Macromodel?an integrated software system for modeling organic and bioorganic molecules using molecular mechanics. J. Comput. Chem. 1990, 11, 440–467. [Google Scholar] [CrossRef]
- Vanommeslaeghe, K.; Hatcher, E.; Acharya, C.; Kundu, S.; Zhong, S.; Shim, J.; Darian, E.; Guvench, O.; Lopes, P.; Vorobyov, I.; et al. CHARMM general force field: A force field for drug-like molecules compatible with the CHARMM all-atom additive biological force fields. J. Comput. Chem. 2009, 31, 671–690. [Google Scholar] [CrossRef] [PubMed]
- Yu, W.; He, X.; Vanommeslaeghe, K.; MacKerell, A.D. Extension of the CHARMM general force field to sulfonyl-containing compounds and its utility in biomolecular simulations. J. Comput. Chem. 2012, 33, 2451–2468. [Google Scholar] [CrossRef]
- Vanommeslaeghe, K.; MacKerell, A.D. Automation of the CHARMM General Force Field (CGenFF) I: Bond Perception and Atom Typing. J. Chem. Inf. Model. 2012, 52, 3144–3154. [Google Scholar] [CrossRef]
- Vanommeslaeghe, K.; Raman, E.P.; MacKerell, A.D. Automation of the CHARMM General Force Field (CGenFF) II: Assignment of Bonded Parameters and Partial Atomic Charges. J. Chem. Inf. Model. 2012, 52, 3155–3168. [Google Scholar] [CrossRef]
- Wang, J.; Wolf, R.M.; Caldwell, J.W.; Kollman, P.A.; Case, D.A. Development and testing of a general amber force field. J. Comput. Chem. 2004, 25, 1157–1174. [Google Scholar] [CrossRef] [PubMed]
- Hancock, R.D. Molecular mechanics calculations and metal ion recognition. Accounts Chem. Res. 1990, 23, 253–257. [Google Scholar] [CrossRef]
- Stote, R.H.; Karplus, M. Zinc binding in proteins and solution. a simple but accurate nonbonded representation. Proteins 1995, 23, 12–31. [Google Scholar] [CrossRef] [PubMed]
- Case, D.; Darden, T.; Cheatham, T.; Simmerling, C.; Wang, J.; Duke, R.; Luo, R.; Crowley, M.; Walker, R.; Zhang, W. AMBER 12. University of California, San Francisco; University of California, San Francisco: San Francisco, CA, USA, 2012. [Google Scholar]
- Li, P.; Merz, J.K.M. MCPB.py: A Python Based Metal Center Parameter Builder. J. Chem. Inf. Model. 2016, 56, 599–604. [Google Scholar] [CrossRef]
- Pang, Y.P. Novel Zinc Protein Molecular Dynamics Simulations: Steps Toward Antiangiogenesis for Cancer Treatment. J. Mol. Model. 1999, 5, 196–202. [Google Scholar] [CrossRef]
- Åqvist, J. Modelling of ion-ligand interactions in solutions and biomolecules. J. Mol. Struct. THEOCHEM 1992, 256, 135–152. [Google Scholar] [CrossRef]
- Sakharov, D.V.; Lim, C. Zn Protein Simulations Including Charge Transfer and Local Polarization Effects. J. Am. Chem. Soc. 2005, 127, 4921–4929. [Google Scholar] [CrossRef]
- Peraro, M.D.; Spiegel, K.; Lamoureux, G.; De Vivo, M.; DeGrado, W.F.; Klein, M.L. Modeling the charge distribution at metal sites in proteins for molecular dynamics simulations. J. Struct. Biol. 2007, 157, 444–453. [Google Scholar] [CrossRef] [PubMed]
- Zhu, T.; Xiao, X.; Ji, C.; Zhang, J.Z.H. A New Quantum Calibrated Force Field for Zinc–Protein Complex. J. Chem. Theory Comput. 2013, 9, 1788–1798. [Google Scholar] [CrossRef]
- Teixeira, M.H.; Curtolo, F.; Camilo, S.R.G.; Field, M.J.; Zheng, P.; Li, H.; Arantes, G.M. Modeling the Hydrolysis of Iron–Sulfur Clusters. J. Chem. Inf. Model. 2019, 60, 653–660. [Google Scholar] [CrossRef]
- Oda, A.; Yamaotsu, N.; Hirono, S. New AMBER force field parameters of heme iron for cytochrome P450s determined by quantum chemical calculations of simplified models. J. Comput. Chem. 2005, 26, 818–826. [Google Scholar] [CrossRef]
- Carvalho, A.T.P.; Teixeira, A.F.S.; Ramos, M.J. Parameters for molecular dynamics simulations of iron-sulfur proteins. J. Comput. Chem. 2013, 34, 1540–1548. [Google Scholar] [CrossRef]
- Sheik Amamuddy, O.S.; Musyoka, T.M.; Boateng, R.A.; Zabo, S.; Bishop, Ö.T. Determining the unbinding events and conserved motions associated with the pyrazinamide release due to resistance mutations of Mycobacterium tuberculosis pyrazinamidase. Comput. Struct. Biotechnol. J. 2020, 18, 1103–1120. [Google Scholar] [CrossRef] [PubMed]
- Seminario, J.M. Calculation of intramolecular force fields from second-derivative tensors. Int. J. Quantum Chem. 1996, 60, 1271–1277. [Google Scholar] [CrossRef]
- Zheng, S.; Tang, Q.; He, J.; Du, S.; Xu, S.; Wang, C.; Xu, Y.; Lin, F. VFFDT: A New Software for Preparing AMBER Force Field Parameters for Metal-Containing Molecular Systems. J. Chem. Inf. Model. 2016, 56, 811–818. [Google Scholar] [CrossRef] [PubMed]
- Kelm, S.; Shi, J.; Deane, C.M. MEDELLER: Homology-based coordinate generation for membrane proteins. Bioinformatics 2010, 26, 2833–2840. [Google Scholar] [CrossRef]
- BIOVIA, Dassault Systèmes. Discovery Studio Modeling Environment, Release 2019; Dassault Systèmes: San Diego, CA, USA, 2019. [Google Scholar]
- Shen, M.-Y.; Sali, A. Statistical potential for assessment and prediction of protein structures. Protein Sci. 2006, 15, 2507–2524. [Google Scholar] [CrossRef]
- Eramian, D.; Eswar, N.; Shen, M.-Y.; Sali, A. How well can the accuracy of comparative protein structure models be predicted? Protein Sci. 2008, 17, 1881–1893. [Google Scholar] [CrossRef]
- Eisenberg, D.; Lüthy, R.; Bowie, J.U. VERIFY3D: Assessment of protein models with three-dimensional profiles. Methods Enzymol. 1997, 277, 396–404. [Google Scholar] [CrossRef]
- Benkert, P.; Künzli, M.; Schwede, T. QMEAN server for protein model quality estimation. Nucleic Acids Res. 2009, 37, W510–W514. [Google Scholar] [CrossRef]
- Wiederstein, M.; Sippl, M.J. ProSA-web: Interactive web service for the recognition of errors in three-dimensional structures of proteins. Nucleic Acids Res. 2007, 35 (Suppl. 2), W407–W410. [Google Scholar] [CrossRef] [PubMed]
- Laskowski, R.A.; MacArthur, M.W.; Thornton, J.M. Validation of protein models derived from experiment. Curr. Opin. Struct. Biol. 1998, 8, 631–639. [Google Scholar] [CrossRef]
- Van Der Spoel, D.; Lindahl, E.; Hess, B.; Groenhof, G.; Mark, A.E.; Berendsen, H.J.C. GROMACS: Fast, flexible, and free. J. Comput. Chem. 2005, 26, 1701–1718. [Google Scholar] [CrossRef] [PubMed]
- Anandakrishnan, R.; Aguilar, B.; Onufriev, A.V. H++ 3.0: Automating pK prediction and the preparation of biomolecular structures for atomistic molecular modeling and simulations. Nucleic Acids Res. 2012, 40, W537–W541. [Google Scholar] [CrossRef] [PubMed]
- Bowers, K.J.; Sacerdoti, F.D.; Salmon, J.K.; Shan, Y.; Shaw, D.E.; Chow, E.; Xu, H.; Dror, R.O.; Eastwood, M.P.; Gregersen, B.A.; et al. Molecular Dynamics-Scalable Algorithms for Molecular Dynamics Simulations on Commodity Clusters. In Proceedings of the 2006 ACM/IEEE Conference on Supercomputing, Tampa, FL, USA, 11–17 November 2006; p. 84. [Google Scholar]
- Becke, A.D. Density-functional exchange-energy approximation with correct asymptotic behavior. Phys. Rev. A 1988, 38, 3098–3100. [Google Scholar] [CrossRef] [PubMed]
- Grimme, S. Semiempirical hybrid density functional with perturbative second-order correlation. J. Chem. Phys. 2006, 124, 034108. [Google Scholar] [CrossRef]
- Lee, C.; Yang, W.; Parr, R.G. Development of the Colle-Salvetti correlation-energy formula into a functional of the electron density. Phys. Rev. B 1988, 37, 785–789. [Google Scholar] [CrossRef]
- Yang, Y.; Weaver, M.N.; Merz, J.K.M. Assessment of the “6-31+G** + LANL2DZ” Mixed Basis Set Coupled with Density Functional Theory Methods and the Effective Core Potential: Prediction of Heats of Formation and Ionization Potentials for First-Row-Transition-Metal Complexes. J. Phys. Chem. A 2009, 113, 9843–9851. [Google Scholar] [CrossRef] [PubMed]
- Bannwarth, C.; Ehlert, S.; Grimme, S. GFN2-xTB—An Accurate and Broadly Parametrized Self-Consistent Tight-Binding Quantum Chemical Method with Multipole Electrostatics and Density-Dependent Dispersion Contributions. J. Chem. Theory Comput. 2019, 15, 1652–1671. [Google Scholar] [CrossRef] [PubMed]
- Grimme, S.; Bannwarth, C.; Shushkov, P. A Robust and Accurate Tight-Binding Quantum Chemical Method for Structures, Vibrational Frequencies, and Noncovalent Interactions of Large Molecular Systems Parametrized for All spd-Block Elements (Z = 1–86). J. Chem. Theory Comput. 2017, 13, 1989–2009. [Google Scholar] [CrossRef]
- Khairallah, A.; Bishop, Ö.T.; Moses, V. AMBER force field parameters for the Zn (II) ions of the tunneling-fold enzymes GTP cyclohydrolase I and 6-pyruvoyl tetrahydropterin synthase. J. Biomol. Struct. Dyn. 2020, 28, 1–18. [Google Scholar] [CrossRef]
- Li, X.; Hayik, S.A.; Merz, K.M. QM/MM X-ray refinement of zinc metalloenzymes. J. Inorg. Biochem. 2010, 104, 512–522. [Google Scholar] [CrossRef][Green Version]
- Harding, M. M The geometry of metal–ligand interactions relevant to proteins. Acta Crystallogr. Sect. D Biol. Crystallogr. 1999, 55, 1432–1443. [Google Scholar] [CrossRef] [PubMed]
- Harding, M.M. Small revisions to predicted distances around metal sites in proteins. Acta Crystallogr D Biol. 2006, 62, 678–682. [Google Scholar] [CrossRef]
- Wei, C.; Lazim, R.; Zhang, D. Importance of polarization effect in the study of metalloproteins: Application of polarized protein specific charge scheme in predicting the reduction potential of azurin. Proteins Struct. Funct. Bioinform. 2014, 82, 2209–2219. [Google Scholar] [CrossRef] [PubMed]
- Tuccinardi, T.; Martinelli, A.; Nuti, E.; Carelli, P.; Balzano, F.; Uccello-Barretta, G.; Murphy, G.; Rossello, A. Amber force field implementation, molecular modelling study, synthesis and MMP-1/MMP-2 inhibition profile of (R)- and (S)-N-hydroxy-2-(N-isopropoxybiphenyl-4-ylsulfonamido)-3-methylbutanamides. Bioorganic Med. Chem. 2006, 14, 4260–4276. [Google Scholar] [CrossRef]
- Smith, D.M.A.; Xiong, Y.; Straatsma, T.P.; Rosso, K.M.; Squier, T.C. Force-Field Development and Molecular Dynamics of [NiFe] Hydrogenase. J. Chem. Theory Comput. 2012, 8, 2103–2114. [Google Scholar] [CrossRef]
- Humphrey, W.; Dalke, A.; Schulten, K. VMD: Visual molecular dynamics. J. Mol. Graph. 1996, 14, 33–38. [Google Scholar] [CrossRef]
- Haspel, N.; Moll, M.; Baker, M.L.; Chiu, W.; Kavraki, L.E. Tracing conformational changes in proteins. BMC Struct. Biol. 2010, 10, S1. [Google Scholar] [CrossRef]
- Orellana, L. Large-Scale Conformational Changes and Protein Function: Breaking the in silico Barrier. Front. Mol. Biosci. 2019, 6, 117–136. [Google Scholar] [CrossRef]
- Sheik Amamuddy, O.S.; Glenister, M.; Tastan Bishop, Ö. MDM-TASK-web: A web platform for protein dynamic residue networks and modal analysis. bioRxiv 2021, 2021.01.29.428734, 1–8. [Google Scholar] [CrossRef]
- Bishop, A.; De Beer, T.A.; Joubert, F. Protein homology modelling and its use in South Africa. S. Afr. J. Sci. 2008, 104, 2–6. [Google Scholar]
- Apweiler R, Bairoch A, Wu C: The universal protein resource (UniProt). Nucleic Acids Res. 2007, 36, D190–D195. [CrossRef]
- Söding, J.; Biegert, A.; Lupas, A.N. The HHpred interactive server for protein homology detection and structure prediction. Nucleic Acids Res. 2005, 33, W244–W248. [Google Scholar] [CrossRef] [PubMed]
- Hatherley, R.; Brown, D.K.; Glenister, M.; Tastan Bishop, Ö. PRIMO: An interactive homology modeling pipeline. PLoS ONE 2016, 11, e0166698. [Google Scholar] [CrossRef] [PubMed]
- ŠAli, A.; Overington, J.P. Derivation of rules for comparative protein modeling from a database of protein structure alignments. Protein Sci. 1994, 3, 1582–1596. [Google Scholar] [CrossRef]
- Ryde, U. Molecular dynamics simulations of alcohol dehydrogenase with a four- or five-coordinate catalytic zinc ion. Proteins Struct. Funct. Bioinform. 1995, 21, 40–56. [Google Scholar] [CrossRef]
- Ryde, U. Combined quantum and molecular mechanics calculations on metalloproteins. Curr. Opin. Chem. Biol. 2003, 7, 136–142. [Google Scholar] [CrossRef]
- Frisch, M.J.; Trucks, G.W.; Schlegel, H.B.; Scuseria, G.E.; Robb, M.A.; Cheeseman, J.R.; Scalmani, G.; Barone, V.; Petersson, G.A.; Nakatsuji, H.; et al. Gaussian 16 Rev. A.03; Gaussian Inc.: Wallingford, CT, USA, 2016. [Google Scholar]
- Bayly, C.I.; Cieplak, P.; Cornell, W.; Kollman, P.A. A well-behaved electrostatic potential based method using charge restraints for deriving atomic charges: The RESP model. J. Phys. Chem. 1993, 97, 10269–10280. [Google Scholar] [CrossRef]
- Schafmeister, C.; Ross, W.; Romanovski, V. LEaP; University of California, San Francisco: San Francisco, CA, USA, 1995. [Google Scholar]
- Maier, J.A.; Martinez, C.; Kasavajhala, K.; Wickstrom, L.; Hauser, K.E.; Simmerling, C. ff14SB: Improving the Accuracy of Protein Side Chain and Backbone Parameters from ff99SB. J. Chem. Theory Comput. 2015, 11, 3696–3713. [Google Scholar] [CrossRef]
- Da Silva, A.W.S.; Vranken, W.F. ACPYPE—AnteChamber PYthon Parser interfacE. BMC Res. Notes 2012, 5, 367. [Google Scholar] [CrossRef]
- Glättli, A.; Daura, X.; Van Gunsteren, W.F. Derivation of an improved simple point charge model for liquid water: SPC/A and SPC/L. J. Chem. Phys. 2002, 116, 9811–9828. [Google Scholar] [CrossRef]
- Hockney, R.; Goel, S.; Eastwood, J. Quiet high-resolution computer models of a plasma. J. Comput. Phys. 1974, 14, 148–158. [Google Scholar] [CrossRef]
- Petersen, H.G. Accuracy and efficiency of the particle mesh Ewald method. J. Chem. Phys. 1995, 103, 3668–3679. [Google Scholar] [CrossRef]
- Essmann, U.; Perera, L.; Berkowitz, M.L.; Darden, T.; Lee, H.; Pedersen, L.G. A smooth particle mesh Ewald method. J. Chem. Phys. 1995, 103, 8577–8593. [Google Scholar] [CrossRef]
- Ryckaert, J.-P.; Ciccotti, G.; Berendsen, H.J.C. Numerical integration of the cartesian equations of motion of a system with constraints: Molecular dynamics of n-alkanes. J. Comput. Phys. 1977, 23, 327–341. [Google Scholar] [CrossRef]
- Team R. RStudio. Integrated Development for R. RStudio; RStudio Inc.: Boston, MA, USA, 2015; Volume 42, p. 14. Available online: https://www.rstudio.com (accessed on 20 May 2020.).
- Brown, D.K.; Penkler, D.L.; Amamuddy, O.S.; Ross, C.; Atilgan, A.R.; Atilgan, C.; Bishop, Ö.T. MD-TASK: A software suite for analyzing molecular dynamics trajectories. Bioinformatics 2017, 33, 2768–2771. [Google Scholar] [CrossRef]
- Schrodinger, L. The PyMOL Molecular Graphics System. In BioLuminate; Version 1.8; Schrödinger, LLC.: New York, NY, USA, 2015. [Google Scholar]
- Kluyver, T.; Ragan-Kelley, B.; Pérez, F.; Granger, B.E.; Bussonnier, M.; Frederic, J.; Kelley, K.; Hamrick, J.B.; Grout, J.; Corlay, S. Jupyter Notebooks-A Publishing Format for Reproducible Computational Workflows; IOS Press: Amsterdam, The Netherlands, 2016; pp. 87–90. [Google Scholar]
- Hunter, J.D. Matplotlib: A 2D Graphics Environment. Comput. Sci. Eng. 2007, 9, 90–95. [Google Scholar] [CrossRef]
- McKinney, W. Data Structures for Statistical Computing in Python. In Proceedings of the 9th Python in Science Conference, Austin, TX, USA, 28 June–3 July 2010; pp. 51–56. [Google Scholar]
- Van Der Walt, S.; Colbert, S.C.; Varoquaux, G. The NumPy Array: A Structure for Efficient Numerical Computation. Comput. Sci. Eng. 2011, 13, 22–30. [Google Scholar] [CrossRef]
- Nguyen, H.; Case, D.A.; Rose, A.S. NGLview–interactive molecular graphics for Jupyter notebooks. Bioinformatics 2017, 34, 1241–1242. [Google Scholar] [CrossRef] [PubMed]
- Sara, J.D.; Kaur, J.; Khodadadi, R.; Rehman, M.; Lobo, R.; Chakrabarti, S.; Herrmann, J.; Lerman, A.; Grothey, A. 5-fluorouracil and cardiotoxicity: A review. Ther. Adv. Med. Oncol. 2018, 10. [Google Scholar] [CrossRef]
- Lonsdale, R.; Harvey, J.N.; Mulholland, A.J. Effects of Dispersion in Density Functional Based Quantum Mechanical/Molecular Mechanical Calculations on Cytochrome P450 Catalyzed Reactions. J. Chem. Theory Comput. 2012, 8, 4637–4645. [Google Scholar] [CrossRef]
- Smith, D.G.A.; Burns, L.A.; Patkowski, K.; Sherrill, C.D. Revised Damping Parameters for the D3 Dispersion Correction to Density Functional Theory. J. Phys. Chem. Lett. 2016, 7, 2197–2203. [Google Scholar] [CrossRef] [PubMed]
- Grimme, S.; Antony, J.; Ehrlich, S.; Krieg, H. A consistent and accurate ab initio parametrization of density functional dispersion correction (DFT-D) for the 94 elements H-Pu. J. Chem. Phys. 2010, 132, 154104. [Google Scholar] [CrossRef] [PubMed]
- Grimme, S.; Ehrlich, S.; Goerigk, L. Effect of the damping function in dispersion corrected density functional theory. J. Comput. Chem. 2011, 32, 1456–1465. [Google Scholar] [CrossRef] [PubMed]


Publisher’s Note: MDPI stays neutral with regard to jurisdictional claims in published maps and institutional affiliations. |
© 2021 by the authors. Licensee MDPI, Basel, Switzerland. This article is an open access article distributed under the terms and conditions of the Creative Commons Attribution (CC BY) license (https://creativecommons.org/licenses/by/4.0/).