Article

Computational and Spectroscopic Studies of Carbon Disulfide

1
Research Center for Chemistry, Indonesian Institute of Sciences, Kawasan Puspiptek Serpong, Tangerang Selatan, Banten 15314, Indonesia
2
Research Center for Physics, Indonesian Institute of Sciences, Kawasan Puspiptek Serpong, Tangerang Selatan, Banten 15314, Indonesia
3
ISIS Facility, STFC Rutherford Appleton Laboratory, Chilton, Didcot, Oxon OX11 0QX, UK
*
Author to whom correspondence should be addressed.
Molecules 2020, 25(8), 1901; https://doi.org/10.3390/molecules25081901
Submission received: 28 March 2020 / Revised: 14 April 2020 / Accepted: 15 April 2020 / Published: 20 April 2020
(This article belongs to the Special Issue Computational Spectroscopy 2020)

Abstract

:
The vibrational spectroscopy of CS2 has been investigated many times in all three phases. However, there is still some ambiguity about the location of two of the modes in the solid state. The aim of this work was to locate all of the modes by inelastic neutron scattering (INS) spectroscopy, (which has no selection rules), and to use periodic density functional theory to provide a complete and unambiguous assignment of all the modes in the solid state. A comparison of the observed and calculated INS spectra shows generally good agreement. All four of the ν2 bending mode components are calculated to fall within 14 cm−1. Inspection of the spectrum shows that there are no bands close to the intense feature at 390 cm−1 (assigned to ν2); this very strongly indicates that the Au mode is within the envelope of the 390 cm−1 band. Based on a simulation of the band shape of the 390 cm−1 feature, the most likely position of the optically forbidden component of the ν2 bending mode is 393 ± 2 cm−1. The calculations show that the optically inactive Au translational mode is strongly dispersed, so it does not result in a single feature in the INS spectrum.

1. Introduction

Carbon disulfide, CS2, changed from being a laboratory curiosity in the mid-1800s when it was first used industrially for the vulcanization of rubber. Since then, it has had many commercial uses. The current major uses are for the production of viscose rayon and cellophane and as a solvent in adhesives and cleaners [1].
The vibrational spectroscopy of CS2 has been investigated many times in all three phases [2,3,4,5,6,7,8,9,10,11,12]. However, there is still some ambiguity about the location of two of the modes in the solid state. The aim of this work was to locate all of the modes by inelastic neutron scattering (INS) spectroscopy, which has no selection rules [13], and to use periodic density functional theory to provide a complete and unambiguous assignment of all the modes in the solid state.

2. Results

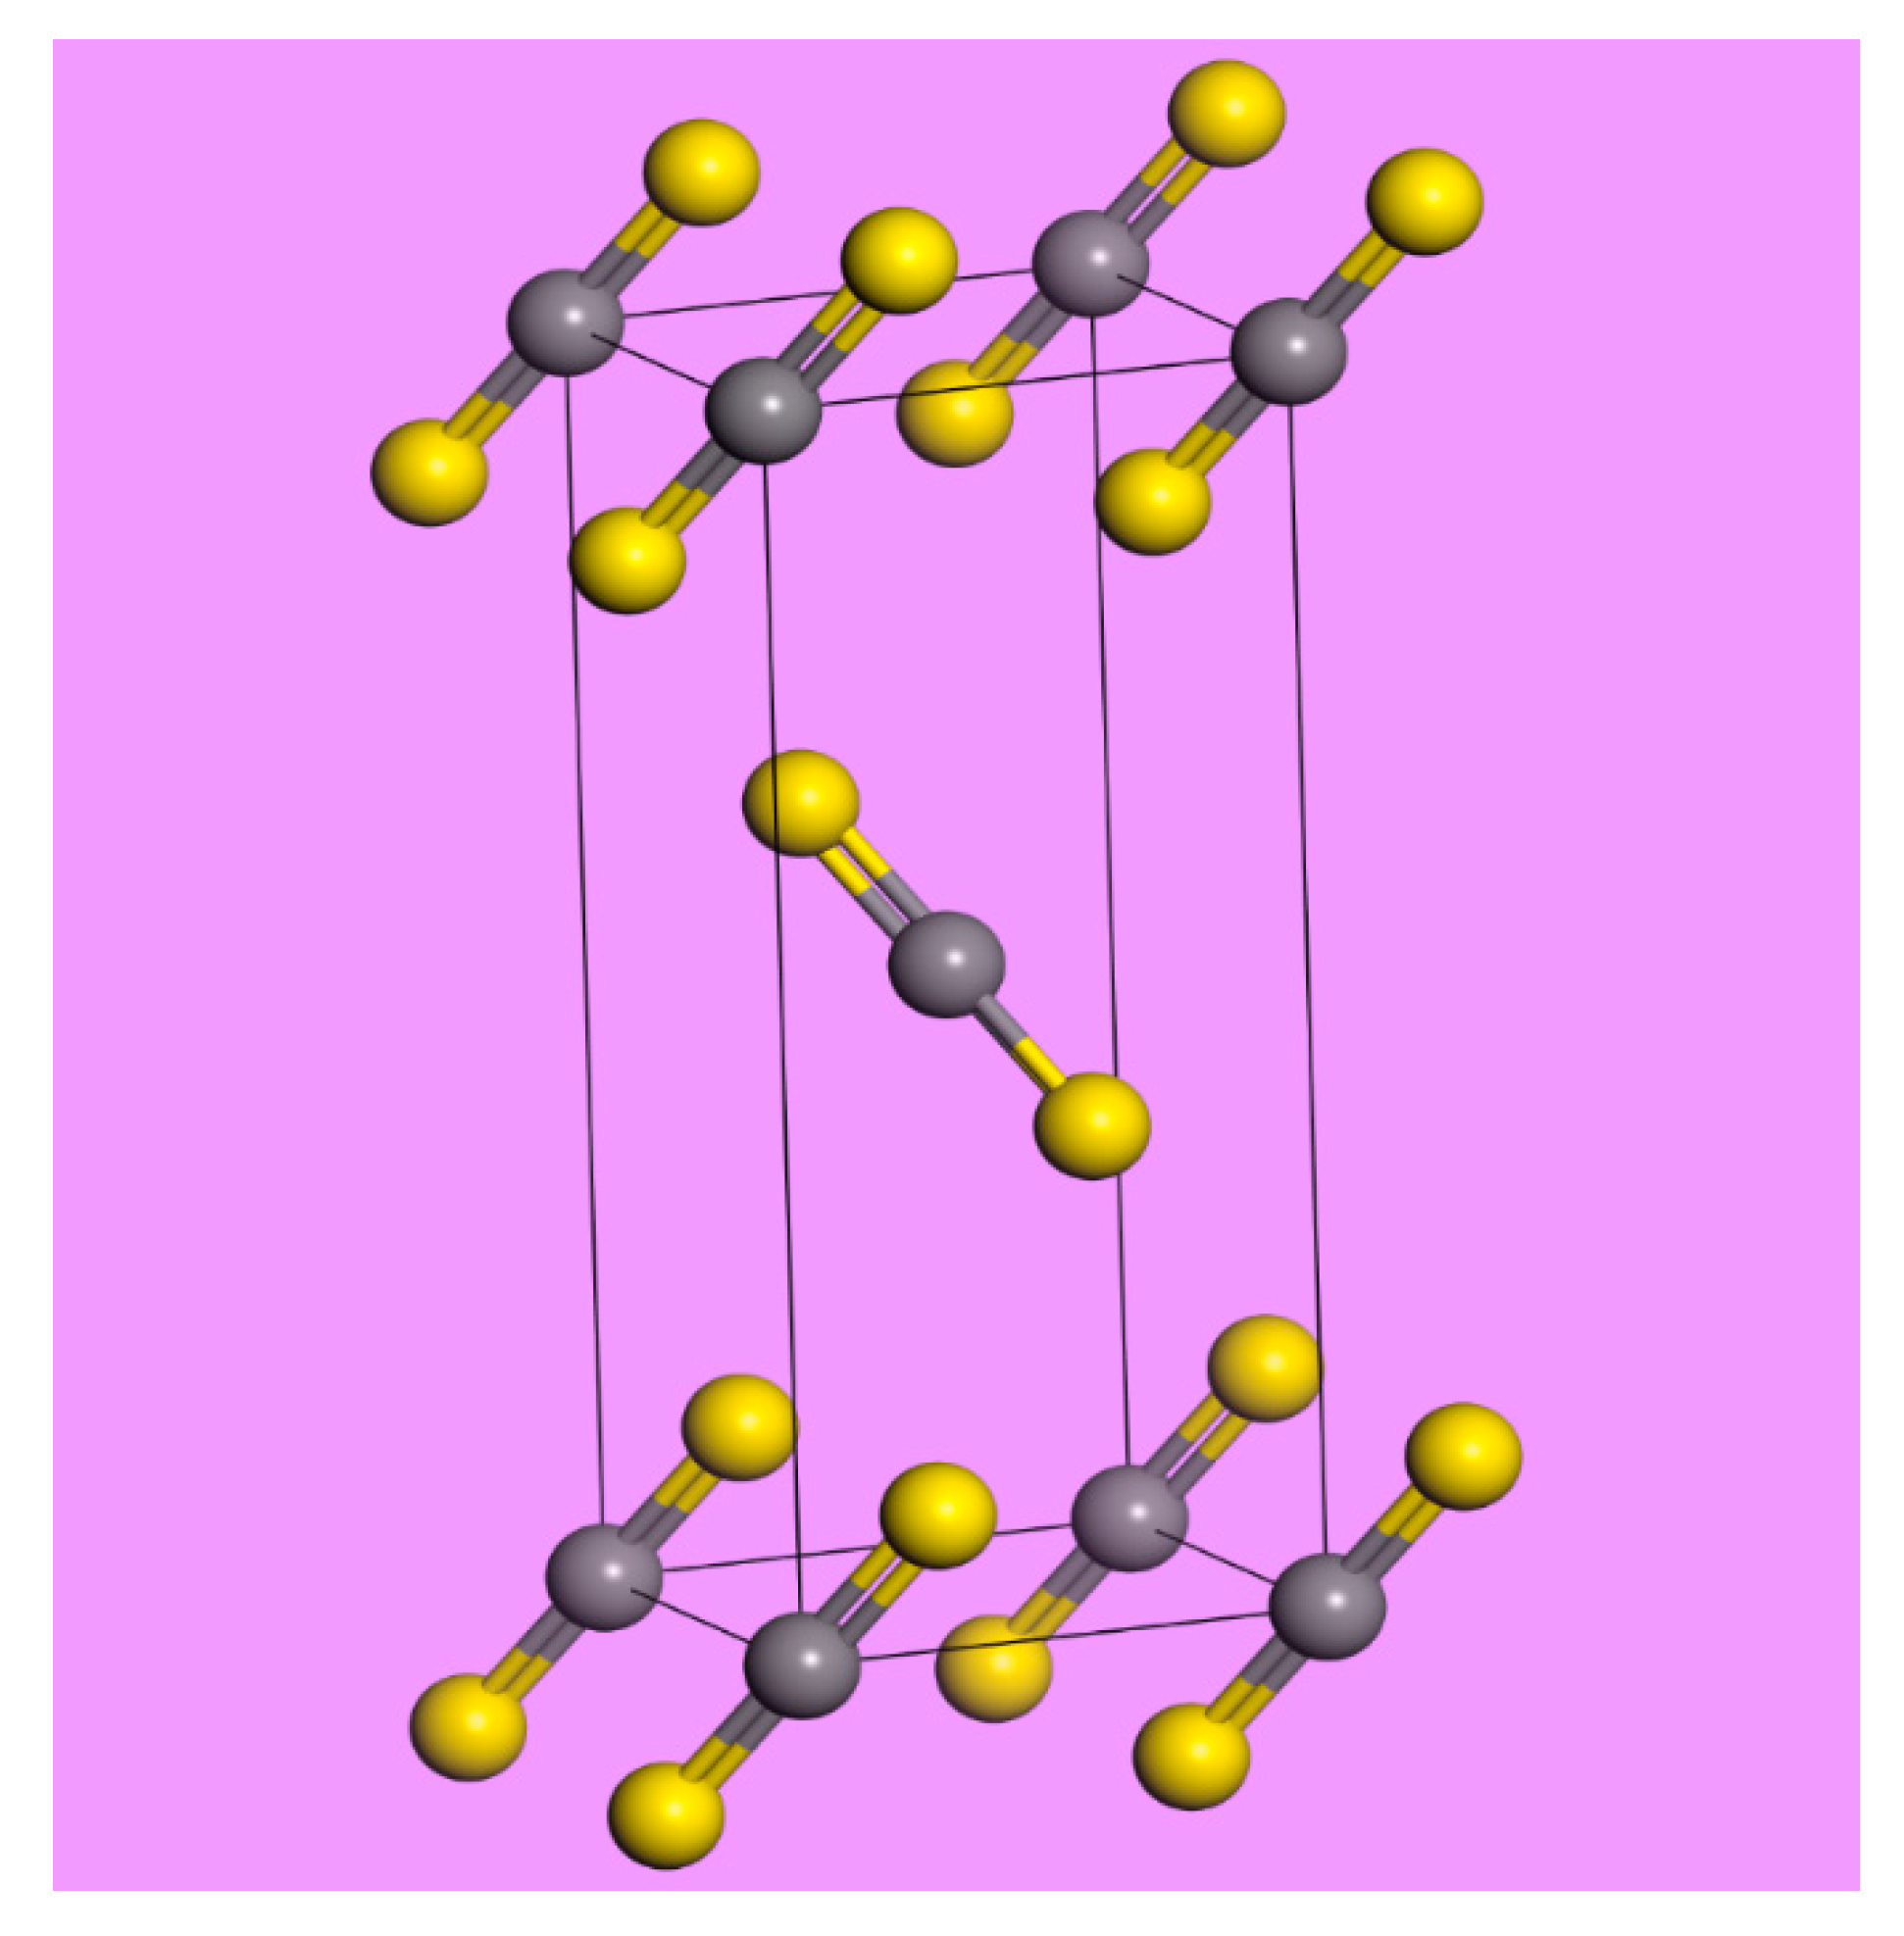
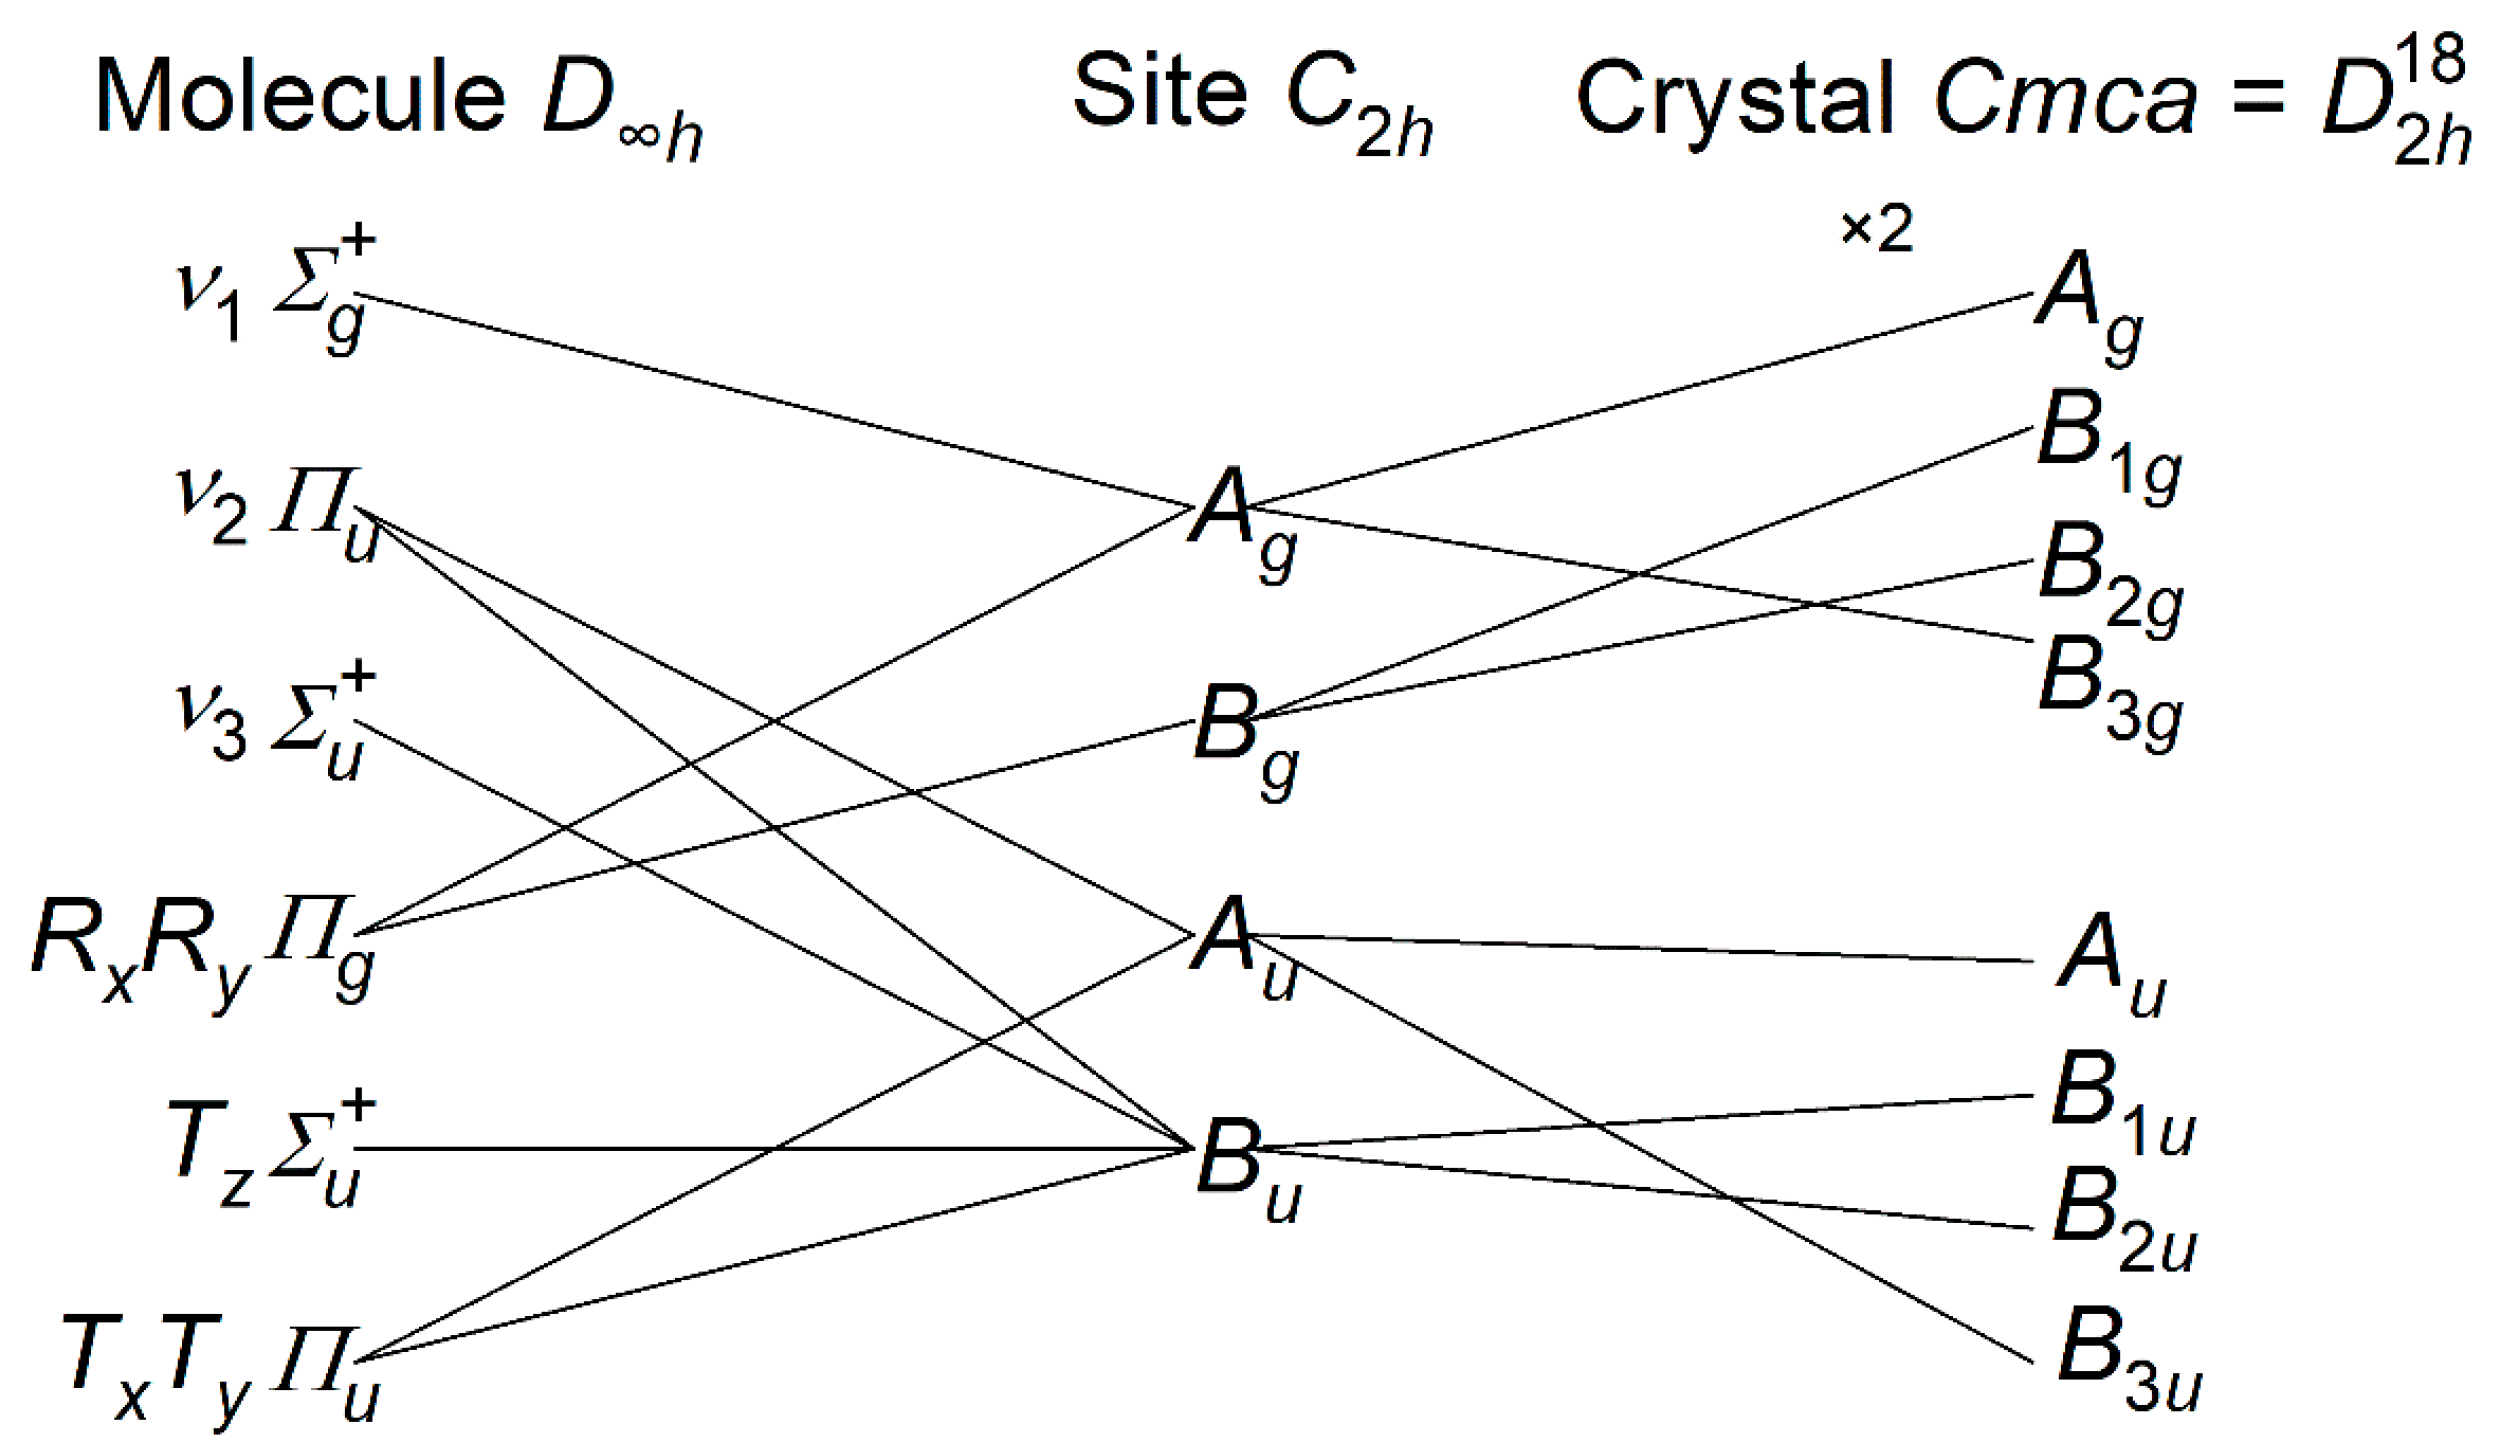
In the solid state, the crystal is orthorhombic (Cmca) with two molecules in the primitive unit cell, both on sites of C2h symmetry [14,15]; see Figure 1. Figure 2 shows the correlation diagram for CS2 and that, at the Γ-point in the Brillouin zone (where the infrared and Raman active modes occur), the modes comprise:
  • {Ag + B3g} ν1 symmetric stretch, {Au + B1u + B2u + B3u} ν2 bend,
  • {B1u + B2u} ν3 asymmetric stretch, {Ag + B1g + B2g + B3g} libration,
  • {B1g + B2g} translation along z, {Au + B1u + B2u + B3u} translation along x,y
In addition, there are three acoustic translational modes that have zero energy at the Γ-point, but non-zero elsewhere in the Brillouin zone. These are not observable by infrared or Raman spectroscopy; however, INS can measure these [10,11]. All g modes are Raman active; B1u, B2u, B3u are infrared active, and Au is inactive in both the infrared and the Raman. Note that all modes are allowed in the INS spectrum.
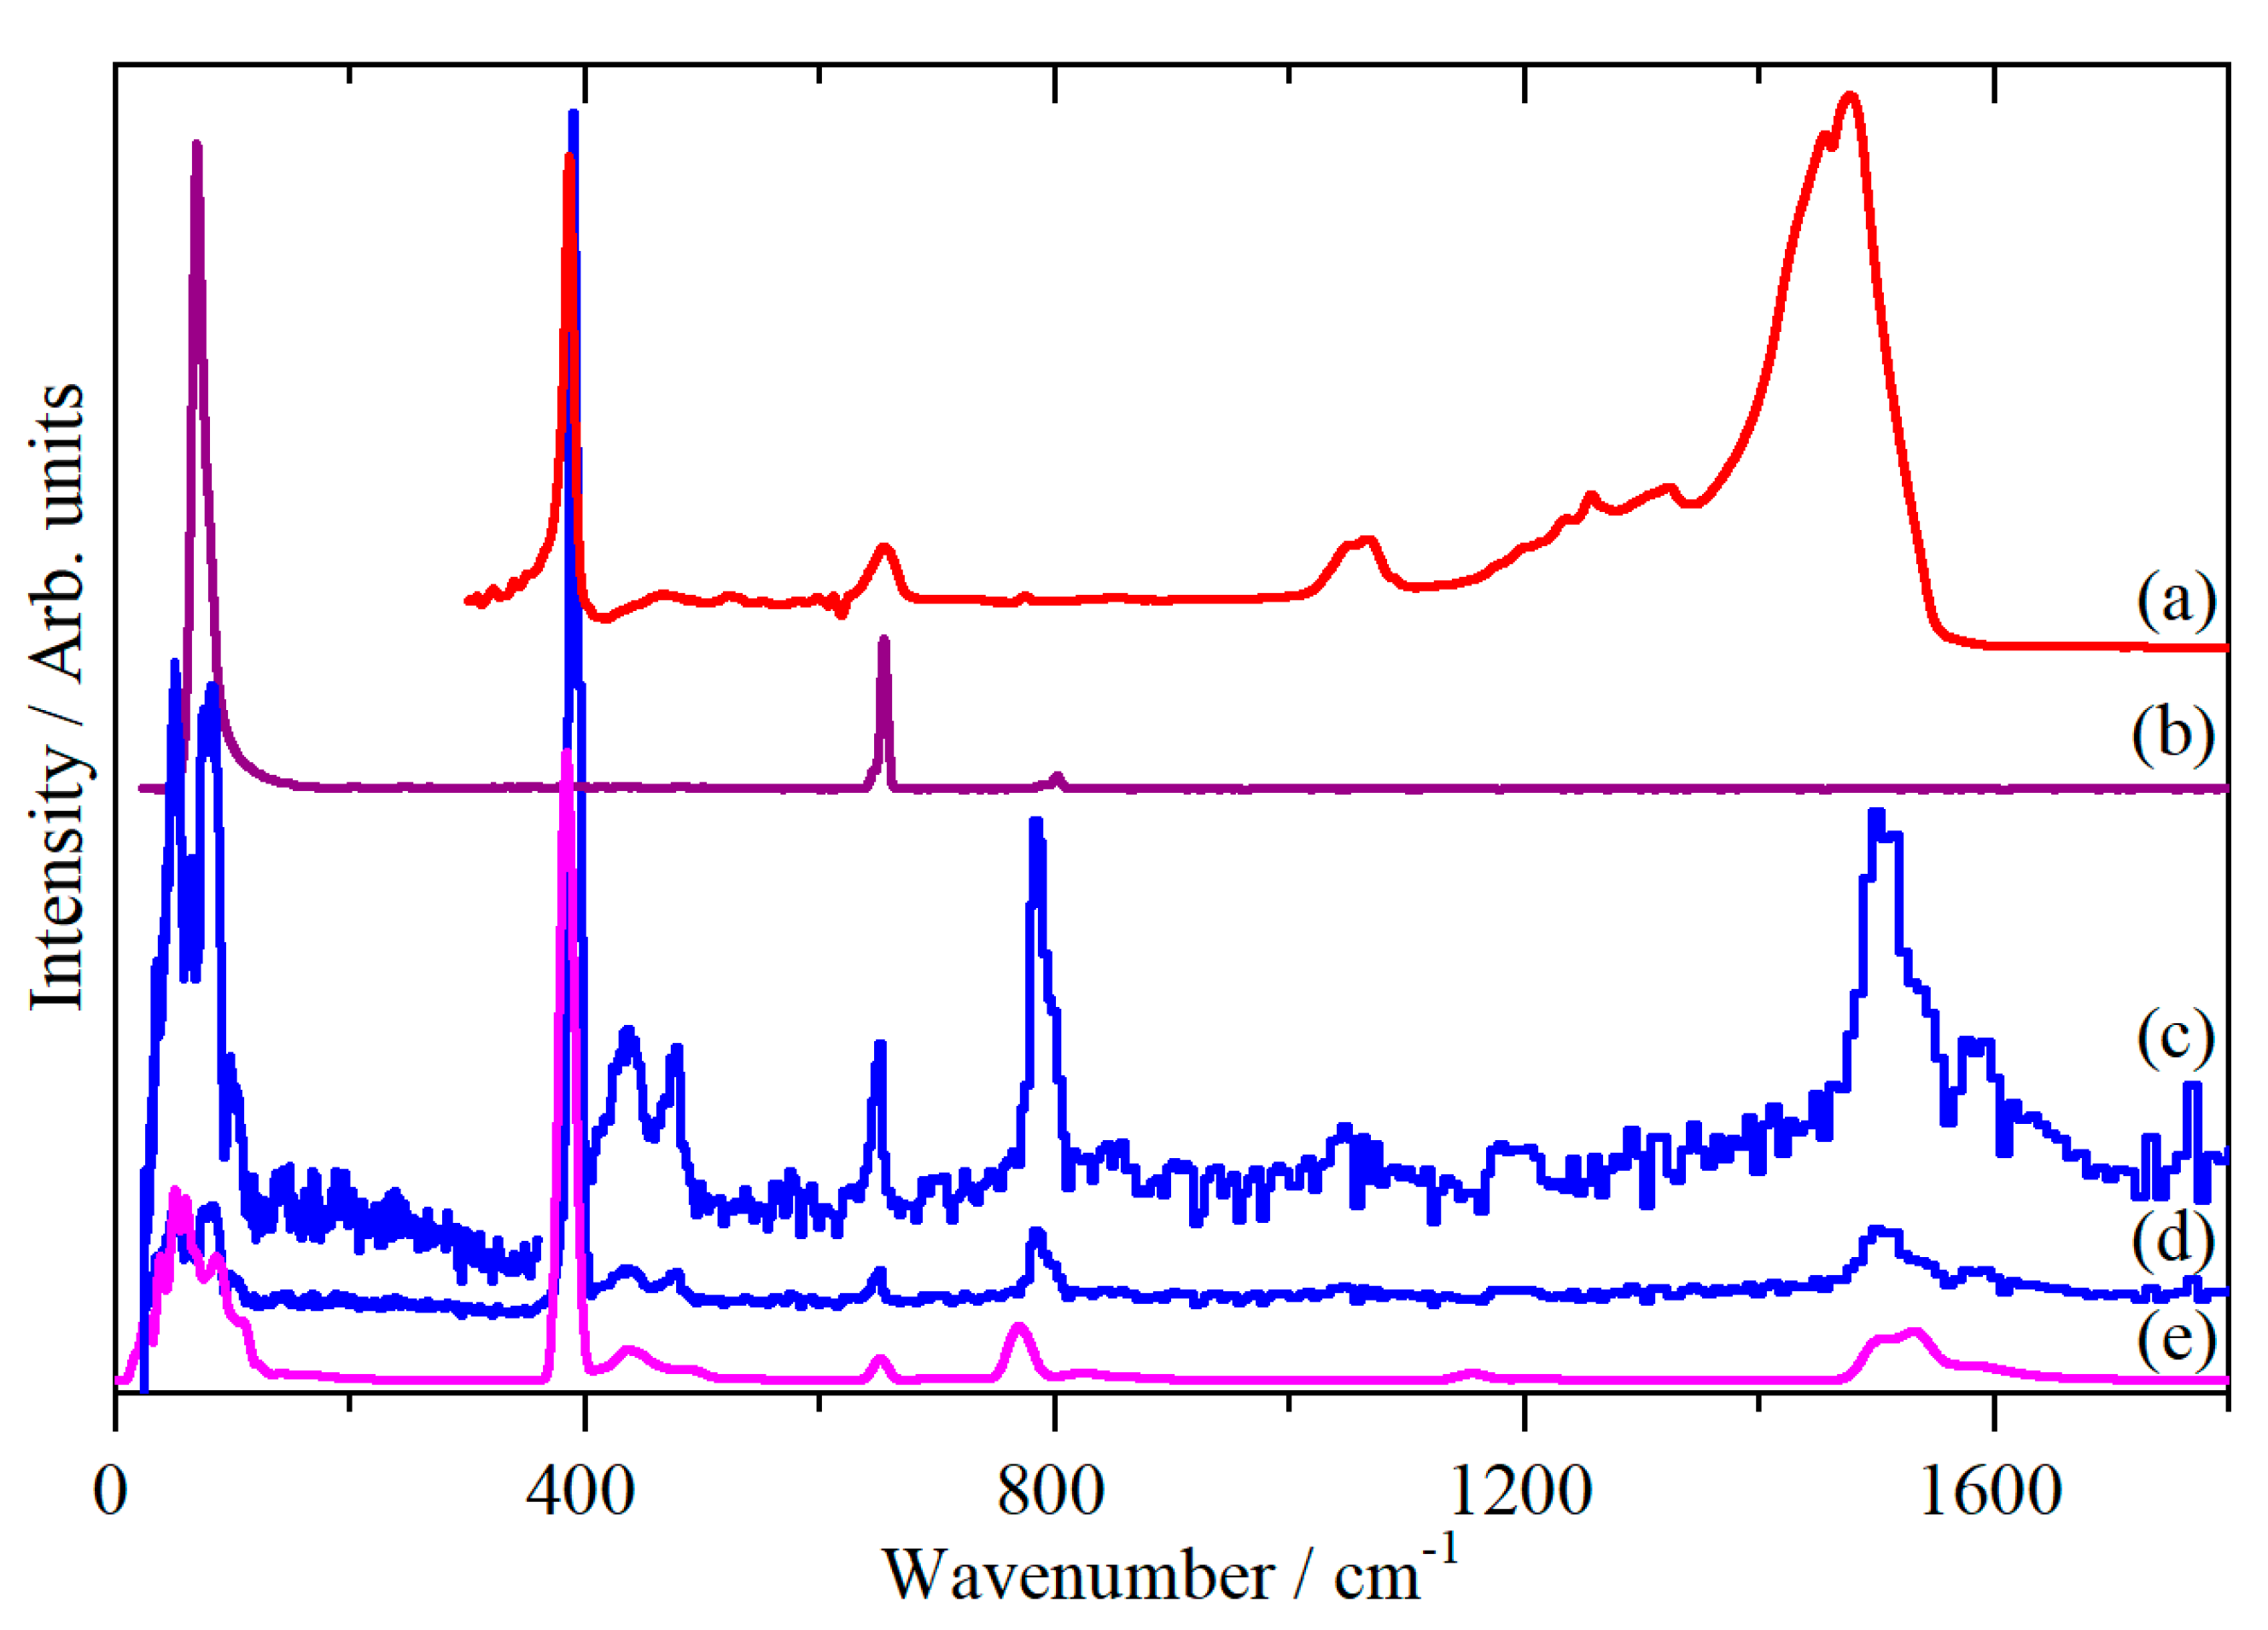
Figure 3 shows the infrared, Fourier transform Raman (FT-Raman), and INS spectra. The infrared and Raman spectra are in agreement with those previously published [7], and the INS spectrum has not been seen previously. The internal fundamental modes are clearly seen at 1494 cm−1 (ν3 asymmetric stretch), 655 cm−1 (ν1 symmetric stretch), and 390 cm−1 (ν2 bend). The external (lattice) modes all occur below 150 cm−1. The remaining features are: ν3 + lattice (1586 cm−1), ν1 + ν2 (1066/1052 cm−1), 2 ν2, (788 cm−1), and ν2 + lattice (476/440 cm−1). Table 1 lists the fundamental modes.
There have been several attempts at detailed assignments of the spectra by lattice dynamics; however, these have all been based on empirical force field models [7,10,11,16,17]. Figure 3e shows the INS spectrum generated from a periodic density functional theory (DFT) calculation of the primitive unit cell, which includes the effect of vibrational dispersion (the variation of transition energy with wavevector). It can be seen that there is generally good agreement. Table 1 also lists the transition energies of the modes (and their symmetry) at the Γ-point in the Brillouin zone (where the infrared and Raman active modes are observed).
The calculations show that the inactive Au component of the ν2 bend quartet is almost coincident with one of the allowed modes. The observed modes are ~10 cm−1 higher in energy, but the separation between the highest and lowest member, for both the observed and calculated transition energies, is almost the same: 11.4 and 14.0 cm−1, respectively. The full width at half maximum of the very strong INS band at 390 cm−1 is 11.9 cm−1, and there are no other features close by. As all four components of ν2 will have similar INS intensity (because the motion is the same in each case, only the phasing differs, and this is confirmed by the ACLIMAX [18] calculation of the individual intensities), this very strongly indicates that the Au mode is within the envelope of the 390 cm−1 band.
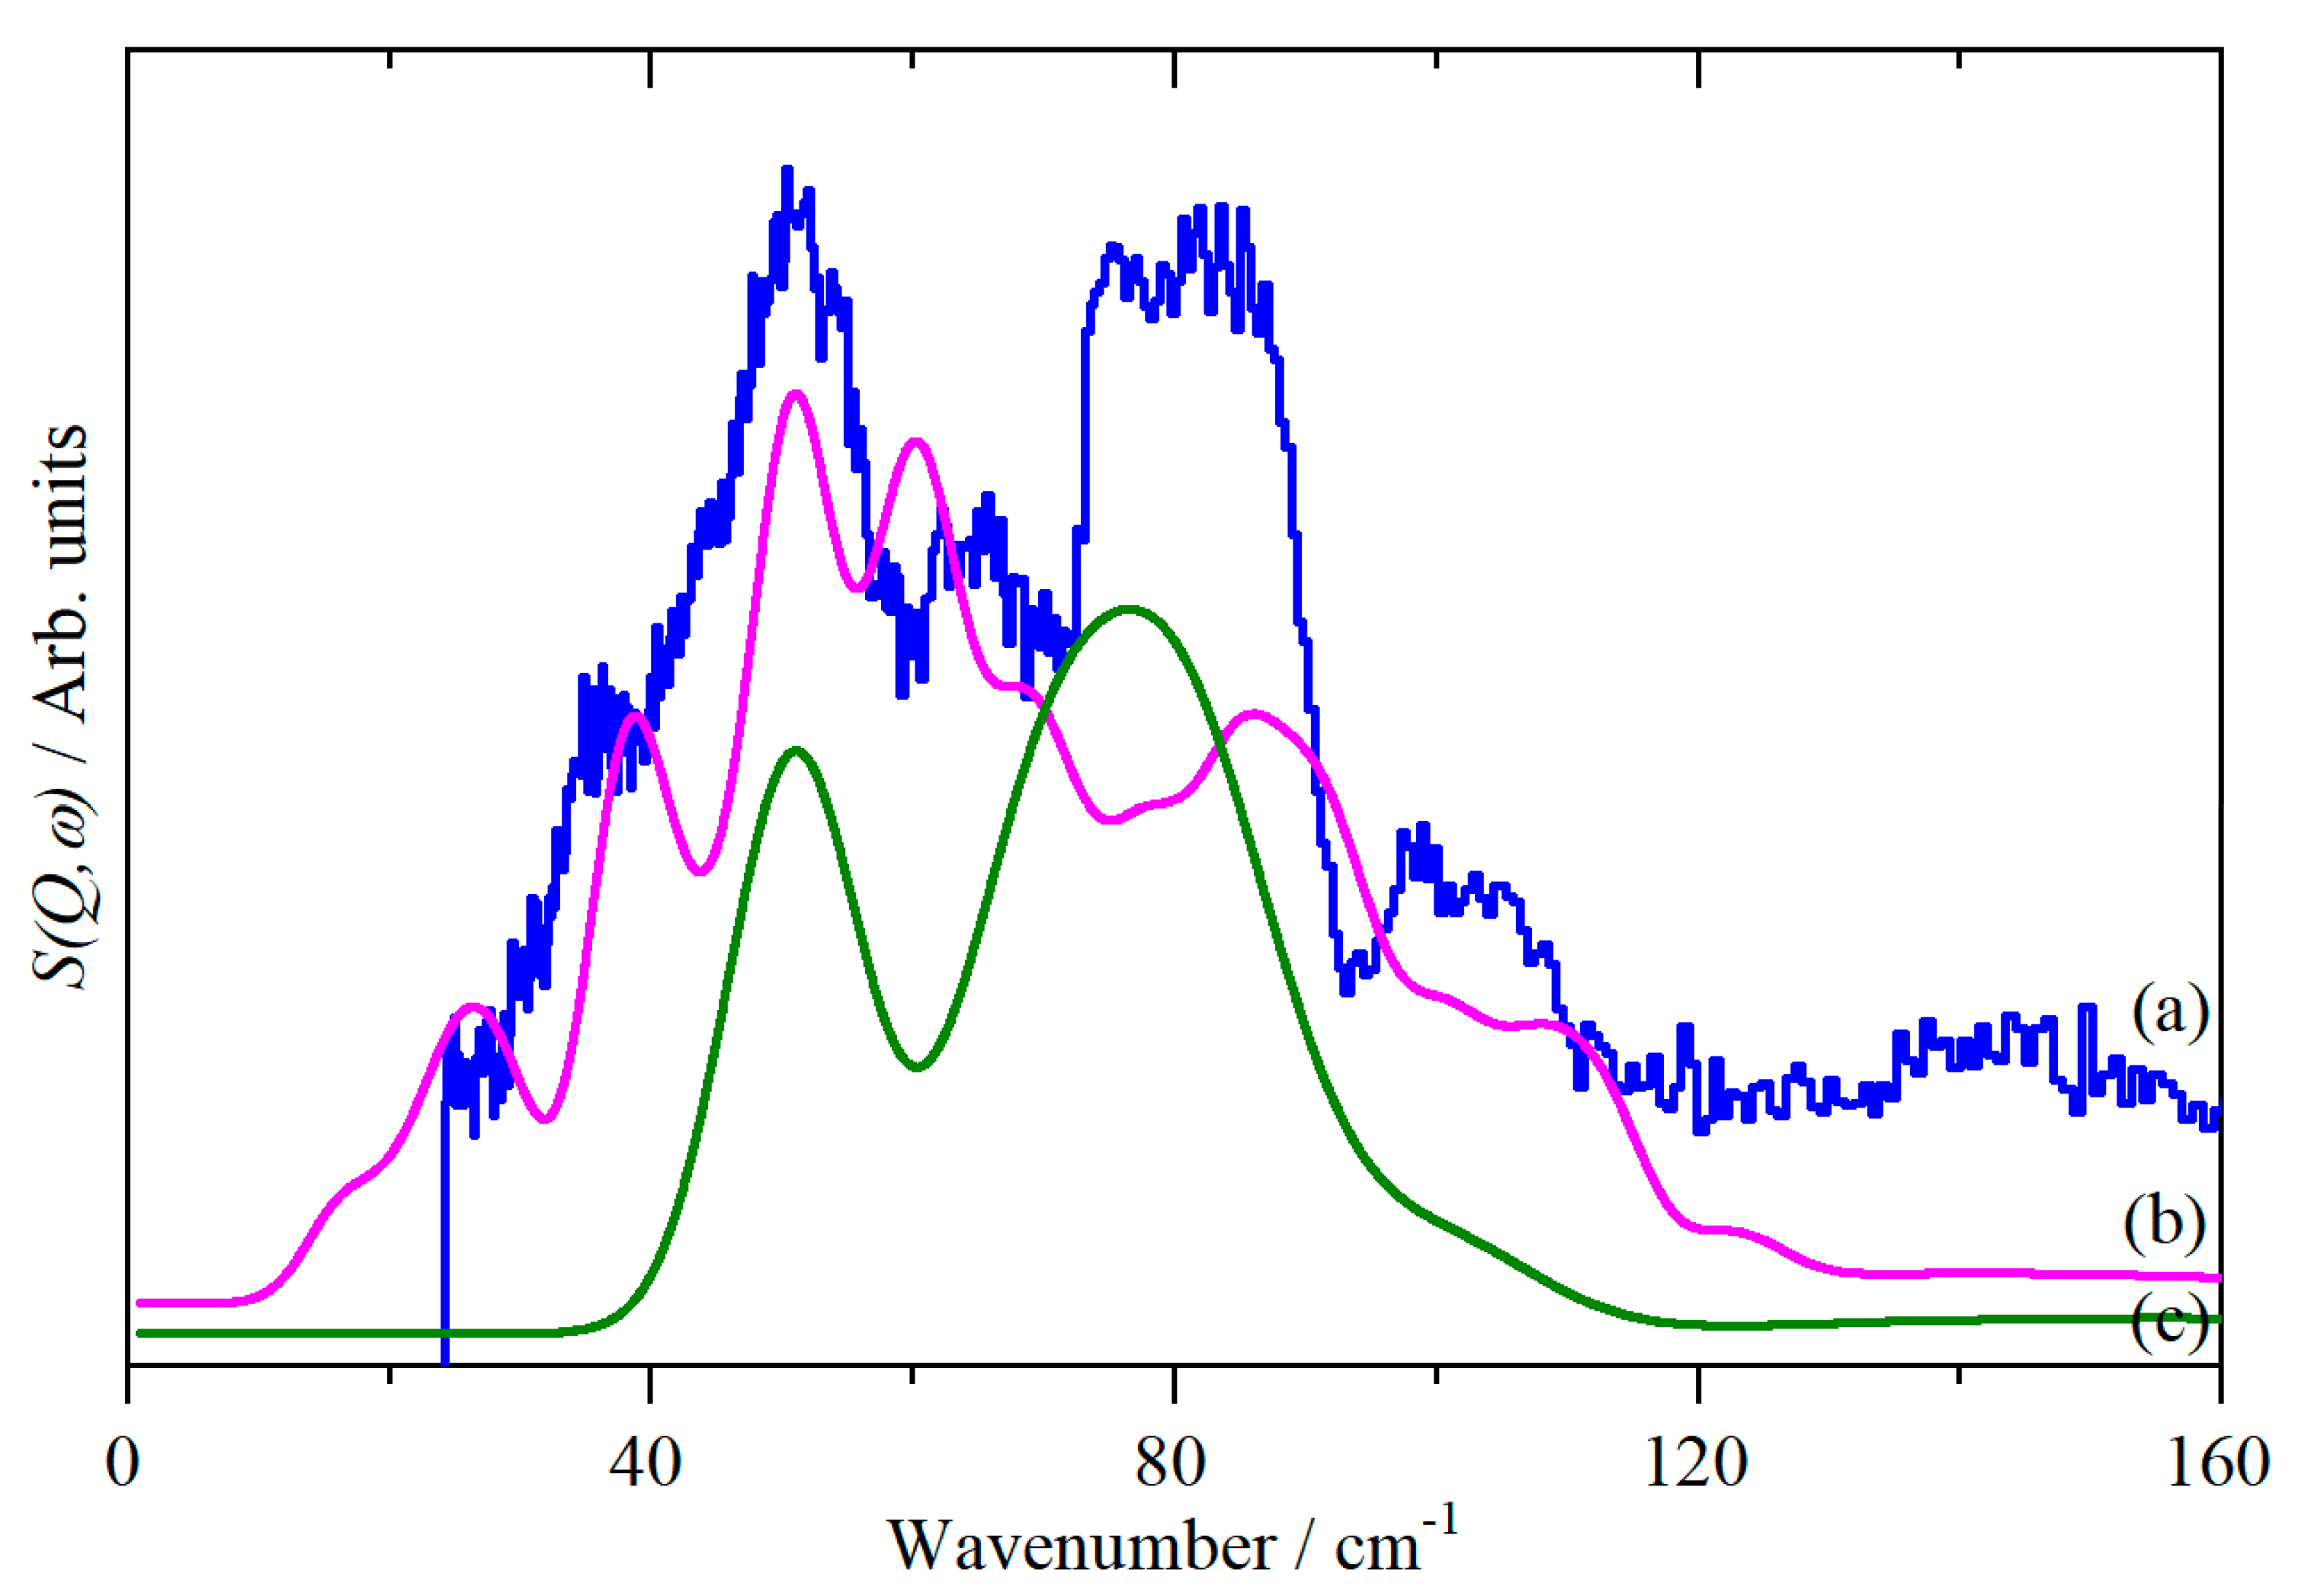
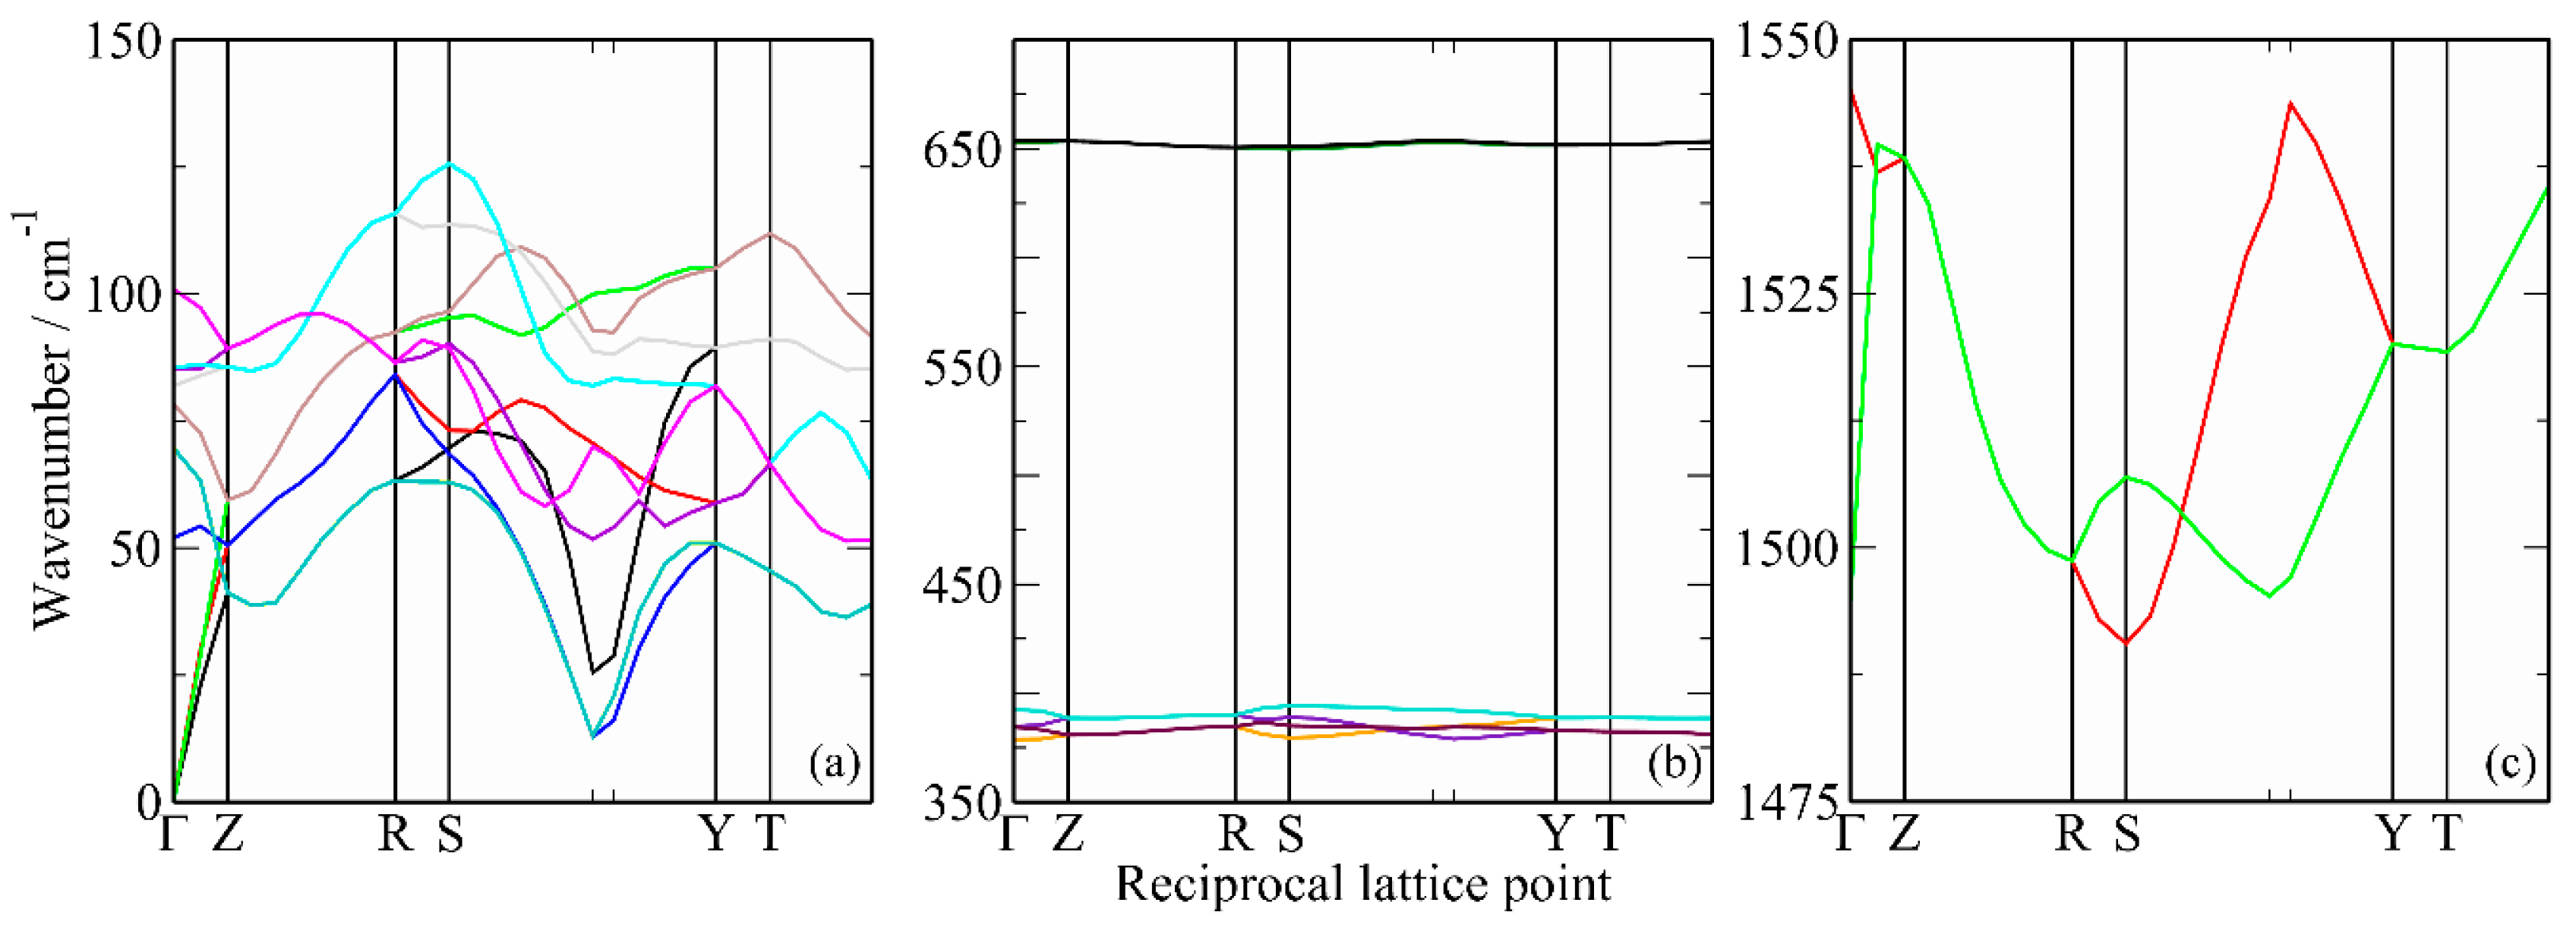
Figure 4 presents a detailed comparison of the observed and calculated INS spectra in the low energy region. It is evident that there is a considerable difference between the full dispersion calculation, 4b, and the Γ-point only calculation, 4c, demonstrating that there is significant dispersion present, as seen for the acoustic modes by inelastic coherent neutron scattering from a single crystal [11]. The calculated dispersion curves are shown in Figure 5. It can be seen that all of the modes in the region below 150 cm−1 exhibit significant dispersion, which makes the association of specific features in the INS spectrum, in this region, with a particular mode meaningless. The “missing” translational mode is calculated to be at 52 cm−1 at the Γ-point, but disperses over the range 20–80 cm−1; thus, it makes a contribution to the structured peak at 51 cm−1, but this also includes significant contributions from acoustic translational modes. This is apparent from the additional peaks at 26 and 39 cm−1 in the full dispersion calculation, 4b, that are absent in the Γ-point only calculation, 4c, as the acoustic modes have zero energy at the Γ-point, Figure 5a.
The comparison of Figure 4b and 4c also shows that the features at 99 and 104 cm−1, that have not been previously reported, are a consequence of the dispersion in the librational modes away from the Γ-point, Figure 5a.

3. Discussion

The aim at the outset of this project was to locate the two infrared and Raman inactive factor group components of the translations and the ν2 bending mode. The expectation was that, because all the modes are allowed in the INS, this should enable their location, as has been done for many other systems, e.g., C60 [19] and M(CO)6 (M = Cr, Mo, W) [20]. This has proven to be more complicated than anticipated. The width of an INS peak is determined by the instrumental resolution and the inherent peak width, which depends on the vibrational dispersion. All four of the ν2 bending mode components fall within 12 cm−1 and have a few wavenumbers dispersion, which accounts for the measured width (the resolution at this energy transfer is ~5 cm−1 [13]). Based on a simulation of the band shape of the 390 cm−1 feature, the most likely position of the optically forbidden component of the ν2 bending mode is 393 ± 2 cm−1.
The translational mode is much more problematic. The calculations, Figure 4a, show that this is strongly dispersed, so it does not result in a single feature in the INS spectrum. The calculated value of 52 cm−1 at the Γ-point is slightly higher than the 37 cm−1 measured close to the melting point of CS2 [11], but the latter is likely to be severely affected by anharmonicity.

4. Materials and Methods

Carbon disulfide (99%) was purchased from Sigma-Aldrich (Gillingham, Dorset, UK) and used as received.
INS spectra were recorded using the TOSCA [21] spectrometer at the ISIS Pulsed Neutron and Muon Facility (Chilton, Oxfordshire, UK) [22]. On TOSCA, the resolution is ~1.25% of the energy transfer across the entire energy range. Infrared spectra (4 cm−1 resolution, 64 scans) were recorded between 105 K and 298 K with a Bruker Vertex 70 Fourier transform infrared spectrometer using a Specac single reflection variable temperature attenuated total internal reflection accessory. The FT-Raman spectrum was recorded at room temperature and 77 K from the sample inside a quartz cuvette with a Bruker MultiRam spectrometer using 1064 nm excitation (500 mW laser power and 1024 scans at 4 cm−1 resolution).
Dispersion corrected periodic density functional theory (DFT-D) calculations were carried out using the plane wave pseudopotential method, as implemented in the CASTEP code (version 17.21) [23,24]. Exchange and correlation were approximated using the PBE [25] functional with the Tkatchenko-Scheffler (TS) dispersion correction scheme [26] within the generalized gradient approximation (GGA). The plane-wave cut-off energy was 750 eV. Brillouin zone sampling of electronic states was performed on a 12 × 12 × 4 Monkhorst-Pack grid (84 k-points). The equilibrium structure, an essential prerequisite for lattice dynamics calculations, was obtained by BFGS geometry optimization after which the residual forces were converged to ±0.00087 eV Å−1. Phonon frequencies were obtained by diagonalization of the dynamical matrix, computed using density-functional perturbation theory [27], to compute the dielectric response and the Born effective charges, and, from these, the mode oscillator strength tensor and infrared absorptivity were calculated. In addition to the calculation of transition energies and intensities at zero wavevector, phonon dispersion was also calculated along high symmetry directions throughout the Brillouin zone. For this purpose, dynamical matrices were computed on a regular grid of wavevectors throughout the Brillouin zone, and Fourier interpolation was used to extend the computed grid to the desired fine set of points along the high-symmetry paths [28]. The atomic displacements in each mode, that are part of the CASTEP output, enable visualization of the modes to aid assignments and are also all that is required to generate the INS spectrum using the program ACLIMAX (version 6.0.0 LE) [18]. It is emphasised that, for the calculated spectra and dispersion curves shown, the transition energies have not been scaled.

5. Conclusions

This paper highlights the crucial interplay of theory and experiment for vibrational spectroscopy. Without the calculations, finding the location of the Au component of the ν2 bend quartet would be simply guesswork, as none of the three forms of vibrational spectroscopy enable observation of the mode, but it must contribute to the INS spectrum. Similarly for the Au translational mode, the calculations show this to be highly dispersed, so a distinct feature cannot be assigned to it. The comparison of the theory and the experiment for the INS spectra illustrates the power of the combination, but also demonstrates that DFT still has some way to go before it can predict intermolecular modes with the same reliability that it does for intramolecular modes.

Author Contributions

Conceptualization, S.F.P.; experimental work, F.A., M.A.F., F.O., R.R.W.; S.F.P; writing—original draft preparation, S.F.P; writing—review and editing, S.F.P, I.B.A.; funding acquisition, I.B.A. All authors have read and agreed to the published version of the manuscript.

Funding

This research was supported by the Science and Technology Facilities Council (STFC) and the Newton Fund.

Acknowledgments

The UK−Indonesia Science and Technology Partnership on STEM Skills for Large Facilities, supported by the Newton Fund and delivered by STFC, ISIS, Diamond, and LIPI is gratefully thanked for the financial support of this project. The STFC Rutherford Appleton Laboratory is thanked for access to neutron beam facilities. Computing resources (time on the SCARF computer cluster for the CASTEP calculations) was provided by STFC’s e-Science facility. This research has been performed with the aid of facilities at the Research Complex at Harwell, including the FT-Raman spectrometer. The authors would like to thank the Research Complex for access and support to these facilities and equipment.

Conflicts of Interest

The authors declare no conflicts of interest.

References

  1. Smith, D.E.; Timmermann, R.W. Carbon Disulfide. In Kirk-Othmer Encyclopedia of Chemical Technology, 4th ed.; John Wiley: New York, NY, USA, 1991; Volume 5, pp. 26–36. [Google Scholar]
  2. Stoicheff, B.P. High resolution Raman spectroscopy of gases: XI. Spectra of CS2 and CO2. Can. J. Phys. 1958, 36, 218–230. [Google Scholar] [CrossRef]
  3. Person, W.B.; Hall, L.C. Absolute infrared intensities of CS2 fundamentals in gas and liquid phases. An interpretation of the bond moments of CO2 and CS2. Spectrochim. Acta 1964, 20, 771–779. [Google Scholar] [CrossRef]
  4. Smith, D.F.; Overend, J. General quartic force field of CS2. J. Chem. Phys. 1971, 54, 3632–3639. [Google Scholar] [CrossRef]
  5. Lindenmayer, J.; Jones, H. Diode laser spectroscopy of the ν3 band region of four isotopic forms of CS2. J. Mol. Spec. 1985, 110, 65–73. [Google Scholar] [CrossRef]
  6. Kroto, H.W.; Teixeira-Dias, J.J.C. The effects of intermolecular interactions in the Raman spectrum of liquid CS2. Spectrochim. Acta 1972, 28, 1497–1502. [Google Scholar] [CrossRef]
  7. Anderson, A.; Grout, P.J.; Leech, J.W.; Sun, T.S. Raman spectra of molecular crystals: Carbon disulphide. Chem. Phys. Lett. 1973, 21, 9–14. [Google Scholar] [CrossRef]
  8. Yamada, H.; Person, W.B. Absolute infrared intensities of the fundamental absorption bands in solid CS2. J. Chem. Phys. 1964, 40, 309–321. [Google Scholar] [CrossRef]
  9. Ishi, K.; Takahashi, S.I. Far infrared spectrum of crystalline carbon disulphide. Chem. Phys. Lett. 1977, 45, 460–461. [Google Scholar] [CrossRef]
  10. Burgos, E.; Righini, R. The effects of anisotropic atom-atom interactions on the crystal structure and lattice dynamics of solid CS2. Chem. Phys. Lett. 1983, 96, 584–590. [Google Scholar] [CrossRef]
  11. Powell, B.M.; Dolling, G.; Torrie, B.H.; Pawley, G.S. Intermolecular modes of solid carbon disulphide. J. Phys. C: Solid State Phys. 1982, 15, 4265–4274. [Google Scholar] [CrossRef]
  12. Bier, K.D.; Jodl, H.J.; Loewenschuss, A. The Raman spectrum of amorphous and crystalline solid carbon disulphide. Chem. Phys. Lett. 1985, 115, 34–39. [Google Scholar] [CrossRef]
  13. Mitchell, P.C.H.; Parker, S.F.; Ramirez-Cuesta, A.J.; Tomkinson, J. Vibrational Spectroscopy with Neutrons, with Applications in Chemistry, Biology, Materials Science and Catalysis; World Scientific: Singapore, Singapore, 2005. [Google Scholar]
  14. Baenziger, N.C.; Duax, W.L. Crystal structure and molecular motion of solid carbon disulfide. J. Chem. Phys. 1968, 48, 2974–2981. [Google Scholar] [CrossRef]
  15. Powell, B.M.; Dolling, G.; Torrie, B.H. Structure of solid carbon disulphide between 5 and 150 K. Acta Cryst. 1982, B38, 28–32. [Google Scholar] [CrossRef]
  16. Grout, P.J.; Leech, J.W. Intermolecular modes of solid carbon disulphide. J. Phys. C: Solid State Phys. 1982, 15, L1083–Ll087. [Google Scholar] [CrossRef]
  17. Higgs, J.F.; Anderson, A. Dynamical model for the lattice frequencies and crystal field splittings of carbon disulphide. Phys. Stat. Sol. (b) 1986, 137, 39–46. [Google Scholar] [CrossRef]
  18. Ramirez-Cuesta, A.J. aCLIMAX 4.0.1, The new version of the software for analyzing and interpreting INS spectra. Comput. Phys. Commun. 2004, 157, 226–238. [Google Scholar] [CrossRef]
  19. Parker, S.F.; Bennington, S.M.; Taylor, J.W.; Herman, H.; Silverwood, I.; Albers, P.; Refson, K. Complete assignment of the vibrational modes of C60 by inelastic neutron scattering spectroscopy and periodic-DFT. Phys. Chem. Chem. Phys. 2011, 13, 7789–7804. [Google Scholar] [CrossRef]
  20. Parker, S.F.; Jayasooriya, U.A. Assignment of the solid state spectra of the Group VI hexacarbonyls by inelastic neutron scattering spectroscopy. Phys. Chem. Chem. Phys. 2019, 21, 24950–24955. [Google Scholar] [CrossRef]
  21. Pinna, R.S.; Rudić, S.; Parker, S.F.; Armstrong, J.; Zanetti, M.; Škoro, G.; Waller, S.P.; Zacek, D.; Smith, C.A.; Capstick, M.J.; et al. The neutron guide upgrade of the TOSCA spectrometer. Nucl. Instrum. Methods Phys. Res. A 2018, 896, 68–74. [Google Scholar] [CrossRef] [Green Version]
  22. ISIS Neutron and Muon Source. Available online: http://www.isis.stfc.ac.uk/ (accessed on 24 March 2020).
  23. Clark, S.J.; Segall, M.D.; Pickard, C.J.; Hasnip, P.J.; Probert, M.J.; Refson, K.; Payne, M.C. First principles methods using CASTEP. Z. Krist. 2005, 220, 567–570. [Google Scholar] [CrossRef] [Green Version]
  24. Refson, K.; Tulip, P.R.; Clark, S.J. Variational density-functional perturbation theory for dielectrics and lattice dynamics. Phys. Rev. B 2006, 73, 155114. [Google Scholar] [CrossRef] [Green Version]
  25. Perdew, J.; Burke, K.; Ernzerhof, M. Generalized gradient approximation made simple. Phys. Rev. Lett. 1996, 77, 3865–3868. [Google Scholar] [CrossRef] [PubMed] [Green Version]
  26. Tkatchenko, A.; Scheffler, M. Accurate molecular van der Waals interactions from ground-state electron density and free-atom reference data. Phys. Rev. Lett. 2009, 102, 073005. [Google Scholar] [CrossRef] [PubMed] [Green Version]
  27. Milman, V.; Perlov, A.; Refson, K.; Clark, S.J.; Gavartin, J.; Winkler, B. Structural, electronic and vibrational properties of tetragonal zirconia under pressure: A density functional theory study. J. Phys.: Condens. Matter 2009, 21, 485404. [Google Scholar] [CrossRef] [PubMed]
  28. Gonze, X.; Charlier, J.-C.; Teter, M.P. Interatomic force constants from first principles: The case of α–quartz. Phys. Rev. B 1994, 50, 13035–13038. [Google Scholar] [CrossRef]
Sample Availability: Carbon disulfide is widely available from commercial sources.
Figure 1. The primitive unit cell of carbon disulfide. Grey = carbon, yellow = sulfur.
Molecules 25 01901 g001
Figure 2. Correlation table for carbon disulfide in the solid state. R = libration, T = translation.
Molecules 25 01901 g002
Figure 3. Vibrational spectra of solid CS2. (a) infrared at 208 K, (b) FT-Raman at ~ 77 K, (c) INS at 20 K, ×5 ordinate expansion, (d) INS at 20 K, and (e) INS spectrum generated from a periodic density functional theory (DFT) calculation of CS2.
Molecules 25 01901 g003
Figure 4. INS spectra of solid CS2 in the lattice mode region. (a) Observed, (b) generated from a periodic-DFT calculation for the complete Brillouin zone, and (c) as (b) but for the Γ-point only.
Molecules 25 01901 g004
Figure 5. Calculated dispersion curves of solid CS2. (a) In the lattice mode region, (b) ν2 and ν1, and (c) ν3.
Molecules 25 01901 g005
Table 1. Observed and calculated (at the Γ-point) transition energies and intensities of the fundamental modes of CS2.
DFT INS 1InfraredRamanDescription
/ cm−1SymmetryInfrared
/ Debye2 Å−2 amu−1
Raman
/ Å4 amu−1
/ cm−1/ cm−1/ cm−1
0.0B2u0.0000.0 Acoustic
0.0B1u0.0000.0 Acoustic
0.0B3u0.0000.0 Acoustic
52.0Au0.0000.051 Translation
69.7B1u0.0070.0 66.5 [9] Translation
78.1B2u0.0070.0 68.2 [9] Translation
81.9Ag0.000231.0 75 [7]Libration
85.3B1g0.00021.9 79 [7]Libration
85.6B3g0.00023.2 79 [7]Libration
100.9B2g0.000109.8 85 [7]Libration
378.3B3u0.2020.0 388.7 [8] ν2 bend
384.0B2u0.1970.0 393.4 [8] ν2 bend
384.5Au0.0000.0 ν2 bend
392.3B1u0.2250.0390 vs400.1 [8] ν2 bend
653.1Ag0.000913.1651 w 655 sν1 symmetric stretch
653.9B3g0.00068.2 646 mν1 symmetric stretch
1494.6B1u42.5700.01507 w1479 vs ν3 asymmetric stretch
1536.3B2u10.1320.01540 w1530 sh ν3 asymmetric stretch
1 s = strong, m = medium, w = weak, v = very, sh = shoulder.