
Phosphine Oxides as Spectroscopic Halogen Bond Descriptors: IR and NMR Correlations with Interatomic Distances and Complexation Energy


Abstract
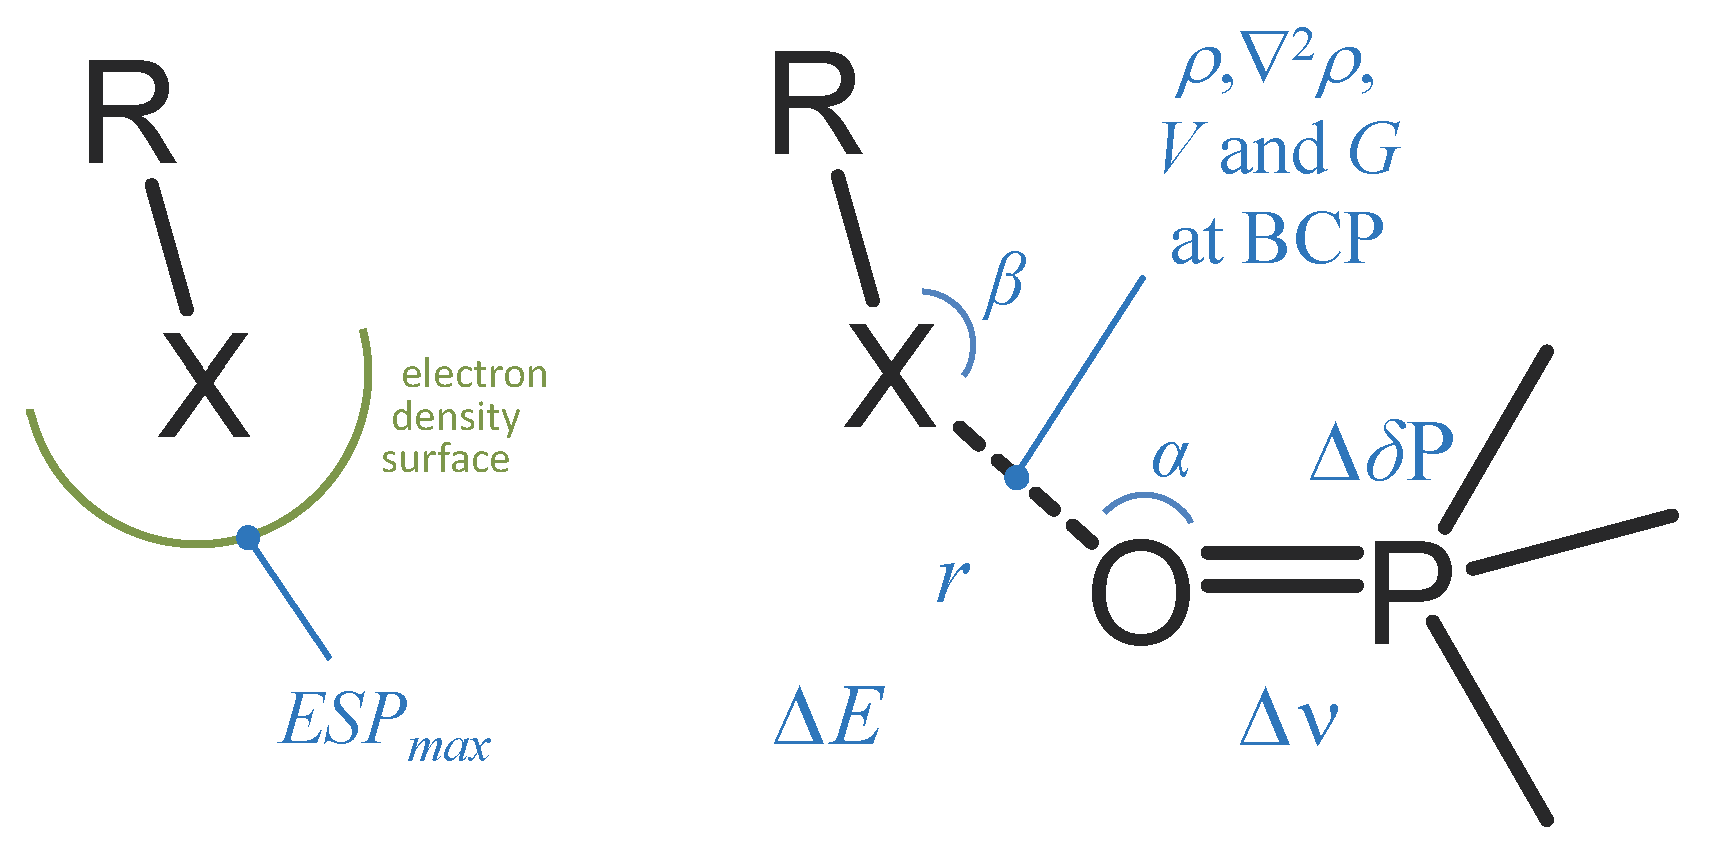
1. Introduction
- (1)
- halogens (F2, Cl2, Br2, I2, At2);
- (2)
- interhalides (ClF, ClF3, ClF5, BrF, BrF3, BrF5, BrCl, IF, IF3, IF5, ICl, ICl3, IBr, AtCl, AtBr, AtI);
- (3)
- oxohalides (OF2, ClO3OF, Cl2O, ClO2, ClO2F, ClO3OCl, Br2O, BrO2, BrO2F, ClO3OBr, IO2F, ClO3OI);
- (4)
- pseudohalides (FCN, FN3, FCNO, ClCN, ClN3, ClNCO, ClSCN, BrCN, BrN3, BrNCO, BrSCN, ICN, IN3, INCO, ISCN);
- (5)
- halogenated methanes and their derivatives (CF3OF, CF3SO2OF, CF3Cl, CCl2F2, CCl3F, CCl4, CF3OCl, CF3SO2OCl, CF3Br, CBr2F2, CBr3F, CBrCl3, CBrClF2, CBr4, CF3OBr, CF3SO2OBr, CF3I, CI2F2, CI3F, CIClF2, CI4);
- (6)
- halogenated ethylene, halogenated acetylene and their derivatives (C2F4, C2Cl4, C2F3Cl, C2Br4, C2F3Br, C2I4, C2F3I, C2(CN)3Cl, C2F2, C2Cl2);
- (7)
- phosgene and its derivatives (COF2, COClF, COCl2, COBrCl, COBr2, COBrF, COIF);
- (8)
- thionyl- and sulfurylhalides (SOF2, SO2ClF, SOCl2, SOBr2, SO2Cl2, SO2BrF);
- (9)
- sulfur halides and sulfur hypohalites (SF6, SF5OF, SF5Cl, SF5OCl, S2Cl2, SCl2, SF5Br, S2Br2, SBr2);
- (10)
- halogenated nitrogen-containing inorganic compounds (NF3, NOF, NO2F, NO2OF, NCl3, NF2Cl, NOCl, NO2Cl, NO2OCl, NBr3, NF2Br, NOBr, NO2Br, NO2OBr, NI3);
- (11)
- assorted organic compounds (tetrafluoro-1,4-benzoquinone, tetrachloro-1,4-benzoquinone, tetrabromo-1,4-benzoquinone, tetraiodo-1,4-benzoquinone, C6H5(C≡C)Cl, C6H5(C≡C)Br, C6H5(C≡C)I, CCl(CN)3, CBr(CN)3, N-chlorosuccinimide, N-bromosuccinimide, N-iodosuccinimide).
2. Results and Discussion
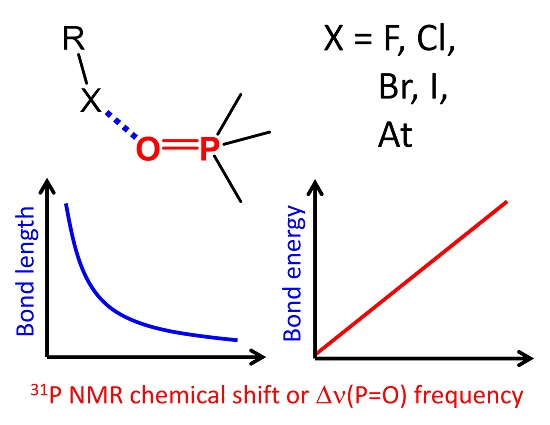
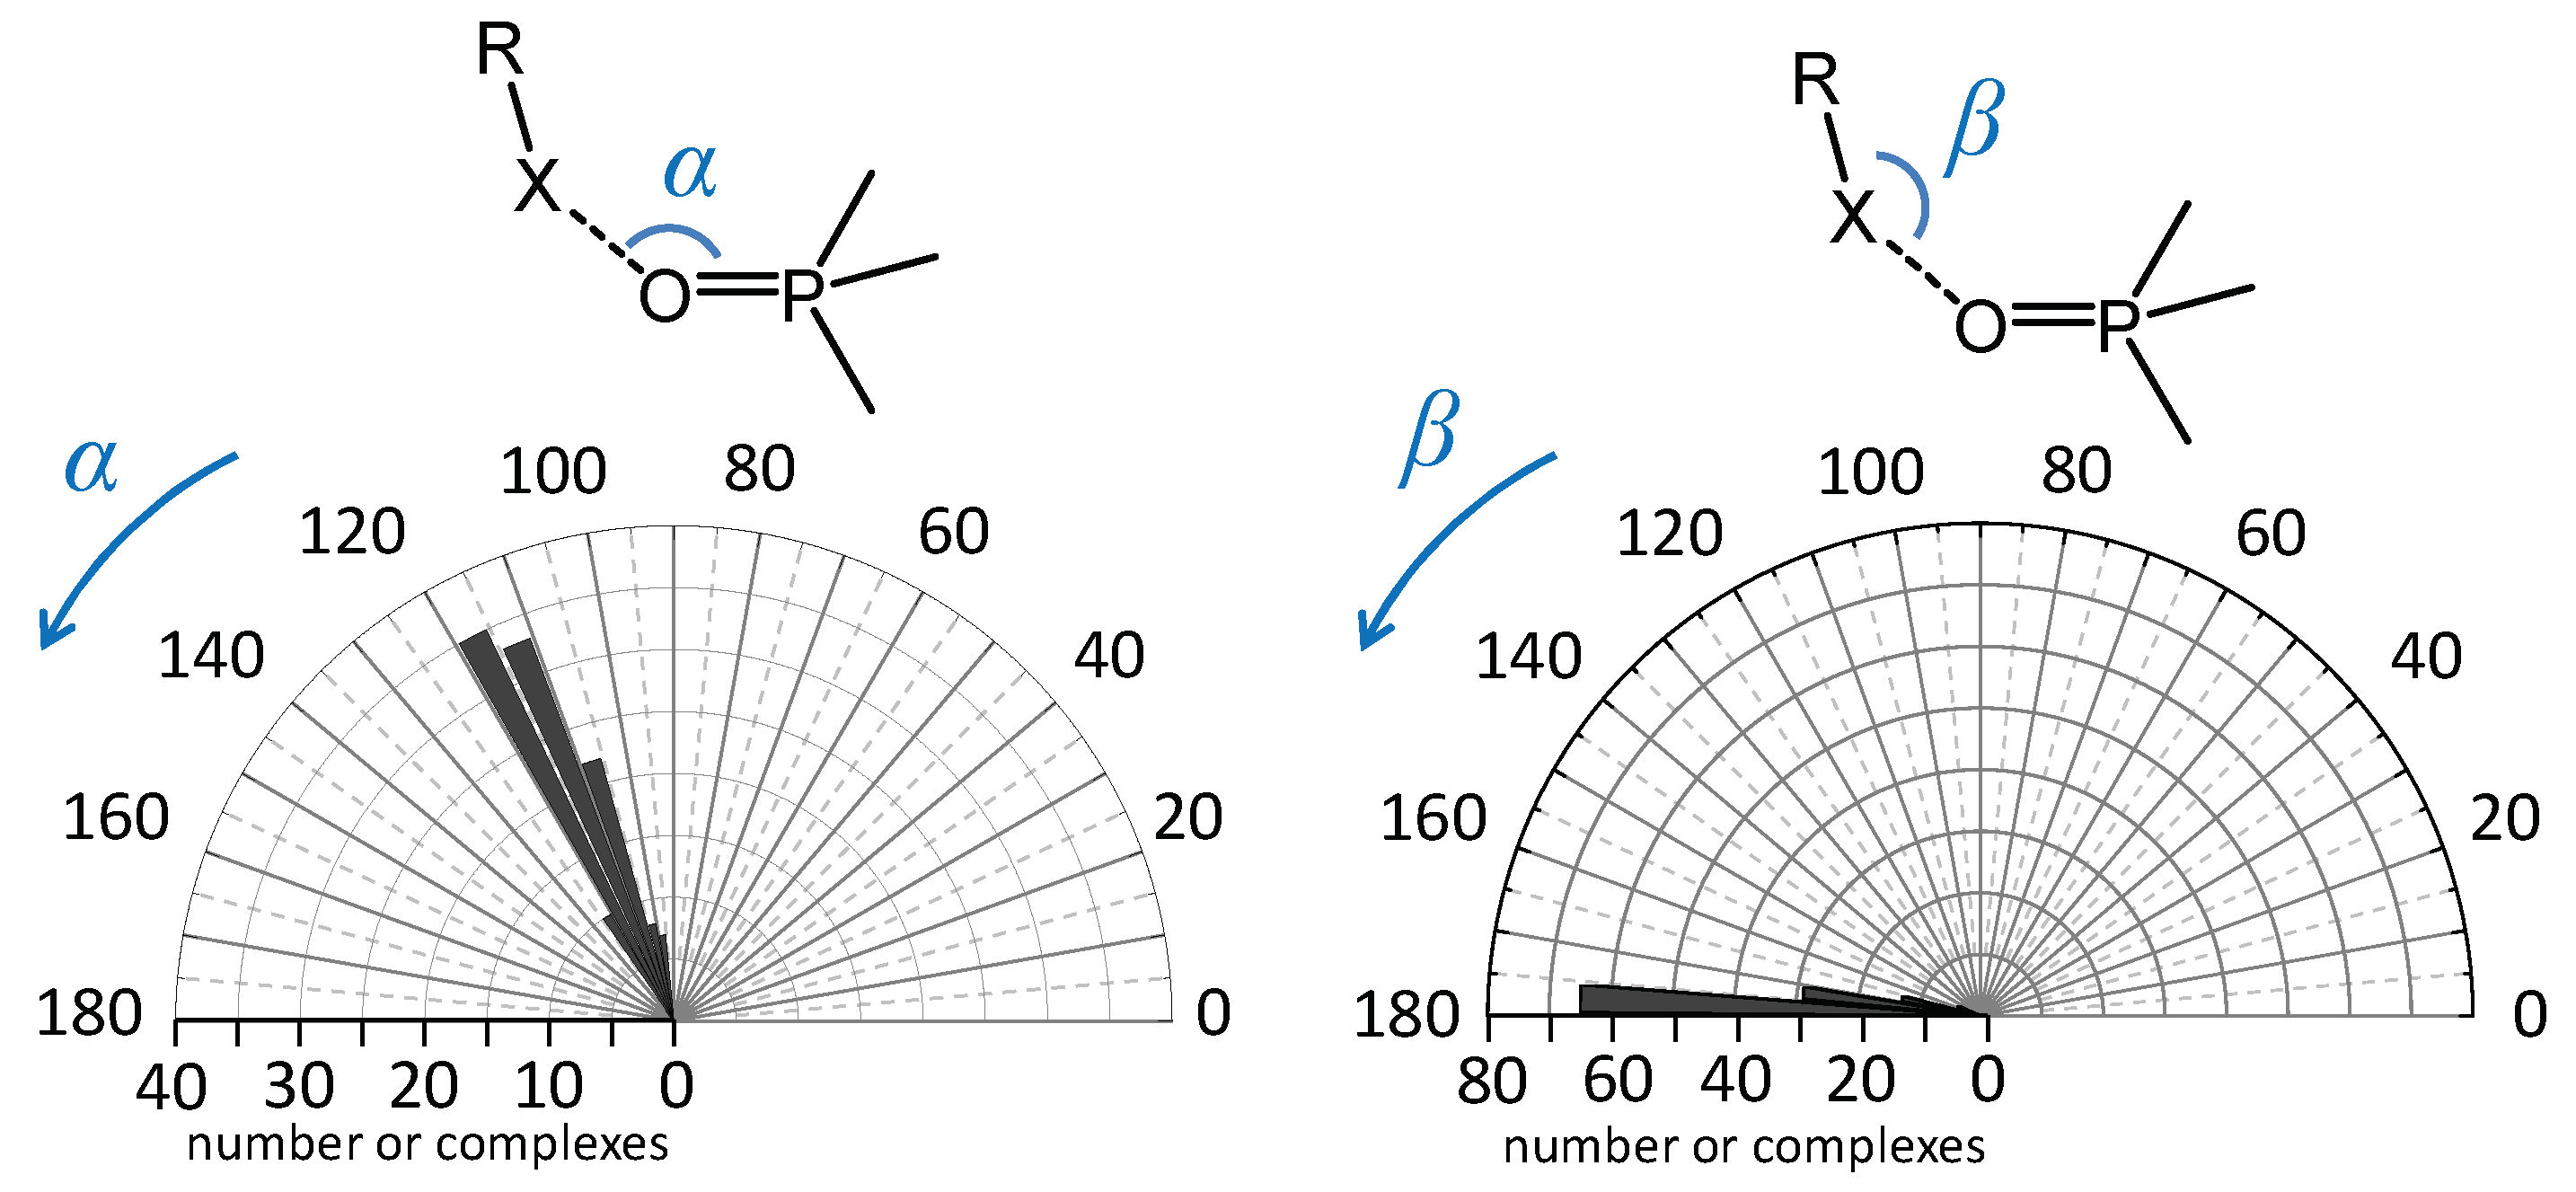
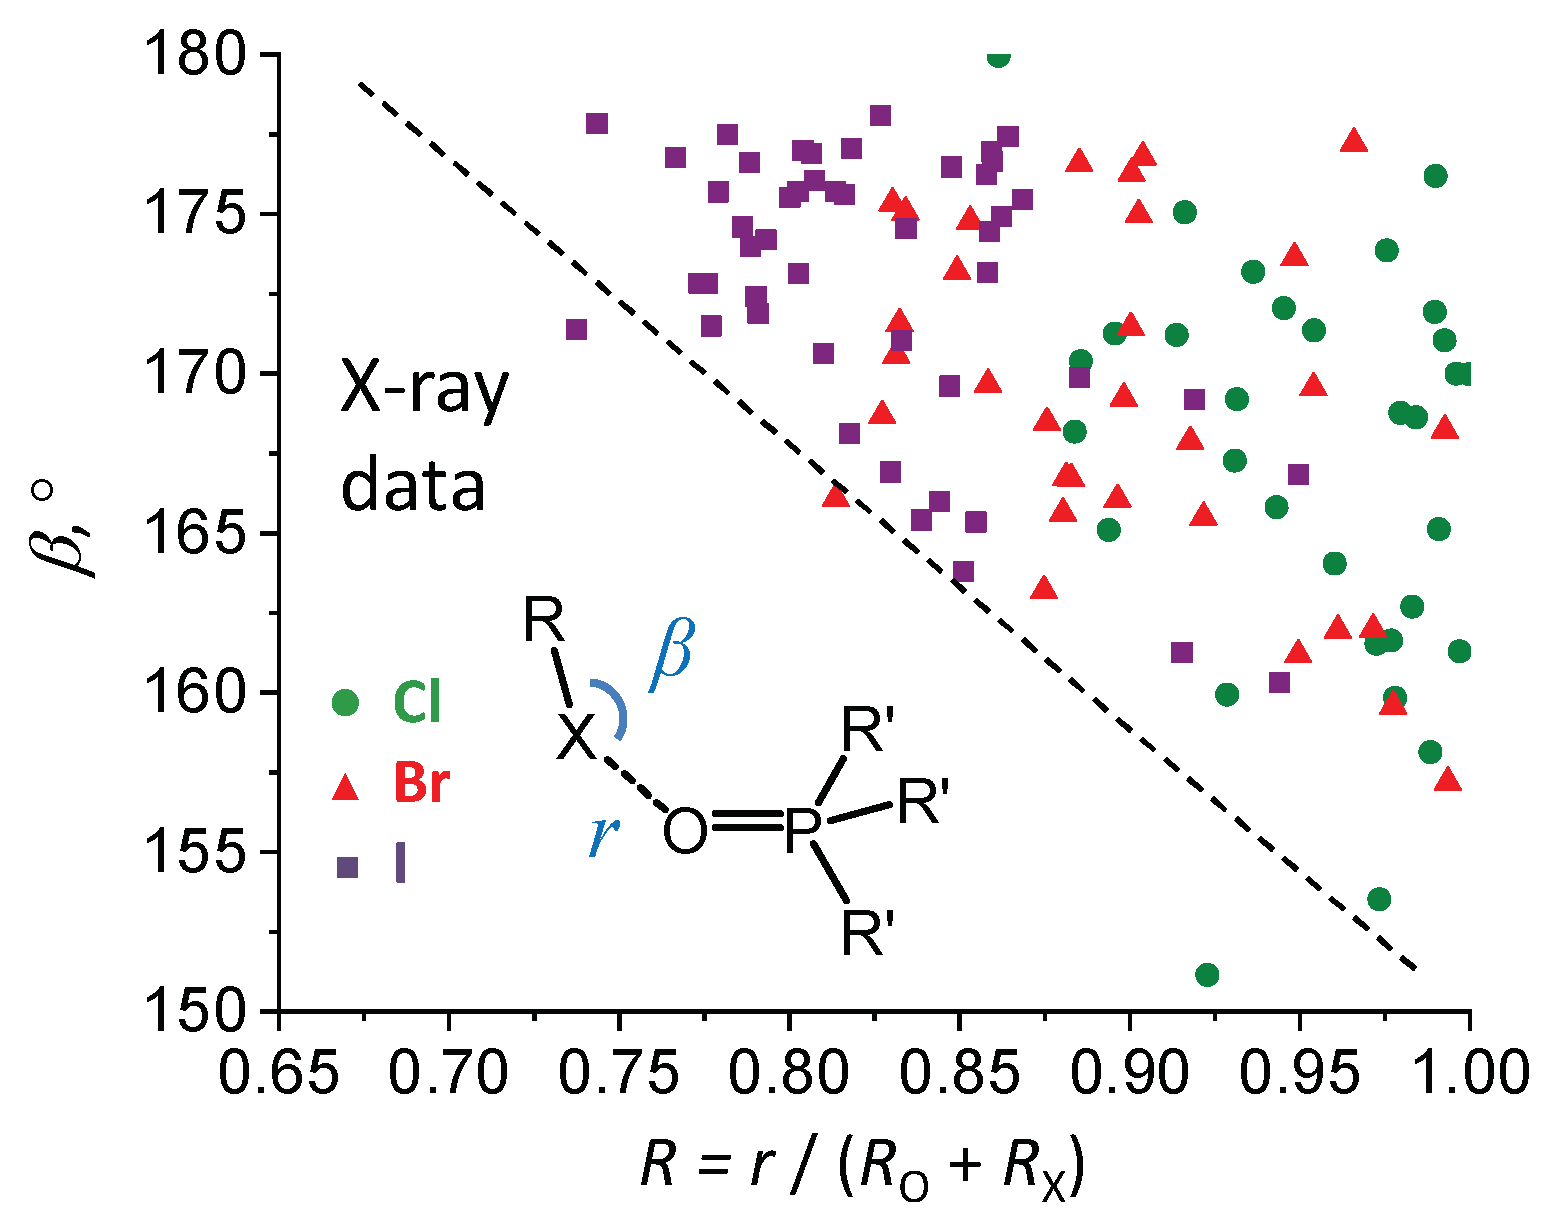
2.1. Angular Distribution
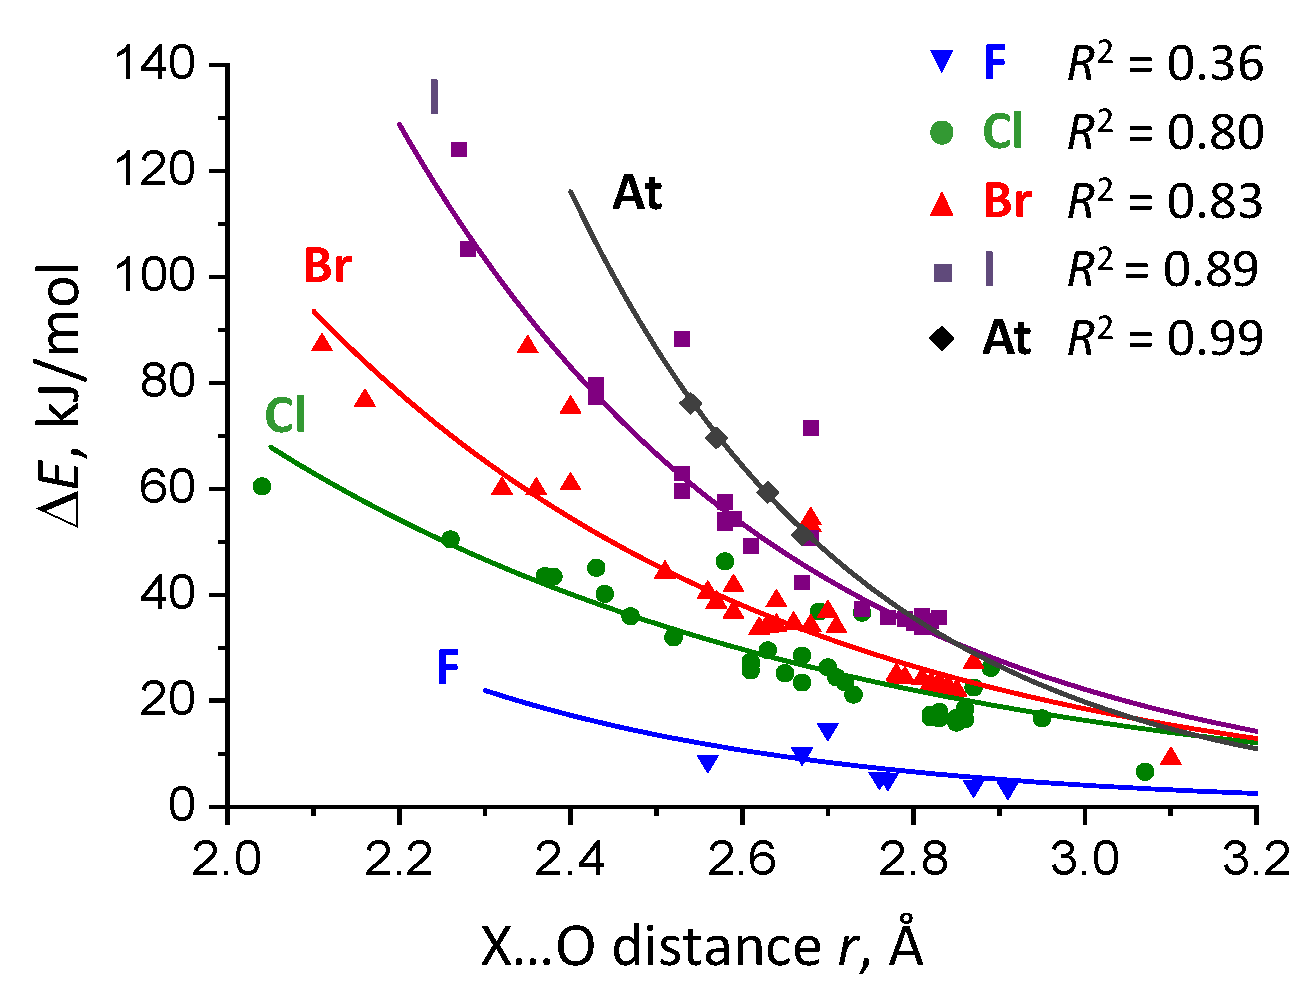
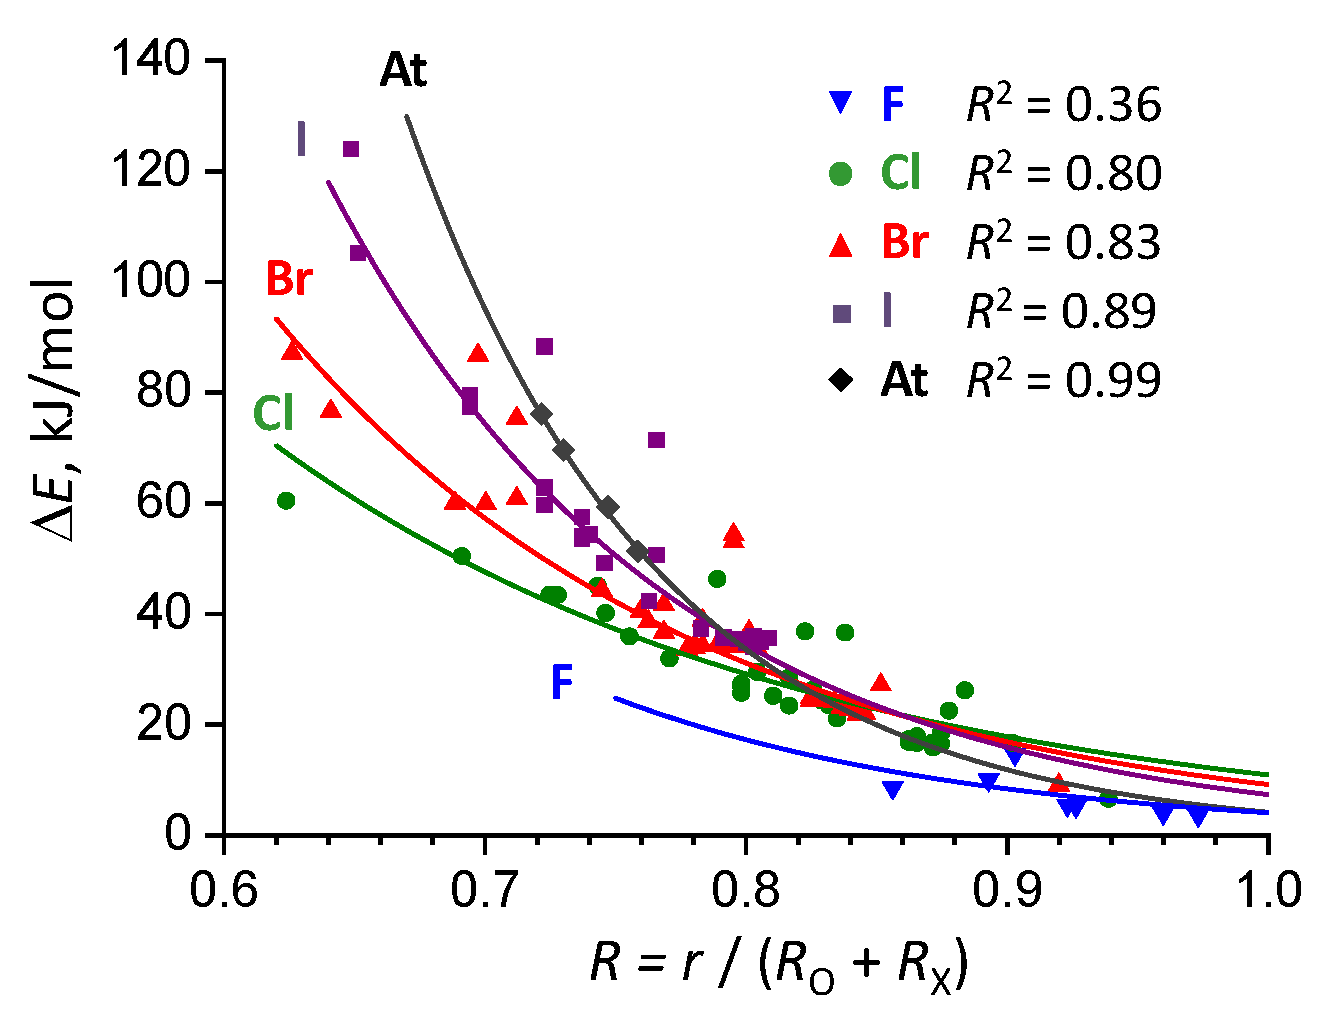
2.2. Complexation Energy Dependence On Intermolecular Distance
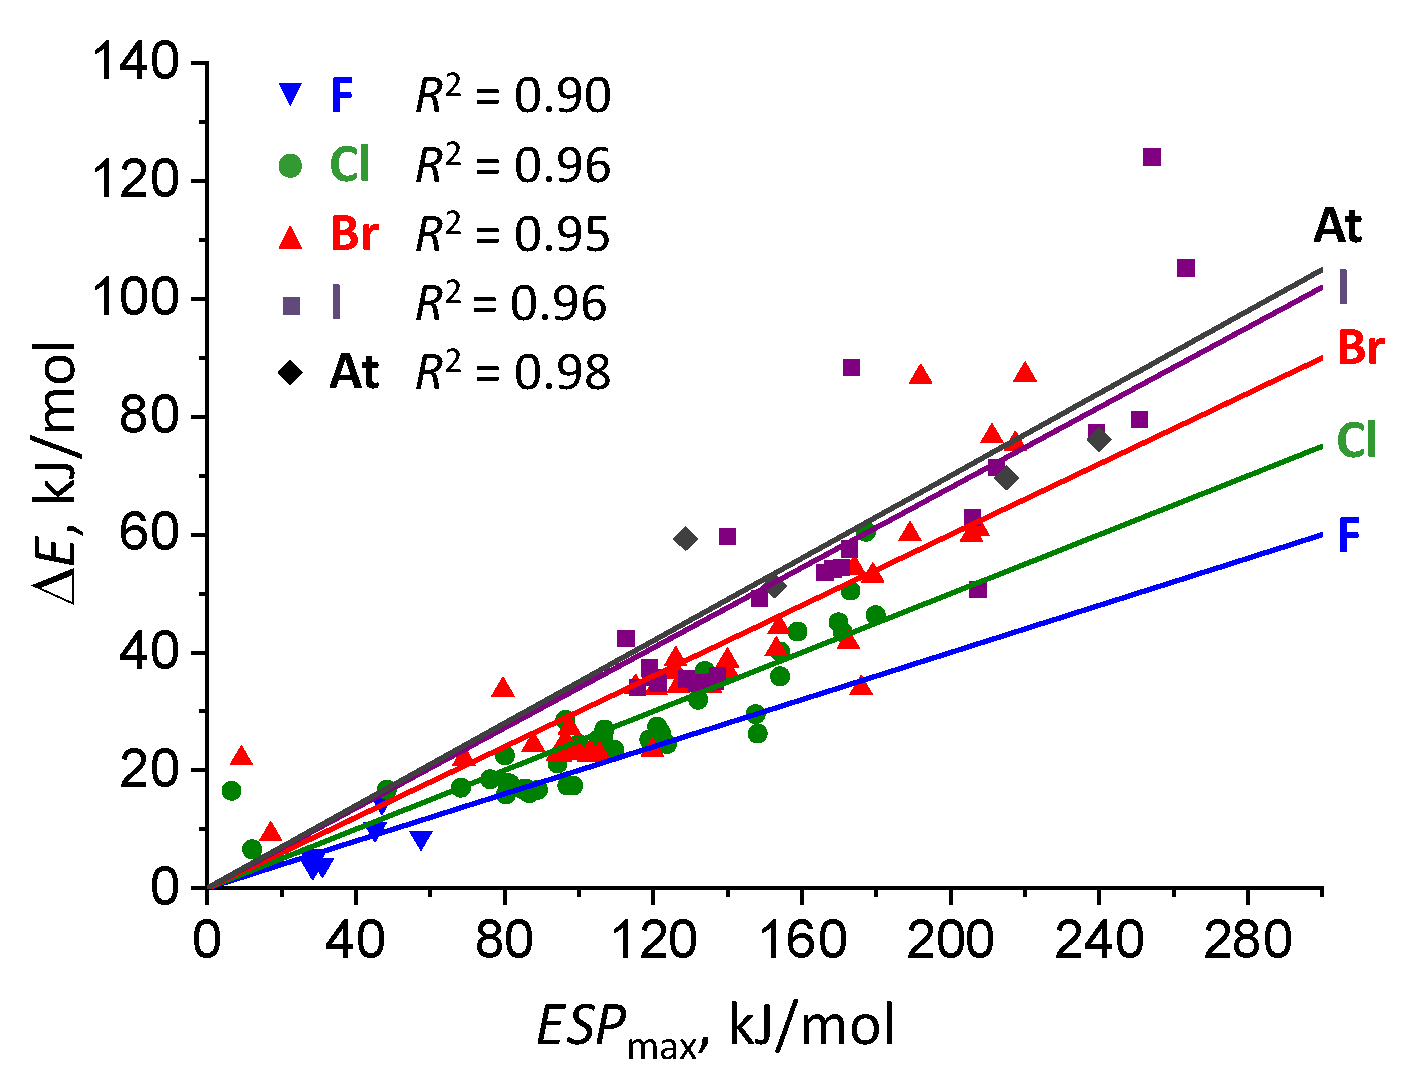
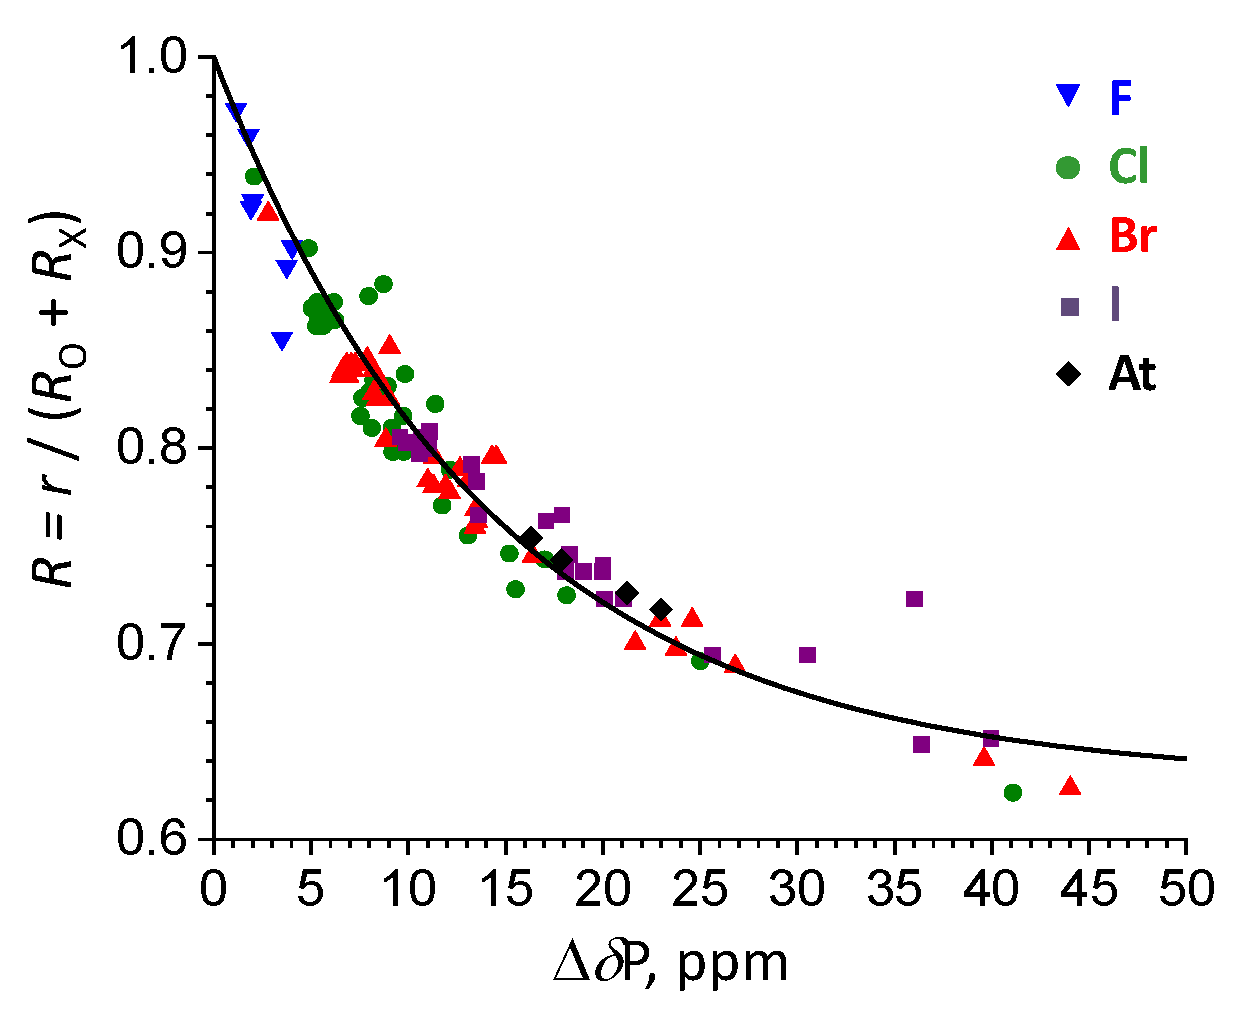
2.3. Complexation Energy Dependence On σ-hole Electrostatic Characteristics
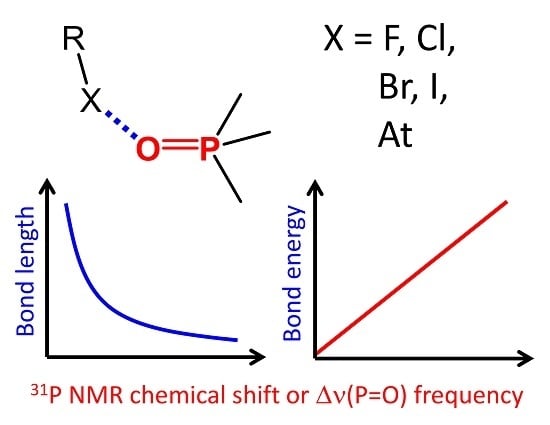
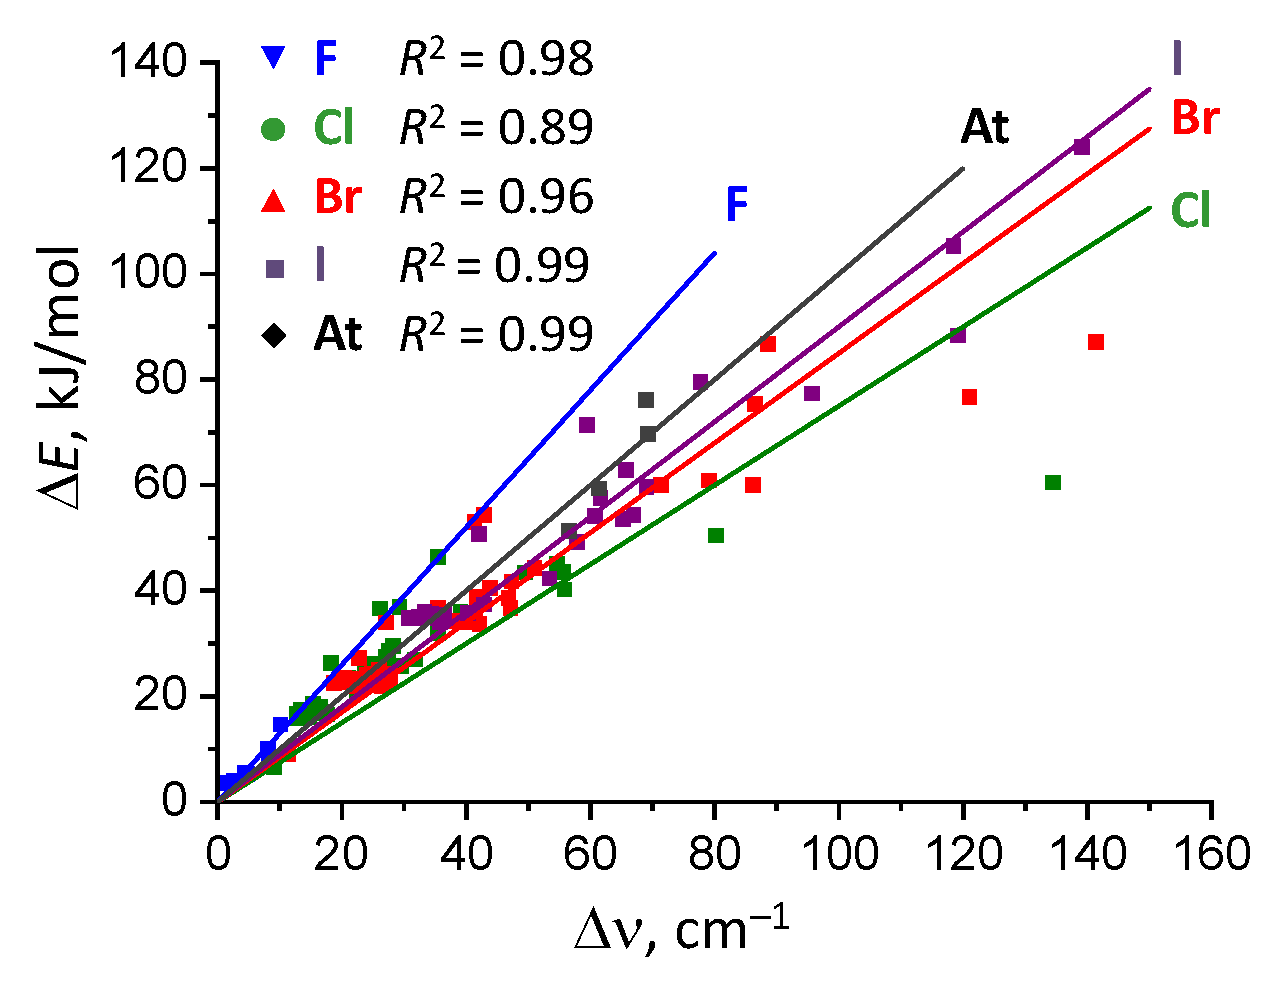
2.4. Correlation Between Complexation Energy And P=O Stretching Frequency
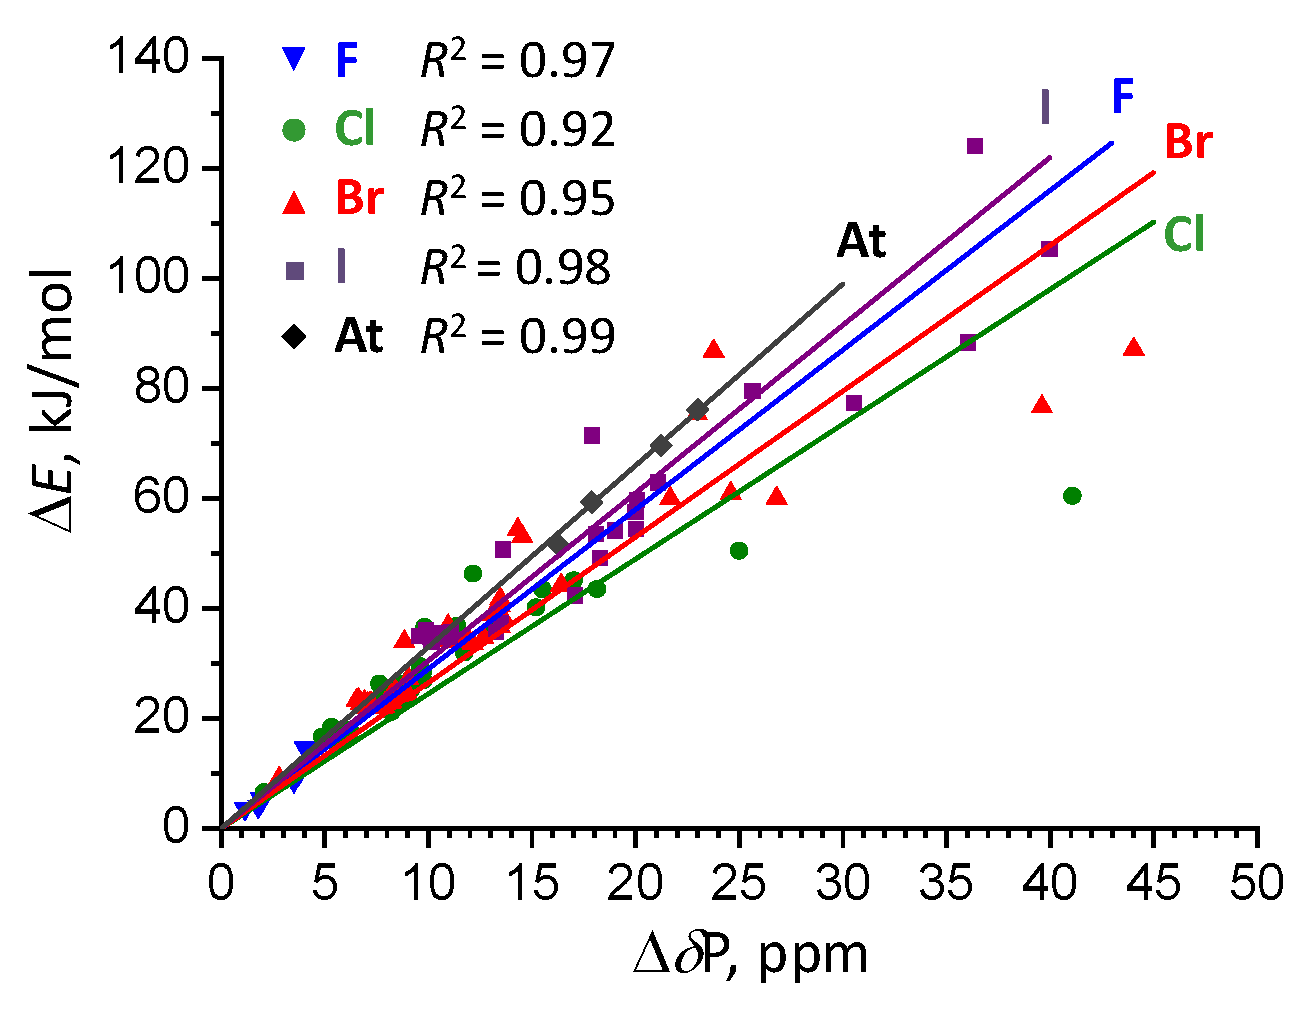
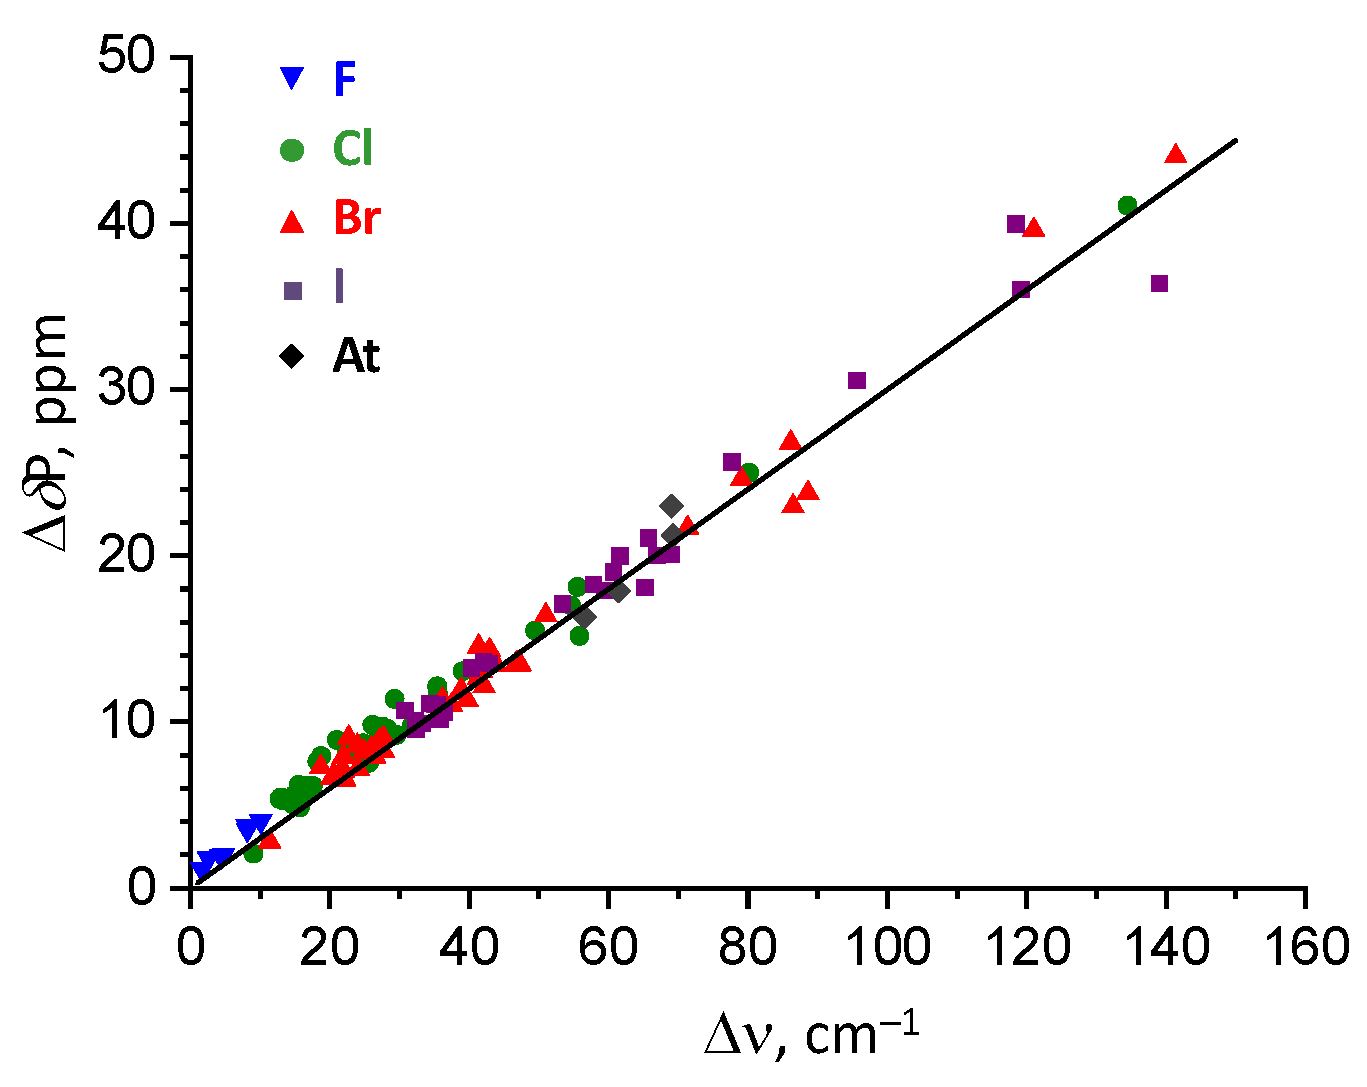
2.5. Correlation Between Complexation Energy And 31P NMR Chemical Shift
2.6. QTAIM Analysis of the Electronic Structure of Complexes
3. Materials and Methods
3.1. Computational Details
3.2. CCDC Data Search
4. Conclusions
Supplementary Materials
Author Contributions
Funding
Acknowledgments
Conflicts of Interest
References
- Cavallo, G.; Metrangolo, P.; Milani, R.; Pilati, T.; Priimagi, A.; Resnati, G.; Terraneo, G. The halogen dond. Chem. Rev. 2016, 116, 2478–2601. [Google Scholar] [CrossRef]
- Desiraju, G.R.; Ho, P.S.; Kloo, L.; Legon, A.C.; Marquardt, R.; Metrangolo, P.; Politzer, P.; Resnati, G.; Rissanen, K. Definition of the halogen bond (IUPAC Recommendations 2013). Pure Appl. Chem. 2013, 85, 1711–1713. [Google Scholar] [CrossRef]
- Metrangolo, P.; Murray, J.S.; Pilati, T.; Politzer, P.; Resnati, G.; Terraneo, G. The fluorine atom as a halogen bond donor, viz. a positive site. CrystEngComm. 2011, 13, 6593–6896. [Google Scholar] [CrossRef]
- Metrangolo, P.; Resnati, G. Halogen Bonding. Fundamentals and Applications; Springer: Berlin/Heidelberg, Germany, 2008. [Google Scholar]
- Murray, J.S.; Lane, P.; Politzer, P. Expansion of the sigma-hole concept. J. Mol. Model. 2009, 15, 723–729. [Google Scholar] [CrossRef]
- Politzer, P.; Murray, J.S.; Clark, T. Halogen bonding and other σ-hole interactions: A perspective. Phys. Chem. Chem. Phys. 2013, 15, 11178–11189. [Google Scholar] [CrossRef]
- Xu, K.; Ho, D.M.; Pascal, R.A. Azaaromatic chlorides: A prescription for crystal structures with extensive nitrogen-chlorine donor-acceptor interactions. J. Am. Chem. Soc. 1994, 116, 105–110. [Google Scholar] [CrossRef]
- Müller, M.; Albrecht, M.; Gossen, V.; Peters, T.; Hoffmann, A.; Raabe, G.; Valkonen, A.; Rissanen, K. Anion–π interactions in salts with polyhalide anions: Trapping of I42−. Chem. Eur. J. 2010, 16, 12446–12453. [Google Scholar]
- Itoh, T.; Nomura, S.; Nakasho, H.; Uno, T.; Kubo, M.; Tohnai, N.; Miyata, M. Halogen bond effect for single-crystal-to-single-crystal transformation: Topochemical polymerization of substituted quinodimethane. Macromolecules 2015, 48, 5450–5455. [Google Scholar] [CrossRef]
- Dong, M.; Miao, K.; Wu, J.; Miao, X.; Li, J.; Pang, P.; Deng, W. Halogen substituent effects on concentration-controlled self-assembly of fluorenone derivatives: Halogen bond versus hydrogen bond. J. Phys. Chem. C 2019, 123, 4349–4359. [Google Scholar] [CrossRef]
- Berski, S.; Ciunik, Z.; Drabent, K.; Latajka, Z.; Panek, J. Dominant role of C−Br···N halogen bond in molecular self-organization. Crystallographic and quantum-chemical study of Schiff-base-containing triazoles. J. Phys. Chem. B 2004, 108, 12327–12332. [Google Scholar] [CrossRef]
- Ghiassi, K.B.; Wescott, J.; Chen, S.Y.; Balch, A.L.; Olmstead, M.M. Waves of halogen–halogen bond formation in the cocrystallization of hexabromobenzene and 1,2,4,5-tetrabromobenzene with C70. Cryst. Growth Des. 2015, 15, 2480–2485. [Google Scholar] [CrossRef]
- Liu, R.; Wang, H.; Jin, W.J. Soft-cavity-type host–guest structure of cocrystals with good luminescence behavior assembled by halogen bond and other weak interactions. Cryst. Growth Des. 2017, 17, 3331–3337. [Google Scholar] [CrossRef]
- Vanderkooy, A.; Taylor, M.S. Solution-phase self-assembly of complementary halogen bonding polymers. J. Am. Chem. Soc. 2015, 137, 5080–5086. [Google Scholar] [CrossRef] [PubMed]
- Sarwar, M.G.; Dragisic, B.; Salsberg, L.J.; Gouliaras, C.; Taylor, M.S. Thermodynamics of halogen bonding in solution: Substituent, structural, and solvent effects. J. Am. Chem. Soc. 2010, 132, 1646–1653. [Google Scholar] [CrossRef]
- Libri, S.; Jasim, N.A.; Perutz, R.N.; Brammer, L. Metal fluorides form strong hydrogen bonds and halogen bonds: Measuring interaction enthalpies and entropies in solution. J. Am. Chem. Soc. 2008, 130, 7842–7844. [Google Scholar] [CrossRef]
- Benesi, H.A.; Hildebrand, J.H. A spectrophotometric investigation of the interaction of iodine with aromatic hydrocarbons. J. Am. Chem. Soc. 1949, 71, 2703–2707. [Google Scholar] [CrossRef]
- Hassel, O.; Hvoslef, J. The structure of bromine 1,4-dioxanate. Acta Chem. Scand. 1954, 8, 873. [Google Scholar] [CrossRef]
- Pearcy, A.C.; Mason, K.A.; El-Shall, M.S. Ionic hydrogen and halogen bonding in the gas phase association of acetonitrile and acetone with halogenated benzene cations. J. Phys. Chem. A 2019, 123, 1363–1371. [Google Scholar] [CrossRef]
- Gillis, E.A.L.; Demireva, M.; Sarwar, M.G.; Chudzinski, M.G.; Taylor, M.S.; Williams, E.R.; Fridgen, T.D. Structure and energetics of gas phase halogen-bonding in mono-, bi-, and tri-dentate anion receptors as studied by BIRD. Phys. Chem. Chem. Phys. 2013, 15, 7638–7647. [Google Scholar] [CrossRef]
- Wegeberg, C.; Donald, W.A.; McKenzie, C.J. Noncovalent halogen bonding as a mechanism for gas-phase clustering. J. Am. Soc. Mass Spectr. 2017, 28, 2209–2216. [Google Scholar] [CrossRef]
- Danelius, E.; Andersson, H.; Jarvoll, P.; Lood, K.; Gräfenstein, J.; Erdélyi, M. Halogen bonding: A powerful tool for modulation of peptide conformation. Biochemistry 2017, 56, 3265–3272. [Google Scholar] [CrossRef] [PubMed]
- Fanfrlík, J.; Kolář, M.; Kamlar, M.; Hurný, D.; Ruiz, F.X.; Cousido-Siah, A.; Mitschler, A.; Řezáč, J.; Munusamy, E.; Lepšík, M.; et al. Modulation of aldose reductase inhibition by halogen bond tuning. ACS Chem. Biol. 2013, 8, 2484–2492. [Google Scholar]
- Christopherson, J.-C.; Topić, F.; Barrett, J.C.; Friščić, T. Halogen-bonded cocrystals as optical materials: Next-generation control over light–matter interactions. Cryst. Growth Des. 2018, 18, 1245–1259. [Google Scholar] [CrossRef]
- Priimagi, A.; Cavallo, G.; Metrangolo, P.; Resnati, G. The halogen bond in the design of functional supramolecular materials: Recent advances. Acc. Chem. Res. 2013, 46, 2686–2695. [Google Scholar] [CrossRef] [PubMed]
- Chudzinski, M.G.; McClary, C.A.; Taylor, M.S. Anion receptors composed of hydrogen- and halogen-bond donor groups: Modulating selectivity with combinations of distinct noncovalent interactions. J. Am. Chem. Soc. 2011, 133, 10559–10567. [Google Scholar] [CrossRef] [PubMed]
- Zheng, Q.-N.; Liu, X.-H.; Chen, T.; Yan, H.-J.; Cook, T.; Wang, D.; Stang, P.J.; Wan, L.-J. Formation of halogen bond-based 2D supramolecular assemblies by electric manipulation. J. Am. Chem. Soc. 2015, 137, 6128–6131. [Google Scholar] [CrossRef]
- Liao, W.-Q.; Tang, Y.-Y.; Li, P.-F.; You, Y.-M.; Xiong, R.-G. Competitive halogen bond in the molecular ferroelectric with large piezoelectric response. J. Am. Chem. Soc. 2018, 140, 3975–3980. [Google Scholar] [CrossRef]
- Zhang, L.; Liu, X.; Su, J.; Li, J. First-principles study of molecular adsorption on Lead iodide perovskite surface: A case study of halogen bond passivation for solar cell application. J. Phys. Chem. C 2016, 120, 23536–23541. [Google Scholar] [CrossRef]
- Lieffrig, J.; Jeannin, O.; Guizouarn, T.; Auban-Senzier, P.; Fourmigué, M. Competition between the C–H···N hydrogen bond and C–I···N halogen bond in TCNQFn (n = 0, 2, 4) salts with variable charge transfer. Cryst. Growth Des. 2012, 12, 4248–4257. [Google Scholar] [CrossRef]
- Vanderkooy, A.; Pfefferkorn, P.; Taylor, M.S. Self-assembly of polymer nanostructures through halogen bonding interactions of an iodoperfluoroarene-functionalized polystyrene derivative. Macromolecules 2017, 50, 3807–3817. [Google Scholar] [CrossRef]
- Cariati, E.; Cavallo, G.; Forni, A.; Leem, G.; Metrangolo, P.; Meyer, F.; Pilati, T.; Resnati, G.; Righetto, S.; Terraneo, G.; et al. Self-complementary nonlinear optical-phores targeted to halogen bond-driven self-assembly of electro-optic materials. Cryst. Growth Des. 2011, 11, 5642–5648. [Google Scholar] [CrossRef]
- Takeda, Y.; Hisakuni, D.; Lin, C.-H.; Minakata, S. 2-Halogenoimidazolium salt catalyzed aza-Diels–Alder reaction through halogen-bond formation. Org. Lett. 2015, 17, 318–321. [Google Scholar] [CrossRef] [PubMed]
- Jungbauer, S.H.; Huber, S.M. Cationic multidentate halogen-bond donors in halide abstraction organocatalysis: Catalyst optimization by preorganization. J. Am. Chem. Soc. 2015, 137, 12110–12120. [Google Scholar] [CrossRef] [PubMed]
- Kazi, I.; Guha, S.; Sekar, G. CBr4 as a halogen bond donor catalyst for the selective activation of benzaldehydes to synthesize α,β-unsaturated ketones. Org. Lett. 2017, 19, 1244–1247. [Google Scholar] [CrossRef] [PubMed]
- Kaasik, M.; Metsala, A.; Kaabel, S.; Kriis, K.; Järving, I.; Kanger, T. Halo-1,2,3-triazolium salts as halogen bond donors for the activation of imines in dihydropyridinone synthesis. J. Org. Chem. 2019, 84, 4294–4303. [Google Scholar] [CrossRef]
- Lefèvre, G.; Franc, G.; Adamo, C.; Jutand, A.; Ciofini, I. Influence of the formation of the halogen bond ArX...N on the mechanism of diketonate ligated copper-catalyzed amination of aromatic halides. Organometallics 2012, 31, 914–920. [Google Scholar] [CrossRef]
- Combe, S.H.; Hosseini, A.; Song, L.; Hausmann, H.; Schreiner, P.R. Catalytic halogen bond activation in the benzylic C–H bond iodination with iodohydantoins. Org. Lett. 2017, 19, 6156–6159. [Google Scholar] [CrossRef]
- Xu, Z.; Yang, Z.; Liu, Y.; Lu, Y.; Chen, K.; Zhu, W. Halogen bond: Its role beyond drug–target binding affinity for drug discovery and development. J. Chem. Inf. Model. 2014, 54, 69–78. [Google Scholar] [CrossRef]
- Baldrighi, M.; Cavallo, G.; Chierotti, M.R.; Gobetto, R.; Metrangolo, P.; Pilati, T.; Resnati, G.; Terraneo, G. Halogen bonding and pharmaceutical cocrystals: The case of a widely used preservative. Mol. Pharm. 2013, 10, 1760–1772. [Google Scholar] [CrossRef]
- Wang, W.; Zhang, Y.; Ji, B. On the difference of the properties between the blue-shifting halogen bond and the blue-shifting hydrogen bond. J. Phys. Chem. A 2010, 114, 7257–7260. [Google Scholar] [CrossRef]
- Roper, L.C.; Präsang, C.; Kozhevnikov, V.N.; Whitwood, A.C.; Karadakov, P.B.; Bruce, D.W. Experimental and theoretical study of halogen-bonded complexes of DMAP with di- and triiodofluorobenzenes. A complex with a very short N···I halogen bond. Cryst. Growth Des. 2010, 10, 3710–3720. [Google Scholar] [CrossRef]
- Lu, Y.; Li, H.; Zhu, X.; Zhu, W.; Liu, H. How does halogen bonding behave in solution? A theoretical study using implicit solvation model. J. Phys. Chem. A 2011, 115, 4467–4475. [Google Scholar] [CrossRef] [PubMed]
- Lindblad, S.; Mehmeti, K.; Veiga, A.X.; Nekoueishahraki, B.; Gräfenstein, J.; Erdélyi, M. Halogen bond asymmetry in solution. J. Am. Chem. Soc. 2018, 140, 13503–13513. [Google Scholar] [CrossRef] [PubMed]
- Wang, W.; Wong, N.-B.; Zheng, W.; Tian, A. Theoretical study on the blueshifting halogen bond. J. Phys. Chem. A 2004, 108, 1799–1805. [Google Scholar] [CrossRef]
- Wang, C.; Danovich, D.; Mo, Y.; Shaik, S. On the nature of the halogen bond. J. Chem. Theory Comput. 2014, 10, 3726–3737. [Google Scholar] [CrossRef] [PubMed]
- Wang, L.; Gao, J.; Bi, F.; Song, B.; Liu, C. Toward the development of the potential with angular distortion for halogen bond: A comparison of potential energy surfaces between halogen bond and hydrogen bond. J. Phys. Chem. A 2014, 118, 9140–9147. [Google Scholar] [CrossRef]
- Cuypers, R.; Sudhçlter, E.J.R.; Zuilhof, H. Hydrogen bonding in phosphine oxide/phosphate–phenol complexes. Chem. Phys. Chem. 2010, 11, 2230–2240. [Google Scholar] [CrossRef]
- Kolling, O.W. Triethylphosphine oxide as a probe of weak hydrogen bond donor behavior. Trans. Kansas Acad. Sci. 1984, 87, 115–118. [Google Scholar] [CrossRef]
- Hilliard, C.R.; Kharel, S.; Cluff, K.J.; Bhuvanesh, N.; Gladysz, J.A.; Blümel, J. Structures and unexpected dynamic properties of phosphine oxides adsorbed on silica surfaces. Chem. Eur. J. 2014, 20, 17292–17295. [Google Scholar] [CrossRef]
- Tupikina, E.Y.; Bodensteiner, M.; Tolstoy, P.M.; Denisov, G.S.; Shenderovich, I.G. P=O Moiety as an ambidextrous hydrogen bond acceptor. J. Phys. Chem. C 2018, 122, 1711–1720. [Google Scholar] [CrossRef]
- Oh, S.Y.; Nickels, C.W.; Garcia, F.; Jones, W.; Fris, T. Switching between halogen- and hydrogen-bonding in stoichiometric variations of a cocrystal of a phosphine oxide. Cryst. Eng. Comm. 2012, 14, 6110–6114. [Google Scholar] [CrossRef]
- Maugeri, L.; Lébl, T.; Cordes, D.B.; Slawin, A.M.Z.; Philp, D. Cooperative binding in a phosphine oxide-based halogen bonded dimer drives supramolecular oligomerization. J. Org. Chem. 2017, 82, 1986–1995. [Google Scholar] [CrossRef]
- Shipov, A.E.; Makarov, M.V.; Petrovskii, P.V.; Rybalkina, E.Y.; Nelyubina, Y.V.; Odinets, I.L. 3,5-Bis(arylidene)piperid-4-ones containing 1,3,2-oxazaphosphorinane moieties: Synthesis and antitumor activity. Heteroat. Chem. 2013, 24, 191–199. [Google Scholar] [CrossRef]
- Tarahhomi, A.; Pourayoubi, M.; Golen, J.A.; Zargaran, P.; Elahi, B.; Rheingold, A.L.; Leyva Ramírez, M.A.; Mancilla Percino, T. Hirshfeld surface analysis of new phosphoramidates. Acta Cryst. 2013, B69, 260–270. [Google Scholar] [CrossRef]
- Kongprakaiwoot, N.; Bultman, M.S.; Luck, R.L.; Urnezius, E. Synthesis and structural characterizations of para-bis(dialkyl/diarylphosphino)phenylenes built around tetrahalogenated benzene cores. Inorg. Chim. Acta 2005, 358, 3423–3429. [Google Scholar] [CrossRef]
- Nayak, S.K.; Terraneo, G.; Forni, A.; Metrangolo, P.; Resnati, G. C–Br⋯O supramolecular synthon: In situ cryocrystallography of low melting halogen-bonded complexes. Cryst. Eng. Comm. 2012, 14, 4259–4261. [Google Scholar] [CrossRef]
- Nicolas, E.; Cheisson, T.; de Jong, G.B.; Tazelaara, C.J.G.; Slootwega, J.C. A new synthetic route to the electron-deficient ligand tris-(3,4,5-tri bromo pyrazol-1-yl)phosphine oxide. Acta Cryst. 2016, C72, 846–849. [Google Scholar]
- Matczak-Jon, E.; Slepokura, K.; Kafarskia, P. [(5-bromopyridinium-2-ylamino)(phosphono)methyl]phosphonate. Acta Cryst. 2006, C62, 132–135. [Google Scholar] [CrossRef] [PubMed]
- Xu, Y.; Champion, L.; Gabidullin, B.; Bryce, D.L. A Kinetic study of mechanochemical halogen bond formation by in-situ 31P solid-state NMR spectroscopy. Chem. Comm. 2017, 53, 9930–9933. [Google Scholar] [CrossRef]
- Griffiths, D.V.; Harris, J.E.; Miller, R.J. Dimethyl 2-iodobenzoylphosphonate, an unusual example of a crystalline α-ketophosphonate. Acta Cryst. 1997, C53, 1462–1464. [Google Scholar] [CrossRef]
- Mayer, U.; Gutmann, V.; Gerger, W. The acceptor number – a quantitative empirical parameter for the electrophilic properties of solvents. Monat. fur Chemie 1975, 106, 1235–1257. [Google Scholar] [CrossRef]
- Pahl, J.; Brand, S.; Elsen, H.; Harder, S. Highly Lewis acidic cationic alkaline earth metal complexes. Chem. Commun. 2018, 54, 8685–8688. [Google Scholar] [CrossRef]
- Beckett, M.A.; Brassington, D.S.; Coles, S.J.; Hursthouse, M.B. Lewis acidity of tris(pentafluorophenyl)borane: Crystal and molecular structure of B(C6F5)3·OPEt3. Inorg. Chem. Commun. 2000, 3, 530–533. [Google Scholar] [CrossRef]
- Hamilton, P.A.; Murrells, T.P. Kinetics and mechanism of the reactions of PH3 with O(3P) and N(4S) atoms. J. Chem. Soc. Faraday Trans. 1985, 2, 1531–1541. [Google Scholar] [CrossRef]
- Zhao, Y.; Truhlar, D.G. The M06 suite of density functionals for main group thermochemistry, thermochemical kinetics, noncovalent interactions, excited states, and transition elements: Two new functionals and systematic testing of four M06-class functionals and 12 other functionals. Theor. Chem. Acc. 2000, 120, 215–241. [Google Scholar]
- Bader, R.F.W. A quantum theory of molecular structure and its applications. Chem. Rev. 1991, 91, 893–928. [Google Scholar] [CrossRef]
- Chen, Z.; Wang, G.; Xu, Z.; Wang, J.; Yu, Y.; Cai, T.; Shao, Q.; Shi, J.; Zhu, W. How do distance and solvent affect halogen bonding involving negatively charged donors? J. Phys. Chem. B 2016, 120, 8784–8793. [Google Scholar] [CrossRef] [PubMed]
- Bondi, A. Van der Waals volumes and radii. J. Phys. Chem. 1964, 68, 441–451. [Google Scholar] [CrossRef]
- Mantina, M.; Chamberlin, A.C.; Valero, R.; Cramer, C.J.; Truhlar, D.G. Consistent van der Waals radii for the whole main group. J. Phys. Chem. 2009, 113, 5806–5812. [Google Scholar] [CrossRef]
- Latypov, S.K.; Polyancev, F.M.; Yakhvarov, D.G.; Sinyashin, O.G. Quantum chemical calculations of 31P NMR chemical shifts: Scopes and limitations. Phys. Chem. Chem. Phys. 2015, 17, 6976–6987. [Google Scholar] [CrossRef]
- Alkorta, I.; Elguero, J. Is it possible to use the 31P chemical shifts of phosphines to measure hydrogen bond acidities (HBA)? A comparative study with the use of the 15N chemical shifts of amines for measuring HBA. J. Phys. Org. Chem. 2017, 30, e3690. [Google Scholar] [CrossRef]
- Mulloyarova, V.V.; Giba, I.S.; Kostin, M.A.; Denisov, G.S.; Shenderovich, I.G.; Tolstoy, P.M. Cyclic trimers of phosphinic acids in polar aprotic solvent: Symmetry, chirality and H/D isotope effects on NMR chemical shifts. Phys. Chem. Chem. Phys. 2018, 20, 4901–4910. [Google Scholar] [CrossRef] [PubMed]
- Mulloyarova, V.V.; Giba, I.S.; Denisov, G.S.; Tolstoy, P.M. Conformational mobility and proton transfer in hydrogen-bonded dimers and trimers of phosphinic and phosphoric acids. J. Phys. Chem A 2019, 123, 6761–6771. [Google Scholar] [CrossRef] [PubMed]
- Giba, I.S.; Mulloyarova, V.V.; Denisov, G.S.; Tolstoy, P.M. Influence of hydrogen bonds in 1:1 complexes of phosphinic acids with substituted pyridines on 1H and 31P NMR chemical shifts. J. Phys. Chem. A 2019, 123, 2252–2260. [Google Scholar] [CrossRef] [PubMed]
- Bartashevich, E.V.; Tsirelson, V.G. Interplay between non-covalent interactions in complexes and crystals with halogen bonds. Russ. Chem. Rev. 2014, 83, 1181–1203. [Google Scholar] [CrossRef]
- van Duijneveldt, F.B.; van Duijneveldt-van de Rijdt, J.G.C.M.; van Lenthe, J.H. State of the art in counterpoise theory. Chem. Rev. 1994, 94, 1873–1885. [Google Scholar] [CrossRef]
- Frisch, M.J.; Trucks, G.W.; Schlegel, H.B.; Scuseria, G.E.; Robb, M.A.; Cheeseman, J.R.; Scalmani, G.; Barone, V.; Petersson, G.A.; Nakatsuji, H.; et al. Gaussian 16, Revision C.01; Gaussian, Inc.: Wallingford, CT, USA, 2016. [Google Scholar]
- Available online: https://gaussian.com/gaussview6/ (accessed on 27 February 2020).
- Available online: http://www.chemcraftprog.com (accessed on 27 February 2020).
- Zimin, D.P.; Dar’in, D.V.; Eliseeva, A.A.; Novikov, A.S.; Rassadin, V.A.; Kukushkin, V.Y. Gold-catalyzed functionalization of semicarbazides with terminal alkynes to achieve substituted semicarbazones. Eur. J. Org. Chem. 2019, 2019, 6094–6100. [Google Scholar] [CrossRef]
- Ivanov, D.M.; Kinzhalov, M.A.; Novikov, A.S.; Ananyev, I.V.; Romanova, A.A.; Boyarskiy, V.P.; Haukka, M.; Kukushkin, V.Y. H2C(X)–X···X– (X = Cl, Br) halogen bonding of dihalomethanes. Cryst. Growth Des. 2017, 17, 1353–1362. [Google Scholar] [CrossRef]
- Rozhkov, A.V.; Krykova, M.A.; Ivanov, D.M.; Novikov, A.S.; Sinelshchikova, A.A.; Volostnykh, M.V.; Konovalov, M.A.; Grigoriev, M.S.; Gorbunova, Y.G.; Kukushkin, V.Y. Reverse arene sandwich structures based upon π-Hole⋅⋅⋅[MII] (d8 M=Pt, Pd) interactions, where positively charged metal centers play the role of a nucleophile. Angew. Chem. Int. Ed. 2019, 58, 4164–4168. [Google Scholar] [CrossRef]
- Burianova, V.K.; Bolotin, D.S.; Mikherdov, A.S.; Novikov, A.S.; Mokolokolo, P.P.; Roodt, A.; Boyarskiy, V.P.; Dar’in, D.; Krasavin, M.; Suslonov, V.V.; et al. Mechanism of generation of closo-decaborato amidrazones. Intramolecular non-covalent B–H⋯π(Ph) interaction determines stabilization of the configuration around the amidrazone C=N bond. New J. Chem. 2018, 42, 8693–8703. [Google Scholar] [CrossRef]
- Kashina, M.V.; Kinzhalov, M.A.; Smirnov, A.S.; Ivanov, D.M.; Novikov, A.S.; Kukushkin, V.Y. Dihalomethanes as bent bifunctional XB/XB-donating building blocks for construction of metal-involving halogen bonded hexagons. Chem. Asian J. 2019, 14, 3915–3920. [Google Scholar] [CrossRef] [PubMed]
- Kozuch, S.; Martin, J.M.L. Halogen bonds: Benchmarks and theoretical analysis. J. Chem. Theor. Comput. 2013, 9, 1918–1931. [Google Scholar] [CrossRef] [PubMed]
- Kuchle, W.; Dolg, M.; Stoll, H.; Preuss, H. Energy-adjusted pseudopotentials for the actinides. Parameter sets and test calculations for thorium and thorium monoxide. J. Chem. Phys. 1994, 100, 7535–7542. [Google Scholar] [CrossRef]
- Lu, T.; Chen, F. Multiwfn: A multifunctional wavefunction analyzer. J. Comput. Chem. 2012, 33, 580–592. [Google Scholar] [CrossRef] [PubMed]
- Available online: https://www.originlab.com/ (accessed on 27 February 2020).
Sample Availability: Calculation output files for all studied complexes are available from the authors. |


| Donor Atom | Equations (1) and (3) | Equation (1) | Equation (3) | Equation (4) | Equation (5) | Equation (7) |
|---|---|---|---|---|---|---|
| A, kJ/mol | b, Å−1 | B | D | K, kJ/mol/cm−1 | M, kJ/mol/ppm | |
| F | 5490 | 2.4 | 7.2 | 0.20 | 1.30 | 2.9 |
| Cl | 1470 | 1.5 | 4.9 | 0.25 | 0.75 | 2.45 |
| Br | 4100 | 1.8 | 6.1 | 0.30 | 0.85 | 2.65 |
| I | 16,300 | 2.2 | 7.7 | 0.34 | 0.90 | 3.05 |
| At | 138,000 | 2.95 | 10.6 | 0.35 | 1.00 | 3.30 |
| This Work | Ref. [77] | |||||
|---|---|---|---|---|---|---|
| Halogen Donor | CG, A3 | CV, A3 | Crho, A3⋅kJ/mol/a.u. | CLap, A5⋅kJ/mol/a.u. | CG, A3 | CV, A3 |
| F | 0.18 | 0.14 | 600 | 150 | ||
| Cl | 0.47 | 0.43 | 1550 | 320 | 0.47 | 0.49 |
| Br | 0.57 | 0.60 | 1300 | 400 | 0.57 | 0.58 |
| I | 0.74 | 0.70 | 1600 | 510 | 0.67 | 0.68 |
| At | 0.78 | 0.75 | 1900 | 530 | ||
© 2020 by the authors. Licensee MDPI, Basel, Switzerland. This article is an open access article distributed under the terms and conditions of the Creative Commons Attribution (CC BY) license (http://creativecommons.org/licenses/by/4.0/).
Share and Cite
Ostras’, A.S.; Ivanov, D.M.; Novikov, A.S.; Tolstoy, P.M. Phosphine Oxides as Spectroscopic Halogen Bond Descriptors: IR and NMR Correlations with Interatomic Distances and Complexation Energy. Molecules 2020, 25, 1406. https://doi.org/10.3390/molecules25061406
Ostras’ AS, Ivanov DM, Novikov AS, Tolstoy PM. Phosphine Oxides as Spectroscopic Halogen Bond Descriptors: IR and NMR Correlations with Interatomic Distances and Complexation Energy. Molecules. 2020; 25(6):1406. https://doi.org/10.3390/molecules25061406
Chicago/Turabian StyleOstras’, Alexei S., Daniil M. Ivanov, Alexander S. Novikov, and Peter M. Tolstoy. 2020. "Phosphine Oxides as Spectroscopic Halogen Bond Descriptors: IR and NMR Correlations with Interatomic Distances and Complexation Energy" Molecules 25, no. 6: 1406. https://doi.org/10.3390/molecules25061406
APA StyleOstras’, A. S., Ivanov, D. M., Novikov, A. S., & Tolstoy, P. M. (2020). Phosphine Oxides as Spectroscopic Halogen Bond Descriptors: IR and NMR Correlations with Interatomic Distances and Complexation Energy. Molecules, 25(6), 1406. https://doi.org/10.3390/molecules25061406