Partial Least Square Model (PLS) as a Tool to Predict the Diffusion of Steroids Across Artificial Membranes


 ,
,  ,
,
Abstract
:1. Introduction
2. Results
2.1. Partial Least Squares (PLS) Methodology
2.1.1. Dataset Compilation
2.1.2. Validation
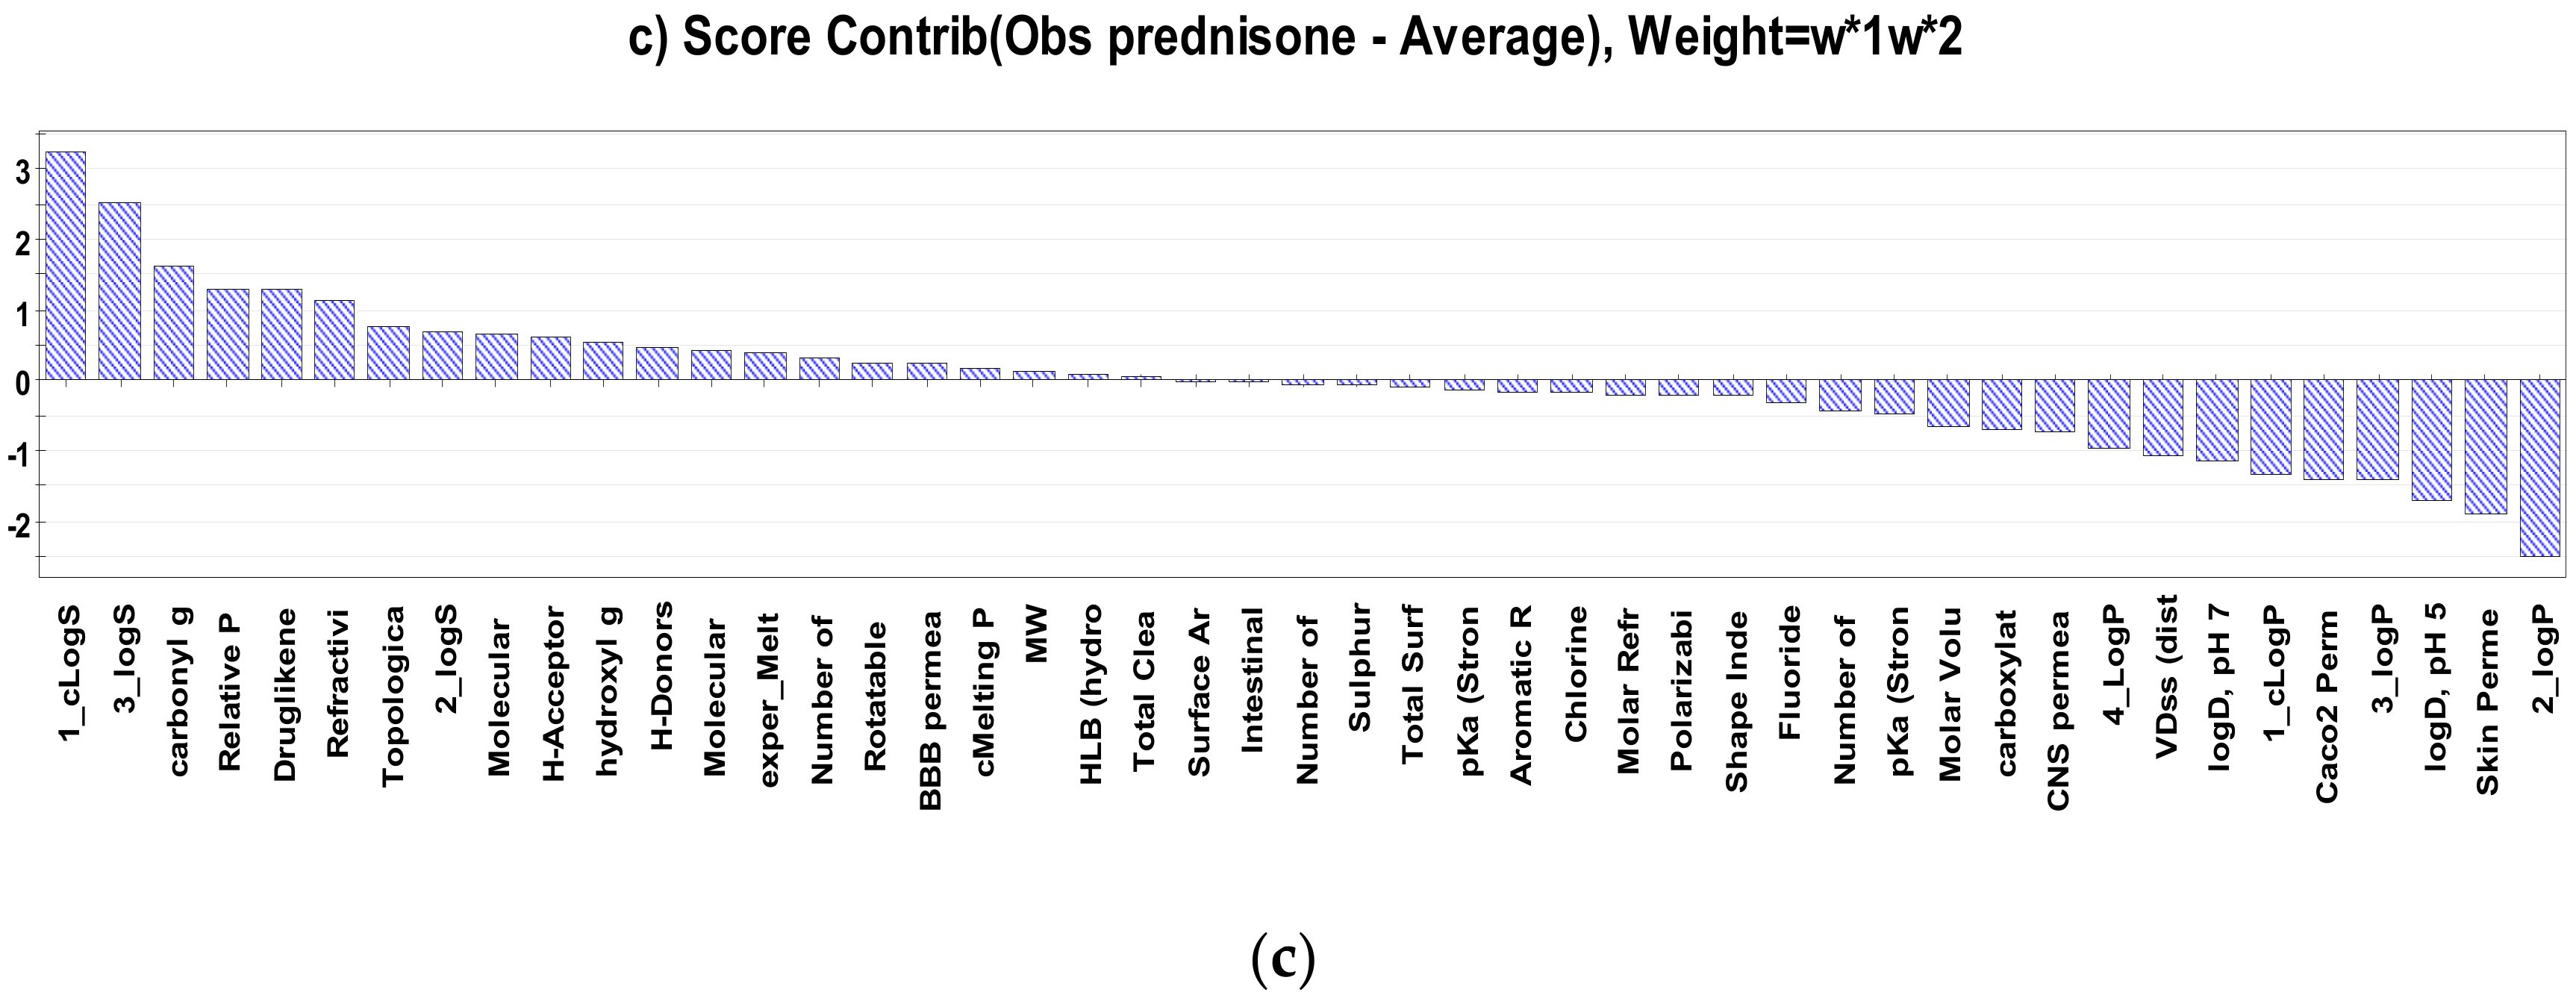
2.2. Interpretation of Steroids Permeability Through PLS
3. Materials and Methods
3.1. Reagents, Materials, Solutions
3.2. Methods
3.2.1. Solubility Study
3.2.2. In Vitro Permeation Studies
3.2.3. HPLC Experimental Conditions/Method Validation
4. Conclusions
Author Contributions
Funding
Conflicts of Interest
References
- Alexander, K. Structure and Nomenclature of Steroids. In Steroid Analysis, 2nd ed.; July, G.D., Hugh, M., Eds.; Springer: Dordrecht, The Netherlands, 2010; pp. 1–25. [Google Scholar]
- Giorgi, E.P.; Stein, W.D. The transport of steroids into animal cells in culture. Endocrinology 1981, 108, 688–697. [Google Scholar]
- Oren, I.; Fleishman, S.J.; Kessel, A.; Ben-Tal, N. Free diffusion of steroid hormones across biomembranes: A simplex search with implicit solvent model calculations. Biophys. J. 2004, 87, 768–779. [Google Scholar]
- McKay, C.J. Pharmacologic Effects of Corticosteroids. In Holland-Frei Cancer Medicine, 6th ed.; Kufe, D.W., Pollock, R.E., Weichselbaum, R.R., Eds.; BC Decker: Hamilton, ON, Canada, 2003. [Google Scholar]
- Kuhnz, W. Pharmacokinetics of the contraceptive steroids levonorgestrel and gestodene after single and multiple oral administration to women. Am. J. Obstet. Gynecol. 1990, 163, 2120–2127. [Google Scholar]
- Nair, M.; Chien, Y.W. Buccal delivery of progestational steroids: I. Characterization of barrier properties and effect of penetrant hydrophilicity. Int. J. Pharm. 1993, 89, 41–49. [Google Scholar]
- Gass, M.; Rebar, R.W.; Cuffie-Jackson, C.; Cedars, M.I.; Lobo, R.A.; Shoupe, D.; Judd, H.L.; Buyalos, R.P.; Clisham, P.R. A short study in the treatment of hot flashes with buccal administration of 17-β estradiol. Maturitas 2004, 49, 140–147. [Google Scholar]
- Badoud, F.; Boccard, J.; Schweizer, C.; Pralong, F.; Saugy, M.; Baume, N. Profiling of steroid metabolites after transdermal and oral administration of testosterone by ultra-high pressure liquid chromatography coupled to quadrupole time-of-flight mass spectrometry. J. Steroid Biochem. Mol. Biol. 2013, 138, 222–235. [Google Scholar]
- Hassan, A.S.; Soliman, G.M.; El-Mahdy, M.M.; El-Gindy, G.E.-D.A. Solubilization and enhancement of ex vivo vaginal delivery of progesterone using solid dispersions, inclusion complexes and micellar solubilization. Curr. Drug Deliv. 2017, 15, 110–121. [Google Scholar]
- Creber, N.J.; Eastwood, H.T.; Hampson, A.J.; Tan, J.; O’Leary, S.J. Adjuvant agents enhance round window membrane permeability to dexamethasone and modulate basal to apical cochlear gradients. Eur. J. Pharm. Sci. 2019, 126, 69–81. [Google Scholar]
- Xu, X.; Sun, L.; Zhou, L.; Cheng, Y.; Cao, F. Functional chitosan oligosaccharide nanomicelles for topical ocular drug delivery of dexamethasone. Carbohydr. Polym. 2020, 227, 115356. [Google Scholar]
- Guennoun, R.; Fréchou, M.; Gaignard, P.; Lière, P.; Slama, A.; Schumacher, M.; Denier, C.; Mattern, C. Intranasal administration of progesterone: A potential efficient route of delivery for cerebroprotection after acute brain injuries. Neuropharmacology 2019, 145, 283–291. [Google Scholar]
- Demirca, B.P.; Cagan, H.; Kiykim, A.; Arig, U.; Arpa, M.; Tulunay, A.; Ozen, A.; Aydıner, E.K.; Baris, S.; Barlan, I. Nebulized fluticasone propionate, a viable alternative to systemic route in the management of childhood moderate asthma attack: A double-blind, double-dummy study. Respir. Med. 2015, 109, 1120–1125. [Google Scholar]
- Zhuo, X.; Huang, X.; Yan, M.; Li, H.; Li, Y.; Rong, X.; Lin, J.; Cai, J.; Xie, F.; Xu, Y.; et al. Comparison between high-dose and low-dose intravenous methylprednisolone therapy in patients with brain necrosis after radiotherapy for nasopharyngeal carcinoma. Radiother. Oncol. 2019, 137, 16–23. [Google Scholar]
- Ferreira, L.L.G.; Andricopulo, A.D. ADMET modeling approaches in drug discovery. Drug Discov. Today 2019, 24, 1157–1165. [Google Scholar]
- Brown, E.W. © 1962 Nature Publishing Group. Nat. Int. J. Sci. 1962, 196, 1048–1050. [Google Scholar]
- Wold, S.; Sjöström, M.; Eriksson, L. PLS-regression: A basic tool of chemometrics. Chemom. Intell. Lab. Syst. 2001, 58, 109–130. [Google Scholar]
- Zhang, Y.H.; Xia, Z.N.; Yan, L.; Liu, S.S. Prediction of placental barrier permeability: A model based on partial least squares variable selection procedure. Molecules 2015, 20, 8270–8286. [Google Scholar]
- Kouskoura, M.G.; Piteni, A.I.; Markopoulou, C.K. A new descriptor via bio-mimetic chromatography and modeling for the blood brain barrier (Part II). J. Pharm. Biomed. Anal. 2019, 164, 808–817. [Google Scholar]
- Bergström, C.A.S.; Charman, S.A.; Nicolazzo, J.A. Computational prediction of CNS drug exposure based on a novel in vivo dataset. Pharm. Res. 2012, 29, 3131–3142. [Google Scholar]
- Vucicevic, J.; Nikolic, K.; Dobričić, V.; Agbaba, D. Prediction of blood-brain barrier permeation of α-adrenergic and imidazoline receptor ligands using PAMPA technique and quantitative-structure permeability relationship analysis. Eur. J. Pharm. Sci. 2015, 68, 94–105. [Google Scholar]
- Hu, Y.; Zhou, L.; Zhu, X.; Dai, D.; Bao, Y.; Qiu, Y. Pharmacophore modeling, multiple docking, and molecular dynamics studies on Wee1 kinase inhibitors. J. Biomol. Struct. Dyn. 2019, 37, 2703–2715. [Google Scholar]
- Wang, J.; Peng, W.; Li, X.; Fan, W.; Wei, D.; Wu, B.; Fan, L.; Wu, C.; Li, L. Towards to potential 2-cyano-pyrimidines cathepsin-K inhibitors: An in silico design and screening research based on comprehensive application of quantitative structure-activity relationships, molecular docking and ADMET prediction. J. Mol. Struct. 2019, 1195, 914–928. [Google Scholar]
- Elia, A.; Cocchi, M.; Cottini, C.; Riolo, D.; Cafiero, C.; Bosi, R.; Lutero, E. Multivariate data analysis to assess dry powder inhalers performance from powder properties. Powder Technol. 2016, 301, 830–838. [Google Scholar]
- Ng, S.; Rouse, J.J.; Sanderson, F.D.; Eccleston, G.M. The Relevance of Polymeric Synthetic Membranes in Topical Formulation Assessment and Drug Diffusion Study. Arch. Pharm. Res. 2012, 35, 579–593. [Google Scholar]
- Umetrics. Simca-P 9.0—User Guide and Tutorial; Umetrics: Malmo, Sweden, 2001. [Google Scholar]
- Wu, Z.; Li, D.; Meng, J.; Wang, H. Introduction to SIMCA-P and Its Application. In Handbook of Partial Least Squares: Concepts, Methods and Applications; Vinzi, V.E., Chin, W.W., Henseler, J., Wang, H., Eds.; Springer: Berlin/Heidelberg, Germany, 2010; pp. 757–774. [Google Scholar]
- Sander, T.; Freyss, J.; von Korff, M.; Rufener, C. DataWarrior: An open-source program for chemistry aware data visualization and analysis. J. Chem. Inf. Model. 2015, 55, 460–473. [Google Scholar]
- Pires, D.E.V.; Blundell, T.L.; Ascher, D.B. pkCSM: Predicting small-molecule pharmacokinetic and toxicity properties using graph-based signatures. J. Med. Chem. 2015, 58, 4066–4072. [Google Scholar]
- Bradley, J.-C.; Lang, A.; Williams, A. Jean-Claude Bradley Double Plus Good (Highly Curated and Validated) Melting Point Dataset. Figshare 2014, 10, m9. [Google Scholar]
- Williams, A.J.; Grulke, C.; Edwards, J.; McEachran, A.D.; Mansouri, K.; Baker, N.; Patlewicz, G.; Shah, I.; Wambaugh, J.; Judson, R.S.; et al. The CompTox Chemistry Dashboard: A community data resource for environmental chemistry. J. Cheminform. 2017, 9, 61. [Google Scholar]
- Ertl, P.; Rohde, B.; Selzer, P. Fast calculation of molecular polar surface area as a sum of fragment-based contributions and its application to the prediction of drug transport properties. J. Med. Chem. 2000, 43, 3714–3717. [Google Scholar]
- Kim, S.; Chen, J.; Cheng, T.; Gindulyte, A.; He, J.; He, S.; Li, Q.; Shoemaker, B.A.; Thiessen, P.; Yu, B.; et al. PubChem 2019 update: Improved access to chemical data. Nucleic Acids Res. 2018, 47, D1102–D1109. [Google Scholar]
- ChemAxon, Marvin. 2012. Available online: https://chemaxon.com/ (accessed on 9 September 2019).
- ACD/Labs. Advanced Chemistry Development Inc. 2015. Available online: https://www.acdlabs.com/index.php (accessed on 9 September 2019).
- Lapinsh, M.; Prusis, P.; Uhlén, S.; Wikberg, J.E.S. Improved approach for proteochemometrics modeling: Application to organic compound—Amine G protein-coupled receptor interactions. Bioinformatics 2005, 21, 4289–4296. [Google Scholar]
- Haaland, D.M.; Thomas, E.V. Partial least-squares methods for spectral analyses. 1. Relation to other quantitative calibration methods and the extraction of qualitative information. Anal. Chem. 1988, 60, 1193–1202. [Google Scholar]
- Lapins, M.; Eklund, M.; Spjuth, O.; Prusis, P.; Wikberg, J.E.S. Proteochemometric modeling of HIV protease susceptibility. BMC Bioinform. 2008, 9, 1–11. [Google Scholar]
- Dahan, A.; Miller, J.M. The Solubility-permeability interplay and its implications in formulation design and development for poorly soluble drugs. AAPS J. 2012, 14, 244–251. [Google Scholar]
- Tan, N.C.; Yu, P.; Kwon, Y.-U.; Kodadek, T. High-throughput evaluation of relative cell permeability between peptoids and peptides. Bioorg. Med. Chem. 2008, 16, 5853–5861. [Google Scholar]
- Chi, C.T.; Lee, M.H.; Weng, C.F.; Leong, M.K. In silico prediction of PAMPA effective permeability using a two-QSAR approach. Int. J. Mol. Sci. 2019, 20, 3170. [Google Scholar]
- Boyd, B.J.; Bergström, C.A.; Vinarov, Z.; Kuentz, M.; Brouwers, J.; Augustijns, P.; Brandl, M.; Bernkop-Schnürch, A.; Shrestha, N.; Préat, V.; et al. Successful oral delivery of poorly water-soluble drugs both depends on the intraluminal behavior of drugs and of appropriate advanced drug delivery systems. Eur. J. Pharm. Sci. 2019, 137, 104967. [Google Scholar]
- Barry, B.W.; El Eini, D.I.D. Influence of non-ionic surfactants on permeation of hydrocortisone, dexamethasone, testosterone and progesterone across cellulose acetate membrane. J. Pharm. Pharmacol. 1976, 28, 219–227. [Google Scholar]
- Palm, K.; Stenberg, P.; Luthman, K.; Artursson, P. Polar molecular surface properties predict the intestinal absorption of drugs in humans. Pharm. Res. 1997, 14, 568–571. [Google Scholar]
- Veber, D.F.; Johnson, S.R.; Cheng, H.-Y.; Smith, B.R.; Ward, K.W.; Kopple, K.D. Molecular properties that influence the oral bioavailability of drug candidates. J. Med. Chem. 2002, 45, 2615–2623. [Google Scholar]
- Barry, B.W.; Brace, A.R. Permeation of oestrone, oestradiol, oestriol and dexamethasone across cellulose acetate membrane. J. Pharm. Pharmacol. 1977, 29, 397–400. [Google Scholar]
- Faassen, F.; Kelder, J.; Lenders, J.; Onderwater, R.; Vromans, H. Physicochemical Properties and Transport of Steroids across Caco-2 Cells. Pharm. Res. 2003, 20, 177–186. [Google Scholar]
- Zhivkova, Z.; Mandova, T.; Doytchinova, I. Quantitative structure—Pharmacokinetics relationships analysis of basic drugs: Volume of distribution. J. Pharm. Pharm. Sci. 2015, 18, 515–527. [Google Scholar]
- Smith, D.A.; Beaumont, K.; Maurer, T.S.; Di, L. Volume of distribution in drug design. J. Med. Chem. 2015, 58, 5691–5698. [Google Scholar]
- Naumann, K. Influence of chlorine substituents on biological activity of chemicals: A review. Pest. Manag. Sci. 2000, 56, 3–21. [Google Scholar]
- Yamashita, F.; Wanchana, S.; Hashida, M. Quantitative structure/property relationship analysis of Caco-2 permeability using a genetic algorithm-based partial least squares method. J. Pharm. Sci. 2002, 91, 2230–2239. [Google Scholar]
- Winiwarter, S.; Ax, F.; Lennernäs, H.; Hallberg, A.; Pettersson, C.; Karlén, A. Hydrogen bonding descriptors in the prediction of human in vivo intestinal permeability. J. Mol. Graph. Model. 2003, 21, 273–287. [Google Scholar]
- ICH. ICH Topic Q2 (R1) Validation of Analytical Procedures: Text and Methodology; ICH Secretariat: Geneva, Switzerland, 2005. [Google Scholar]
Sample Availability: Samples of all studied compounds are available from the authors. |


| Open Melting Point Dataset | EPA DSSTox | Data Warrior | ACD/Labs | Marvin | PubChem | pkCSM |
|---|---|---|---|---|---|---|
| Melting Point | 1_cLogP | 2_logP | 3_logP | Topological PSA | MW | |
| 1_cLogS | logD, pH 7.4 | 2_logS | 4_LogP | |||
| Hydrogen Bond Acceptors | Refractivity index | pKa (Strongest Acidic) | 3_logS | |||
| Hydrogen Bond Donors | Molar Refractivity | pKa (Strongest Basic) | Double bonds | |||
| Aromatic Rings | PSA | HLB | Rotatable Bonds | |||
| Carboxyl group | Polarizability | No of Rings | Surface Area | |||
| Carbonyl group | Molar Volume | Caco2 Permeability | ||||
| Hydroxyl group | Intestinal absorption | |||||
| Total Surface Area | log Kp | |||||
| Relative PSA | VDss | |||||
| PSA | log BB | |||||
| Shape Index | logPS | |||||
| Molecular Complexity | Total Clearance | |||||
| Molecular Flexibility | ||||||
| Drug-likeness | ||||||
| Models | R2Y 1 | Q2 (cum) 2 | Number of Components | Excluded Observations |
|---|---|---|---|---|
| Papp | 0.902 | 0.722 | 3 | 3 |
| P2h | 0.802 | 0.567 | 3 | 1 |
| P4h | 0.847 | 0.656 | 3 | 2 |
| P6h | 0.846 | 0.659 | 3 | 2 |
| P8h | 0.872 | 0.605 | 3 | 3 |
| Models’ VIP Values | |||||||
|---|---|---|---|---|---|---|---|
| P2h | P4h | P6h | P8h | ||||
| Var ID (Primary) | M2.VIP[3] | Var ID (Primary) | M3.VIP[3] | Var ID (Primary) | M3.VIP[3] | Var ID (Primary) | M3.VIP[3] |
| Total Clearance | 1.62825 | 1_cLogS 1 | 1.41597 | 1_cLogS | 1.48033 | 1_cLogS | 1.47640 |
| Shape Index 2 | 1.45142 | Shape Index | 1.31645 | logD, pH 5.5 3 | 1.19879 | No. of triple bonds | 1.27167 |
| Molar Volume | 1.27798 | Molar Volume | 1.21737 | 3_logP | 1.19154 | Chlorine | 1.22264 |
| cMelting Point | 1.25731 | cMelting Point | 1.18929 | 3_logS | 1.18122 | 3_logS | 1.18501 |
| Refractivity index | 1.21565 | Molar Refractivity | 1.15522 | 2_logS | 1.17849 | 3_logP | 1.17937 |
| 1_cLogS | 1.21432 | logD, pH 5.5 | 1.15097 | Molar Volume | 1.17612 | Molar Volume | 1.17567 |
| Molar Refractivity | 1.19812 | 3_logS | 1.15097 | Drug-likeness | 1.16409 | Drug-likeness | 1.17289 |
| Polarizability | 1.17929 | Polarizability | 1.14560 | cMelting Point | 1.14712 | Fluoride | 1.16495 |
| Total Surface Area | 1.15973 | 2_logS | 1.14311 | Chlorine | 1.13175 | logD, pH 5.5 | 1.16166 |
| No of triple bonds | 1.14692 | Chlorine | 1.14308 | Fluoride | 1.12684 | 2_logS | 1.15902 |
| 2_logS | 1.12114 | carboxylate group | 1.13474 | Molar Refractivity | 1.12456 | cMelting Point | 1.13450 |
| carboxylate group | 1.11557 | No of triple bonds | 1.12947 | Polarizability | 1.11544 | Molar Refractivity | 1.11508 |
| MW | 1.09348 | Fluoride | 1.12462 | 1_cLogP | 1.11174 | Polarizability | 1.10855 |
| H-Donors | 1.09223 | Total Surface Area | 1.12262 | logD, pH 7.4 | 1.10117 | Refractivity index | 1.10584 |
| Chlorine | 1.08855 | 3_logP | 1.12234 | No of triple bonds | 1.09925 | Total Surface Area | 1.08631 |
| 3_logS | 1.07715 | Refractivity index | 1.10689 | Total Surface Area | 1.09019 | 1_cLogP | 1.08316 |
| logD, pH 5.5 | 1.05540 | exper_Melting Point | 1.07645 | 4_LogP | 1.08878 | hydroxyl group | 1.07759 |
| Rotatable Bonds | 1.05147 | MW | 1.06777 | Refractivity index | 1.08517 | 4_LogP | 1.06769 |
| Surface Area | 1.04603 | H-Donors | 1.05761 | 2_logP | 1.08068 | H-Donors | 1.06767 |
| exper_Melting Point | 1.03503 | logD, pH 7.4 | 1.05533 | hydroxyl group | 1.06590 | logD, pH 7.4 | 1.06241 |
| hydroxyl group | 1.03056 | 1_cLogP | 1.05320 | H-Donors | 1.06502 | 2_logP | 1.0599 |
| logD, pH 7.4 | 1.00956 | hydroxyl group | 1.04762 | MW | 1.04701 | exper_Melting Point | 1.05272 |
| 3_logP | 0.97296 | 2_logP | 1.04431 | exper_Melting Point | 1.03706 | MW | 1.04095 |
| Caco2 Permeability | 0.96943 | Surface Area | 1.04168 | carboxylate group | 1.03300 | Surface Area | 1.02086 |
| 4_LogP | 0.96517 | 4_LogP | 1.03678 | Surface Area | 1.02096 | Shape Index | 0.99368 |
| 1_cLogP | 0.95059 | Druglikeness | 1.01070 | Shape Index | 0.99572 | Relative PSA | 0.98728 |
| 2_logP | 0.93301 | Rotatable Bonds | 0.98079 | Relative PSA | 0.98111 | carboxylate group | 0.97549 |
| H-Acceptors | 0.88952 | Caco2 Permeability | 0.96573 | Caco2 Permeability | 0.96947 | Rotatable Bonds | 0.95868 |
| Steroids Structures | |||||||||||||
|---|---|---|---|---|---|---|---|---|---|---|---|---|---|
| Compound | Double Bonds | C2 | C3 | C4 | C5 | C7 | C9 | C10 | C11 | C13 | C16 | C17 | |
| 17a-hydroxyprogesterone | COMP 1 | 4 = 5 | CH3 | CH3 | COCH3, OH | ||||||||
| 4-chlorotestosterone | COMP 2 | 4 = 5 | =O | Cl | CH3 | CH3 | OCOCH3 | ||||||
| Androstanolone | COMP 3 | CH3 | CH3 | OH | |||||||||
| Betamethasone dipropionate | COMP 4 | 1 = 2, 4 = 5 | =O | F | CH3 | OH | CH3 | CH3 | COCH2 OCOC2H5, OCOC2H5 | ||||
| Betamethasone valerate | COMP 5 | 1 = 2, 4 = 5 | =O | F | CH3 | OH | CH3 | CH3 | COCH2OH, OCOC4H9 | ||||
| Budesonide | COMP 6 | 1 = 2, 4 = 5 | =O | CH3 | OH | a | a, COCCH2OH | ||||||
| Cortisone acetate | COMP 7 | 4 = 5 | =O | CH3 | =O | CH3 | COCH2OCOCH3, OH | ||||||
| Dehydro-isoandrosterone | COMP 8 | 5 = 6 | OH | CH3 | CH3 | =O | |||||||
| Deoxycorticosterone acetate | COMP 9 | 4 = 5 | =O | CH3 | CH3 | COCH2OCOCH3 | |||||||
| Dexamethasone | COMP 10 | 1 = 2, 4 = 5 | =O | F | CH3 | OH | CH3 | CH3 | CCOCH2OH, OH | ||||
| D-norgestrel | COMP 11 | 4 = 5 | =O | CH2CH3 | C≡CH, OH | ||||||||
| Estriol | COMP 12 | 1 = 2, 3 = 4, 5 = 10 | OH | OH | OH | ||||||||
| Estrone | COMP 13 | 2 = 3, 4 = 5, 10 = 1 | OH | CH3 | =O | ||||||||
| Ethinylestradiol | COMP 14 | 1 = 2, 3 = 4, 5 = 10 | OH | CH3 | C≡CH, OH | ||||||||
| Ethisterone | COMP 15 | 4 = 5 | =O | CH3 | CH3 | C≡CH, OH | |||||||
| Fludrocortisone acetate | COMP 16 | 4 = 5 | =O | F | CH3 | OH | CH3 | COCH 2OCOCH3, OH | |||||
| Formebolone | COMP 17 | 1 = 2, 4 = 5 | CHO | =O | CH3 | OH | CH3 | CH3, OH | |||||
| Hydrocortisone | COMP 18 | 4 = 5 | =O | CH3 | OH | CH3 | COCH2OH, OH | ||||||
| Hydrocortisone acetate | COMP 19 | 4 = 5 | =O | CH3 | OH | CH3 | COCH2OCOCH3, OH | ||||||
| Medroxyprogesterone acetate | COMP 20 | 4 = 5 | =O | CH3 | CH3 | CH3 | OCOCH3, COCH3 | ||||||
| Methandriol | COMP 21 | 5 = 6 | OH | CH3, OH | |||||||||
| Methyl testosterone | COMP 22 | 4 = 5 | =O | CH3 | CH3 | CH3, OH | |||||||
| Norethisterone | COMP 23 | 4 = 5 | =O | CH3 | C≡CH, OH | ||||||||
| Prednisolone | COMP 24 | 1 = 2, 4 = 5 | =O | CH3 | OH | CH3 | COCH2OH, OH | ||||||
| Prednisolone 21-sodium succinate | COMP 25 | 1 = 2, 4 = 5 | =O | CH3 | OH | CH3 | COCH2OCOCH2CH2OCOH, OH | ||||||
| Prednisolone acetate | COMP 26 | 1 = 2, 4 = 5 | =O | CH3 | OH | CH3 | COCH2OCOCH3, OH | ||||||
| Prednisone | COMP 27 | 1 = 2, 4 = 5 | =O | CH3 | =O | CH3 | COCH2OH, OH | ||||||
| Progesterone | COMP 28 | 4 = 5 | =O | CH3 | CH3 | COCH3 | |||||||
| Spironolactone | COMP 29 | 4 = 5 | =O | SCOCH3 | CH3 | CH3 | b | ||||||
| Testosterone | COMP 30 | 4 = 5 | =O | CH3 | CH3 | OH | |||||||
| Testosterone acetate | COMP 31 | 4 = 5 | =O | CH3 | CH3 | OCOCH3 | |||||||
| Testosterone propionate | COMP 32 | 4 = 5 | =O | CH3 | CH3 | OCOC2H5 | |||||||
| trans-Androsterone | COMP 33 | OH | CH3 | CH3 | =O | ||||||||
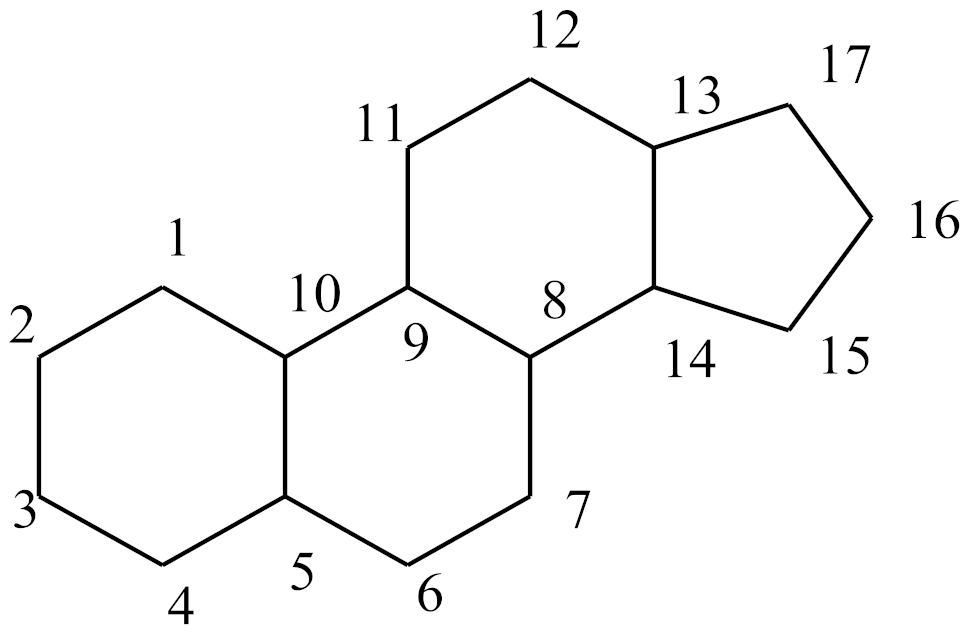 sterane | 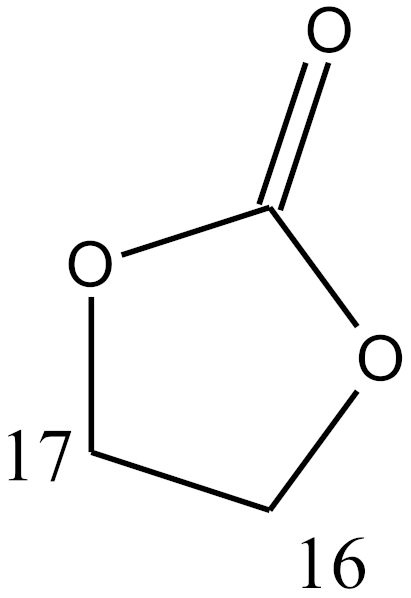 a | 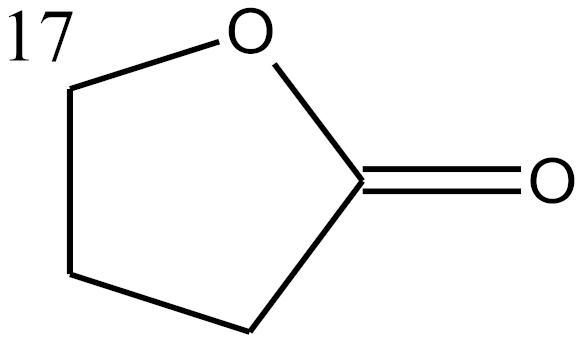 b | |||||||||||
| Compound | Detector | Flow (mL/min) | Retention Factor (k’) | λ (nm) | Quantification Ion 2 (m/z) |
|---|---|---|---|---|---|
| COMP 1 | DAD 1 | 0.3 | 1.11 | 240 | - |
| COMP 2 | MS 3 | 0.5 | 4.67 | - | 365 [(M+CH3CN)+H]+ |
| COMP 3 | MS | 0.5 | 4.06 | - | 332 [(M+CH3CN)+H]+ |
| COMP 4 | DAD | 0.3 | 2.18 | 240 | - |
| COMP 5 | DAD | 0.5 | 1.45 | 240 | - |
| COMP 6 | DAD | 0.5 | 1.93 | 240 | - |
| COMP 7 | DAD | 0.4 | 3.05 | 240 | - |
| COMP 8 | DAD | 0.4 | 2.55 | 230 | - |
| COMP 9 | DAD | 0.4 | 2.43 | 240 | - |
| COMP 10 | DAD | 0.4 | 2.46 | 240 | - |
| COMP 11 | DAD | 0.4 | 3.34 | 240 | - |
| COMP 12 | DAD | 0.5 | 1.49 | 205 | - |
| COMP 13 | DAD | 0.5 | 3.98 | 205 | - |
| COMP 14 | DAD | 0.4 | 0.92 | 240 | - |
| COMP 15 | DAD | 0.3 | 2.56 | 205 | - |
| COMP 16 | DAD | 0.4 | 3.12 | 240 | - |
| COMP 17 | DAD | 0.4 | 2.58 | 220 | - |
| COMP 18 | DAD | 0.3 | 0.83 | 240 | - |
| COMP 19 | DAD | 0.5 | 0.96 | 240 | - |
| COMP 20 | DAD | 0.5 | 0.74 | 240 | - |
| COMP 21 | MS | 0.5 | 4.76 | - | 287 [(M-H2O)+H]+ |
| COMP 22 | DAD | 0.5 | 0.87 | 240 | - |
| COMP 23 | DAD | 0.4 | 2.48 | 240 | - |
| COMP 24 | DAD | 0.4 | 2.18 | 240 | - |
| COMP 25 | DAD | 0.4 | 3.11 | 244 | - |
| COMP 26 | DAD | 0.4 | 2.43 | 240 | - |
| COMP 27 | DAD | 0.4 | 2.45 | 240 | - |
| COMP 28 | DAD | 0.5 | 0.87 | 240 | - |
| COMP 29 | DAD | 0.5 | 4.04 | 238 | - |
| COMP 30 | DAD | 0.5 | 0.67 | 240 | - |
| COMP 31 | DAD | 0.5 | 1.12 | 240 | - |
| COMP 32 | DAD | 0.5 | 1.66 | 240 | - |
| COMP 33 | MS | 0.5 | 4.50 | - | 373 [(M+2CH3CN)+H]+ |
| Compound | R 2 | Intercept | Slope | LOD 1 (μg/mL) | LOQ 2 (μg/mL) |
|---|---|---|---|---|---|
| COMP 1 | 0.9997 | 1123 | 43133 | 0.01 | 0.04 |
| COMP 2 | 0.9947 | −5470 | 38034 | 0.27 | 0.90 |
| COMP 3 | 0.9997 | 1252 | 16203 | 0.05 | 0.18 |
| COMP 4 | 0.9997 | −9501 | 28376 | 0.11 | 0.38 |
| COMP 5 | 0.9998 | −4479 | 20526 | 0.05 | 0.18 |
| COMP 6 | 0.9998 | 552 | 16428 | 0.04 | 0.12 |
| COMP 7 | 0.9996 | −3723 | 28562 | 0.03 | 0.12 |
| COMP 8 | 0.9997 | −993 | 4454 | 0.32 | 1.07 |
| COMP 9 | 0.9993 | −4166 | 26523 | 0.02 | 0.06 |
| COMP 10 | 0.9990 | −11577 | 13079 | 0.18 | 0.60 |
| COMP 11 | 0.9998 | −12551 | 43421 | 0.01 | 0.03 |
| COMP 12 | 1.0000 | −1090 | 51548 | 0.07 | 0.24 |
| COMP 13 | 0.9996 | −3671 | 51988 | 0.06 | 0.19 |
| COMP 14 | 0.9990 | 26763 | 79974 | 0.01 | 0.04 |
| COMP 15 | 1.0000 | 706 | 30294 | 0.01 | 0.03 |
| COMP 16 | 0.9999 | 7399 | 25115 | 0.04 | 0.14 |
| COMP 17 | 0.9992 | 12588 | 45247 | 0.05 | 0.18 |
| COMP 18 | 0.9997 | −6597 | 62213 | 0.01 | 0.03 |
| COMP 19 | 0.9985 | 26809 | 19890 | 0.03 | 0.10 |
| COMP 20 | 1.0000 | 802 | 37460 | 0.01 | 0.05 |
| COMP 21 | 0.9996 | 436 | 10500 | 0.05 | 0.16 |
| COMP 22 | 0.9999 | 798 | 25856 | 0.02 | 0.05 |
| COMP 23 | 0.9999 | −162 | 38688 | 0.01 | 0.04 |
| COMP 24 | 0.9999 | 1568 | 38840 | 0.03 | 0.10 |
| COMP 25 | 1.0000 | −353 | 13103 | 0.04 | 0.12 |
| COMP 26 | 0.9997 | −2111 | 22329 | 0.04 | 0.13 |
| COMP 27 | 0.9997 | −256 | 26564 | 0.04 | 0.14 |
| COMP 28 | 0.9997 | 916 | 32027 | 0.01 | 0.04 |
| COMP 29 | 1.0000 | −1564 | 26756 | 0.02 | 0.06 |
| COMP 30 | 1.0000 | 3599 | 113379 | 0.01 | 0.03 |
| COMP 31 | 1.0000 | 6794 | 25375 | 0.01 | 0.04 |
| COMP 32 | 1.0000 | 11227 | 54069 | 0.01 | 0.02 |
| COMP 33 | 0.9971 | −303 | 5860 | 0.03 | 0.10 |
© 2020 by the authors. Licensee MDPI, Basel, Switzerland. This article is an open access article distributed under the terms and conditions of the Creative Commons Attribution (CC BY) license (http://creativecommons.org/licenses/by/4.0/).
Share and Cite
Tsanaktsidou, E.; Karavasili, C.; Zacharis, C.K.; Fatouros, D.G.; Markopoulou, C.K. Partial Least Square Model (PLS) as a Tool to Predict the Diffusion of Steroids Across Artificial Membranes. Molecules 2020, 25, 1387. https://doi.org/10.3390/molecules25061387
Tsanaktsidou E, Karavasili C, Zacharis CK, Fatouros DG, Markopoulou CK. Partial Least Square Model (PLS) as a Tool to Predict the Diffusion of Steroids Across Artificial Membranes. Molecules. 2020; 25(6):1387. https://doi.org/10.3390/molecules25061387
Chicago/Turabian StyleTsanaktsidou, Eleni, Christina Karavasili, Constantinos K. Zacharis, Dimitrios G. Fatouros, and Catherine K. Markopoulou. 2020. "Partial Least Square Model (PLS) as a Tool to Predict the Diffusion of Steroids Across Artificial Membranes" Molecules 25, no. 6: 1387. https://doi.org/10.3390/molecules25061387
APA StyleTsanaktsidou, E., Karavasili, C., Zacharis, C. K., Fatouros, D. G., & Markopoulou, C. K. (2020). Partial Least Square Model (PLS) as a Tool to Predict the Diffusion of Steroids Across Artificial Membranes. Molecules, 25(6), 1387. https://doi.org/10.3390/molecules25061387