Article

Bioassay-Guided Isolation and HPLC Quantification of Antiproliferative Metabolites from Stahlianthus thorelii

1
The Ph.D. Program in Clinical Drug Development of Herbal Medicine, College of Pharmacy, Taipei Medical University, Taipei 11031, Taiwan
2
Division of Chinese Materia Medica Development, National Research Institute of Chinese Medicine, Taipei 11221, Taiwan
3
Graduate Institute of Natural Products, Kaohsiung Medical University, Kaohsiung 80708, Taiwan
4
Department of Biochemical Science and Technology, National Chiayi University, Chiayi 60004, Taiwan
5
Traditional Herbal Medicine Research Center of Taipei Medical University Hospital, Taipei 110, Taiwan
6
Graduate Institute of Intergrated Medicine, College of Chinese Medicine, China Medical University, Taichung 40402, Taiwan
*
Authors to whom correspondence should be addressed.
Molecules 2020, 25(3), 551; https://doi.org/10.3390/molecules25030551
Submission received: 20 December 2019 / Revised: 17 January 2020 / Accepted: 21 January 2020 / Published: 28 January 2020

Abstract

:
In folk medicine, Stahlianthus thorelii Gagnep. has been used to treat diseases related to inflammation, ulcers, and cancer. There are no reports concerning the chemical components and bioactivities of S. thorelii; thus, this study aims to explore the phytochemicals, quantify the main compounds, and test the anticancer activity of isolates from S. thorelii. Dried rhizomes were extracted with 95% ethanol and, then, partitioned, fractionated, and isolated. On the basis of the result of the antiproliferative activity of the fractions, seven isolates were yielded and were identified by spectroscopic analyses. The inhibition of cancer proliferation was determined by an MTT assay and the deployed IC50 to value their efficacy. Seven compounds containing one new C-benzylated dihydrochalcone derivative, thorechalcone A (1) and 27 were isolated from S. thorelii. In terms of the bioactivity, compounds 1 and 3 displayed promising antiproliferative activity (WiDr, A549, and HepG2), with IC50 values <40 µM. The HPLC-UV method of quantification of two major compounds (3 and 4) was also validated. This study presented the isolations of antiproliferative potentials of new chalcone and known flavonoid derivatives from S. thorelii. The validated simple, accurate, and rapid HPLC method could be deployed for the quality control of herbal drugs.

Graphical Abstract

1. Introduction

Zingiberaceae is commonly known as a zinger family consisting of perennial herbs used in traditional medicines. This family is widely distributed in Asia, Africa, and America, comprising more than 1300 species and around 52 genera. Many species in this family have already been studied for their phytochemicals and bioactivities, which display significant anticancer, antimicrobial, anti-inflammation bioactivities [1]. The potential of anticancer activities of the species in the Zingiberaceae family have been were investigated through many studies [2,3,4,5,6,7,8,9]. Extracts of eight species of Zingiberaceae including Amommum cardamomum, Curcuma longa, C. mangga, C. xanthorrhiza, Kaempferia pandurata, Zingiber officinale, Z. aromaticum, and Z. cassumunar were found to inhibit the growth of MCF-7 and HT-29 cancer cell lines [2]. In 2015, an ethanolic extract of C. longa was reported to possess the antiproliferative and proapoptotic effects on murine melanoma B164A5 [3] and prostate cancer cell lines [4]. In addition, Z. officinale [5,6], K. pandurata [7], and Alpinia galangal [8] were mentioned to have the promising cytotoxicity against several cancer cell lines. Curcumin is a major ingredient extracted from Curcuma species, which had the antiproliferative activity and was proved to induce apoptosis of Rb cells via inhibition of JAK/STAT pathway [9].
Stahlianthus thorelii and Stahlianthus invocratus are members of the Zingiberaceae famil and both are known as “Khuong tam that” used in Vietnamese and Chinese folk medicine, respectively, to treat inflammation, pneumonia, diarrhea, and anticancer [10,11,12]. However, there are seldom reports concerning chemical components and bioactivities related to diseases for Stahlianthus species except for limited studies on Stahlianthus invocratus about its chemical components [10,13], and the bioactivities of its ethanol extract [14]. This study aimed to isolate bioactive compounds and elucidate their structures, based on antiproliferative-directed fractionations. Then, the main and active compounds were quantified by HPLC-UV. The method was validated for the quantification of two major active compounds. To the best of the authors’ knowledge, this is the first report about Stahlianthus thorelii concerning both phytochemistry and anticancer potential.

2. Results and Discussion

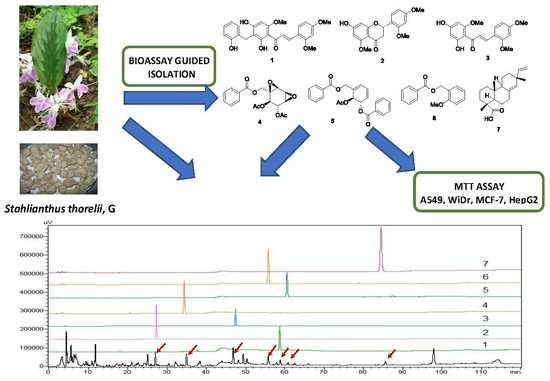
2.1. Bioactivity-Guided Isolation of Chemical Constituents

A comparison with the other three solvents extracted layers (SEA, SBU, and SW) showed that the EtOAc layer (SEA) had the most potent antiproliferative activities. Therefore, SEA was selected to further make fractionations and subfractions. SF3, SF7, and SF9 showed the inhibition of human colon adenocarcinoma (WiDr) proliferation with IC50 = 43.42, 25.49, and 20.04 µg/mL, respectively (Table 1). Furthermore, SF7 and SF9 also displayed antiproliferative activities in cell lines A549, MCF-7, and HepG2. SF3 was fractionated to simple subfractions; and SF 3.5 and SF 3.6 had the same antiproliferative activity in the WiDr cell lines. These two subfractions also displayed the antiproliferation of A549, MCF-7, and HepG2, despite SF3 having a weak effect on those cell lines.
In this way, the bioactivity-guided fractionation of S. thorelii extracts led to isolating one new compound, thorechalcone A (1), together with six known compounds, 27 (Figure 1).

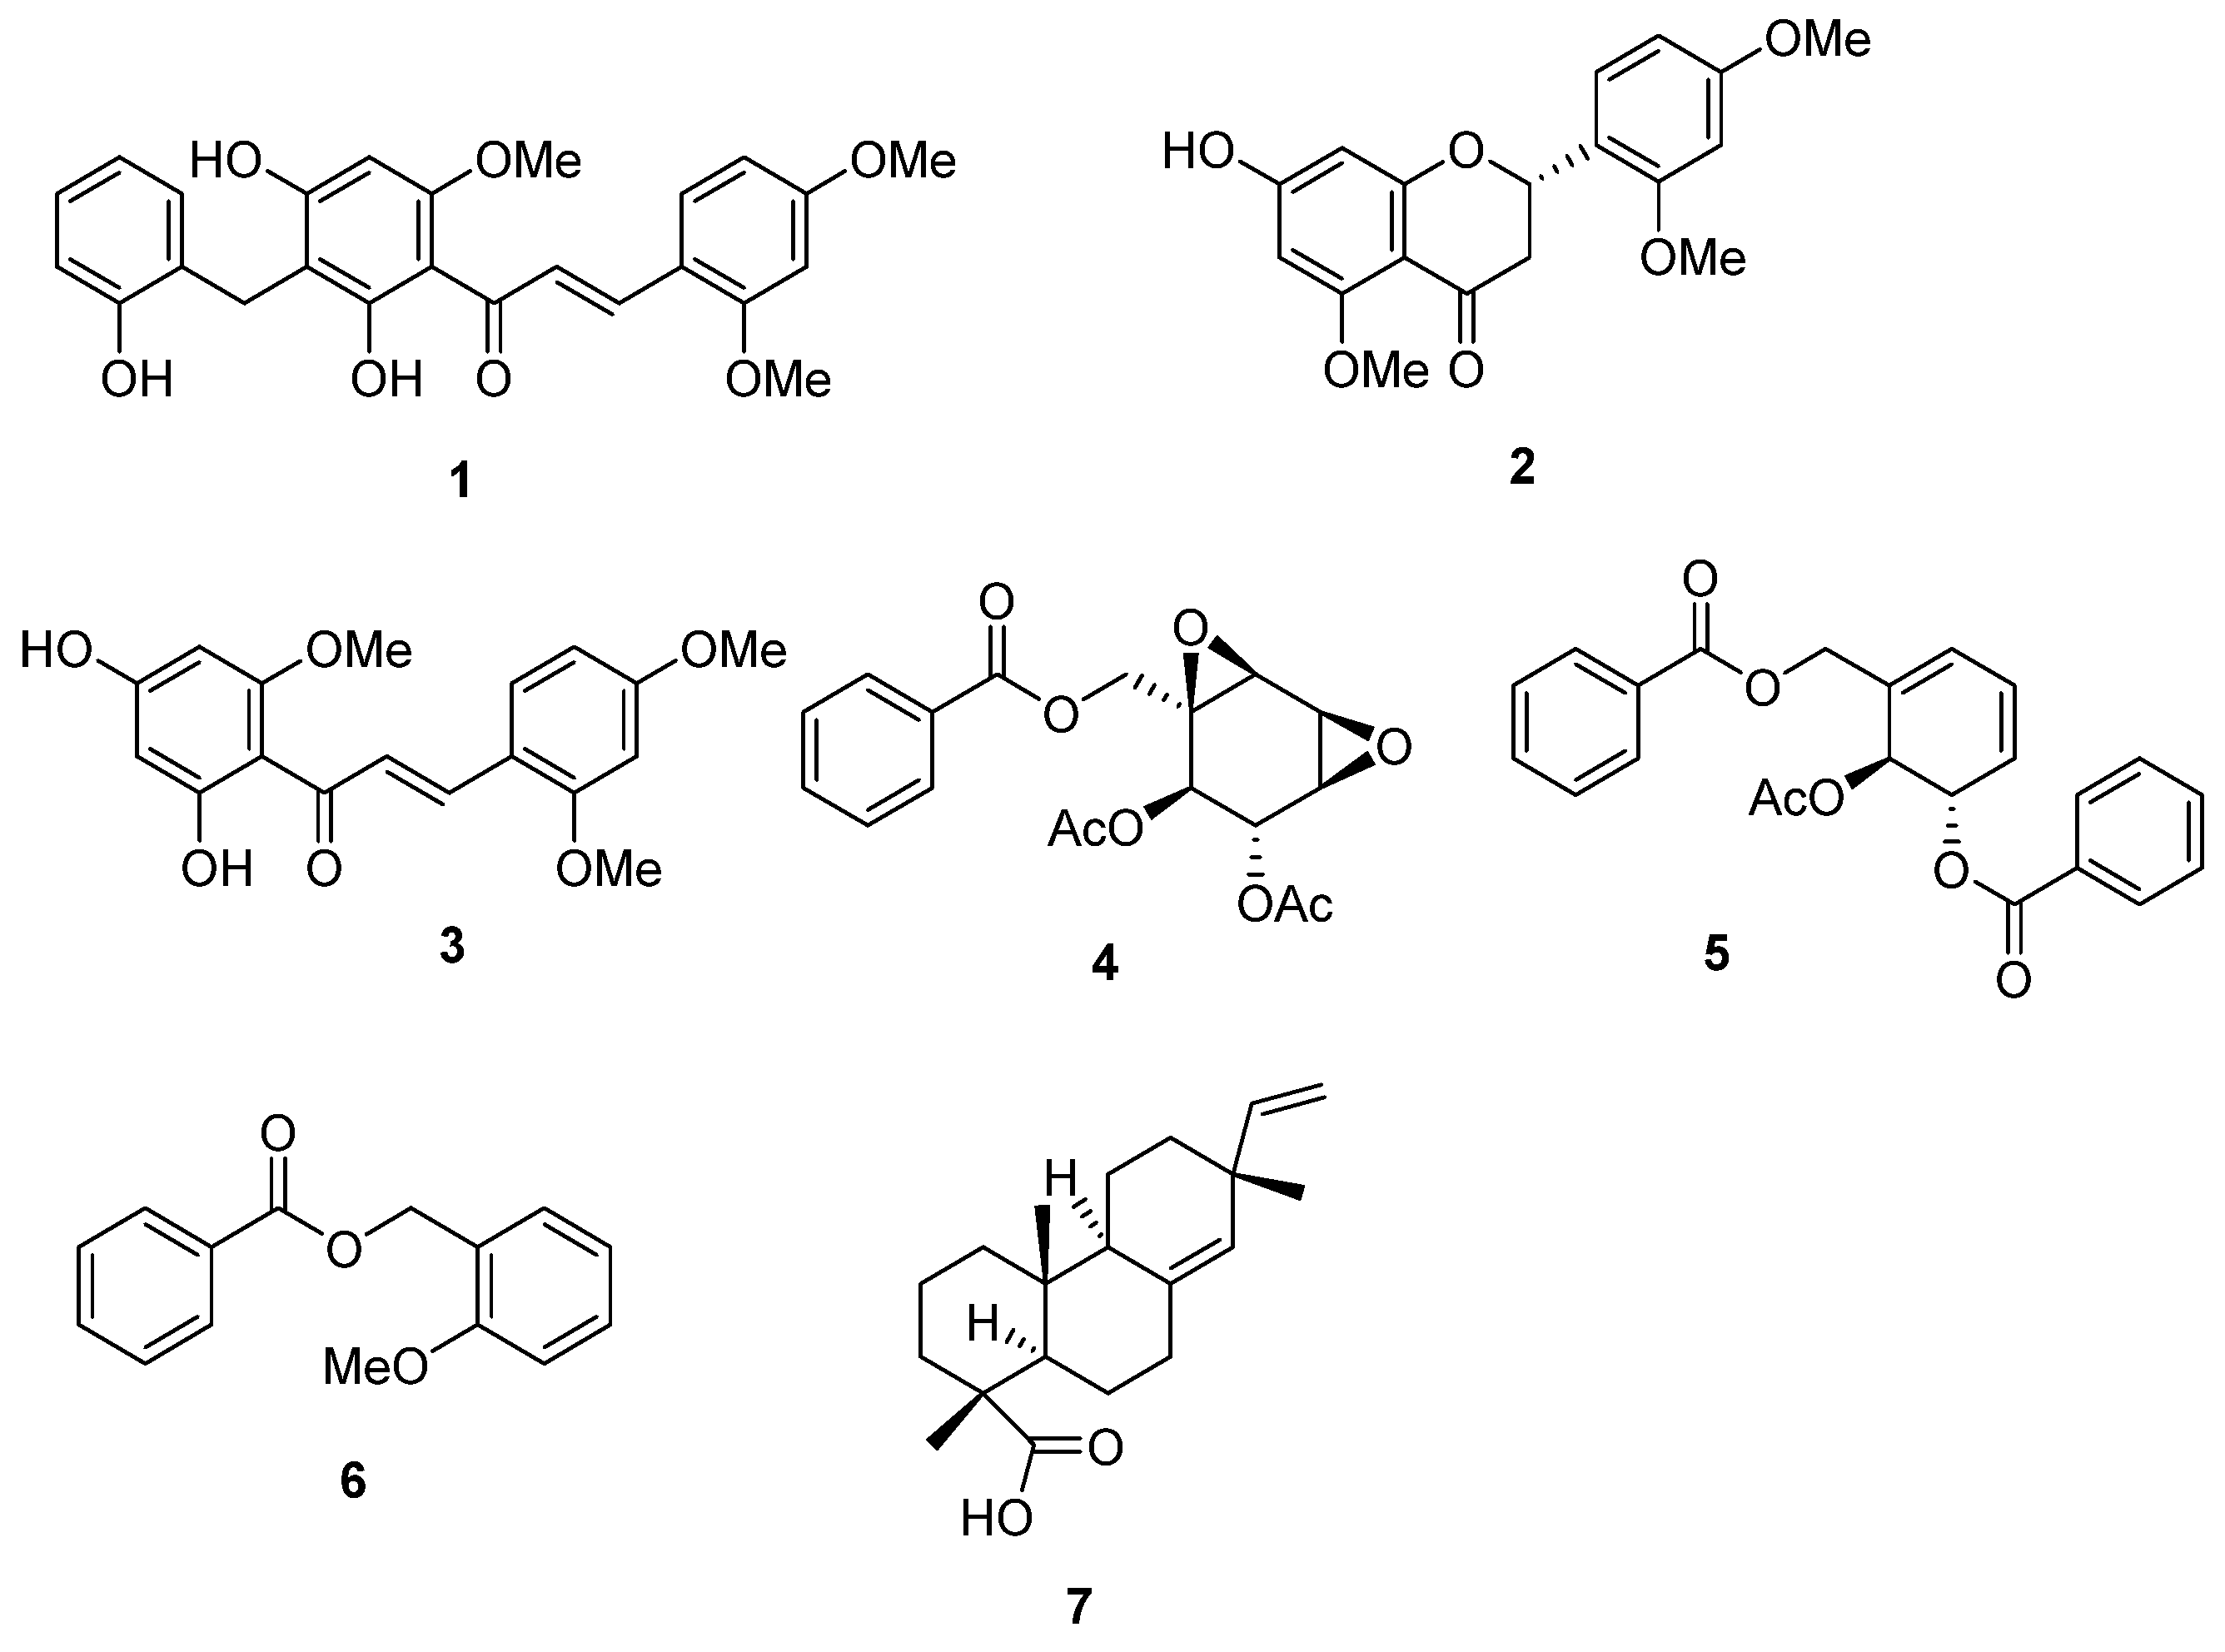
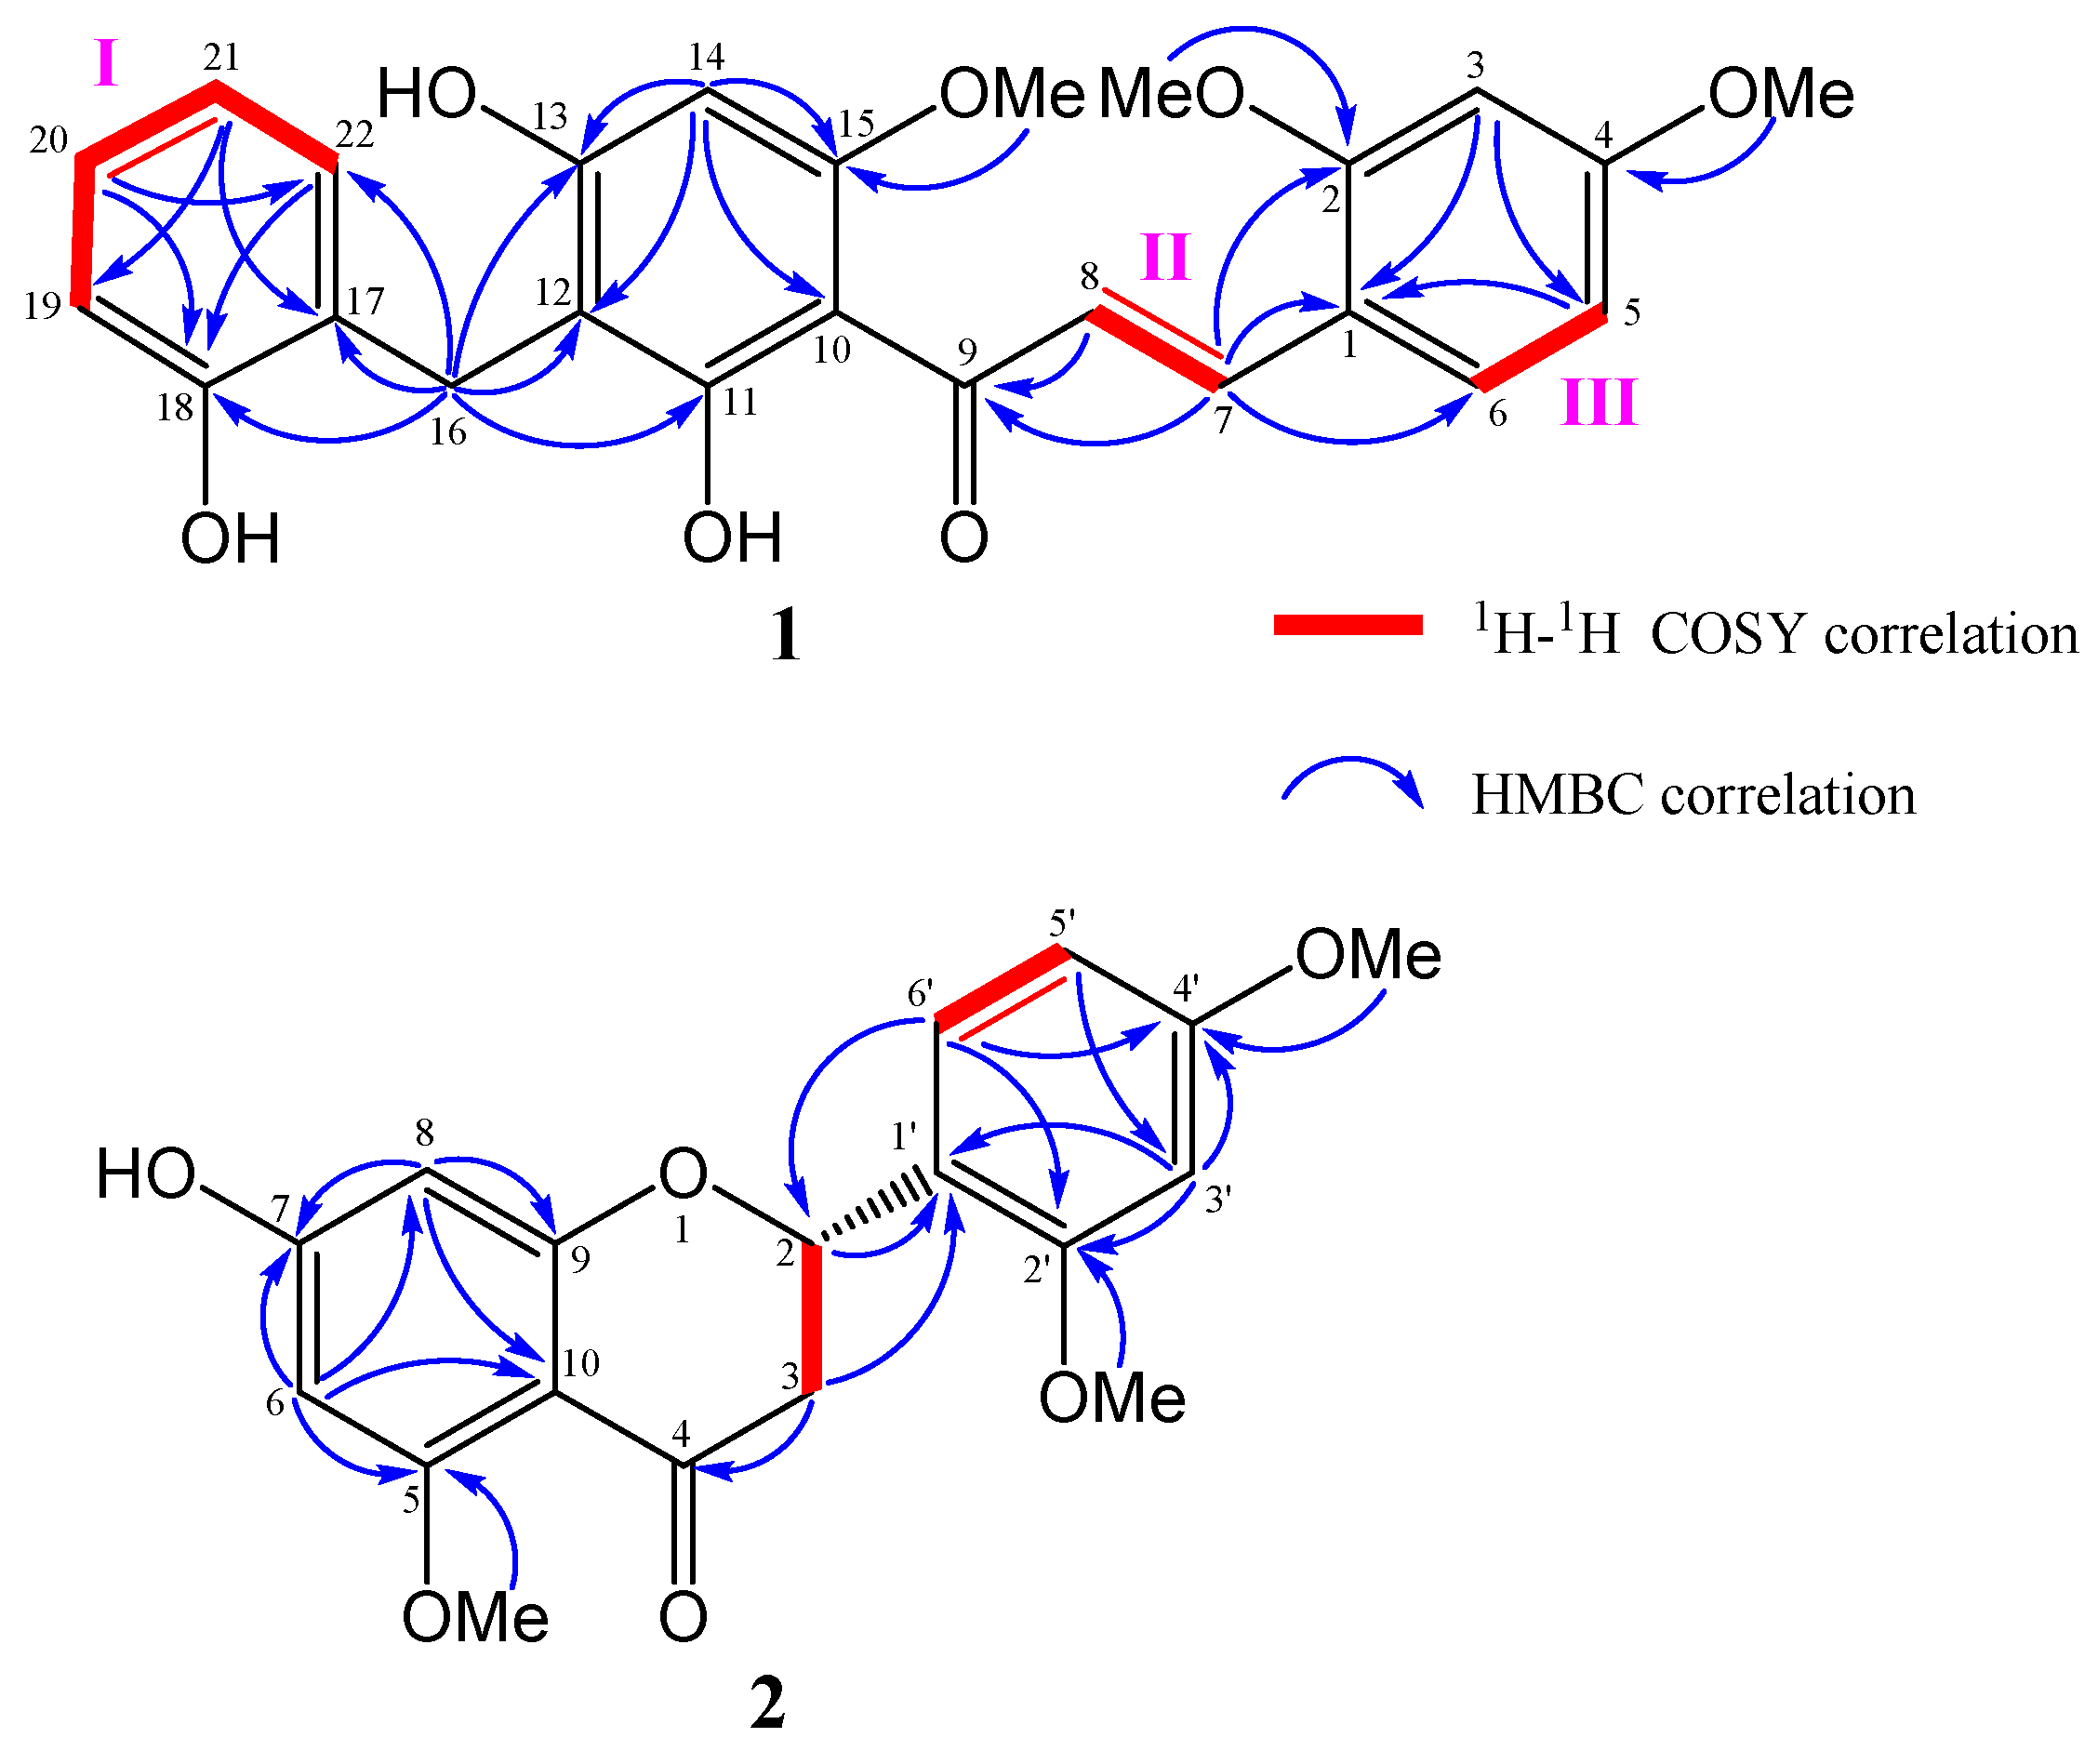
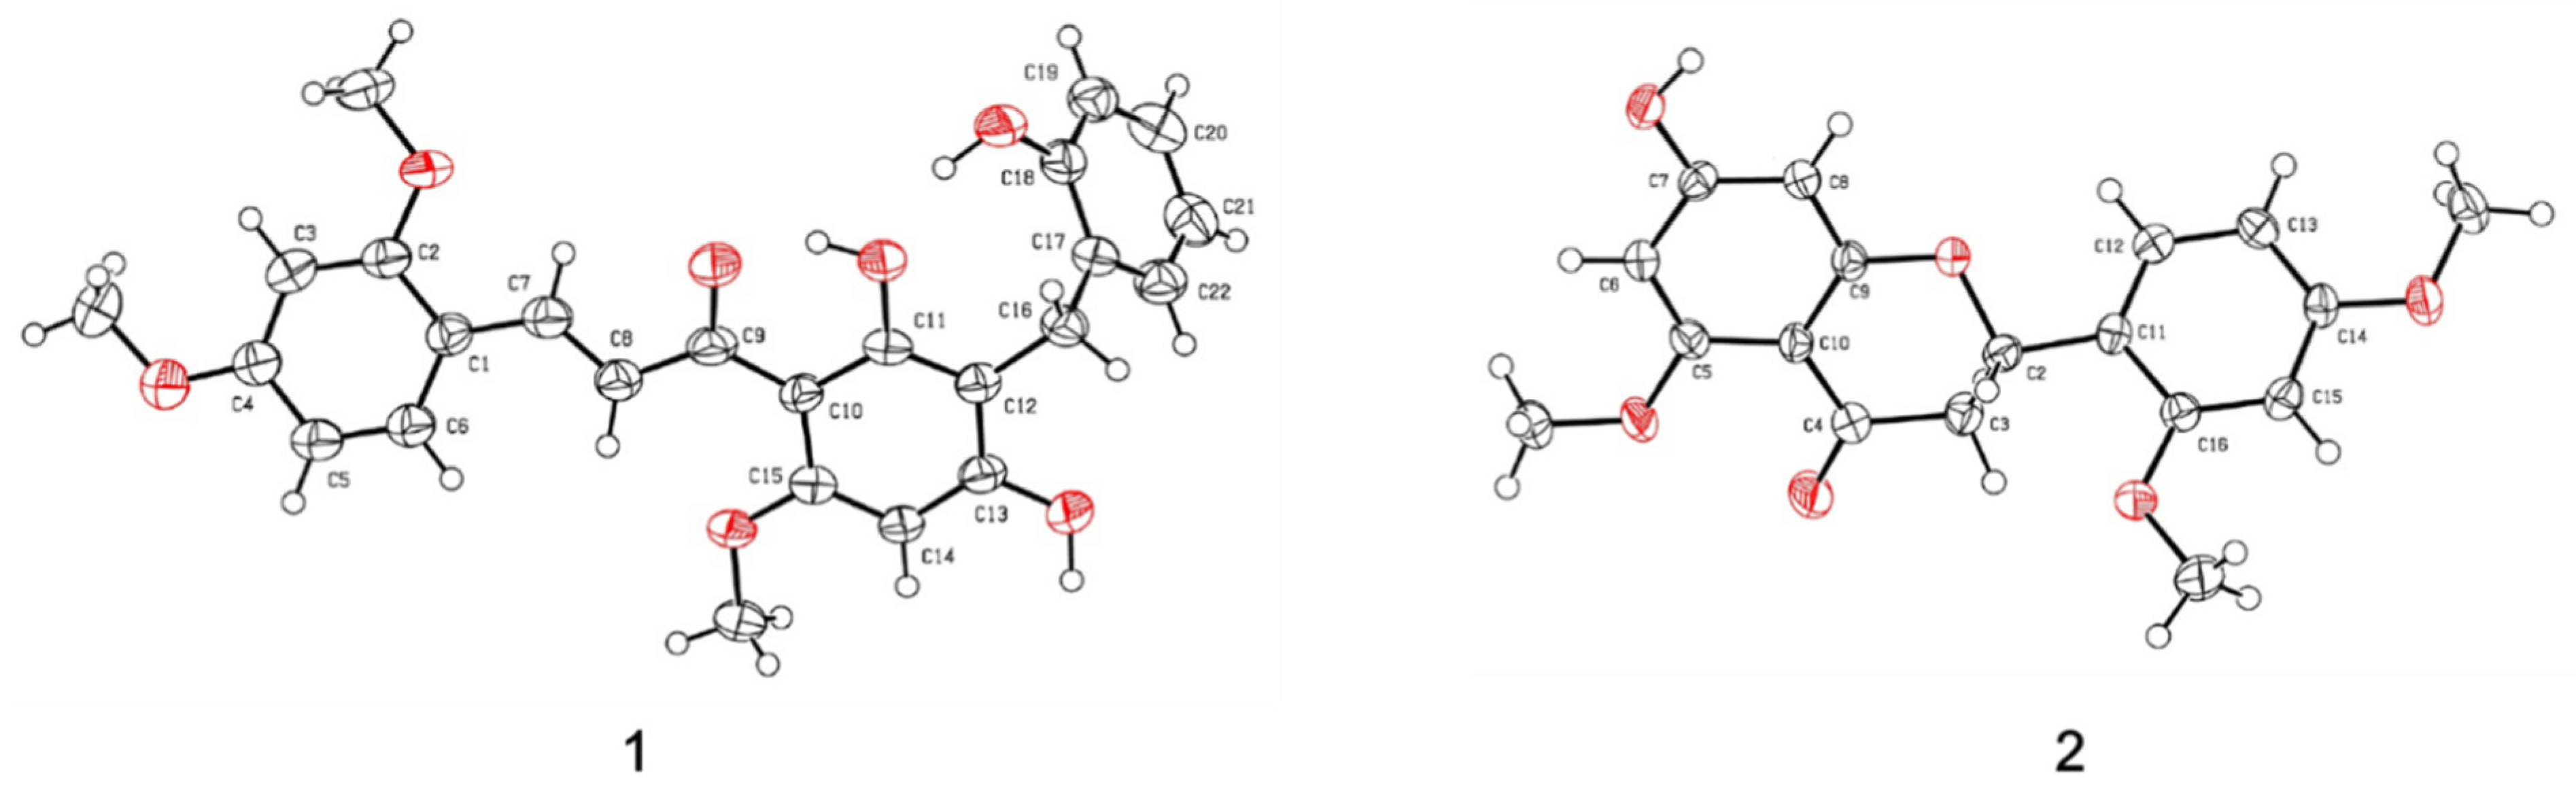
2.2. Structural Determination

The structures of the isolates were determined by the analysis of their spectral data (1H-NMR, 13C-NMR, DEPT, HSQC, HMBC, 1H-1H COSY, ultraviolet, infrared, and mass spectrometry).
The HR-ESI-MS of compound 1 showed a pseudo-molecular ion peak at m/z 435.1444 [M − H], consistent with the molecular formula of C25H24O7 (Calcd. for C18H23O7, 435.1438), containing 14 degrees of unsaturation. The IR spectrum revealed the absorptions of hydroxyl (3331 cm−1), and aromatic (1603, 1455 cm−1) functions. The UV absorption bands at 285 nm suggested that 1 possessed a benzaldehyde or acetophenone functional group. The 13C-NMR and DEPT spectra revealed that compound 1 was categorized into three methoxyl carbons at δC 56.1, 56.2, and 56.9; one methylene carbon at δC 23.2; 10 methine carbons at δC 92.5, 99.1, 107.0, 116.2, 120.3, 126.0, 127.7, 131.2, 131.5, and 138.5; as well as 11 quaternary carbons at δC 105.9, 108.2, 118.1, 128.2, 155.6, 161.2, 162.6, 164.1, 164.4, 166.4 and 193.5. Three sections (I–III, Figure 2) were established from key cross-peaks in the 1H-1H COSY spectrum (H-5/H-6, H-7/H-8, and H-19/H-20/H-21/H-22). In the HMBC spectrum, on the one hand, the cross-peaks of H-16 (δH 3.89) with C-11 (δC 166.4), C-12 (δC 108.2), C-13 (δC 164.4), C-17 (δC 128.2), C-18 (δC 155.6), and C-22 (δC 131.5) and that of H-14 (δH 6.20) with C-10 (δC 147.7), C-12, C-13, and C-15 (δC 145.9) revealed that compound 1 possessed a diphenylmethane structure (Figure 2). On the other hand, the correlations between H-7 (δH 8.02) and C-1 (δC 118.1), C-2 (δC 161.2), C-6 (δC 131.2, and C-9 (δC 193.5), as well as between H-3 (δH 6.64) with C-1 and C-5 (δC 107.0) allowed a cinnamaldehyde unit in 1. Additionally, three methoxy groups were substituted at the C-2, C-4, and C-15 positions due to their respective HMBC correlations. Moreover, the long-range correlations between H-8 and C-9 and C-10 decided the linkage of diphenylmethane and cinnamaldehyde units. The established structure of 1 as above was also consistent with a single-crystal X-ray diffraction analysis showing a perspective drawing, as shown in Figure 3. Accordingly, the structure of C-benzylated dihydrochalcone derivative (1) was determined as (E)-1-(3,5-dihydroxy-4-(2-hydroxybenzyl)-2-methoxyphenyl)-3-(2,4-dimethoxyphenyl) prop-2-en-1-one and was named thorechalcone A.
Compound 2 (7-hydroxy-5,2′,4′-trimethoxyflavanone) was obtained as an amorphous solid with the molecular formula C18H20O7 as analyzed by HRESIMS and had nine degrees of unsaturation. The IR spectrum exhibited absorption bands at 1584 and 1464 cm−1 for benzyl and strong absorption bands at 3417 cm−1 for hydroxy together with the UV bands at 230, 250, and 284 nm, which indicated the flavanone skeleton of 2. The 13C-NMR spectrum of 2 showed 18 carbon signals including eight quaternaries (including one conjugated carbonyl carbon at δC 187.9), six methines, one methylene, and three methoxyl (δC 55.3, 55.6, and 55.7) carbons via the 1H and 13C-NMR and HSQC correlation analyses. The proton signals at δH 5.55 (1H, dd, J = 12.5, 2.5 Hz), 2.95 (1H, dd, J = 16.5, 12.5 Hz), and 2.67 (1H, dd, J = 16.5, 2.5 Hz), and the corresponding carbon signals at δC 73.0 and 44.0, respectively, were characteristics of the oxygenated methine and methylene groups of a flavanone unit. Moreover, five aromatic protons were evident in the 1H-NMR spectrum, with splitting patterns characteristic of a 1,2,4-trisubstituted aromatic ring (δH 6.57, 1H, dd, J = 8.0, 2.0 Hz; 6.61, 1H, d, J = 2.0 Hz; and 7.38, 1H, d, J = 8.0 Hz), and two protons were assigned to H-6 (δH 5.95) and H-8 (δH 6.06) with w-coupling (J = 2.5 Hz). The A and B rings of the flavanone framework were established by the HMBC correlation of H-3 with C-2, C-4, C-1′; H-6′ with C-2, C-4′, C-2′; H-6 with C-5, C-7, C-10; and H-8 with C-7, C-9, C-10 (Figure 2). The chemical shift of C-4 at δC 187.9, together with the long-range heteronuclear correlations, indicated the existence of conjugated carbon at C-5 with a methoxyl group, and the other methoxyl groups were substituted at the C-2′ and C-4′ positions of the B ring. The planar structure of 2 was also confirmed by single-crystal X-ray diffraction analysis (Figure 3). Moreover, the S configuration of C-2 was deduced based on the CD spectrum of 2 exhibiting negative Cotton effects at 285 nm. Thus, the structure of 2 was elucidated as S-2-(2,4-dimethoxyphenyl)-7-hydroxy-5-methoxychroman-4-one, possessing the same structure as the reported cerasinone [15] as assigned only by the 1H-NMR data. However, additional spectroscopic evidence, including the 13C-NMR (Table 2) and X-ray diffraction data mentioned above were also provided here.
Compound 3 [(2E)-1-(2,4-Dihydroxy-6-methoxyphenyl)-3-(2,4-dimethoxyphenyl)-2-propen-1-one] was obtained as an amorphous yellow solid C18H18O6; ESIMS m/z 330 [M − H]. 1H-NMR (500 MHz, DMSO) δH: 7.89 (d, J = 16 Hz, 1H); 7.83 (d, J = 16 Hz, 1H); 7.63 (d, J = 9 Hz, 1H); 6.65 (d, J = 2.5 Hz, 1H); 6.62 (dd, J = 2.5, 8 Hz, 1H); 6.00 (d, J = 2 Hz, 1H); 5.90 (d, J = 2.5 Hz, 1H); 3.90 (s, 3H); 3.87 (s, 3H); 3.84 (s, 3H); 3.08 (s, 2H). 13C-NMR (125 MHz, DMSO) δC: 191.8, 166.4, 164.6, 162.8, 162.6, 159.9, 137.6, 130.6, 124.8, 116.3, 106.4, 105.1, 98.4, 95.9, 91.6, 55.9, 55.8, 55.5, The data were confirmed by the further comparison of the NMR data with those in the literature [16].
Compound 4 [(+)-Crotepoxide] was obtained as an amorphous white solid C18H18O8; ESIMS m/z 362 [M + Na]+. 1H-NMR (500 MHz, DMSO) δH: 7.98 (d, J = 10.5 Hz, 2H); 7.69 (t, J = 9.5 Hz, 1H); 7.55 (t, J = 10 Hz, 1H); 5.74 (d, J = 2.5 Hz, 1H); 6.62 (dd, J = 2.5, 8 Hz, 1H); 6.00 (d, J = 2 Hz, 1H); 5.90 (d, J = 2.5 Hz, 1H); 3.90 (s, 3H); 3.87 (s, 3H); 3.84 (s, 3H); 3.08 (s, 2H). 13C-NMR (125 MHz, DMSO) δC: 191.8, 166.4, 164.6, 162.8, 162.6, 159.9, 137.6, 130.6, 124.8, 116.3, 106.4, 105.1, 98.4, 95.9, 91.6, 55.9, 55.8, and 55.5. The data were confirmed by the further comparison of the NMR data with those in the literature [17].
Compound 5 [(−)-1,6-Desoxytingtanoxide] was obtained as an amorphous yellow oil C23H20O6; ESIMS m/z 392 [M + Na]+. 1H-NMR (500 MHz, CDCl3) δH: 8.05 (dd, J = 1, 8.5 Hz, 2H); 7.98 (dd, J = 1.5, 8 Hz, 2H); 7.58 to 7.53 (m, 2H); 7.42 (t, J = 10 Hz, 2H); 7.38 (t, J = 8 Hz, 2H); 6.32 (d, J = 5.5 Hz, 1H); 6.20 (dd, J = 5, 10 Hz, 1H); 6.06 (dd, J= 4.5, 9.5 Hz, 1H); 6.02 (d, J= 6.5 Hz, 1H); 5.74 (ddd, J= 6, 4, 1.5 Hz, 1H); 4.94 (d, J= 3 Hz, 2H), 2.03 (s, 3H). 13C-NMR (125 MHz, CDCl3) δC: 170.5, 166.5, 166.0, 133.6, 133.6, 131.6, 130.3, 130.2, 130.1, 128.8, 128.8, 126.4, 126.0, 125.5, 71.7, 70.1, 65.1, 21.3. The data were confirmed by the further comparison of the NMR data with those in the literature [18].
Compound 6 (O-Methoxybenzoyl benzoate) was obtained as an amorphous yellow solid C15H14O3; ESIMS m/z 242 [M + Na]+. 1H-NMR (500 MHz, CDCl3) δH: 8.11 (dd, J = 8.5, 1 Hz, 2H); 7.56 (t, J = 7.5 Hz, 1H); 7.44 to 7.48 (m, 3H); 7.35 (td, J = 7.5, 1.5 Hz, 1H); 7.0 (td, J = 1, 7.5 Hz, 1H); 6.94 (d, J = 8 Hz, 1H); 5.45 (s, 2H); 3.89 (s, 3H); 13C-NMR (125 MHz, CDCl3) δC: 166.6, 157.5, 132.9, 130.5, 129.7, 129.4, 128.3, 124.5, 120.5, 110.5, 62.2, 55.5. The data were confirmed by the further comparison of the NMR data with those in the literature [19].
Compound 7 (Sandaracopimaric acid) was obtained as an amorphous yellow solid C20H30O2; ESIMS m/z 302 [M − H]. 1H-NMR (500 MHz, acetone-d6) δH: 5.77 (dd, J = 14, 9 Hz, 1H); 5.23 (s, 1H); 4.9 (dd, J = 14.5, 1.5 Hz, 1H); 4.86 (dd, J = 9, 1Hz, 1H); 2.24 (ddd, J = 2, 4, 11.5 Hz, 1H); 2.09 (m, 1H); 1.97 (d, J = 10.5, 2 Hz, 1H); 1.82 (s, 3H); 1.79 (s, 3H); 1.78 (s, 3H); 1.63 (overlap)1.56 (overlap), 1.47 (overlap), 1.44 (dd, J= 10.5, 3.5 Hz, 1H), 1.36 (ddd, J = 3, 9, 11 Hz, 1H), 1.28 (m, 1H), 1.19 (s, 3H), 1.16 (td, J = 3, 11 Hz, 1H), 1.04 (s, 3H), 0.87 (s, 3H). 13C-NMR (125 MHz, acetone-d6) δC: 179.1, 148.7, 136.7, 128.8, 109.7, 50.7, 48.9, 46.7, 38.3, 37.6, 37.2, 36.9, 35.4, 34.4, 25.5, 24.7, 18.4, 18.0, 16.6, and 14.7. The data were confirmed by the further comparison of the NMR data with those in the literature [20].
The 13C-NMR, 1H-NMR and ESIMS data of 17 are shown in the supplementary section as Figures S1–S22.

2.3. Evaluation of the Anticancer Potential of Isolated Compounds

In the present study, an MTT cell proliferation assay was deployed for assessing the cytotoxicity of the fractions and isolated compounds. The high level of MTT reduction correlated to the high proliferation of cancer cells. The number of viable cells led to a large amount of formazan, which was created in a culture. Mitomycin c, which is a positive control, was used as a reference compound for all the cytotoxic assays in this study.
As shown in Table 3, the cytotoxicity of compounds 16 was tested on four cancer cell lines (A549, WiDr, HepG2, and MCF-7) by the MTT assay. The compounds 1 and 3 exhibited stronger cytotoxic activities on cell lines A549, WiDr, and HepG2, due to their possessing a chalcone structure. Interestingly, compound 1 had more potent cytotoxicity against the three cell lines than that of 3, based on the additional o-hydroxybenzyl moiety in structure 1. Although the remaining compounds 46 displayed moderate activities on different cell lines, this study was the first to report antiproliferation on four tumor cell lines for 4 and 5. In previous reports, 4 ((+)-crotepoxide) showed antimutagenicity in a Vitotox assay [17] and 1,6-deoxytingtanoxide (5) displayed mild cytotoxicity against human pancreatic cancer cell lines [21]. The bioassay data showed that compound 6 (O-methoxybenzoyl benzoate) did not have significant cytotoxicity on MCF-7; this result correlated with a previous study [22].

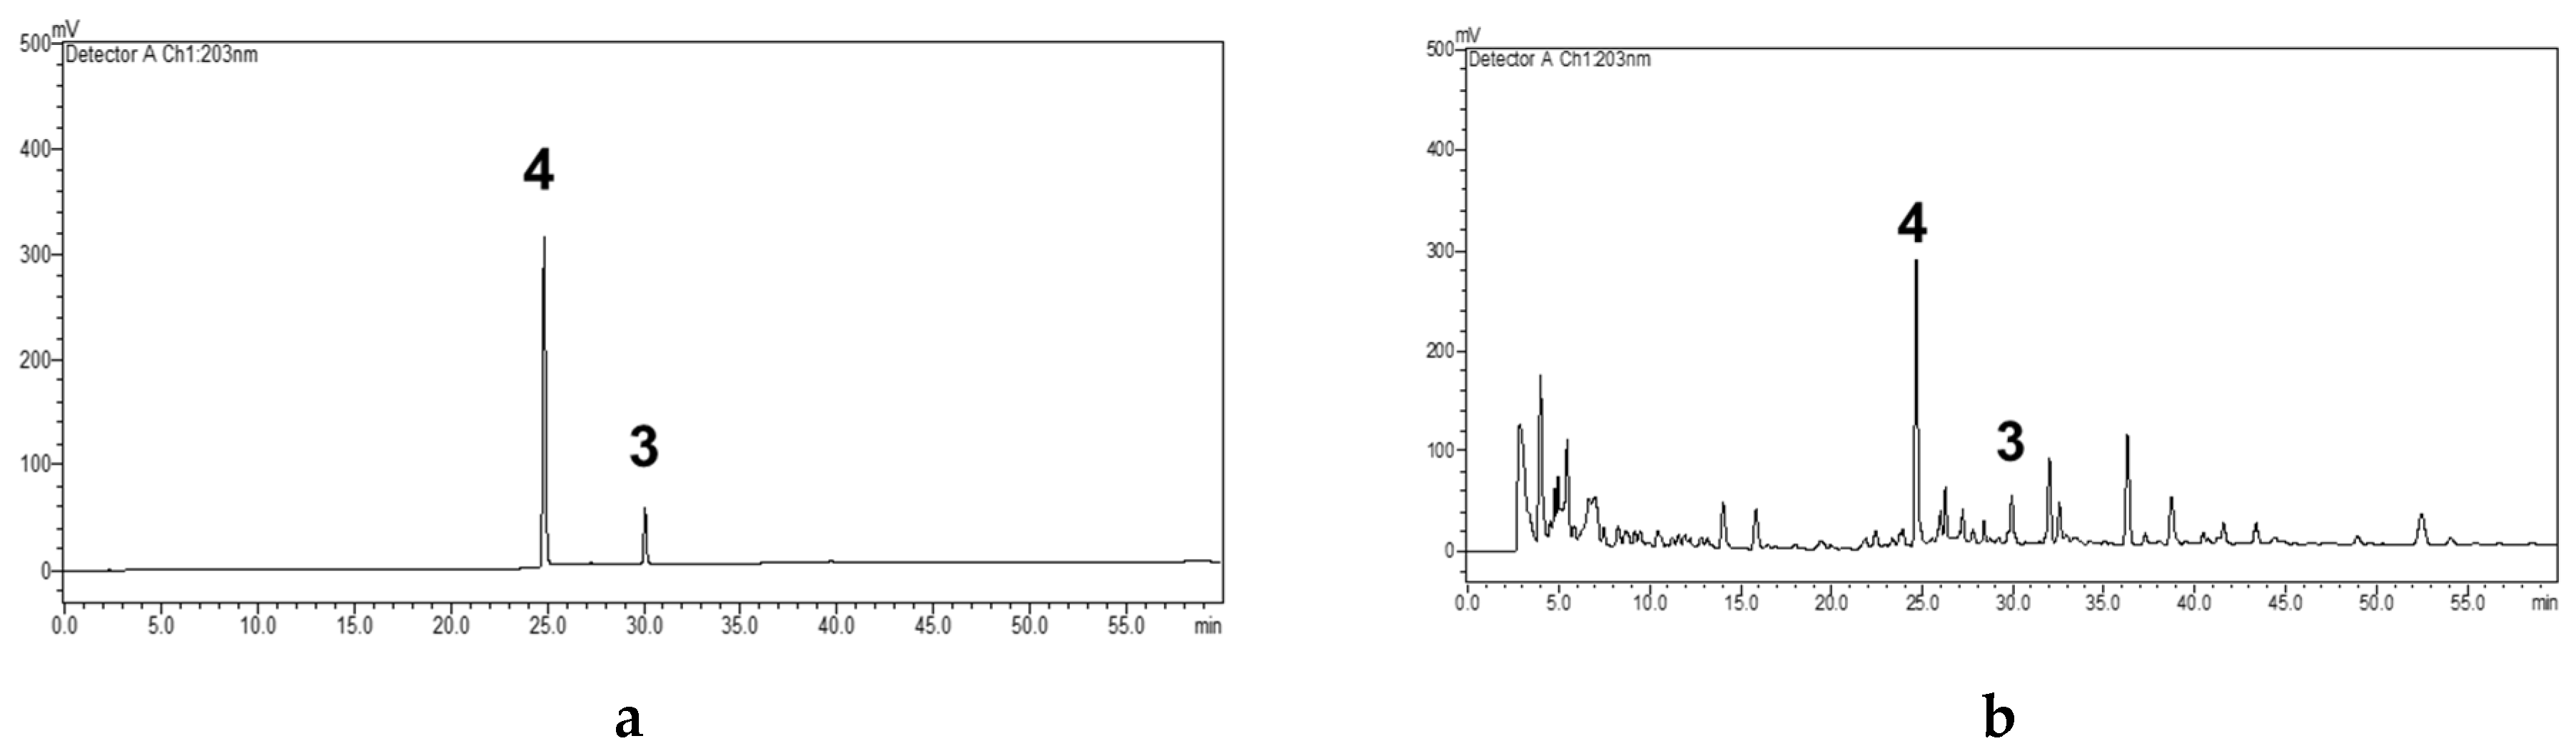
2.4. Quantitative Analysis of Compounds 3 and 4

The validated method was applied to the quantitative analysis of bioactive compound 3 and major yielded compound 4 from the S. thorelii rhizome. It was considered that 210 nm could be best used to analyze the profile of the compounds after comparing the record of the chromatograms of the extract solution running at wavelengths within 200 to 550 nm. Good linearity was obtained for each of constituents (R2 > 0.995). The titled plant sample, Stahlianthus thorelii, was collected from three different areas in December 2018 (shown in Table 4). The quantitation was determined with three preparative samples and was analyzed three times. The concentrations were detected based on a linear regression and the average contents were obtained (p < 0.01). The contents of compounds 3 and 4 in the S. thorelii rhizome were 0.106% and 0.013%, respectively.

2.5. Validation of the HPLC-UV Analysis Method

To evaluate the quality of S. thorelii, two major compounds, 4 and anticancer 3, were retained for their quantification in the plant material. The HPLC-UV method was validated in terms of the analysis of the system suitability, specificity, precision, accuracy, linearity, and limits of detection and quantification. The validation summary is found in Table 5.
According to ICH guidelines, system suitability testing is based on the concept that the equipment, electronics, analytical operations, and samples to be analyzed constitute an integral system that can be evaluated as such. Testing is checked by calculating the retention time (tR), peak area (A), theory plate (N), and resolution (Rs) factors. A residual sum of the squares of all the calculated parameters that is less or more than 2%, is within the acceptable limits, indicates good selectivity of the method, and ensures system performance. The linearity of this method was confirmed by a linear regression function. The calculations were based on seven different concentrations (n = 7). The regression equations were calculated using y = 32638x (R2 = 0.9956) and y = 57440x (R2 = 0.9969) for compounds 4 and 3, respectively, as illustrated in Table 5.
The limit of detection (LOD) and limit of quantification (LOQ) were determined by calculating them as three and 10 times the intensity of the baseline noise, respectively. The LOD and LOQ of compound 4 were 0.05 and 0.17 µg/mL, respectively, and the LOD and LOQ of compound 3 were 0.025 and 0.08 µg/mL, respectively. The specificity of the method was investigated. Specificity represents the ability to assess an analyte unequivocally in the presence of components which may be expected to be present by comparing the retention time and the UV spectra with the standard. As can be seen from Figure 2, the retention times of the compound 4 peak (24.8 min) and the compound 3 peak (30.0 min) in the sample were the same as the peaks in the standard. In addition, the peaks in the sample separated absolutely, and the peak area went up when adding the standards into the sample. Whereas, in the blank sample, there was no peak in the retention time of compound 4 and compound 3. This result indicated that the method could be used to analyze compound 4 and compound 3. Furthermore, the solvent did not influence the major compound peaks, and PAD purity studies confirmed the purity of the investigated peaks.
The repeatability was determined using six samples (n = 6) by calculating the retention time and the peak area. The RSDs of all the calculated parameters were less than or equal to 2% (retention time) and 5.3% (peak area). The accuracy was calculated based on the recovery concentration in three levels. The amount of the standard was put into the powdered rhizome at a ratio of 80%, 100%, and 120% of the content of compounds 4 and 3 in the sample. According to the calculated concentrations of compounds 4 and 3, the percentage of recovery of these compounds could be determined and the recovery parameters were less than or equal to 5.3%.

3. Materials and Methods

3.1. General Experimental Procedures

The ESI-MS data were obtained on a VQ Quattro 5022 mass spectrometer (VG-Biotech PVT). The HR-ESI-MS data were measured on a Finnigan MAT-95XL mass spectrometer. The NMR spectra were recorded on Bruker AVANCE400 (Burker Co., Rheinstetten, Germany) (400 MHz), Varian Unity Inova 500 MHz FT-NMR, and Varian VNMRS 600 spectrometers. (Palo Alto, CA, USA). A Sephadex LH-20 (GH Healthcare) (Chicago, IL, USA) Strata C18-E (55 μM, 70 Å) 10 g/60 mL, and Giga Tubes (Phenomenex) (Torrance, CA, USA) were used for column chromatography. HPLC was conducted on a Shimadzu LC-6AD series apparatus with an SPD-6AV UV-VIS detector that was equipped with a preparative Cosmosil 5C18 AR-II column (2.0 mm I.D. × 250 mm, 5 μM) (Nacalai Tesque, Inc., Kyoto, Japan). The single-crystal X-ray diffraction measurements were carried out on a Brucker D8 Venture Dual X-ray Single Crystal Diffractometer.

3.2. Plant Material

The plant material of S. thorelii was collected in An Giang Province, in the south of Vietnam, in 2017. The material was identified by the Faculty of Pharmacy, University of Medicine and Pharmacy at Ho Chi Minh City, where the voucher specimen (STV-20170224) was deposited. The rhizomes were dried and ground.

3.3. Extraction and Isolation

Air-dried rhizoma of S. thorelii (15 kg) were extracted three times using 95% ethanol (40 L) at 40 °C for 24 h each time. The extract was evaporated under reduced pressure to get the crude extract (500 g). Next, the extracted ethanol of S. thorelii was suspended and dissolved in 500 mL of H2O and partitioned continually by ethyl acetate and n-butanol (3 × 800 mL). After evaporation in a vacuum, fractions were prepared sequentially by ethyl acetate fraction (SEA) (120 g, 24%), n-butanol fraction (SBU) (40.5 g, 8.1%), and aqueous fraction (SW) (320 g, 64%) from the ethanol extracts.
On the basis of the results of the cytotoxic assay, SEA (20 g) was selected to further isolate the active compounds. Furthermore, SEA was subjected to Sephadex (500 g) and eluted with methanol with a flow rate of 4.0 mL/min. All nine subfractions were collected by testing in TLC, and three compounds, 4 (74.0 mg), 1 (22.0 mg), and 3 (42.0 mg), were isolated in the precipitate form from subfraction SF3, and two potent cytotoxic subfractions, SF9 and SF7, respectively. SF7 (112 mg) was subjected to the reversed-phase preparative HPLC (Cosmosil 5C18 AR-II column; 2.0 mm I.D. × 250 mm, 5 μM, (Nacalai Tesque, Inc., Kyoto, Japan). with a flow rate of 10 mL/min, and 55% acetonitrile was used as a solvent system. Subfractions were yielded at 210 nm, and compound 2 (tR = 8.36 min, 2.0 mg) was collected along with compound 3 (tR = 20.13 min, 36.0 mg). SF3 (3.2 g) was separated by a C18 gel flask column eluted with acetonitrile (ACN)/H2O (1:9 to 7:3) and then a reversed-phase semi-preparative HPLC (Cosmosil 5C18 AR-II column; 2.0 mm I.D. × 250 mm, 5 μm, (Nacalai Tesque, Inc., Kyoto, Japan). was used to yield compound 7 (tR = 82.52 min, 1.2 mg) from SF3.6 with 65% ACN under UV 210 nm. Using the same condition of semi-preparative HPLC as SF3.6, compounds 6 (tR = 52.14 min, 2.0 mg) and 5 (tR = 74.52 min, 17.0 mg) were yielded from SF 3.5.
Thorechalcone A (1) A white amorphous powder; [ α ] D 25 −1.4 (c 0.1, MeOH); UV (MeOH) λmax 193, 285, 383 nm. IR (KBr) νmax 3331, 1602, 1536, 1454, 1223, 1108, and 1026 cm−1; 1H and 13C-NMR spectroscopic data (Acetone-d6) are shown in Table 1; HR-ESI-MS m/z 435.1444 [M − H] (calcd. for C25H23O7, 435.1438).

3.4. X-ray Crystallographic Analysis

Thorechalcone A (1) A colorless crystal (0.64 × 0.09 × 0.01 mm3) was obtained by simple evaporation from an ACN solution. The crystal data were as follows: C25H24O7, orthorhombic, a = 16.253(3) Å, b = 8.3312(12) Å, c = 15.726(3) Å, V = 2094.7(6) Å3, space group P21/c, Z = 4, Dcalcd 1.384 Mg/m3, λ = 0.71073 Å, absorption coefficient 0.101 mm−1, F(000) = 920, and T = 200(2) K. A total of 34,249 reflections were collected, of which 3697 independent reflections [Rint = 0.1865] with I > 2σ (I) were used for the analysis. The data were solved using the direct method, and the structure was refined by full-matrix least-squares on F2 values. All non-hydrogen atoms were refined with anisotropic thermal parameters. The hydrogen atom positions were idealized geometrically and allowed to ride on their parent atoms. The final indices were R1 = 0.0593, wR2 = 0.1337 with goodness-of-fit = 1.056. The final X-ray model is shown in Figure 3. The crystallographic data of compound 1 were deposited in the Cambridge Crystallographic Data Centre (CCDC), and the CCDC deposition number is CCDC 1948088.
7-Hydroxy-5,2′,4′-trimethoxyflavanone (2) A colorless crystal (0.79 × 0.05 × 0.02 mm3) was obtained by simple evaporation from an MeOH solution. The crystal data were as follows: C18H18O6, orthorhombic, a = 4.9370(2) Å, b = 14.8773(7) Å, c = 21.5417(11) Å, V = 1582.22(13) Å3, space group P212121, Z = 4, Dcalcd 1.387 Mg/m3, λ = 0.71073 Å, absorption coefficient 0.104 mm−1, F(000) = 696, and T = 200(2) K. A total of 8424 reflections were collected, of which 2756 independent reflections [Rint = 0.0625] with I > 2σ (I) were used for the analysis. The data were solved using the direct method, and the structure was refined by full-matrix least-squares on F2 values. All non-hydrogen atoms were refined with anisotropic thermal parameters. The hydrogen atom positions were idealized geometrically and allowed to ride on their parent atoms. The final indices were R1 = 0.0405, wR2 = 0.0853 with goodness-of-fit = 1.062. The final X-ray model is shown in Figure 3. The crystallographic data of compound 2 were deposited in the Cambridge Crystallographic Data Centre (CCDC), and the CCDC deposition number is CCDC 1949802.

3.5. Colorimetric MTT In Vitro Assay

An MTT assay was employed to evaluate the proliferation of a number of cancer cell lines. Human lung carcinoma (A549), human breast adenocarcinoma (MCF-7), human colon adenocarcinoma (WiDr), and human hepatocellular carcinoma (Hep G2) were cultured in 75-T flasks with MEM supplemented with 5% FBS and a 1% penicillin-streptomycin antibiotics suspension. The cell suspensions after trypsinizing were seeded in 96-well plates at densities of 3000 cells per well. The 96-well plates were then incubated at 37 °C/5% CO2 to adhere the cell to the surface of the plate. After reaching the confluence (80%), the cells were treated with 200 µL medium containing 20 to 80 µg/mL of the extract(s) and the fraction(s), and 1 to 40 µg/mL of the pure compound(s), and incubated for 72 h before reading the results. Later, the medium was removed by vacuum suctioning and 200 µL of 0.2 mg/mL MTT was added for 4 h at 37 °C. At the end of the incubation, the MTT was discharged, and 200 µL of dimethyl sulfoxide (DMSO) was added into 96-well plates. The absorbance of the solution was measured at 570 nm by a microplate reader (Dynatech, MR 7000) (Dynatech Labs, Chantilly, VA, USA). The same procedure was conducted with mitomycin c (positive control) at a concentration of 0.4, 0.2, and 0.1 µg/mL. The mean IC50 was the inhibitor concentration, which reduced the proliferation of cells by 50%; this value was determined under the experimental conditions and calculated by the average of at least three independent tested results.
The cell viability was measured using this equation:
%   Inhibition = Average   OD   ( control ) Average   OD   ( treated ) Average   OD   ( control )   ×   100

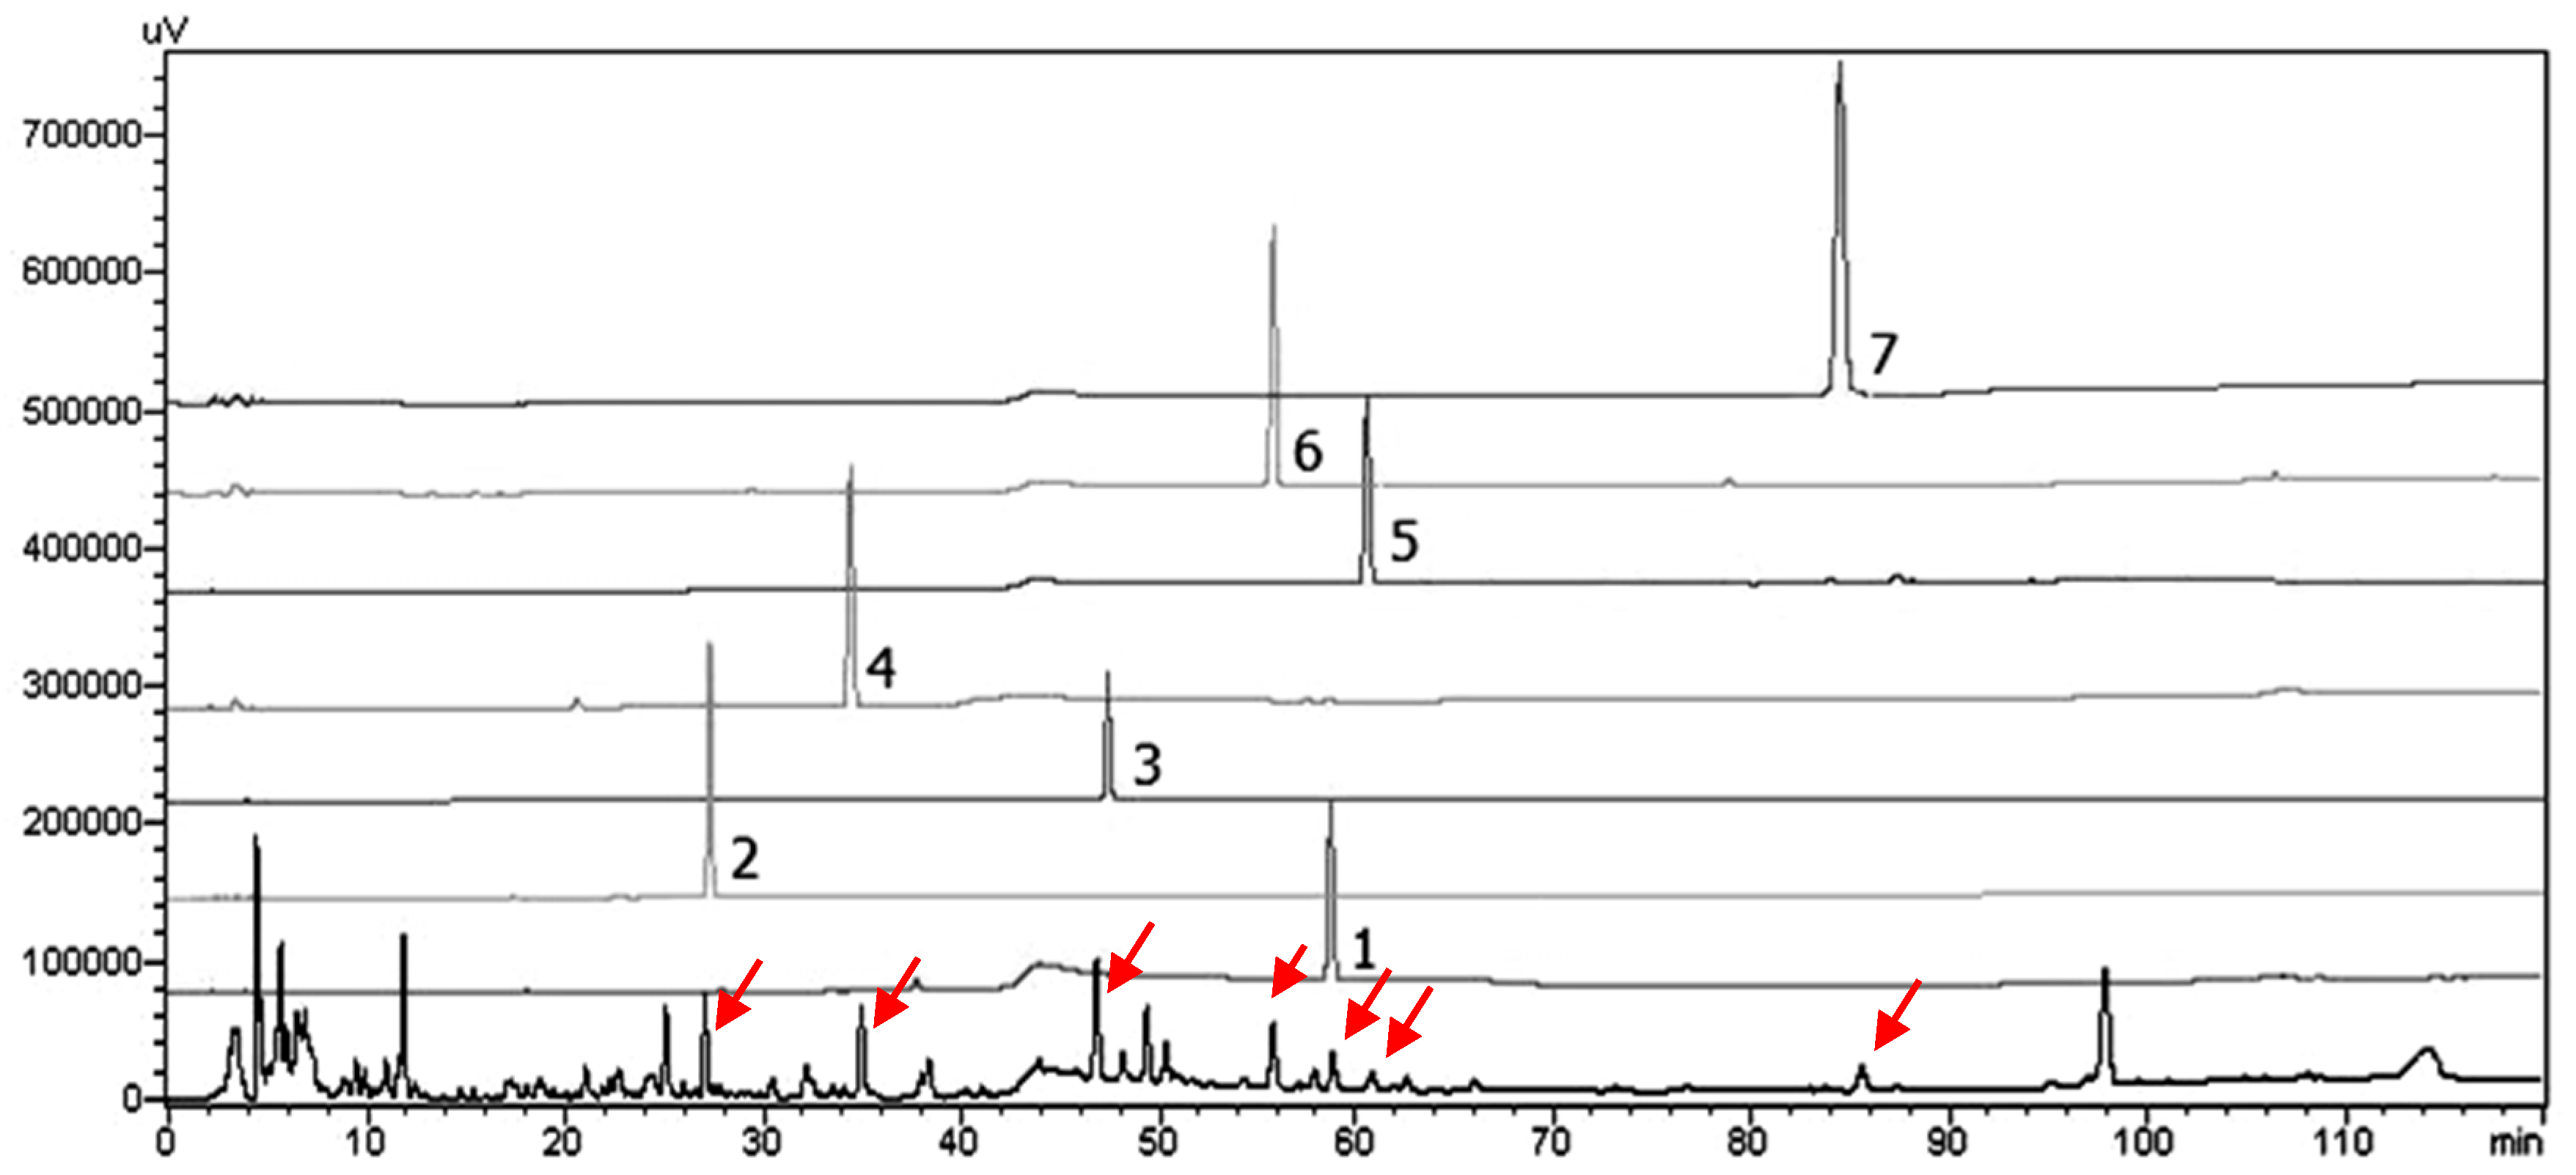
3.6. HPLC-SPD Separation Profile for Analysis of Seven Isolates from S. thorelii

The HPLC-SPD analysis was performed using a 250 × 4.6 nm i.d., 5 µM, Cosmosil C18 column with an LC-20AT pump and an SPD-10A diode array detector (Shimazu). (Shimadzu, Kyoto, Japan). The mobile phase flow rate and the injection volume were 0.8 mL/min and10 µL, respectively. The wavelengths were set at 203 and 254 nm. The mobile phase was comprised of H2O (A) and ACN (B) and used a gradient program of separation condition as: 255 to 35% B from 0 to 15 min, 35% to 40% B from 15 to 20 min, 40% to 45% B from 20 to 30 min, 45% to 50% B from 30 to 35 min, 50% to 60% B from 35 to 45 min, 60% to 65% B from 45 to 55 min, 65% to 75% B from 55 to 85 min, and 75% to 100% B from 85 to 100 min (Figure 4).

3.7. Quantitation of Bioactive Compound 3 and Major Yielded Compound 4

Concentrated solutions of two standards (3 and 4) were prepared in the ACN, each at 1000 mg/L. After diluting the stock solutions with ACN to obtain the developing solutions, seven concentration levels were found in the range of 2.5–500 mg/L. The worked solutions were filtered by a PVDF filter (0.45 µM, Millipore) before HPLC injection. Linear regression analysis was applied to achieve linearity by the integrated peak areas (Y) vs. the concentration of each standard (X, mg/L) at five different concentrations.
Analysis conditions: 35% to 40% B from 0 to 15 min, 40% to 60% B from 15 to 20 min, 60% B from 20 to 25 min, 60% to 70% B from 25 to 35 min, and 70% to 80% B from 35 to 60 min.

3.7.1. Validation of the HPLC-UV Method

According to the ICH harmonized tripartite guidelines, validation of the analytical procedure included system suitability, accuracy, repeatability, specificity, detection limit, quantitation limit, and linearity. Samples, calibration, and validation standards were prepared separately.

3.7.2. Preparation of Calibration Standards

This study measured 10.0 mg of compounds 3 and 4, respectively, into a volumetric flask and diluted them to 10.0 mL with MeOH. Next, 250 µL of each solution were placed into a volumetric flask and diluted to 10.0 mL with MeOH. The final concentrations for compound 4 and compound 3 were 250 µg/mL and 55 µg/mL, respectively. Finally, 2 mL of this solution was filtered through a PVDF filter (0.45 µM, Millipore) for HPLC analysis.

3.7.3. Preparation of Validated Extracted Samples

This study measured 2.0 g of the powdered S. thorelii rhizome into a 50.0 mL glass Erlenmeyer flask, to which 20.0 mL of MeOH was added. The solution was then ultrasonicated three times for 30 min before being filtered and evaporated to about 5.0 mL of a concentrated extract. The concentrated extract was put into a 20.0 mL volumetric flask, rinsed two times with 5.0 mL of MeOH, ultrasonicated, and diluted to 10.0 mL with MeOH. Finally, 2.0 mL of this solution was filtered through a PVDF filter (0.45 µm, Millipore) for HPLC analysis.

3.8. Statistical Analysis

The results obtained were displayed as mean ± standard errors (SD). The experiments were conducted in triplicate on three different occasions. Statistical analyses were performed using SPSS software (IBM SPSS® software 20) (SPSS Inc., Chicago, IL, USA). The difference between two or more groups based on one-way of ANOVA multiple comparisons, where p < 0.01 indicates statistical significance. Inhibitory concentrations at (IC50) were attained from the Sigma plot (12.5) using the nonlinear regression equation log (concentration) versus response–variable slope.

4. Conclusions

Bioassay-guided isolation yielded seven compounds from 95% EtOH extract of S. thorelii, compound 1 was a new C-benzylated dihydrochalcone derivative, compound 3 [(2E)-1-(2,4-dihydroxy-6-methoxyphenyl)-3-(2,4-dimethoxyphenyl)-2-propen-1-one] was isolated from a plant for the first time, and this was the first time for the other compounds to be reported in this plant. The effective antiproliferative extracts and compounds yielded from S. thorelii through our studies provide scientific evidence to support this plant serving as a folk medicine to reduce tumor size. The bioassay results also revealed that dihydrochalcone derivatives 1 and 3 had promising cytotoxic effects against the HepG2 and WiDr cell lines.
Similar to the first report, the contents of the major compounds in S. thorelii were determined simultaneously by a simple, accurate, and rapid HPLC-UV data. Compound 3, the most potent anticancer isolated compound, together with the major yielded isolate, compound 4 [(+)-Crotepoxide], were chosen as analytical markers of this species. The quantification data of 4 and 3, as shown in Figure 5 and Table 5, concluded that the content of these analytical markers was suitable for comparing the titled plants collected in several areas. It is suggested that this validated method could be applied for the quality control of this herbal medicine in the future.

Supplementary Materials

The following are available online at https://www.mdpi.com/1420-3049/25/3/551/s1.

Author Contributions

N.-L.N., T.-H.V., M.-C.C., and Y.-H.K. conceived and designed the experiments; N.-L.N. carried out the plant extraction and isolation of the compound; Z.-H.L. carried out biological studies; Y.-H.K. and M.-C.C. supervised various parts of the work; Y.-C.L. and C.-C.L. assisted with the interpretation of various data; N.-L.N., T.-H.V., Y.-C.L., C.-C.L., and Y.-H.K. contributed to the writing of the manuscript. All authors have read and agreed to the published version of the manuscript.

Funding

This work was supported by grants from the Ministry of Science and Technology (MOST104-2320-B-077 -006 -MY3, MOST107-2320-B-077-003-MY3), Taiwan, and from the Ministry of Health and Welfare (New Southbound Policy-NRICM-NSP-108-01), Taiwan.

Conflicts of Interest

The authors declare no conflict of interest.

Abbreviations

A549human lung adenocarcinoma
CANacetonitrile
ATCCAmerican type culture collection
CDCl3chloroform
DMSO dimethyl sulfoxide
HepG2human liver adenocarcinoma
HPLChigh performance liquid chromatography
HR-ESI-MShigh resolution electrospray ionization mass spectrometry
IC5050% inhibitory concentration
MCF-7human breast adenocarcinoma
WiDrhuman colon adenocarcinoma
MTT3-(4,5-dimethylthiazol-2-yl)-2,5-diphenyl tetrazolium
MEMminimum essential medium
NMRnuclear magnetic resonance
ODoptical density
PBSphosphate buffered saline
TLCthin-layer chromatography
MeOHmethanol
COSYcorrelation spectroscopy
HMBCheteronuclear multiple bonds correlation
NOESYnuclear Overhauser effect spectroscopy
DEPTdistortionless enhancement by polarization transfer
FBSfetal bovine serum
m/zmass to charge ratio
Hzhertz
CCcolumn chromatography
HSQChomonuclear single quantum correlation
UVultraviolet spectroscopy
ICHInternational Conference Harmonization
PVDFpolyvinylidene fluoride
RSDrelative standard deviation
IRInfrared spectroscopy
HT29human colon adenocarcinoma
B164A5murine melanoma
JAK/STATJanus kinase/signal transducers and activators of transcription
EtOAcethyl acetate
CDcircular dichroism
SPDphotodiode array detector
ANOVAanalysis of variance

References

  1. Lu, C.L.; Zhao, H.Y.; Jiang, J.G. Evaluation of multi-activities of 14 edible species from Zingiberaceae. Int. J. Food Sci. Nutr. 2013, 64, 28–35. [Google Scholar] [CrossRef] [PubMed]
  2. Kirana, C.; Record, I.R.; McIntosh, G.H.; Jones, G.P. Screening for antitumor activity of 11 species of indonesian zingiberaceae using human MCF-7 and HT-29 cancer cells. Pharma. Biol. 2003, 41, 271–276. [Google Scholar] [CrossRef]
  3. Danciu, C.; Vlaia, L.; Fetea, F.; Hancianu, M.; Coricovac, D.E.; Ciurlea, S.A.; Şoica, C.M.; Marincu, I.; Vlaia, V.; Dehelean, C.A.; et al. Evaluation of phenolic profile, antioxidant and anticancer potential of two main representants of Zingiberaceae family against B164A5 murine melanoma cells. Biol. Res. 2015, 48, 1–9. [Google Scholar] [CrossRef] [Green Version]
  4. Rao, K.V.; Samikkannu, T.; Dakshayani, K.B.; Zhang, X.; Sathaye, S.S.; Indap, M.A.; Nair, M.P. Chemopreventive potential of an ethyl acetate fraction from Curcuma longa is associated with up-regulation of p57kip2 and Rad9 in the PC3M prostate cancer cell line. Asian Pac. J. Cancer Prev. 2012, 13, 1031–1038. [Google Scholar] [CrossRef] [PubMed] [Green Version]
  5. Cheng, X.L.; Liu, Q.; Peng, Y.B.; Qi, L.W.; Li, P. Steamed ginger (Zingiber officinale): Changed chemical profile and increased anticancer potential. Food Chem. 2011, 129, 1785–1792. [Google Scholar] [CrossRef]
  6. Park, G.H.; Park, J.H.; Song, H.M.; Eo, H.J.; Kim, M.K.; Lee, J.W.; Lee, M.H.; Cho, K.H.; Lee, J.R.; Cho, H.J.; et al. Anti-cancer activity of Ginger (Zingiber officinale) leaf through the expression of activating transcription factor 3 in human colorectal cancer cells. BMC Complement. Altern. Med. 2014, 14, 408. [Google Scholar] [CrossRef] [PubMed] [Green Version]
  7. Kirana, C.; Record, I.R.; Jones, G.P.; McIntosh, G.H. Anticancer properties of panduratin A isolated from Boesenbergia pandurata (Zingiberaceae). J. Nat. Med. 2007, 61, 131–137. [Google Scholar] [CrossRef]
  8. Muangnoi, P.; Lu, M.; Lee, J.; Thepouyporn, A.; Mirzayans, R.; Le, X.C.; Weinfeld, M.; Changbumrung, S. Cytotoxicity, Apoptosis and DNA Damage Induced by Alpinia galangal Rhizome Extract. Planta Med. 2007, 73, 748–754. [Google Scholar] [CrossRef] [Green Version]
  9. Li, Y.; Sun, W.; Han, N.; Zou, Y.; Yin, D. Curcumin inhibits proliferation, migration, invasion and promotes apoptosis of retinoblastoma cell lines through modulation of miR-99a and JAK/STAT pathway. BMC Cancer 2018, 18, 1230. [Google Scholar] [CrossRef] [Green Version]
  10. Li, Q.M.; Luo, J.G.; Wang, R.Z.; Wang, X.B.; Yang, M.H.; Luo, J.; Kong, L.Y. Involucratusins A-H: Unusual Cadinane Dimers from Stahlianthus involucratus with Multidrug Resistance Reversal Activity. Sci. Rep. 2016, 6, 29744. [Google Scholar] [CrossRef]
  11. Vo, V.C. Tu dien cay thuoc Viet Nam-Vietnamese Herbal Medicine Dictionary; Medical Publishing House: Ha Noi, Vietnam, 2012; pp. 769–770. [Google Scholar]
  12. Yu, J.G.; Chen, Y.H.; Fang, H.J. Studies on the medicinal plants of Chinese Zingiberaceae. Acta. Pharm. Sin. 1983, 18, 839–842. [Google Scholar]
  13. Li, Q.M.; Luo, J.G.; Zhang, Y.M.; Li, Z.R.; Wang, X.B.; Yang, M.H.; Luo, J.; Sun, H.B.; Chen, Y.J.; Kong, L.Y. Involucratustones A-C: Unprecedented sesquiterpene dimers containing multiple contiguous quaternary carbons from stahlianthus involucratus. Chemistry 2015, 21, 13206–13209. [Google Scholar] [CrossRef] [PubMed]
  14. Pingsusaen, P.; Kunanusorn, P.; Khonsung, P.; Chiranthanut, N.; Panthong, A.; Rujjanawate, C. Investigation of anti-inflammatory, antinociceptive and antipyretic activities of Stahlianthus involucratus rhizome ethanol extract. J. Ethnopharmacol. 2015, 162, 199–206. [Google Scholar] [CrossRef] [PubMed]
  15. Nagarajan, G.R.; Parmar, V.S. Three new flavonoids in Prunus cerasus. Phytochemisty 1977, 16, 1317–1318. [Google Scholar] [CrossRef]
  16. Aponte, J.C.; Castillo, D.; Estevez, Y.; Gonzalez, G.; Arevalo, J.; Hammond, G.B.; Sauvain, M. In vitro and in vivo anti-Leishmania activity of polysubstituted synthetic chalcones. Bioorg. Med. Chem. Lett. 2010, 20, 100–103. [Google Scholar] [CrossRef]
  17. Makhuvele, R.; Foubert, K.; Apers, S.; Pieters, L.; Verschaeve, L.; Elgorashi, E. Antimutagenic constituents from Monanthotaxis caffra (Sond.) Verdc. J. Pharm. Pharmacol. 2018, 70, 976–984. [Google Scholar] [CrossRef] [Green Version]
  18. Montree Kodpinida, C.S. Chachanat Thebtaranonth, Yodhathai Thebtaranont, Structures of β-senepoxide, tingtanoxide, and their diene precursors. Constituents of Uvaria ferruginea. Tetrahedron Lett. 1983, 24, 2019–2022. [Google Scholar] [CrossRef]
  19. Awale, S.; Ueda, J.Y.; Athikomkulchai, S.; Abdelhamed, S.; Yokoyama, S.; Saiki, I.; Miyatake, R. Antiausterity agents from Uvaria dac and their preferential cytotoxic activity against human pancreatic cancer cell lines in a nutrient-deprived condition. J. Nat. Prod. 2012, 75, 1177–1183. [Google Scholar] [CrossRef]
  20. Muto, N.; Tomokuni, T.; Haramoto, M.; Tatemoto, H.; Nakanishi, T.; Inatomi, Y.; Murata, H.; Inada, A. Isolation of apoptosis- and differentiation-inducing substances toward human promyelocytic leukemia HL-60 cells from leaves of Juniperus taxifolia. Biosci. Biotechnol. Biochem. 2008, 72, 477–484. [Google Scholar] [CrossRef] [Green Version]
  21. Awale, S.; Tawila, A.M.; Dibwe, D.F.; Ueda, J.Y.; Sun, S.; Athikomkulchai, S.; Balachandran, C.; Saiki, I.; Matsumo, K.; Esumi, H. Highly oxygenated antiausterity agents from the leaves of Uvaria dac. Bioorg. Med. Chem. Lett. 2017, 27, 1967. [Google Scholar] [CrossRef]
  22. Lekphrom, R.; Kanokmedhakul, K.; Schevenels, F.; Kanokmedhakul, S. Antimalarial polyoxygenated cyclohexene derivatives from the roots of Uvaria cherrevensis. Fitoterapia 2018, 127, 420. [Google Scholar] [CrossRef] [PubMed]
Sample Availability: Samples of the compounds 17 are available from the authors.
Figure 1. Structures of isolates from Stahlianthus thorelii.
Molecules 25 00551 g001
Figure 2. Key HMBC and 1H-1H COSY correlations of compounds 1 and 2.
Molecules 25 00551 g002
Figure 3. ORTEP diagram showing the crystallographic atom-numbering scheme and solid-state conformation of compounds 1 and 2.
Molecules 25 00551 g003
Figure 4. HPLC diagram of isolates from S. thorelii extract. (1) Thorechalcone A-tR = 59 min, (2) cerasinone-tR = 27.2 min, (3) [(2E)-1-(2,4-dihydroxy-6-methoxyphenyl)-3-(2,4-dimethoxyphenyl)-2-propen-1-one]-tR = 46.5 min, (4) crotepoxide-tR = 35 min, (5) (−)-1,6-desoxytingtanoxide-tR = 61 min, (6) (O-methoxybenzoyl benzoate)-tR = 55 min, and (7) sandaracopimaric acid tR = 85min.
Molecules 25 00551 g004
Figure 5. HPLC diagram of specificity. (a) Standard sample: 3 and 4 (b) S. thorelii extract.
Molecules 25 00551 g005
Table 1. Antiproliferative effects of the fractions of the rhizomes of S. thorelii against four human cancer cell lines.
SampleIC50 (µg/mL)
A549MCF-7WiDrHepG2
SEA72.83 ± 2.4269.08 ± 1.2446.81 ± 5.4943.48 ± 4.84
SF3>100>10043.42 ± 0.55>100
SF710.52 ± 0.517.89 ± 0.5925.49 ± 0.8776.38 ± 0.47
SF913.12 ± 0.6212.07 ± 1.6120.04 ± 2.2546.15 ± 1.42
SF3.551.67 ± 4.6452.09 ± 1.3125.5 ± 1.1543.87 ± 2.71
SF3.625.18 ± 2.8864.16 ± 5.0855.69 ± 1.3621.29 ± 0.72
The results shown are means ± SD of triplicate experiments.
Table 2. 1H and 13C-NMR data for compound 1 in acetone-d6 and 2 in DMSO-d6.
No1No2
δHδCδHδC
1 118.11
2 161.225.55 (dd, 12.5, 2.5)73.0
36.64 (d, 2.0)99.132.95 (dd, 16.5, 12.5) 2.67 (dd, 16.5, 2.5)44.0
4 164.14 187.9
56.60 (dd, 8.5, 2.0)107.05 164.5
67.65 (d, 8.5)131.265.95 (d, 2.5)95.6
78.02 (d, 15.5)126.07 164.4
88.09 (d, 15.5)138.586.06 (d, 2.5)93.3
9 193.59 162.2
10 105.910 104.3
11 166.41′ 119.1
12 108.22′ 160.7
13 164.43′6.61 (d, 2.0)105.0
146.20 (s)92.54′ 157.3
15 162.65′6.57 (dd, 8.0, 2.0)98.5
163.89 (s)23.26’7.38 (d, 8.0)127.7
17 128.25-OMe3.73 (s)55.7
18 155.62′-OMe3.79 (s)55.3
196.80 (dd, 8.0, 2.0)116.24′-OMe3.78 (s)55.6
206.98 (ddd, 8.0, 7.5, 2.0)127.7
216.71 (ddd, 8.0, 7.5, 2.0)120.3
227.27 (dd, 7.5, 2.0)131.5
2-OMe3.95 (s)56.1
4-OMe3.92 (s)56.2
15-OMe3.87 (s)55.9
Table 3. Antiproliferative effects of the isolates of the rhizome of S. thorelii against four human cancer cell lines.
CompoundIC50 (µM)
A549MCF-7WiDrHepG2
119.93 ± 0.59 b>20039.05 ± 1.61 b9.05 ± 1.47 b
2>200>200>200>200
3>200>20072.09 ± 1.15 c11.25 ± 0.41 b
4>200>200>20077.74 ± 5.28 c
594.54 ± 0.45 c>200>200>200
6>200>200>200153.25 ± 5.74 d
Mitomycin c0.32 ± 0.03 a0.5 ± 0.030.56 ± 0.03 a0.29 ± 0.03 a
The results shown are means ± SD of triplicate experiments. The same superscript letters in a same column show nonsignificant differences among samples at p < 0.01.
Table 4. Quantification of compounds 4 and 3 in the rhizome of S. thorelii from different collection areas.
Place to CollectCollected Date4 (%)3 (%)
An Giang province01/12/20180.1090.013
Ho Chi Minh city02/12/20180.1060.012
Dong Nai province02/12/20180.1020.013
Average 0.1060.013
Table 5. The result of the validation of HPLC method for quantitative analysis of compounds 4 and 3.
Validation Criteria43
Linearity
Regression equationY = 32638XY = 57440X
Linear range (µg/mL)2.5–5002.5–500
R2 (≤2)0.99560.9969
LOD0.05 µg/mL0.025 µg/mL
LOQ0.17 µg/mL0.08 µg/mL
System suitability
R2-tR (≤2)0.14430.0676
R2–Area (≤2)0.13581.2298
R2–T. plate (≤2)1.56101.1262
R2–Resolution (≤2)1.89711.7550
Repeatability (n = 6)
R2-tR (≤2)0.14690.1136
R2–Area (≤5.3)3.35162.5904
Accuracy
Level 1 (n = 3)% recovery96.5596.12
R2 (≤5.3)2.745.15
Level 2 (n = 3)% recovery95.887.50
R2 (≤5.3)3.004.25
Level 3 (n = 3)% recovery94.0597.50
R2 (≤5.3)2.584.01

