Article

Galeon: A Biologically Active Molecule with In Silico Metabolite Prediction, In Vitro Metabolic Profiling in Rat Liver Microsomes, and In Silico Binding Mechanisms with CYP450 Isoforms

1
Department of Pharmaceutical Chemistry, College of Pharmacy, King Saud University, Riyadh 11451, Saudi Arabia
2
College of Pharmacy, Yeungnam University, Gyeongsan 38541, Korea
*
Author to whom correspondence should be addressed.
Molecules 2020, 25(24), 5903; https://doi.org/10.3390/molecules25245903
Submission received: 5 November 2020 / Revised: 2 December 2020 / Accepted: 11 December 2020 / Published: 13 December 2020
(This article belongs to the Special Issue Anticancer Compounds with Different Biological Targets)

Abstract

:
Galeon, a natural cyclic-diarylheptanoid (CDH), which was first isolated from Myrica gale L., is known to have potent cytotoxicity against A549 cell lines, anti-tubercular activity against Mycobacterium tuberculosis H37Rv, chemo-preventive potential, and moderate topoisomerase inhibitory activity. Here, in silico metabolism and toxicity prediction of galeon by CYP450, in vitro metabolic profiling study in rat liver microsomes (RLMs), and molecular interactions of galeon-CYP450 isoforms were performed. An in silico metabolic prediction study showed demethyl and mono-hydroxy galeon were the metabolites with the highest predictability. Among the predicted metabolites, mono-hydroxy galeon was found to have plausible toxicities such as skin sensitization, thyroid toxicity, chromosome damage, and carcinogenicity. An in vitro metabolism study of galeon, incubated in RLMs, revealed eighteen Phase-I metabolites, nine methoxylamine, and three glutathione conjugates. Identification of possible metabolites and confirmation of their structures were carried out using ion-trap tandem mass spectrometry. In silico docking analysis of galeon demonstrated significant interactions with active site residues of almost all CYP450 isoforms.

1. Introduction

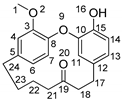
Metabolic profiling of known/unknown and natural/synthetic molecules has become attractive to scientists due to the fact of its importance in drug discovery and development. Understanding how a compound is metabolized enables identification and analysis of its potential metabolites and guides the design of molecules with a reduced risk of drug-drug interactions or variations in exposure across the patient population. Drug metabolism can generate chemically reactive metabolites which are, in most cases, responsible for the unexpected toxicities of a drug, as they tend to react with cellular components [1,2], such as DNA and proteins, leading to mutagenicity, teratogenicity or carcinogenicity [3]. This is a major issue for patient safety and sometimes leads to drug withdrawals or use restriction. Therefore, it is important to study the metabolic profile before a drug molecule goes into clinical use [1,2]. In addition, bioavailability, which is partially attributed to the first-pass metabolism of a drug, plays an important role in ensuring a drug reaches its site of action to elicit its function. Based on the metabolic performance of a potential drug molecule, the clinical application can then proceed accordingly. Although a large number of natural/synthetic molecules have been reported to have potent biological activities, their further development is hampered due to the fact of their poor bioavailability and toxicity (i.e., generation of toxic reactive metabolites). Recently, a number of articles have been published reporting on the synthesis, biological evaluation, and metabolic profiling of natural/synthetic potential of drug molecules [4,5,6,7,8,9,10,11,12,13,14]. Galeon (Figure 1), a natural cyclic-diarylheptanoid (CDH), was first isolated from Myrica gale L. in 1976 by Malterud et al. [13], and many other research groups have reported it from different plant species [11,12,15,16,17,18,19,20,21,22], showing it to have potent biological activities; cytotoxicity against human cancer cell lines A549 (IC50 = 2.2 µg/mL) [11], HL-60 (60.33 µmol/L), HeLa (58.21 µmol/L), Hepg2 (63.34 µmol/L) [21], T47D, MCF7, HCT15, and HeLa; anti-tubercular activity against Mycobacterium tuberculosis H37Rv in vitro (MIC = 15.0 µg/mL) [18]; chemo-preventive potential [23]; moderate topoisomerase inhibitory activity [4]. Its intriguing molecular structure and various biological properties have led to the establishment of several synthetic methods [4,24,25,26,27,28], which made it possible to pursue its metabolic as well as other additional studies during the development process of the new drug. Recently, we synthesized a series of linear/cyclic-diarylheptanoids (CDHs) and confirmed their cytotoxicity and topoisomerase inhibitory activity [4,6]. As a continuing interest on cyclic diarylheptanoids [4,6,28], we herein report, firstly, in silico prediction of the metabolites of galeon, a natural cyclic-diarylheptanoid (CDH), using the CYP450 module of the StarDrop software [29,30,31], where it used its WhichP450 model to inform us which CYP450 isoforms were the most likely to be responsible for the Phase I metabolism of a compound, and combined with the models of regioselectivities of metabolism by each isoform, the WhichP450 model aided in the prediction of the metabolites most likely to be formed by P450-mediated metabolism. Secondly, we report the metabolite alert sites and toxicity prediction using the Deductive Estimation of Risk from Existing Knowledge (DEREK) software [32,33,34,35], which uses a knowledge-based expert system to predict the toxicity and metabolism of a chemical, facilitating the possibilities of faster scientific progress and reductions in the use of animals in testing [36]. Thirdly, we report on galeon’s metabolic profile through in vitro metabolic experiments using rat liver microsomes (RLMs) in which identification of possible metabolites and confirmation of their structures were carried out using Ion-trap tandem mass spectrometry (LC-MS/MS). Finally, we conducted molecular docking analysis [37] in order to identify the binding mechanism of galeon with all CYP450 isoforms.

2. Results and Discussion

2.1. In Silico Prediction of Galeon Metabolites Using the CYP450 Metabolism Module of the StarDrop® Software

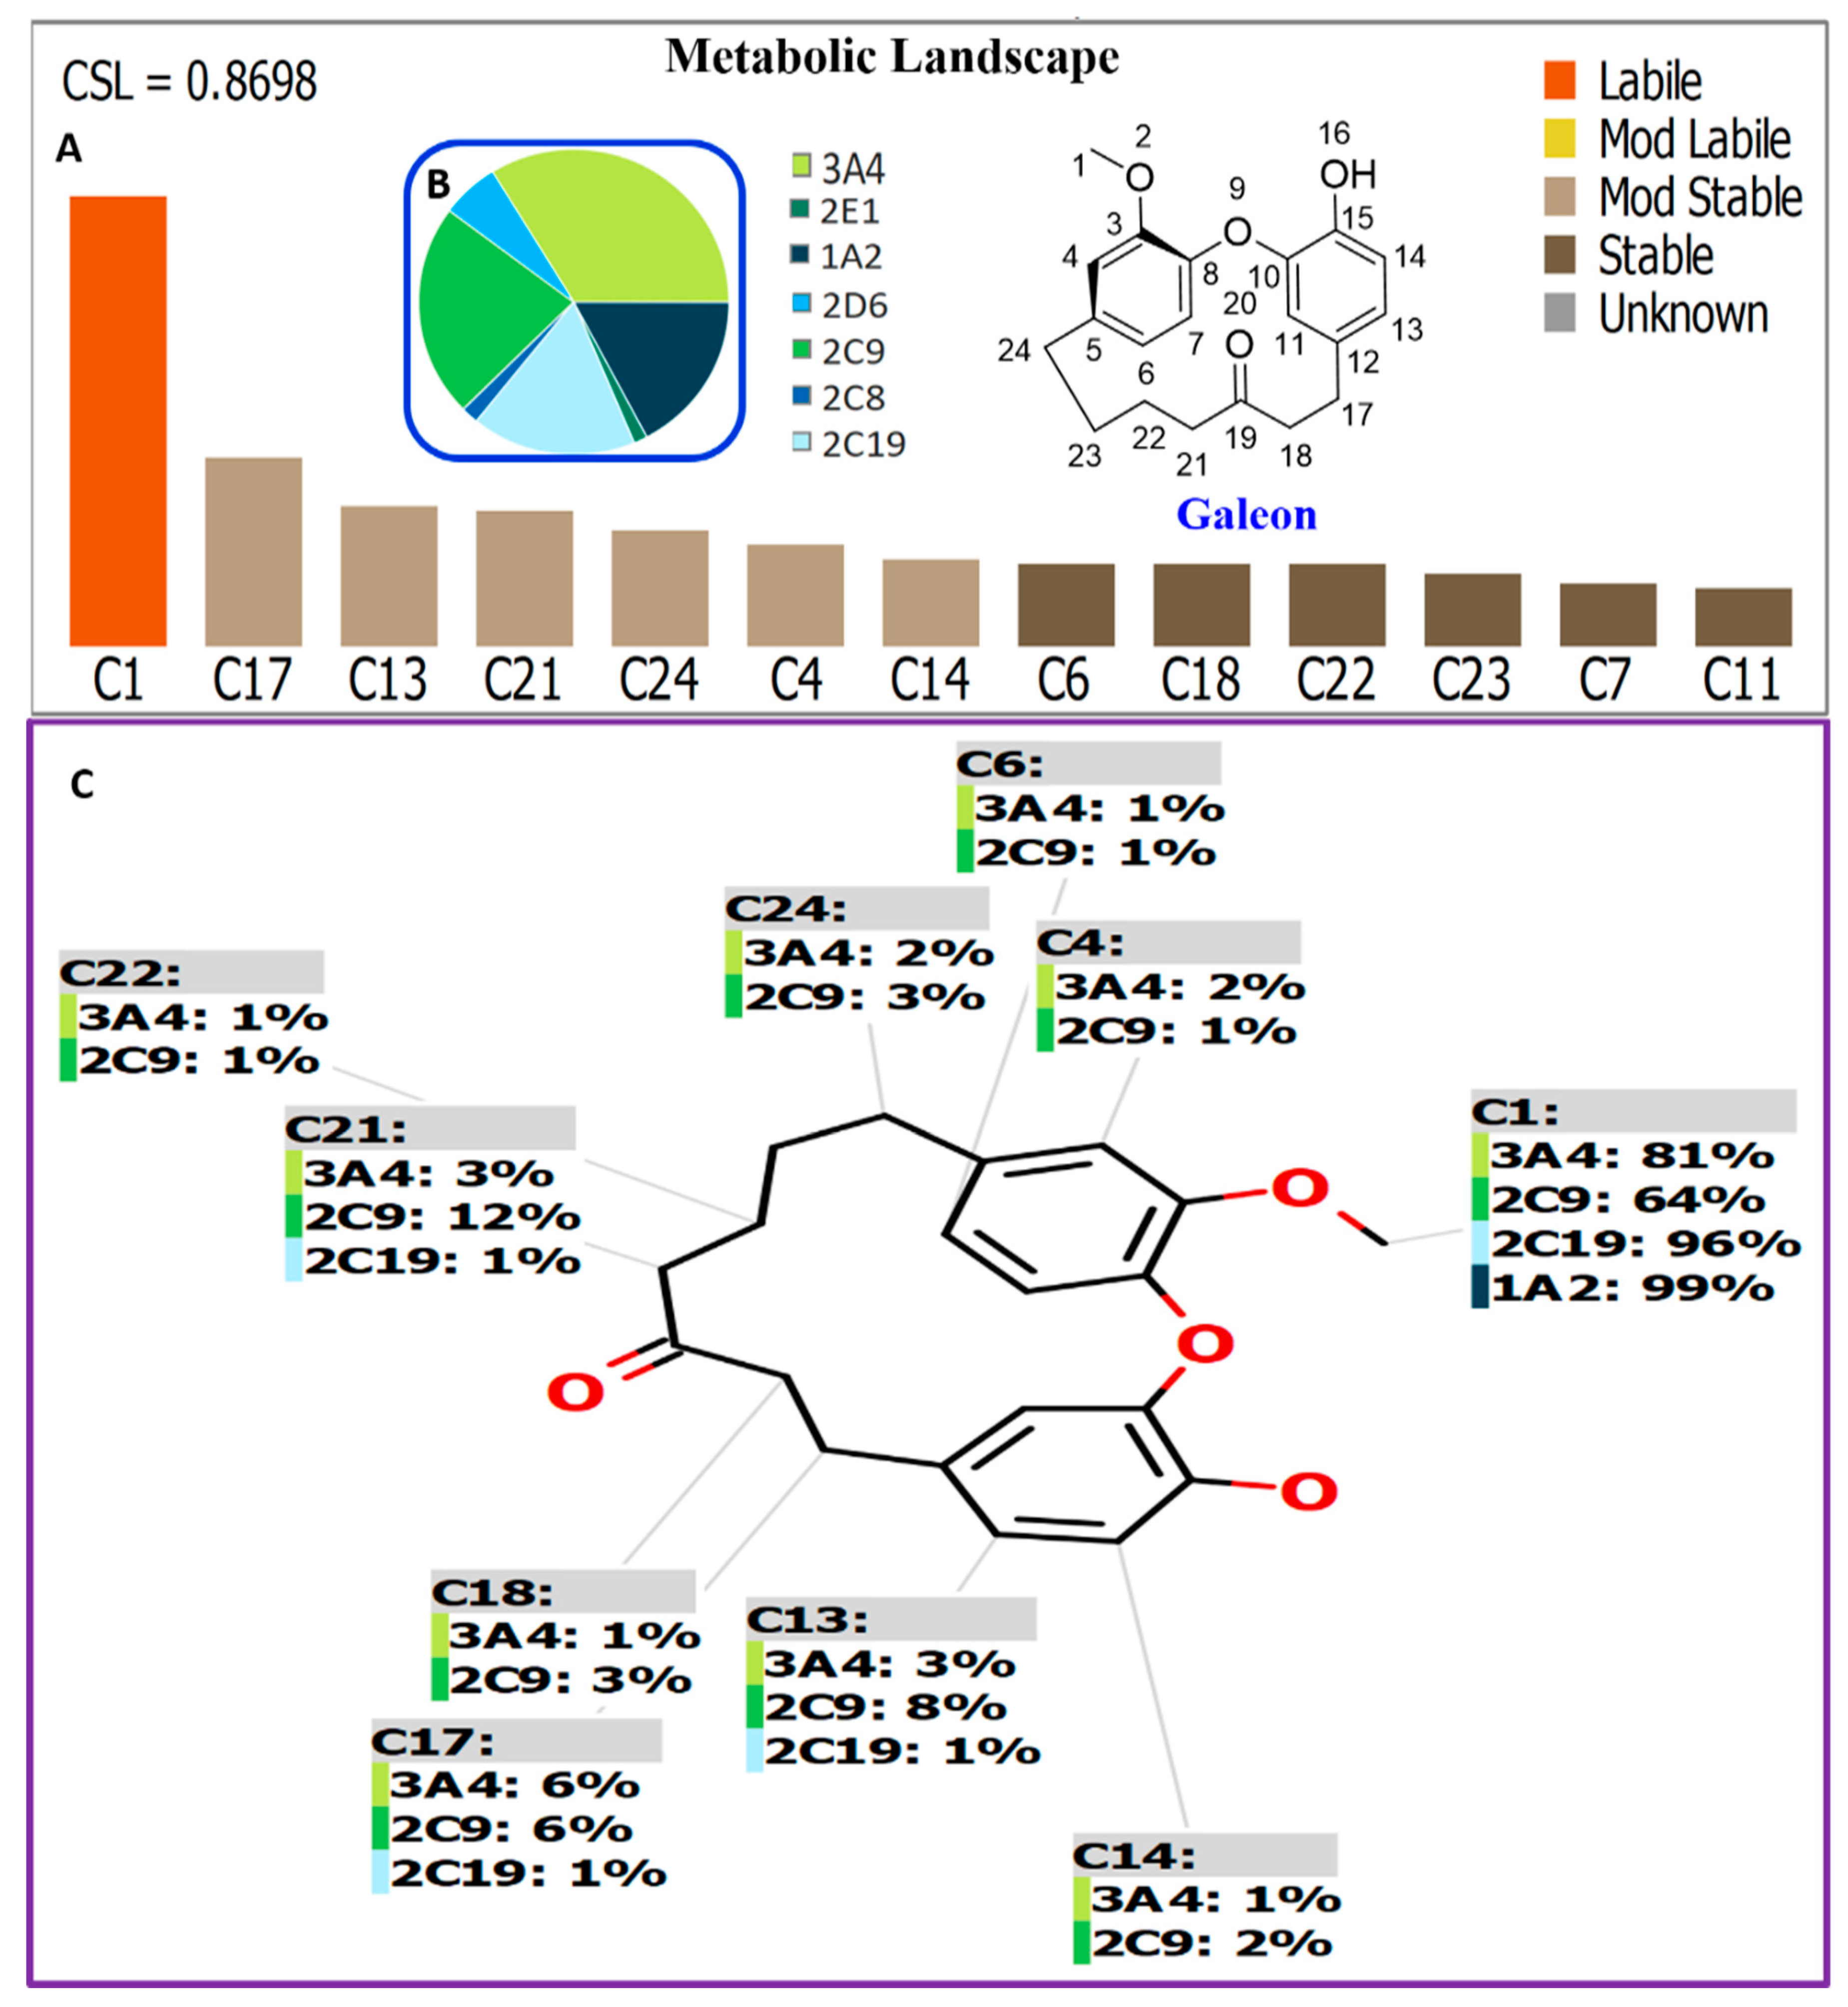
The vulnerability of key metabolic sites of galeon, indicated by composite site lability (CSL) in a descending manner, is summarized in Figure 2A. The “metabolic landscape” suggested that C1 is the most susceptible site of metabolism, whereas C17, C13, C21, C24, C4, and C14 were predicted to be the next most vulnerable sites of metabolism. The effect of major drug metabolizing CYP450 isoforms (3A4, 2E1, 1A2, 2D6, 2C9, 2C8, and 2C19) on galeon metabolism is summarized in % in a pie chart (Figure 2B), giving information on which isoforms are the most likely to be responsible for Phase I metabolism of galeon. A regio-selectivity map in Figure 2C indicates the possible CYP450 isoforms involved in each site of galeon metabolism.
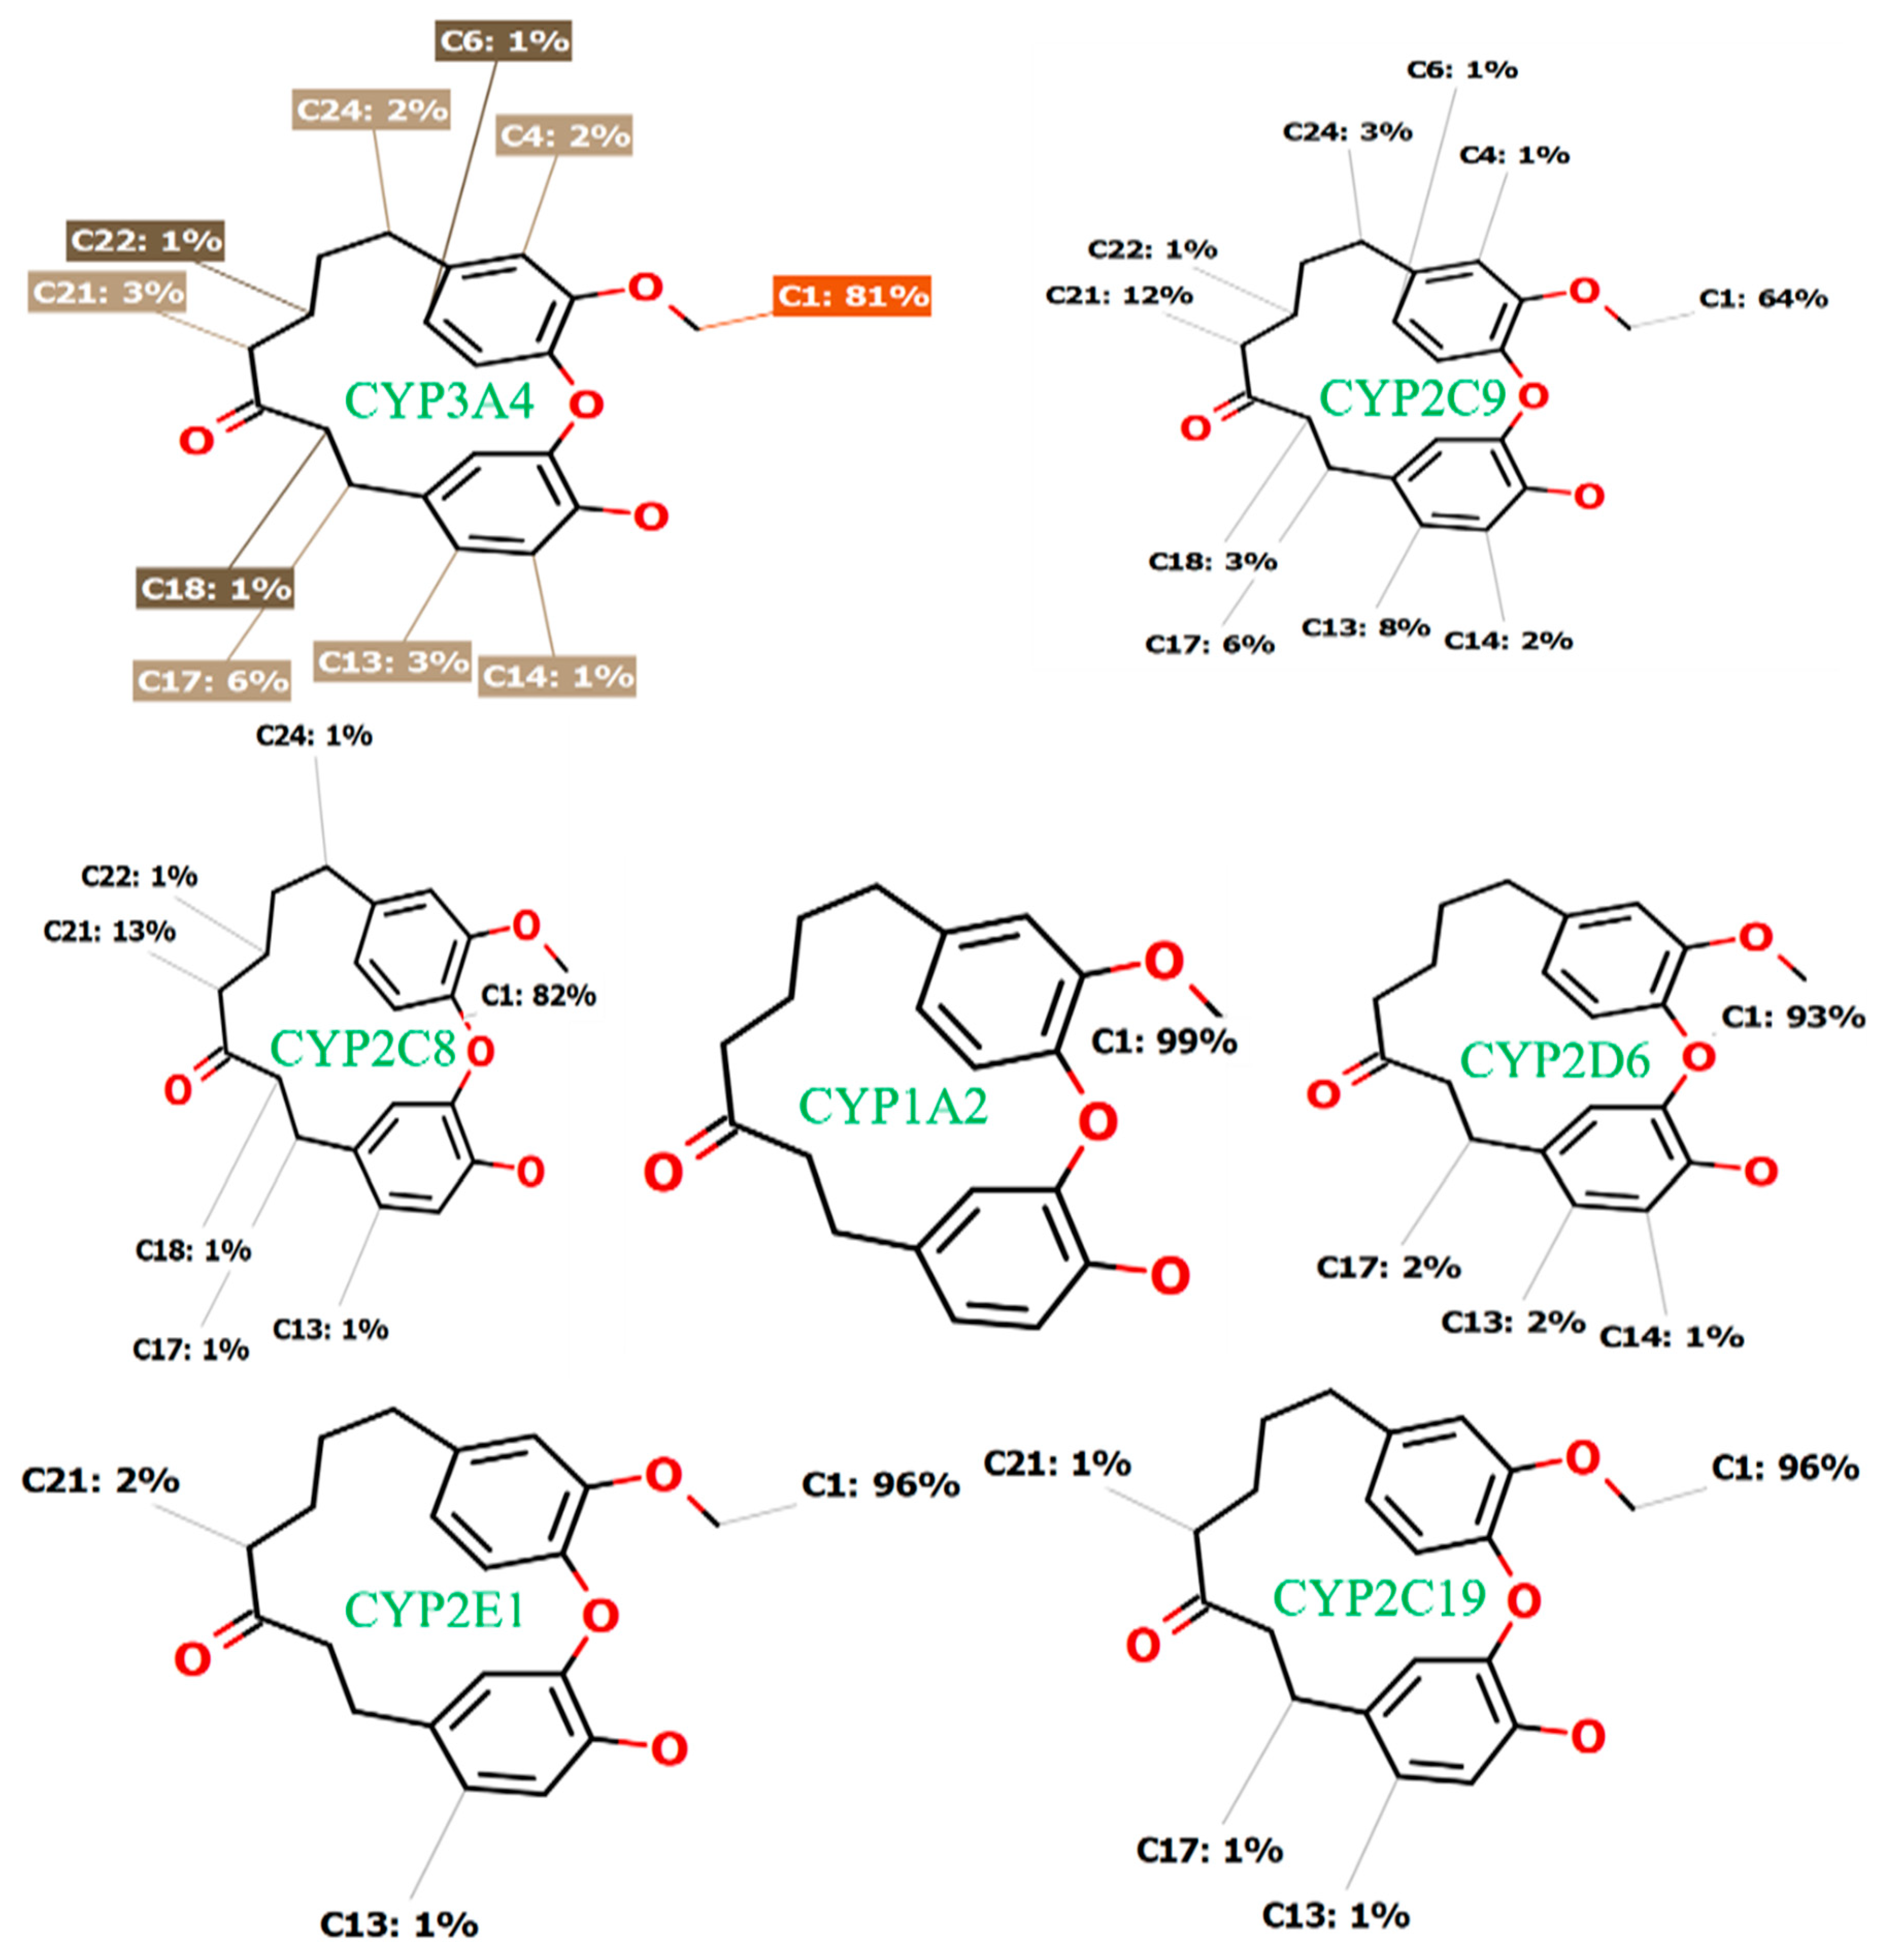
The detailed in silico results for the CYP450 isoforms affecting the metabolism of galeon are illustrated in Figure 3. As displayed, 1A2, 2E1, 2C19, and 2D6 played the major roles in galeon metabolism at the carbon 1 (C1) position, which gave the predicted de-methylated metabolite of galeon, while CYP3A4 was involved in the metabolism on most carbon sites. Being able to generate all the necessary information above, the StarDrop WhichP450™ model aided in the prediction of the metabolites most likely to be formed by CYP450-mediated metabolism so as to guide us to optimize the chemical structure for improving metabolic stability without compromising the efficacy of the drug and with minimal side effects.

2.2. In Silico Galeon Structural Alert Sites and Toxicity Prediction

Screening for the predicted toxicity of galeon metabolites was performed using the DEREK software. Galeon and its metabolites’ structural alerts are listed in Table 1. Galeon did not show any structural alerts while the other six predicted mono-hydroxy metabolites of galeon showed skin sensitization, thyroid toxicity, chromosome damage, and carcinogenicity due to the two hydroxyl groups in the same benzene ring forming 1,2-dihydroxybenzene derivatives (catechol) and 1,3-dihydroxybenzene (resorcinol). Table 1 displays a complete list of in vitro galeon metabolites with the DEREK results for proposed toxicity profile.

2.3. In Vitro Metabolic Profiling of Galeon

2.3.1. Mass Spectrometry of Galeon

A preliminary fragmentation study of galeon was performed in an ion-trap instrument prior to incubating with RLMs to identify fragmentation patterns of the parent compound. Figure 4A shows a mass spectrum of galeon m/z 327 at retention time 27.7 min.
The MS2 fragmentation of galeon (m/z 327) gave major fragments at m/z 309 (F1), 277 (F2), 221 (F3), 207 (F4), 191 (F5), 163 (F6), 147 (F7), and 131 (F8), and the MS3 fragmentation of the major fragment F4 (m/z, 207) gave F6, F7, and F8 (Figure 4B,C). The MS2 and MS3 fragments and their possible structures are depicted in Scheme 1.

2.3.2. Identification of Phase-I Metabolites

Galeon was incubated with RLMs to attempt to detect Phase-I metabolites in a single run. To investigate reactive metabolite formation, galeon was incubated with RLMs followed by the addition of chemical trapping agents, N,O-dimethylhydroxylamine (MeNHOCH3) and glutathione (GSH), to form stable adducts that can be detected by MS. Three different types of metabolic reactions (i.e., demethylation, mono/di-hydroxylation, and reduction) occurred while incubating galeon, yielding eighteen metabolites in the presence of NADPH-generating system. No metabolites were generated in the absence of either NADPH or microsomes, indicating the likely involvement of CYP450 enzymes and the cofactor NADPH in the metabolisms. The putative metabolites are listed in Table 2 with their m/z values, retention times, fragments, and the name of the proposed metabolic reactions. The MS/MS spectra of those metabolites are given in Supplementary Materials Figures S1–S7.
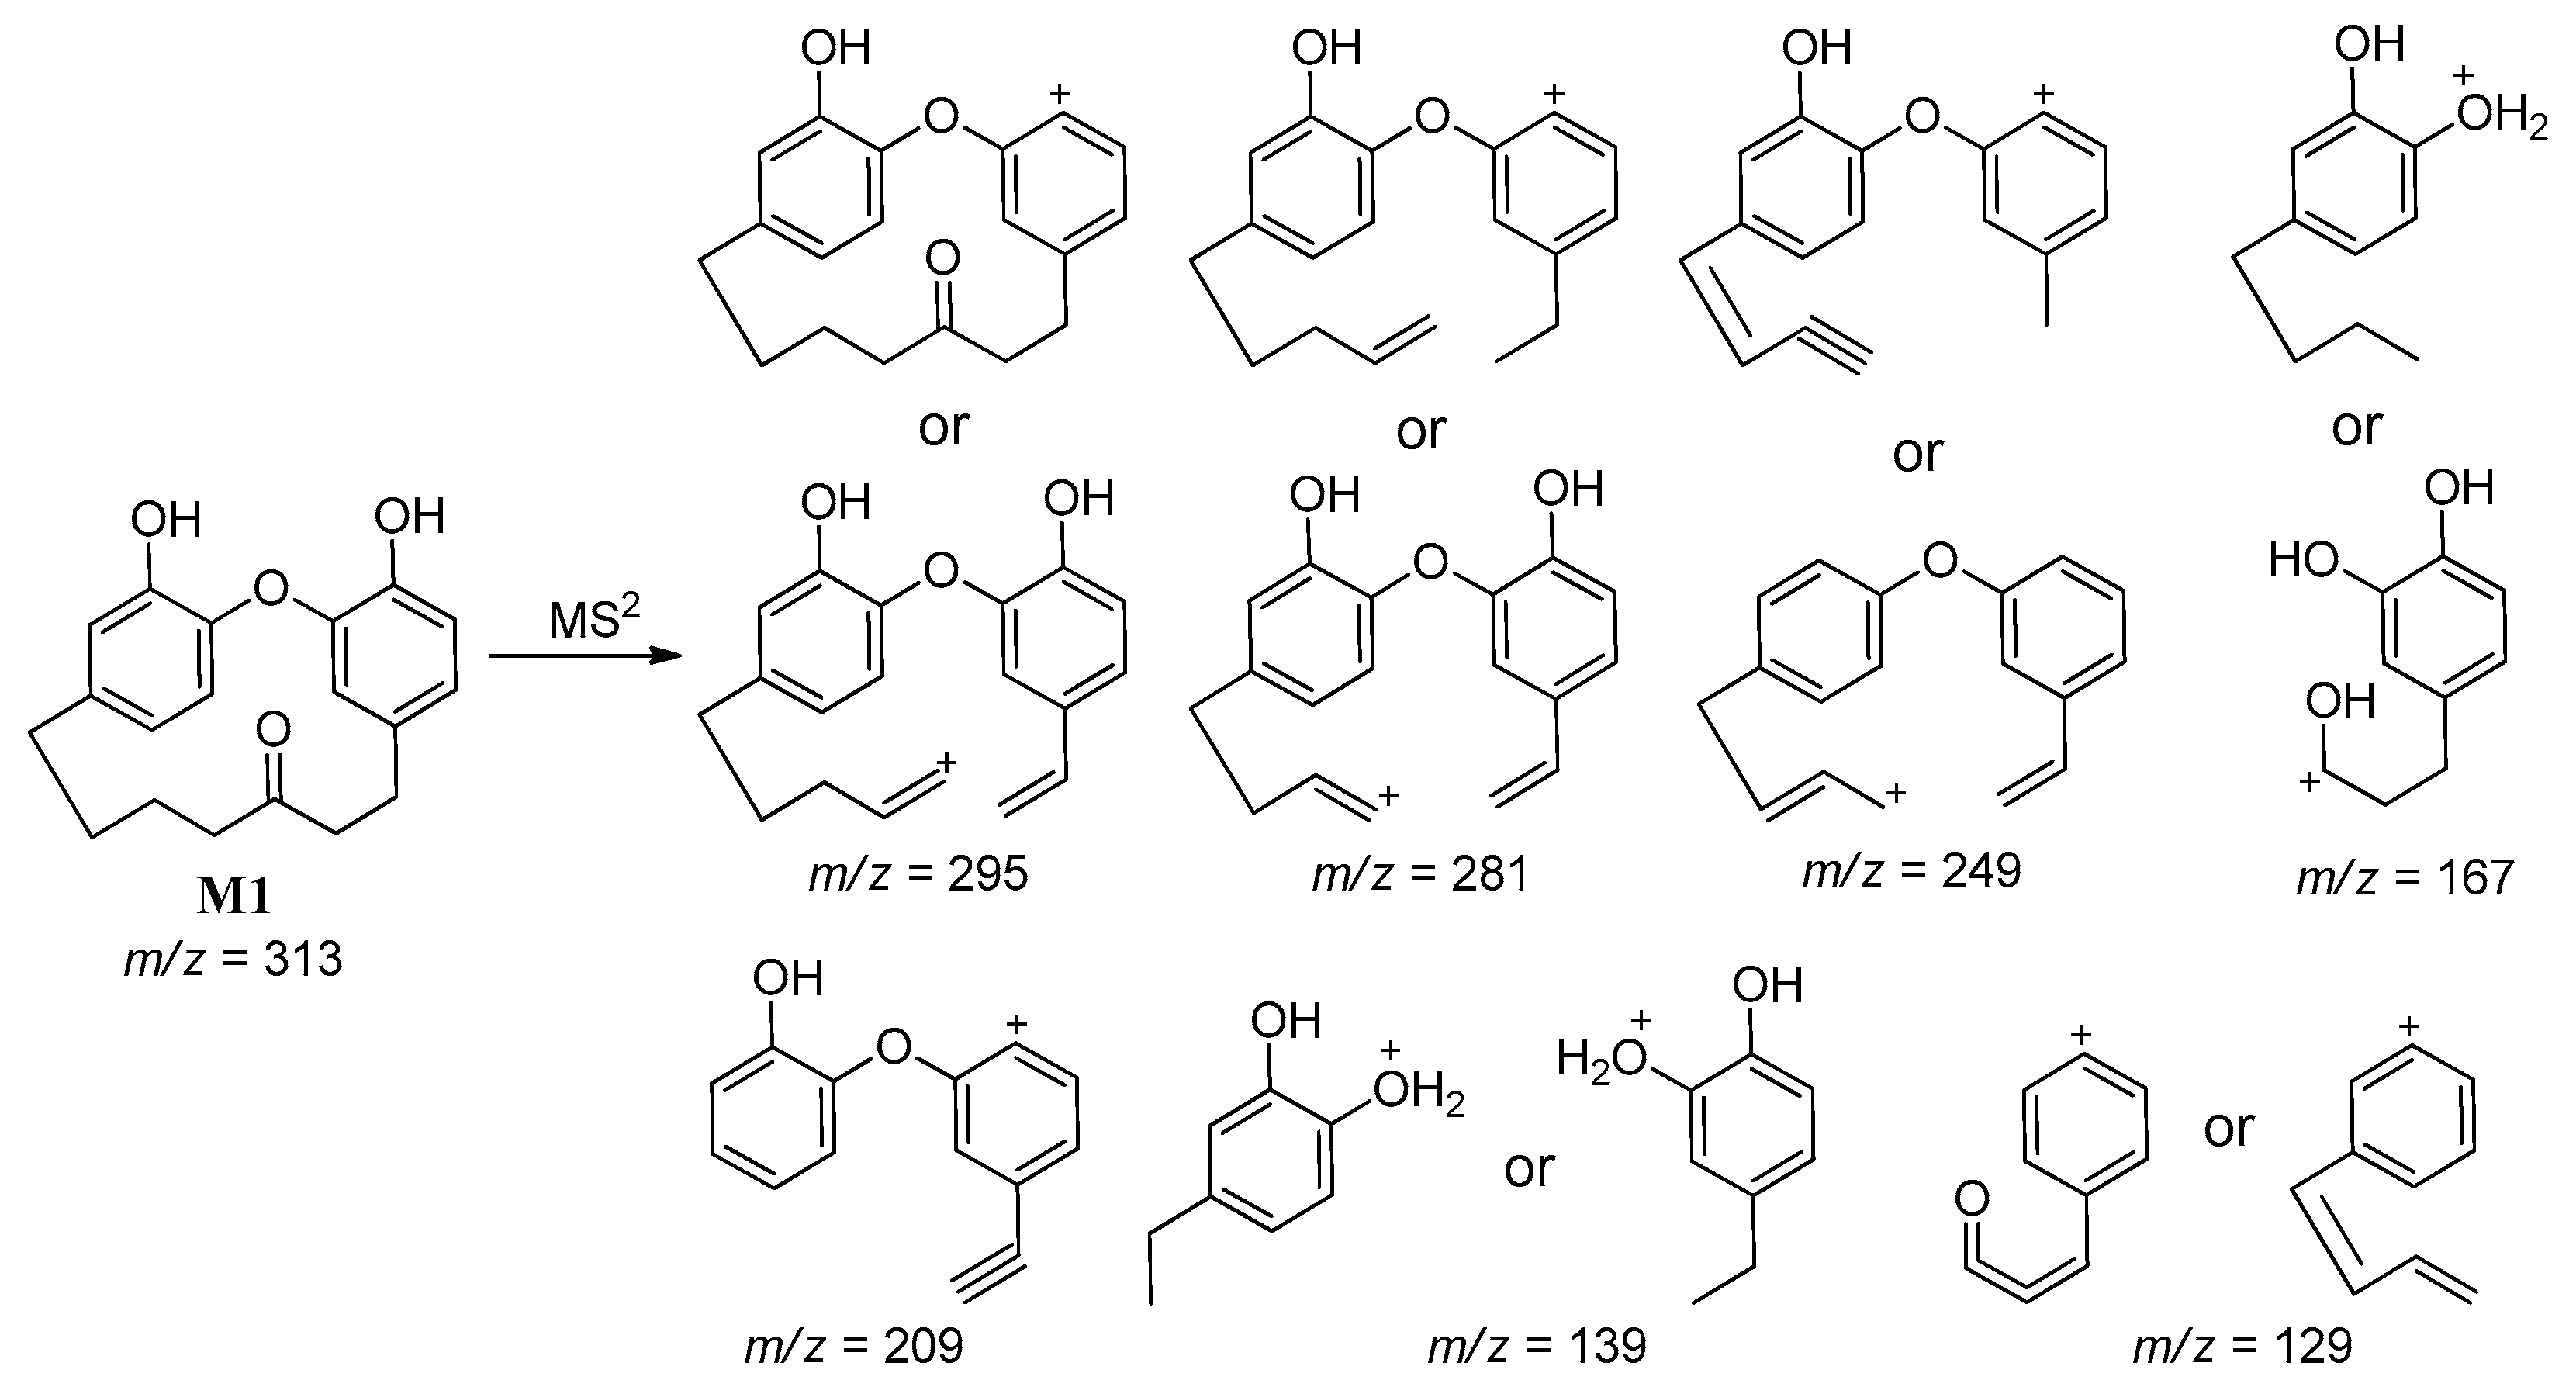
The metabolite M1 was tentatively identified as a demethylated metabolite of galeon at m/z 313. As shown in Table 2, a protonated molecular ion peak at the retention time 25 min gave m/z 313 [M + H]+ (Figure S1A) with a mass shift of 14Da compared to the parent galeon (m/z 327). The MS2 experiment of M1 gave several fragments at m/z 295, 281, 249, 209, 167, 139, and 129. The MS/MS2 spectra are shown in Figure S1, and the fragmentation pattern with the possible structure of the metabolite are proposed in Scheme 2. Among the fragments, m/z 295, 281, and 209 matched with the fragmentation pattern of galeon, and it is only possible if the proposed metabolite structure has a free –OH group instead of –OCH3 group. So, the fragmentation pattern supported M1 as a demethylated metabolite of galeon.
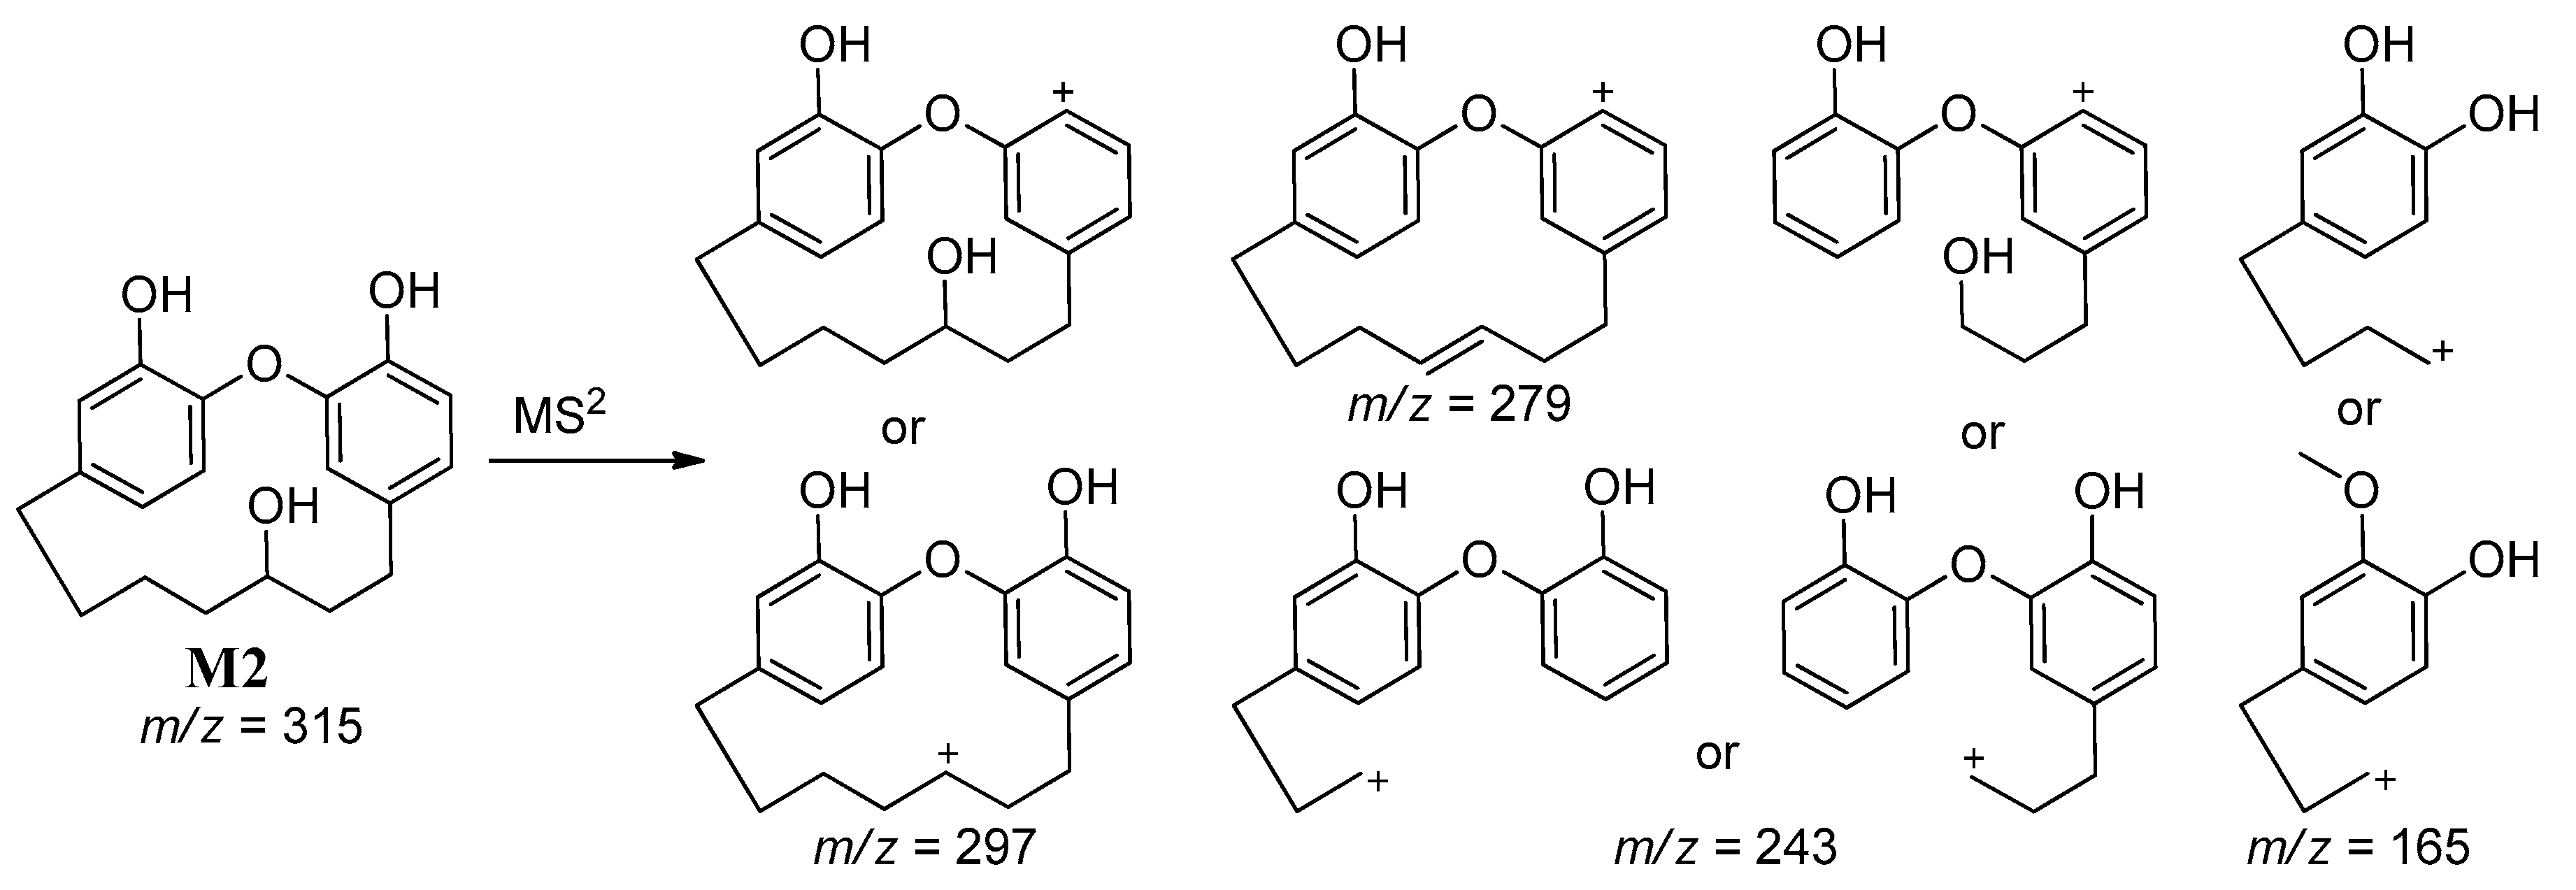
The metabolite M2 was tentatively identified as demethylated, reduced metabolite of galeon at m/z 315. A protonated molecular ion peak at the retention time 28.9 min gave m/z 315 [M + H]+ (Figure S2A) with a mass shift of 12 Da compared to the parent, where demethylation and reduction occurred. The MS2 experiment of M2 gave fragments at m/z 297, 279, 243, and 165. The MS/MS2 spectra are shown in Figure S2, and the fragmentation pattern with the possible structure of the metabolite is proposed in Scheme 3. Among the fragments, m/z 297 and 165 matched with the fragmentation pattern of galeon. A dehydrated (–H2O, 18 Da) ion from 297 at m/z 279 is highly possible if the structure of the compound is M2.
The metabolites M3a/b/c/d are tentatively identified as reduced and/or demethylated with hydroxylated metabolites of galeon at m/z 329. Protonated molecular ion peaks at retention times 40.0 and 40.6 min gave m/z 329 [M + H]+ (Figure S3A–C) with a mass shift of 2 Da compared to the parent, where reduction or hydroxylation with demethylation happened in galeon. The MS2 experiment of M3a/b/c/d at a retention time of 40.0 min gave fragments at m/z 311, 257, and 121 (Figure S3B,D). The MS/MS2 spectra are shown in Figure S3, and corresponding fragments with possible metabolites structures are depicted in Scheme 4. Among the fragments, m/z 311 and 121 matched with the fragmentation pattern of galeon. Thus, the fragmentation pattern supported that the metabolites M3a/b/c/d structures’ were the same as depicted in Scheme 4. It should be noted that MS2 of m/z 329 at the retention time 40.6 min gave fragments at m/z 133, 124, and 110, which indicated that metabolites M3a/b/c/d can be generated either through reduction or demethylation with hydroxylation.
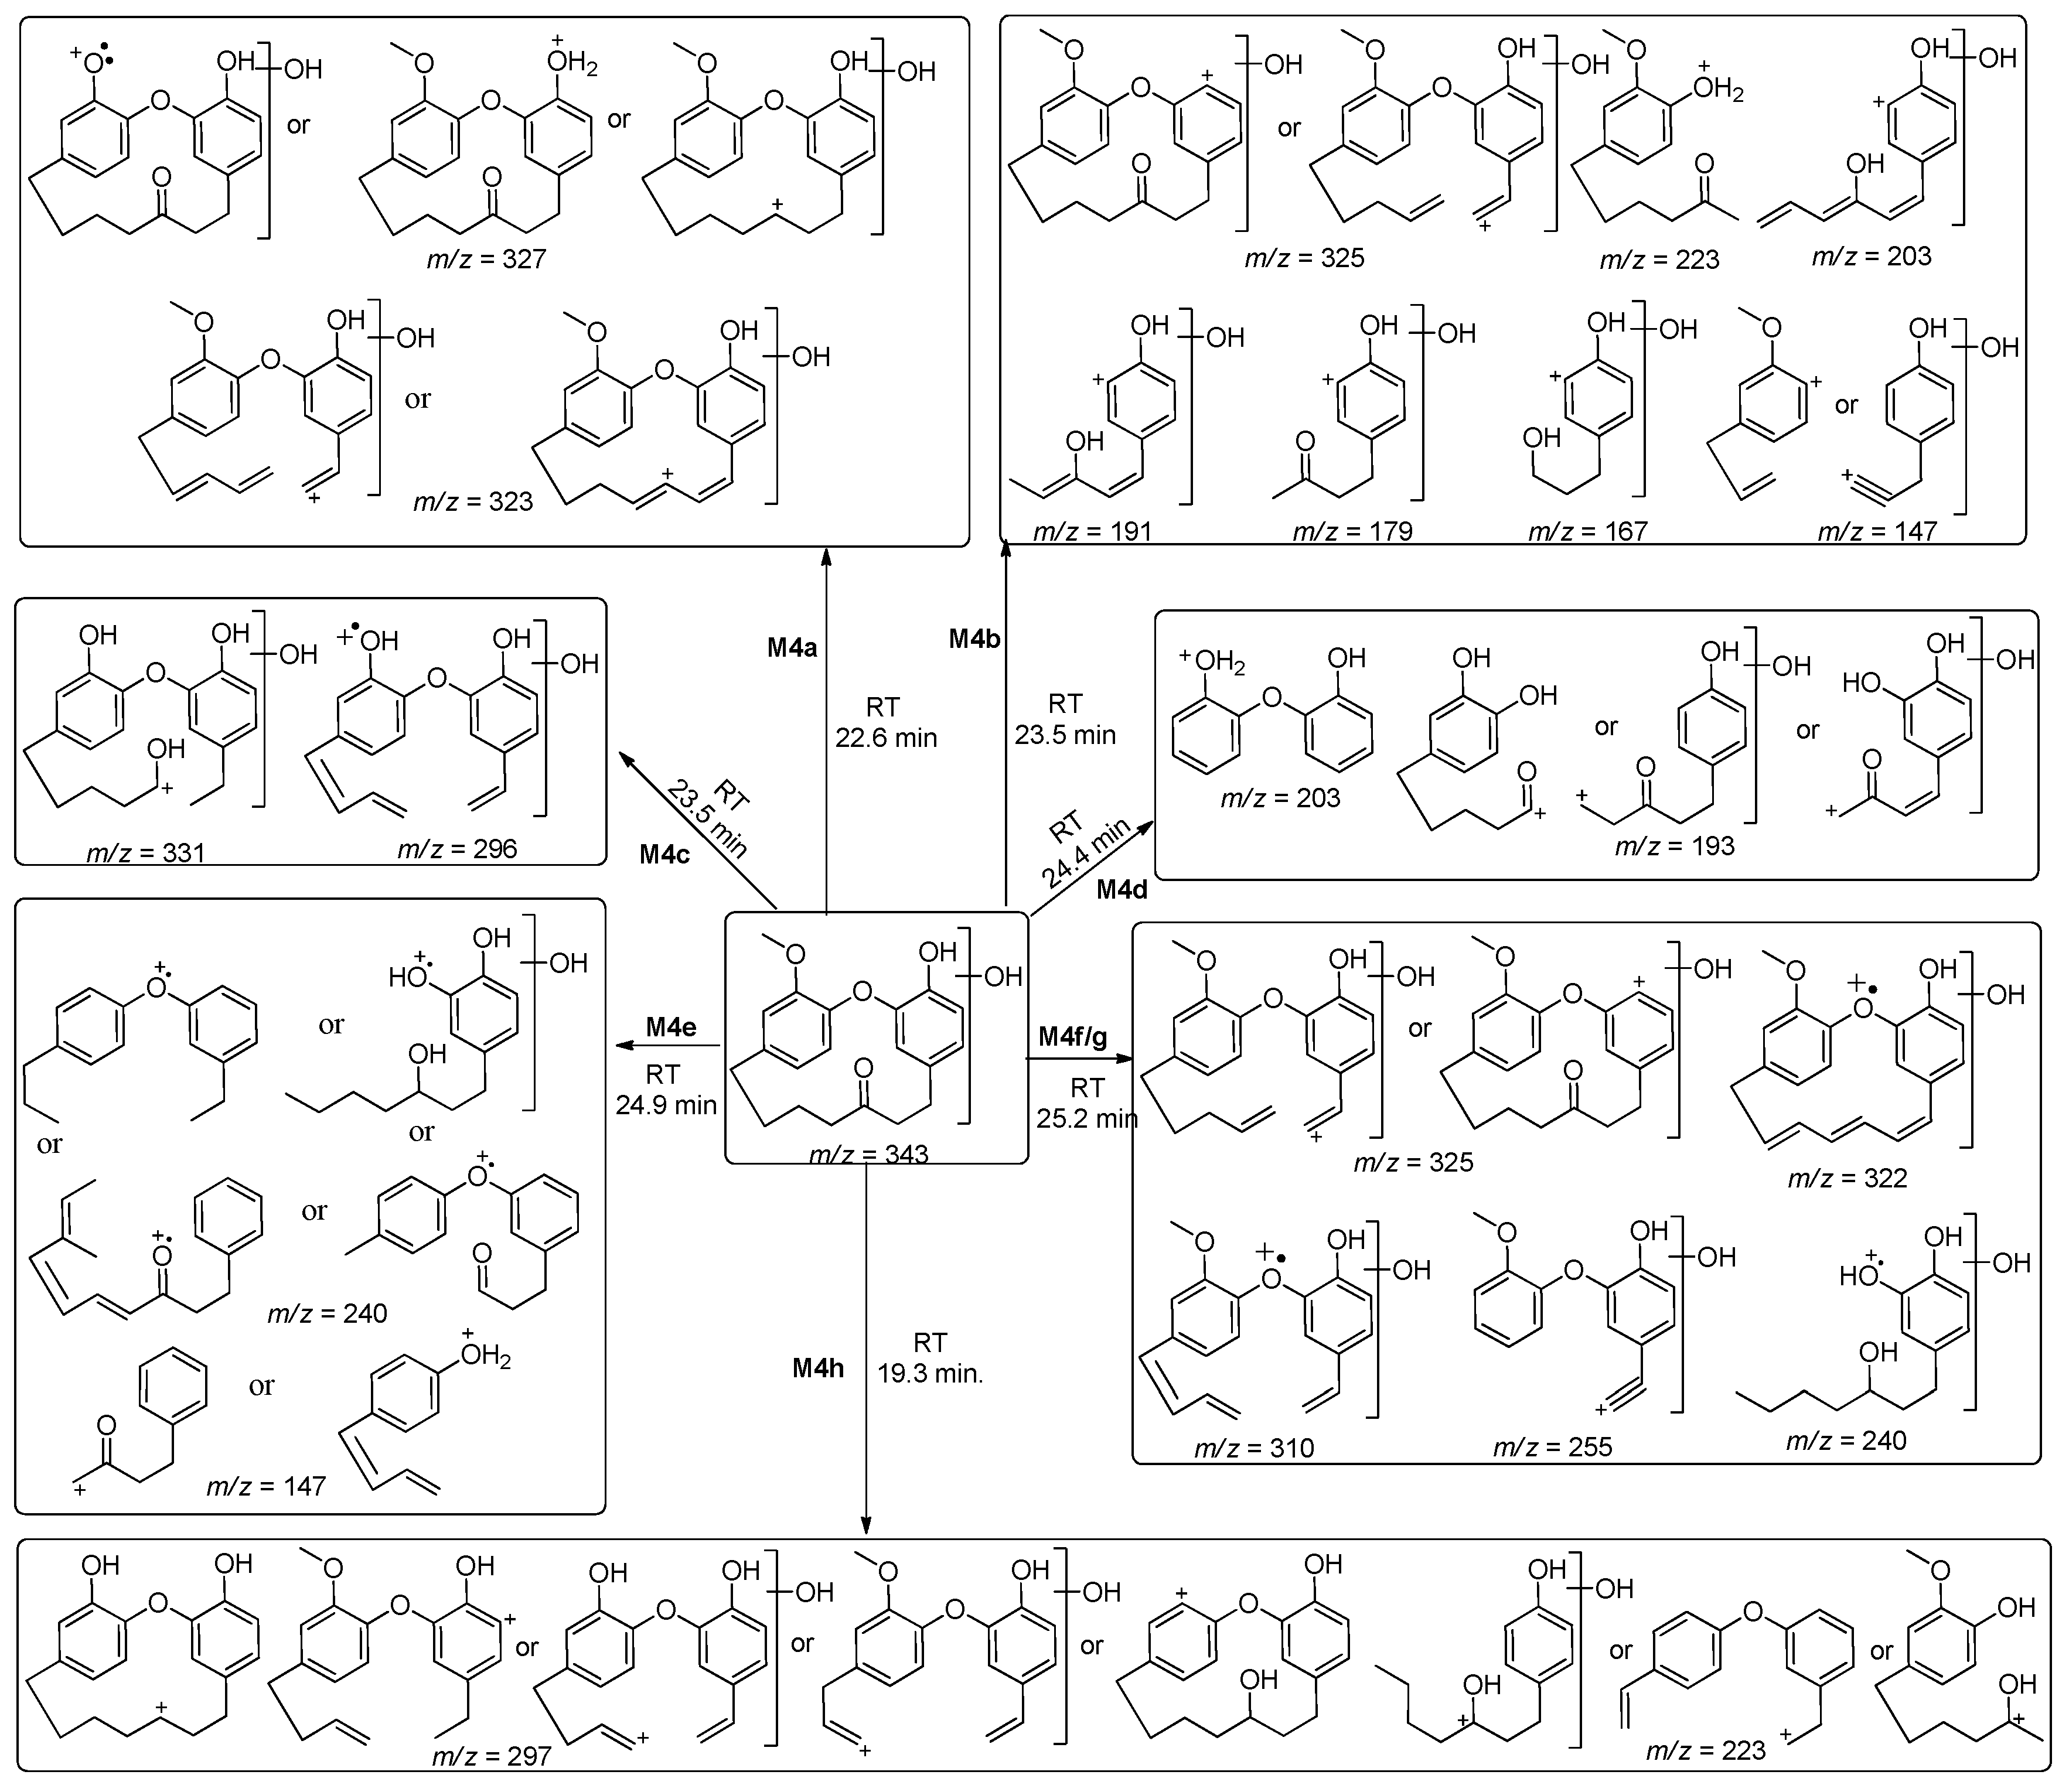
The metabolites M4ah were tentatively identified as mono-hydroxylated metabolites of galeon at m/z 343. Eight peaks were detected which showed protonated molecular masses at m/z 343 [M + H]+ with a mass shift of 16 Da from the parent and at the retention times 22.6 min (M4a, Figure S4(aA)), 23.5 min (M4b, Figure S4(bA)), 24.0 min (M4c, Figure S4(cA)), 24.4 min (M4d, Figure S4(dA)), 24.9 min (M4e, Figure S4(eA)), 25.2 min (M4f/g, Figure S4(f/gA)), and 19.3 min (M4h, Figure S4(hA)), respectively. The MS2 experiments of m/z 343 [M + H]+, at each corresponding retention time, were performed and different fragments were obtained at m/z 327 and 323 (M4a, Figure S4(aB)), m/z 325, 223, 203, 191, 179, 167, and 147 (M4b, Figure S4(bB)), m/z 331 and 296 (M4c, Figure S4(cB)), m/z 203 and 193 (M4d, Figure S4(dB)), m/z 240 and 147 (M4e, Figure S4(eB)), m/z 322, 310, 255, and 240 (M4f/g, Figure S4(f/gB)); one isomer at 25.2 min), and m/z 325, 322, 310, and 240 (M4g/f, Figure S4(f/gC)); another isomer at the same retention time), m/z 297 and 223 (M4h, Figure S4(hB)), respectively. Based on the MS spectra and MS2 fragmentation pattern, it was observed that those fragments were only possible if the corresponding compounds were the same as the expected mono-hydroxy metabolites (M4ah) of the galeon with their possible structures depicted in Scheme 5.
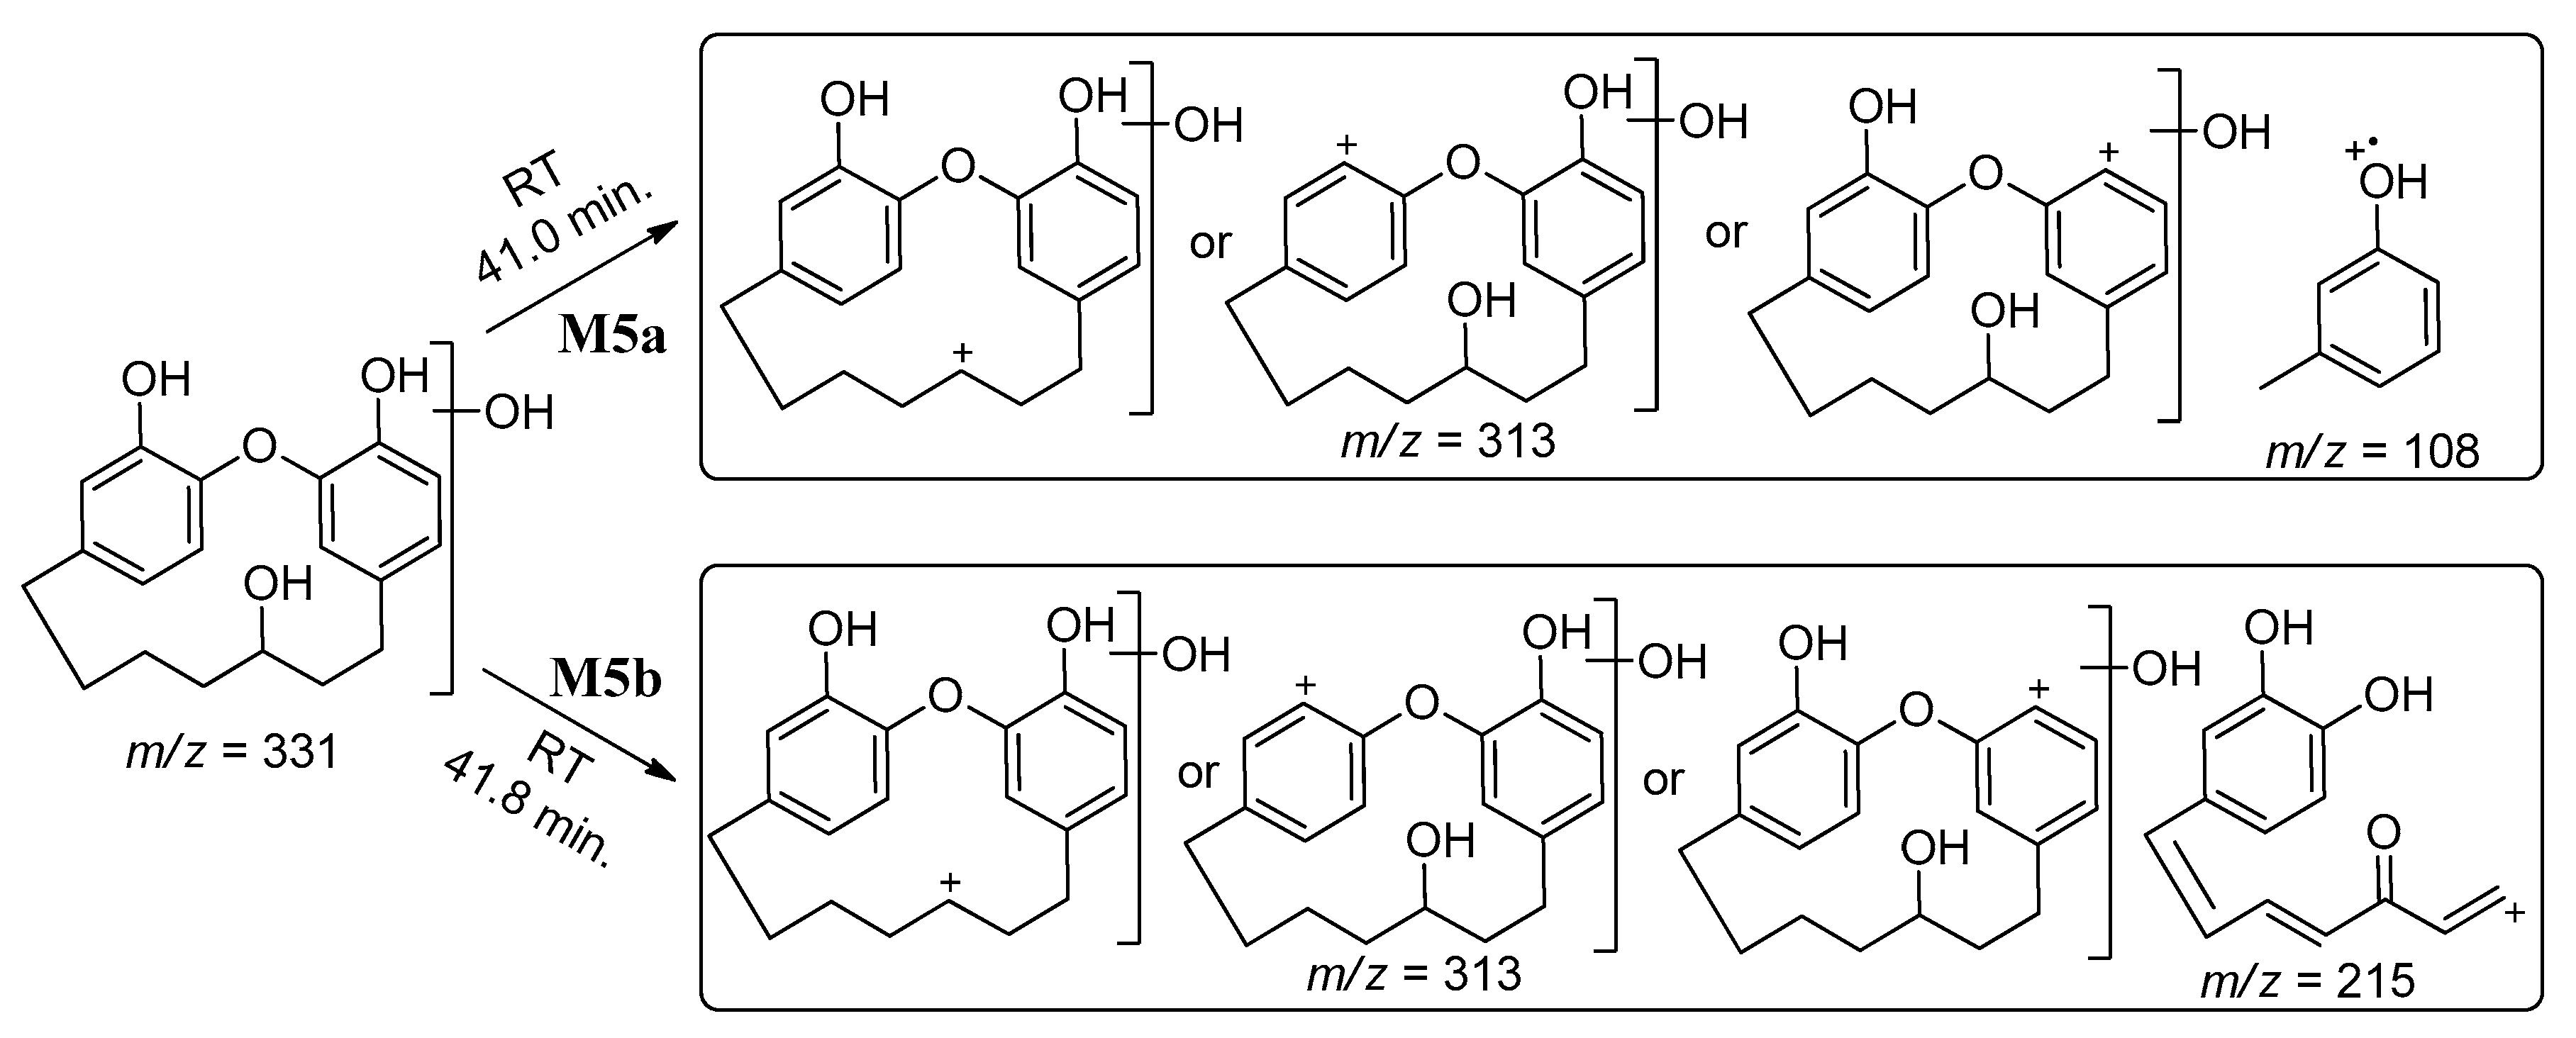
The metabolites M5a/b were tentatively identified as demethylated, reduced with hydroxylated metabolite of galeon at m/z 331. Protonated molecular ion peaks at the retention times 41.0 min and 41.8 min gave an m/z 331 [M + H]+ (Figure S5(aA), Figure S5(bA)) with a mass shift of 4 Da compared to the parent. The MS2 experiments of m/z 331 at 41.0 min and 41.8 min gave fragments at m/z 313 and 108 for M5a (Figure S5(aB)) and m/z 313 and 215 for M5b (Figure S5(bB)), respectively. The MS/MS2 spectra are shown in Supplementary Materials Figure S5a,b, and the fragmentation patterns with possible structures of the metabolites are proposed in Scheme 6. Those fragments for M5a and M5b were only possible if the corresponding compounds were produced by the proposed metabolic reactions.
The metabolite M6 was tentatively identified as a dihydroxylated metabolite of galeon at m/z 359. A protonated molecular ion peak at the retention time 21.1 min gave m/z 359 [M + H]+ (Figure S6A) with mass shift of 32 Da compared to the parent. The MS2 experiment of M6 at m/z 359 gave fragments at m/z 341, 323, and 251 (Figure S6B). The MS/MS2 spectra are shown in Figure S6 and the fragmentation pattern with a possible structure of the metabolite are proposed in Scheme 7. These fragments are only possible if the structure is the same as depicted for M6.
The metabolite M7 was tentatively identified as reduced, dihydroxylated metabolite of galeon at m/z 361. A protonated molecular ion peak at the retention time 30.2 min gave m/z 361 [M + H]+ (Figure S7A) with a mass shift of 34 Da compared to the parent. The MS2 experiment of M7 at m/z 361 gave fragments at m/z 352, 337, and 315 (Figure S7B). The MS/MS2 spectra are shown in Figure S7, and fragmentation patterns with possible structures of the metabolite are proposed in Scheme 8, and these fragments are only possible if the structure is same as depicted for M7.
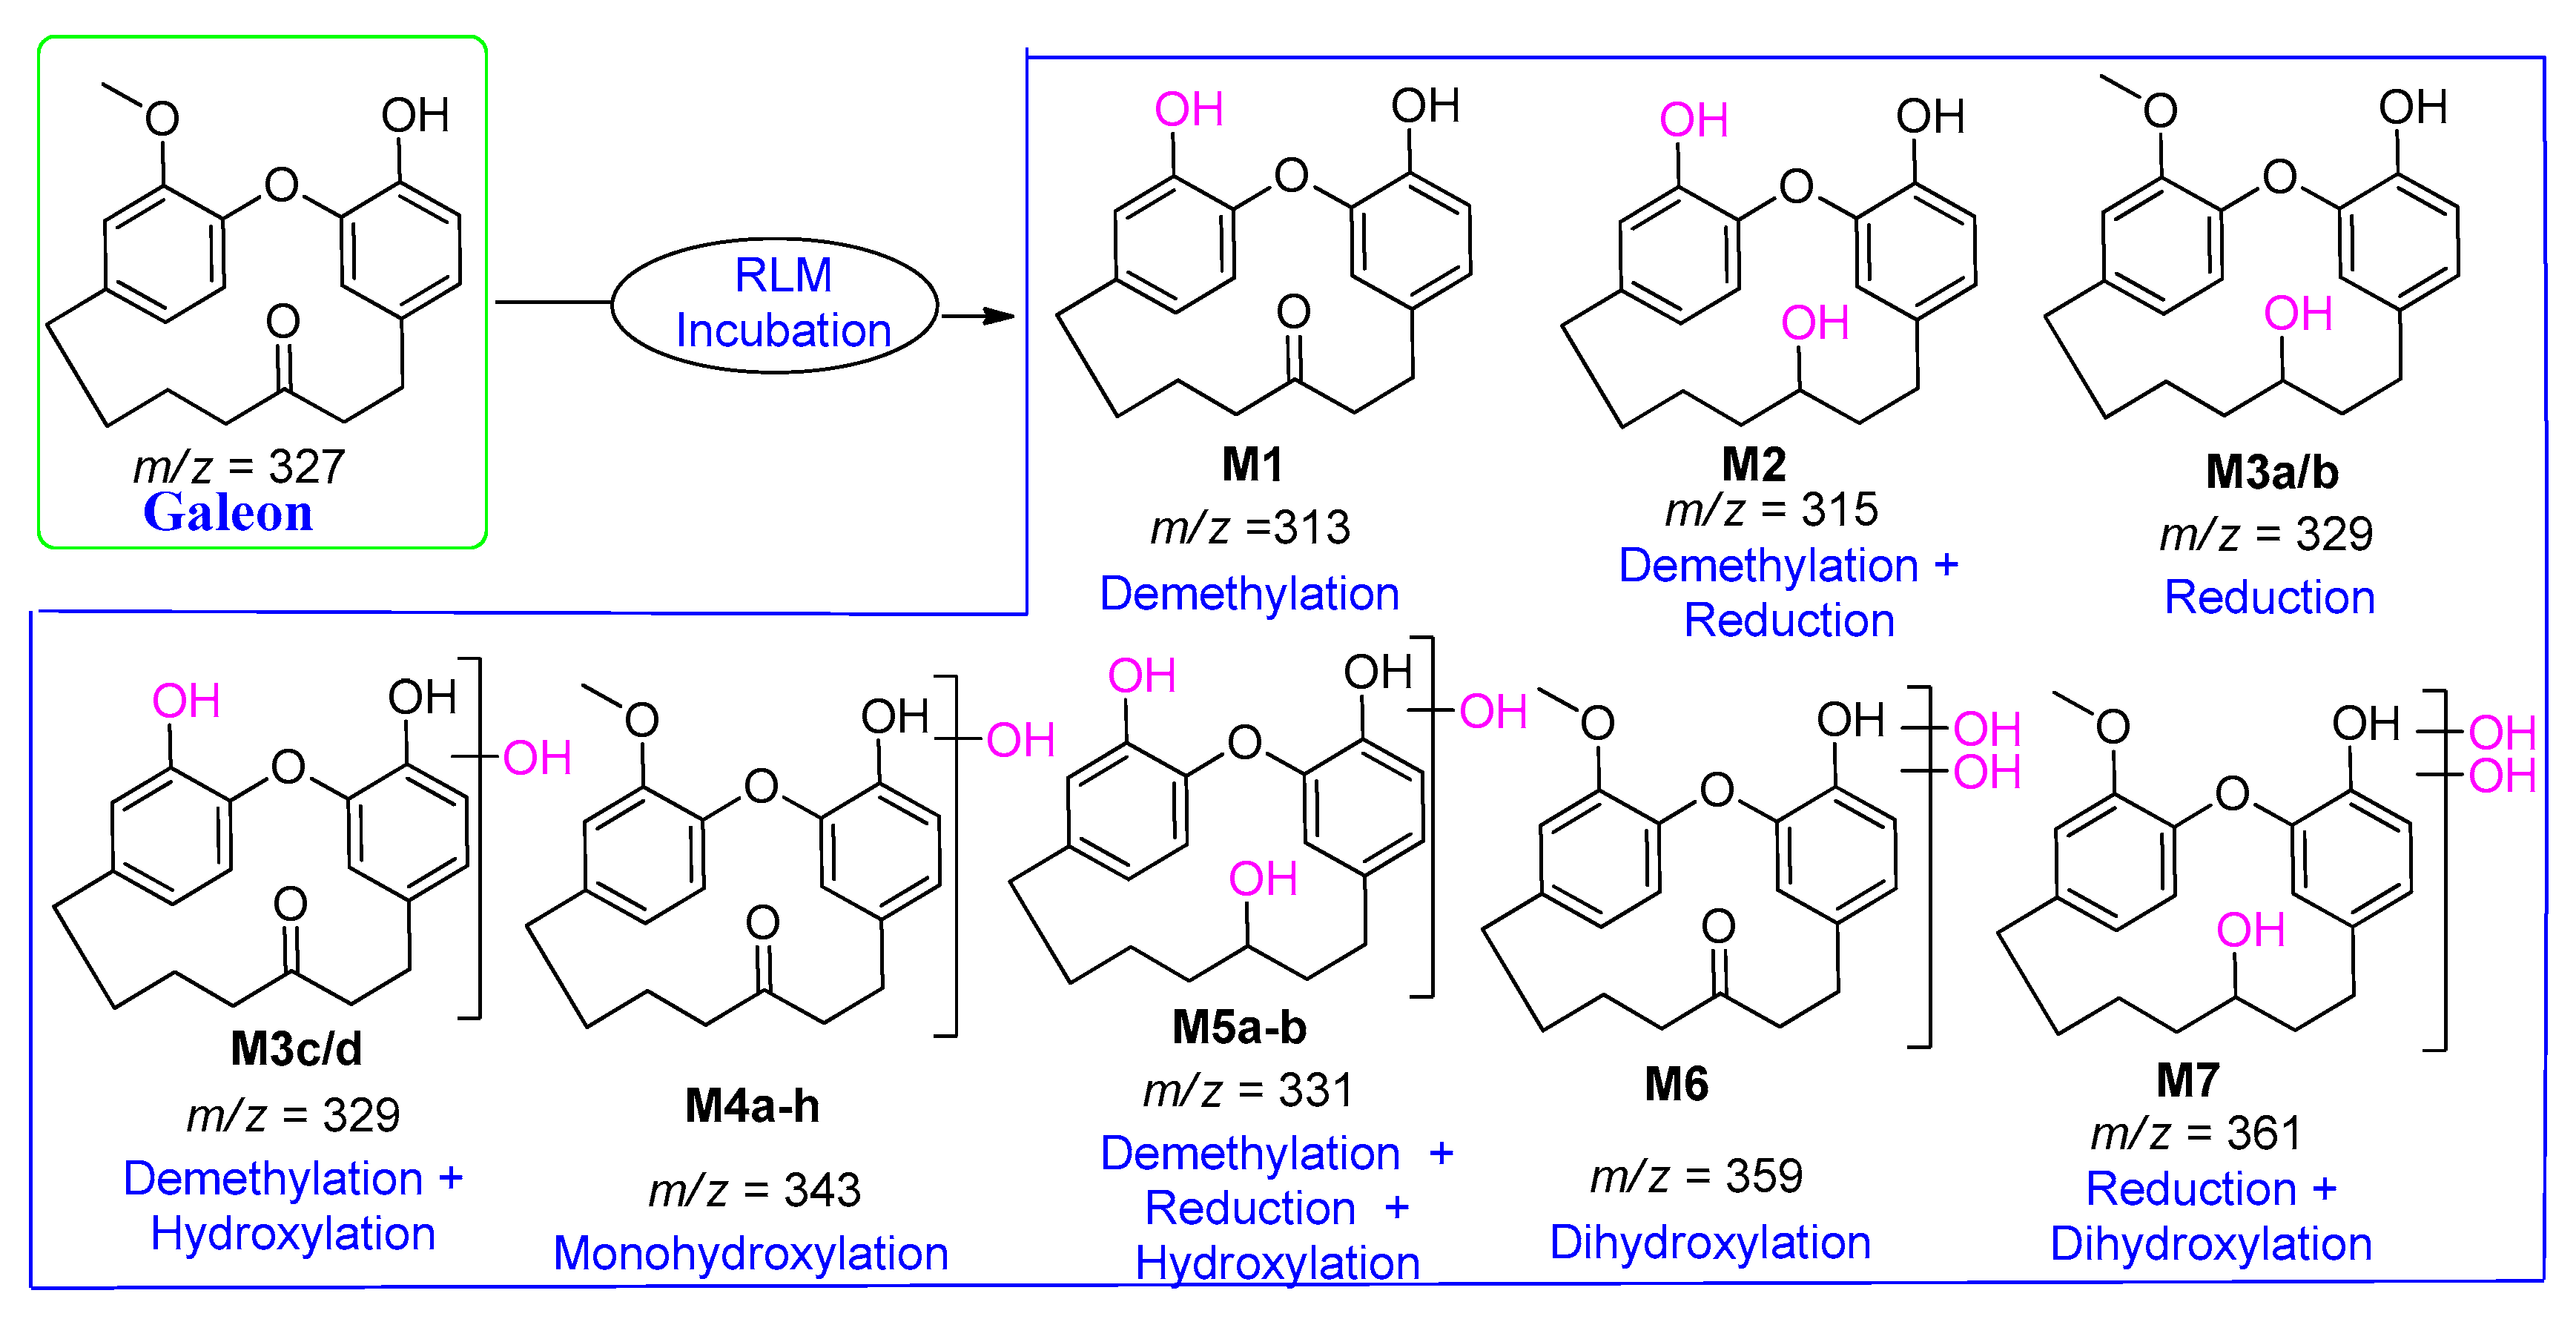
Based on the mass spectra and fragmentation pattern of the identified metabolites, possible metabolic reactions of galeon and a tentative structure of identified metabolites are depicted in Scheme 9.
As shown in the schemes, there were three types of possible metabolic reactions (i.e., demethylation, reduction, and mono/di-hydroxylation) that occurred in galeon incubation with a total of eighteen metabolites: demethylated (M1, m/z 313); demethylated with carbonyl reduced (M2, m/z 315); carbonyl reduced only (M3a/b, m/z 329) and/or demethylated with hydroxylated (M3c/d, m/z 329); mono-hydroxylated (M4ah, m/z 343); demethylated with reduced and mono-hydroxylated (M5ab, m/z 331); di-hydroxylated (M6, m/z 359), and di-hydroxylated with reduced (M7, m/z 361).

2.3.3. Identification of Reactive Metabolites

In the second part of the metabolic study, we tried to identify the possible reactive metabolites by incubating galeon with RLMs in the presence of 2.5 mM N,O-dimethylhydroxylamine (MeNHOCH3) and 1.0 mM GSH, respectively. Following the extraction of the incubation mixtures, 10 µL of the samples were injected into an LC-MS/MS instrument for analysis. Based on the peak area of the formed metabolites, the hydroxylation pathway was proposed to be the major metabolic pathway for galeon after demethylation or with demethylation. A total of nine conjugates with four types of methoxylamine conjugates and three GSH conjugates were detected (Table 3).
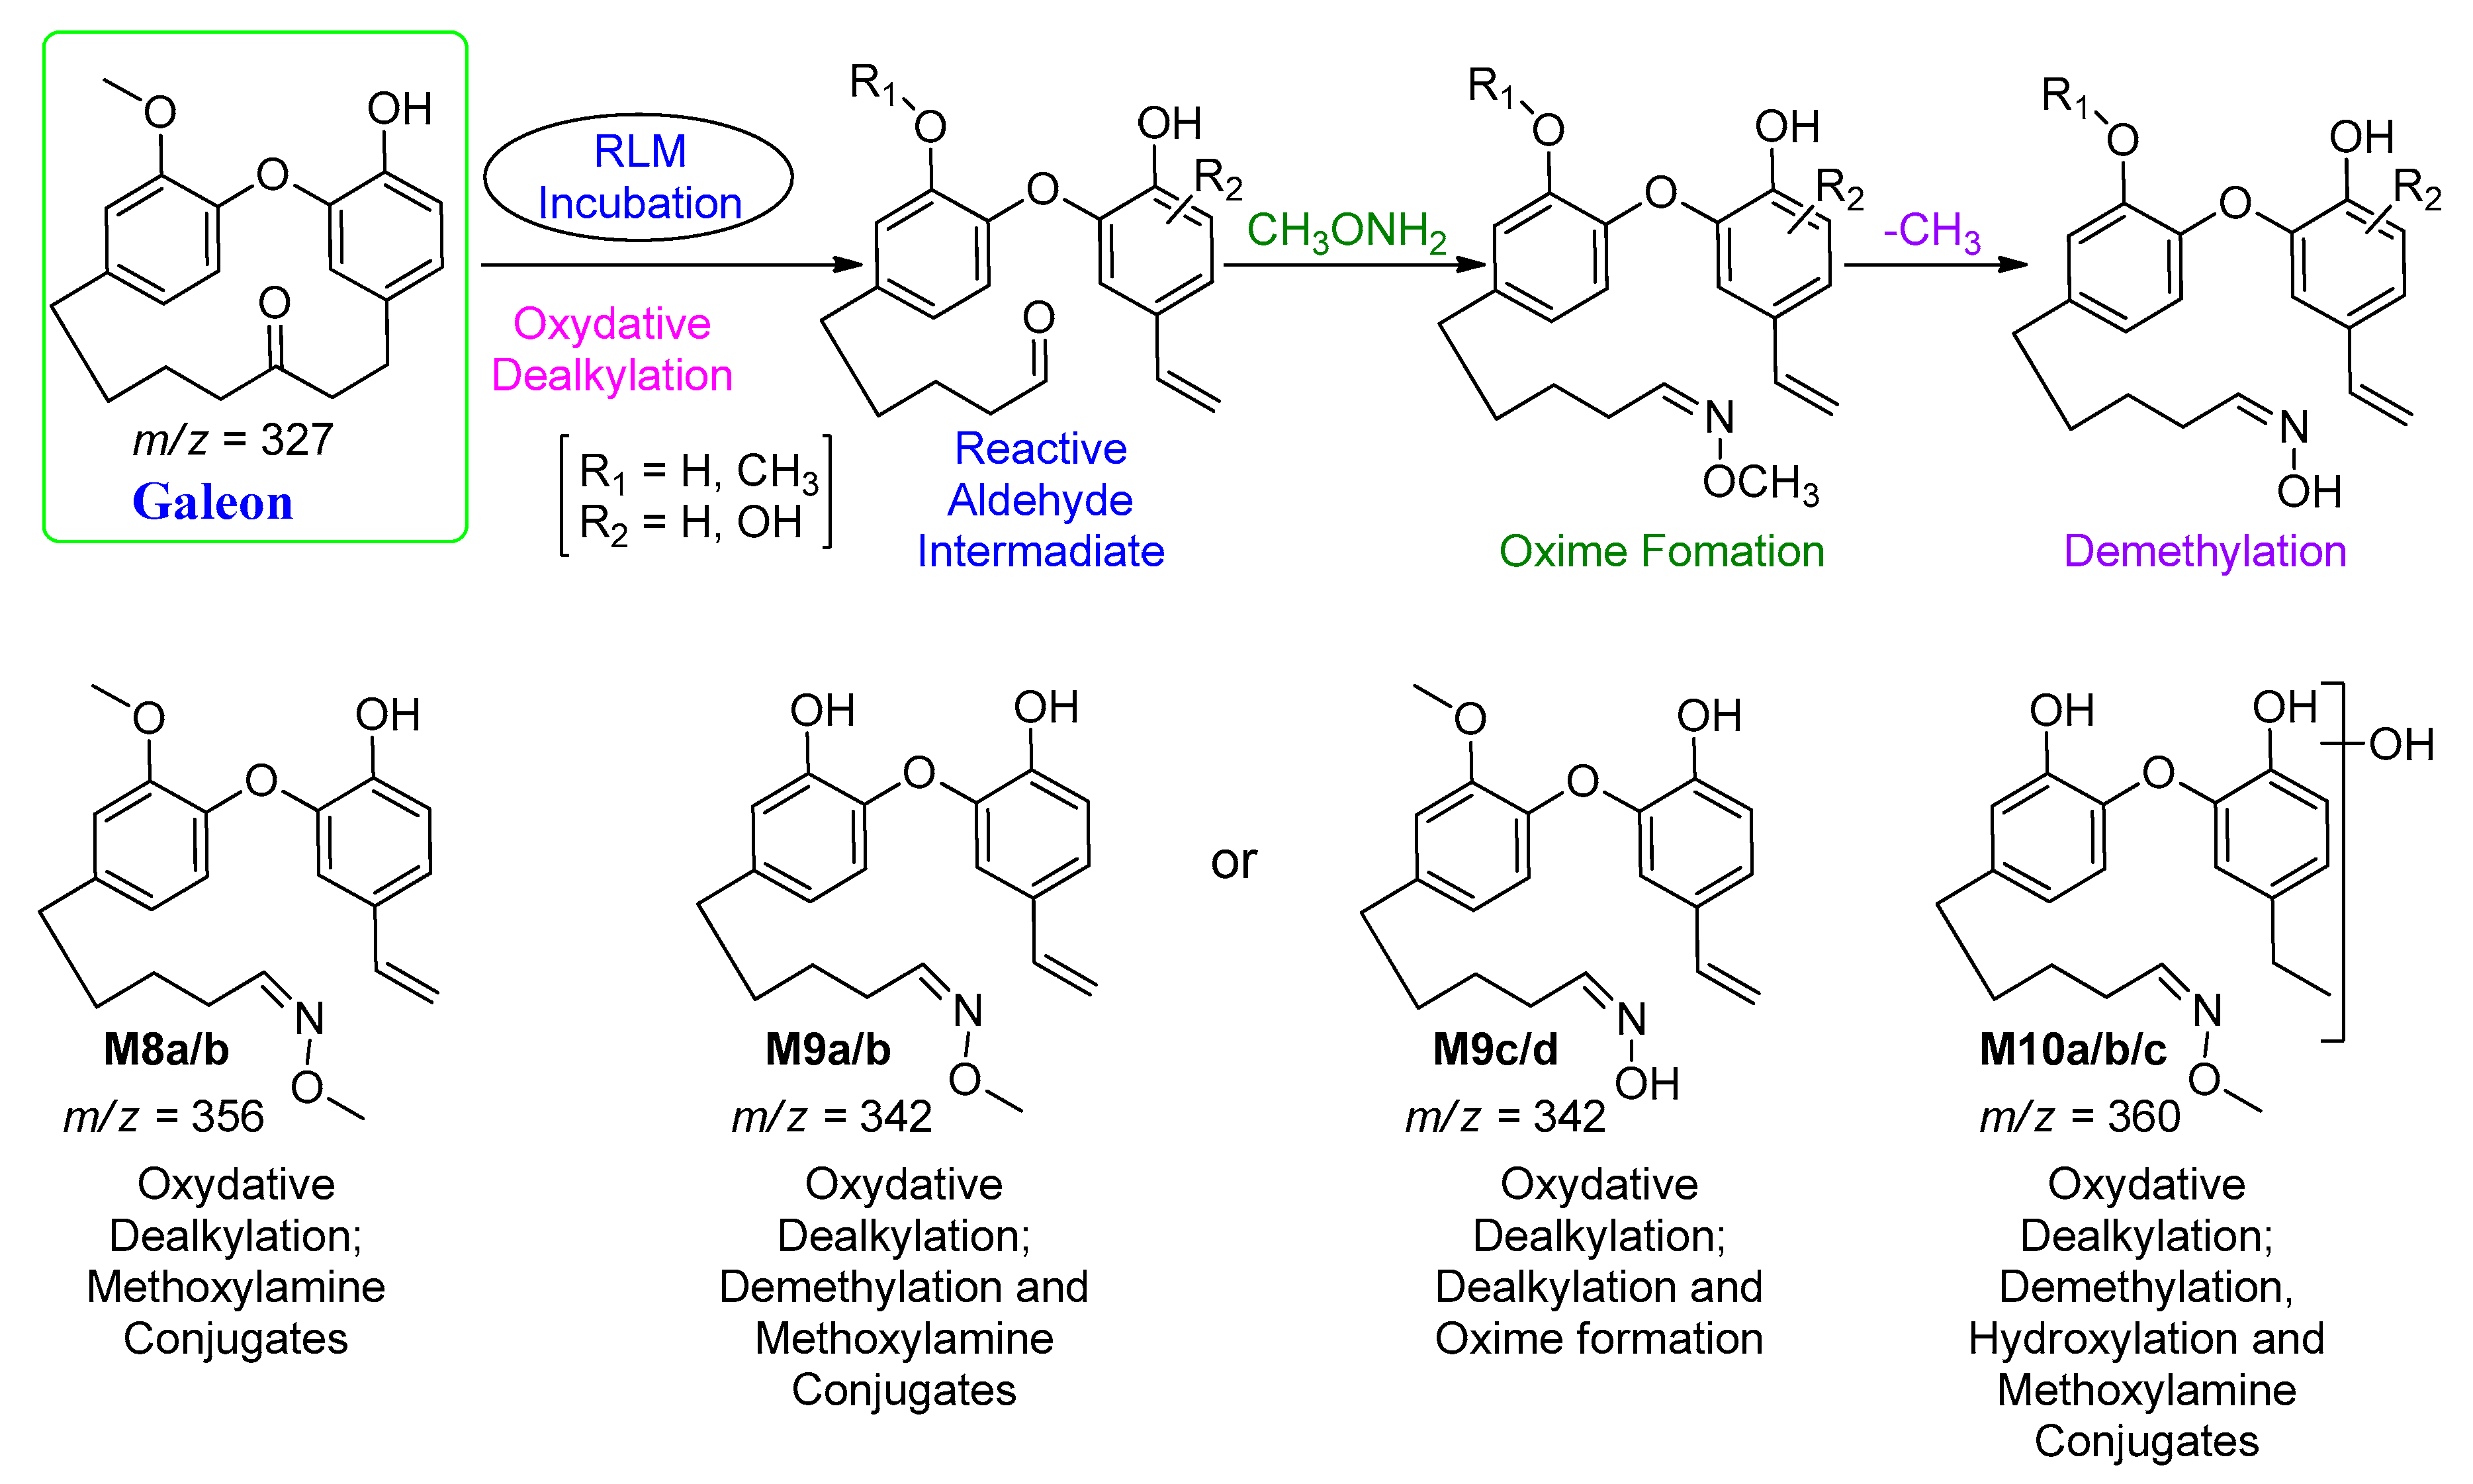
The metabolites M8a/b were tentatively identified as oxidative alkylation followed by oxime formation metabolite of galeon at m/z 356. Protonated molecular ion peaks at the retention times 31.3 min and 31.7 min gave m/z 356 [M + H]+ (Figure S8A,C), with a mass shift of 29 Da compared to the parent. The MS2 experiments of M8a and M8b at m/z 356 gave fragments at m/z 338 and 240 for M8a (Figure S8B) and m/z 294, 192, and 129 for M8b (Figure S8D), respectively. Based on the fragmentation pattern, a possible structure of the metabolites is proposed in Scheme 10, and these fragments are only possible if the structures are the same as depicted for M8a/b.
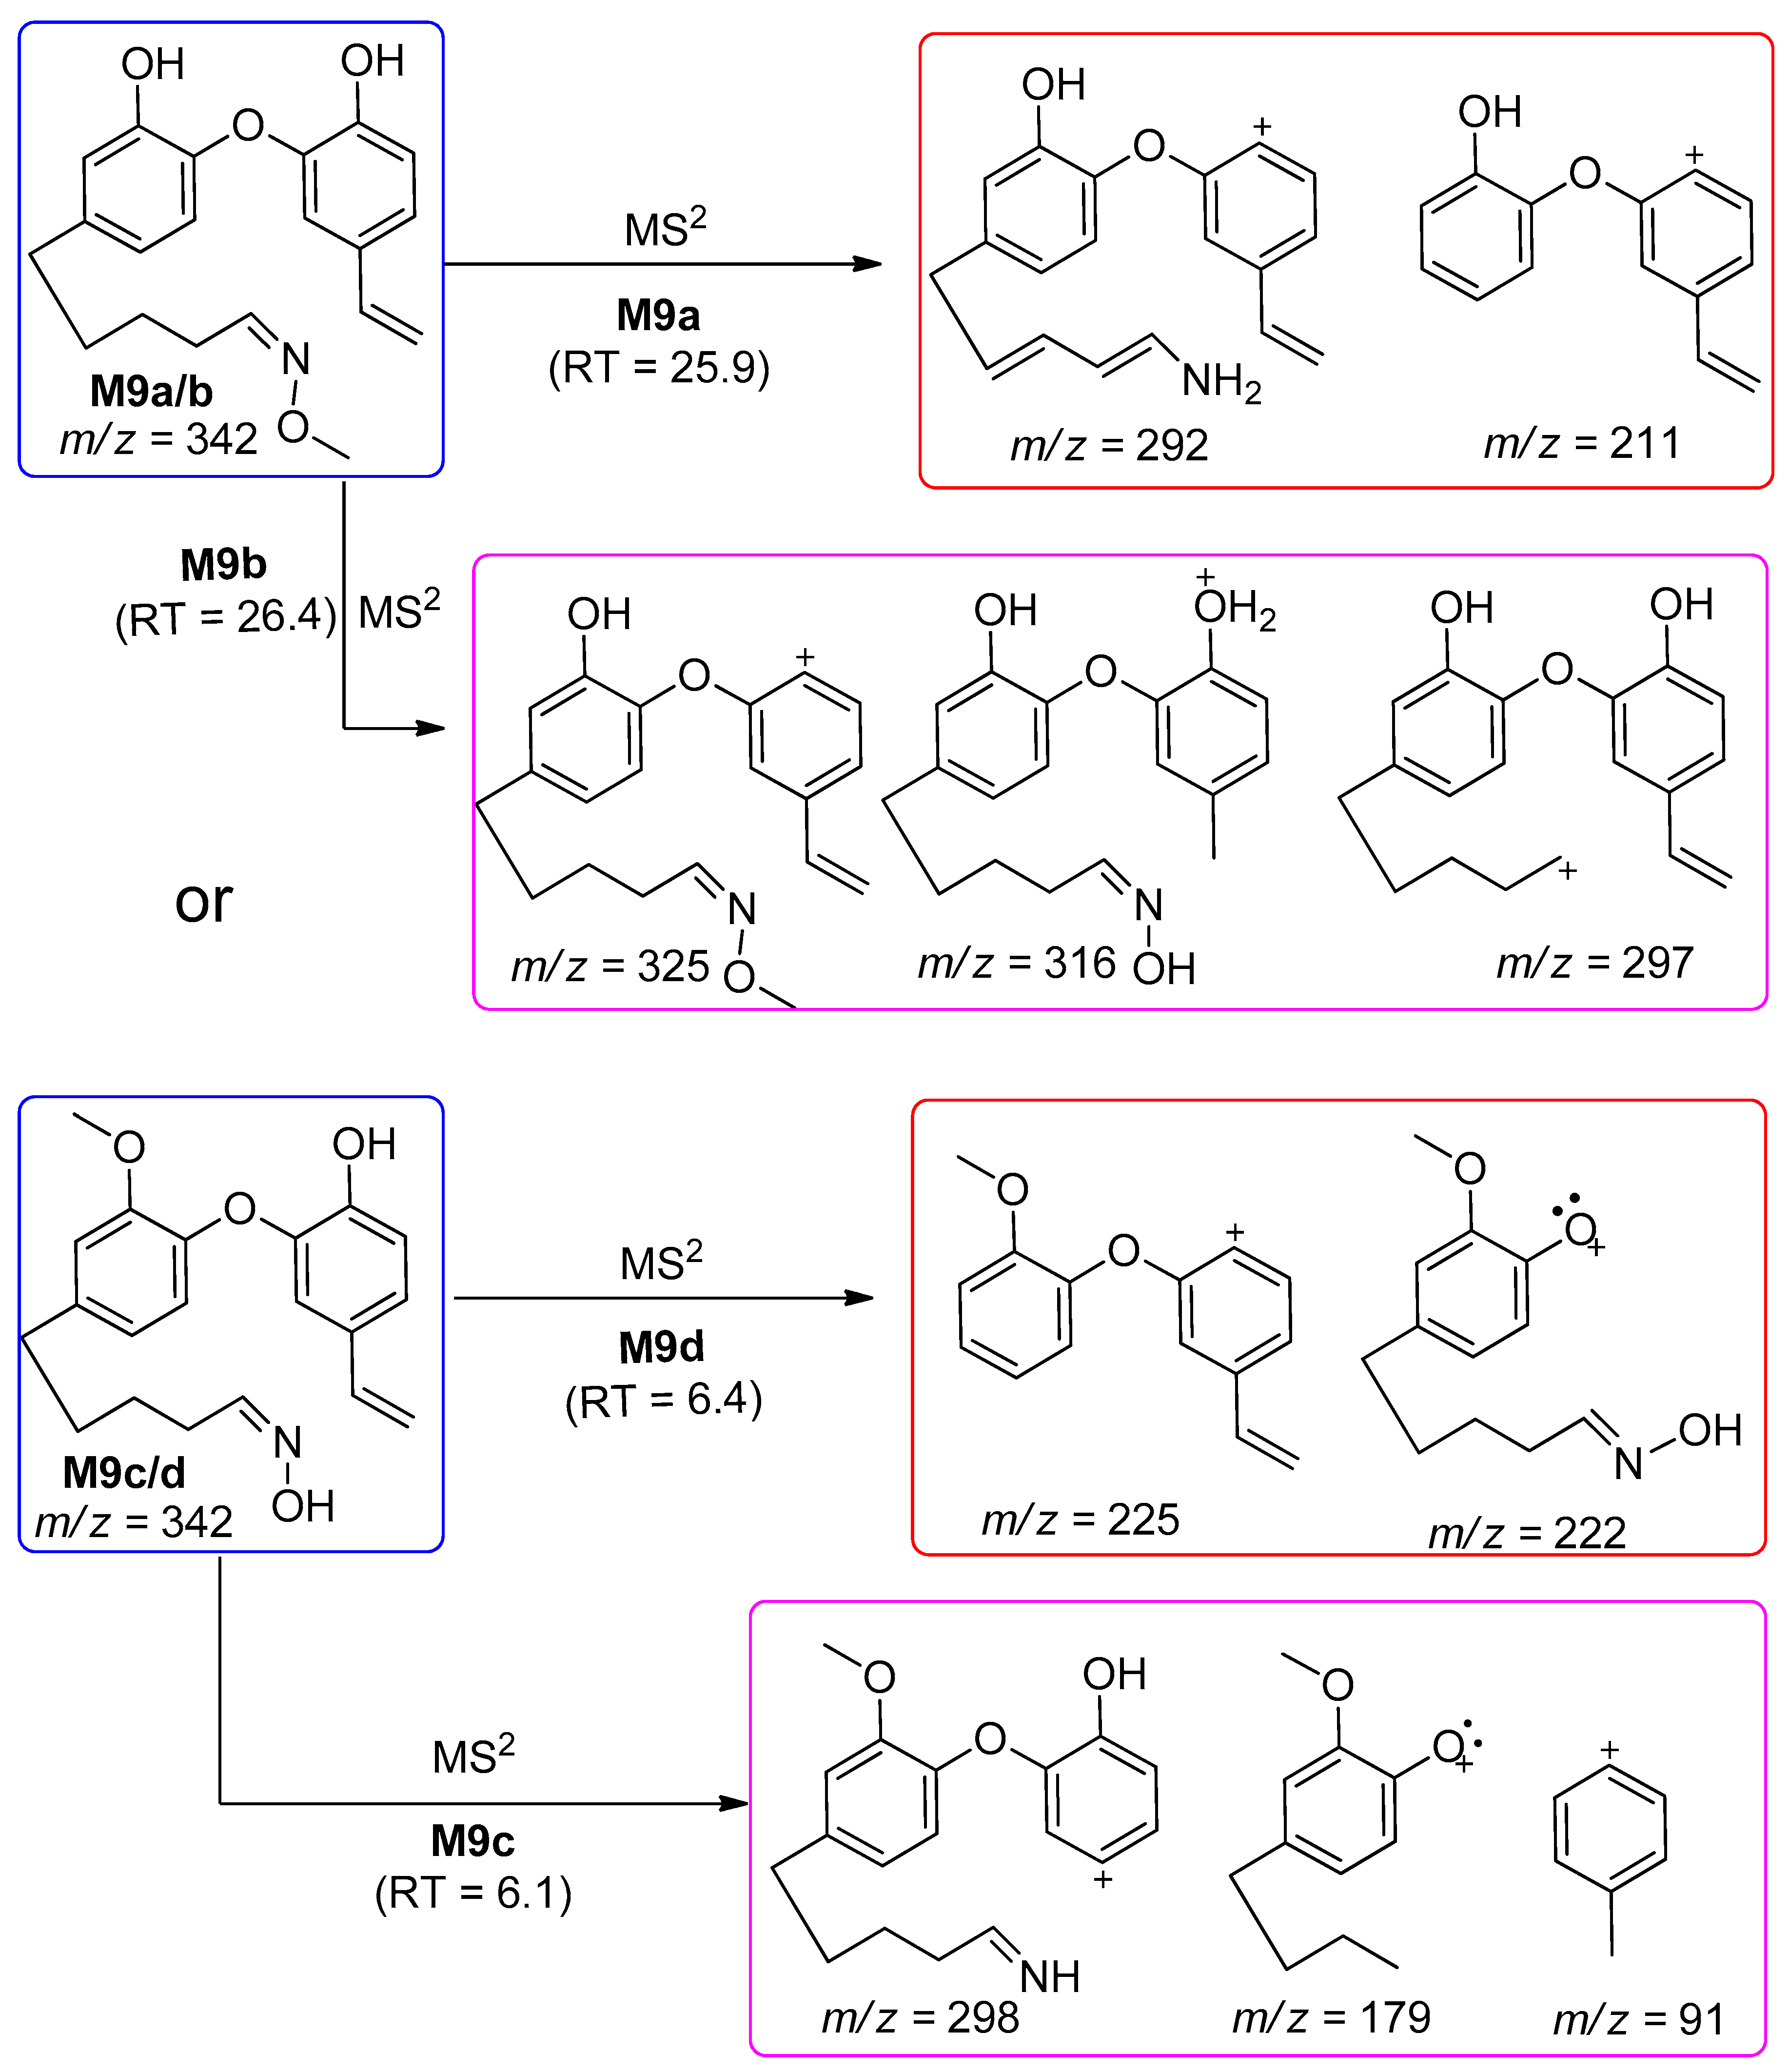
The metabolites M9a/b or metabolites M9c/d were tentatively identified as oxidative alkylation, demethylation followed by oxime formation or oxidative alkylation followed by oxime formation, demethylation in oxime metabolite of galeon at m/z 342. Protonated molecular ion peaks at the retention times 25.9 min and 26.4 min gave m/z 342 [M + H]+ (Figure S9(a/bA,a/bC)) with a mass shift of 15 Da compared to the parent. The MS2 experiments of M9a/b at 25.9 min and 26.4 min at m/z 342 gave fragments at m/z 292 and 211 (Figure S9(a/bB)) and m/z 325, 316, and 297 (Figure S9(a/bD)), respectively. Another set of peaks with the same molecular mass (m/z 342 [M + H]+) was observed at 6.1 and 6.4 min, which possibly were isomers of 9a/b and 9c/d (Figure S9(c/dA)) having a free oxime group. Fragmentation of each peak gave fragments at m/z 298, 179, and 91 (Figure S9(c/dB)) and m/z 225 and 222 (Figure S9(c/dC)), respectively. Based on the fragmentation pattern, the possible structures of the metabolites are proposed in Scheme 11, and these fragments are only possible if the structures are the same as depicted for M9ad.
The metabolites M10a/b/c were tentatively identified as oxidative alkylation followed by oxime formation, demethylation, and hydroxylation in galeon at m/z 360. Protonated molecular ion peaks at the retention times 20.8, 22.8, and 23.8 min give m/z 360 [M + H]+ (Figure S10A,C,E) with a mass shift of 33 Da compared to the parent. The MS2 experiments of m/z 360 at 20.8, 22.8, and 23.8 min gave fragments at m/z 343 and 325 (Figure S10B), m/z 342, 331, and 316 (Figure S10D), and m/z 325, 316, and 250 (Figure S10F), accordingly. Based on the fragmentation pattern, the only possible structures of the metabolites are proposed in Scheme 12.
Based on the mass spectra and fragmentation patterns of identified metabolites M8 to M10, possible metabolic reactions of galeon and tentative structures of the identified metabolites are depicted in Scheme 13.
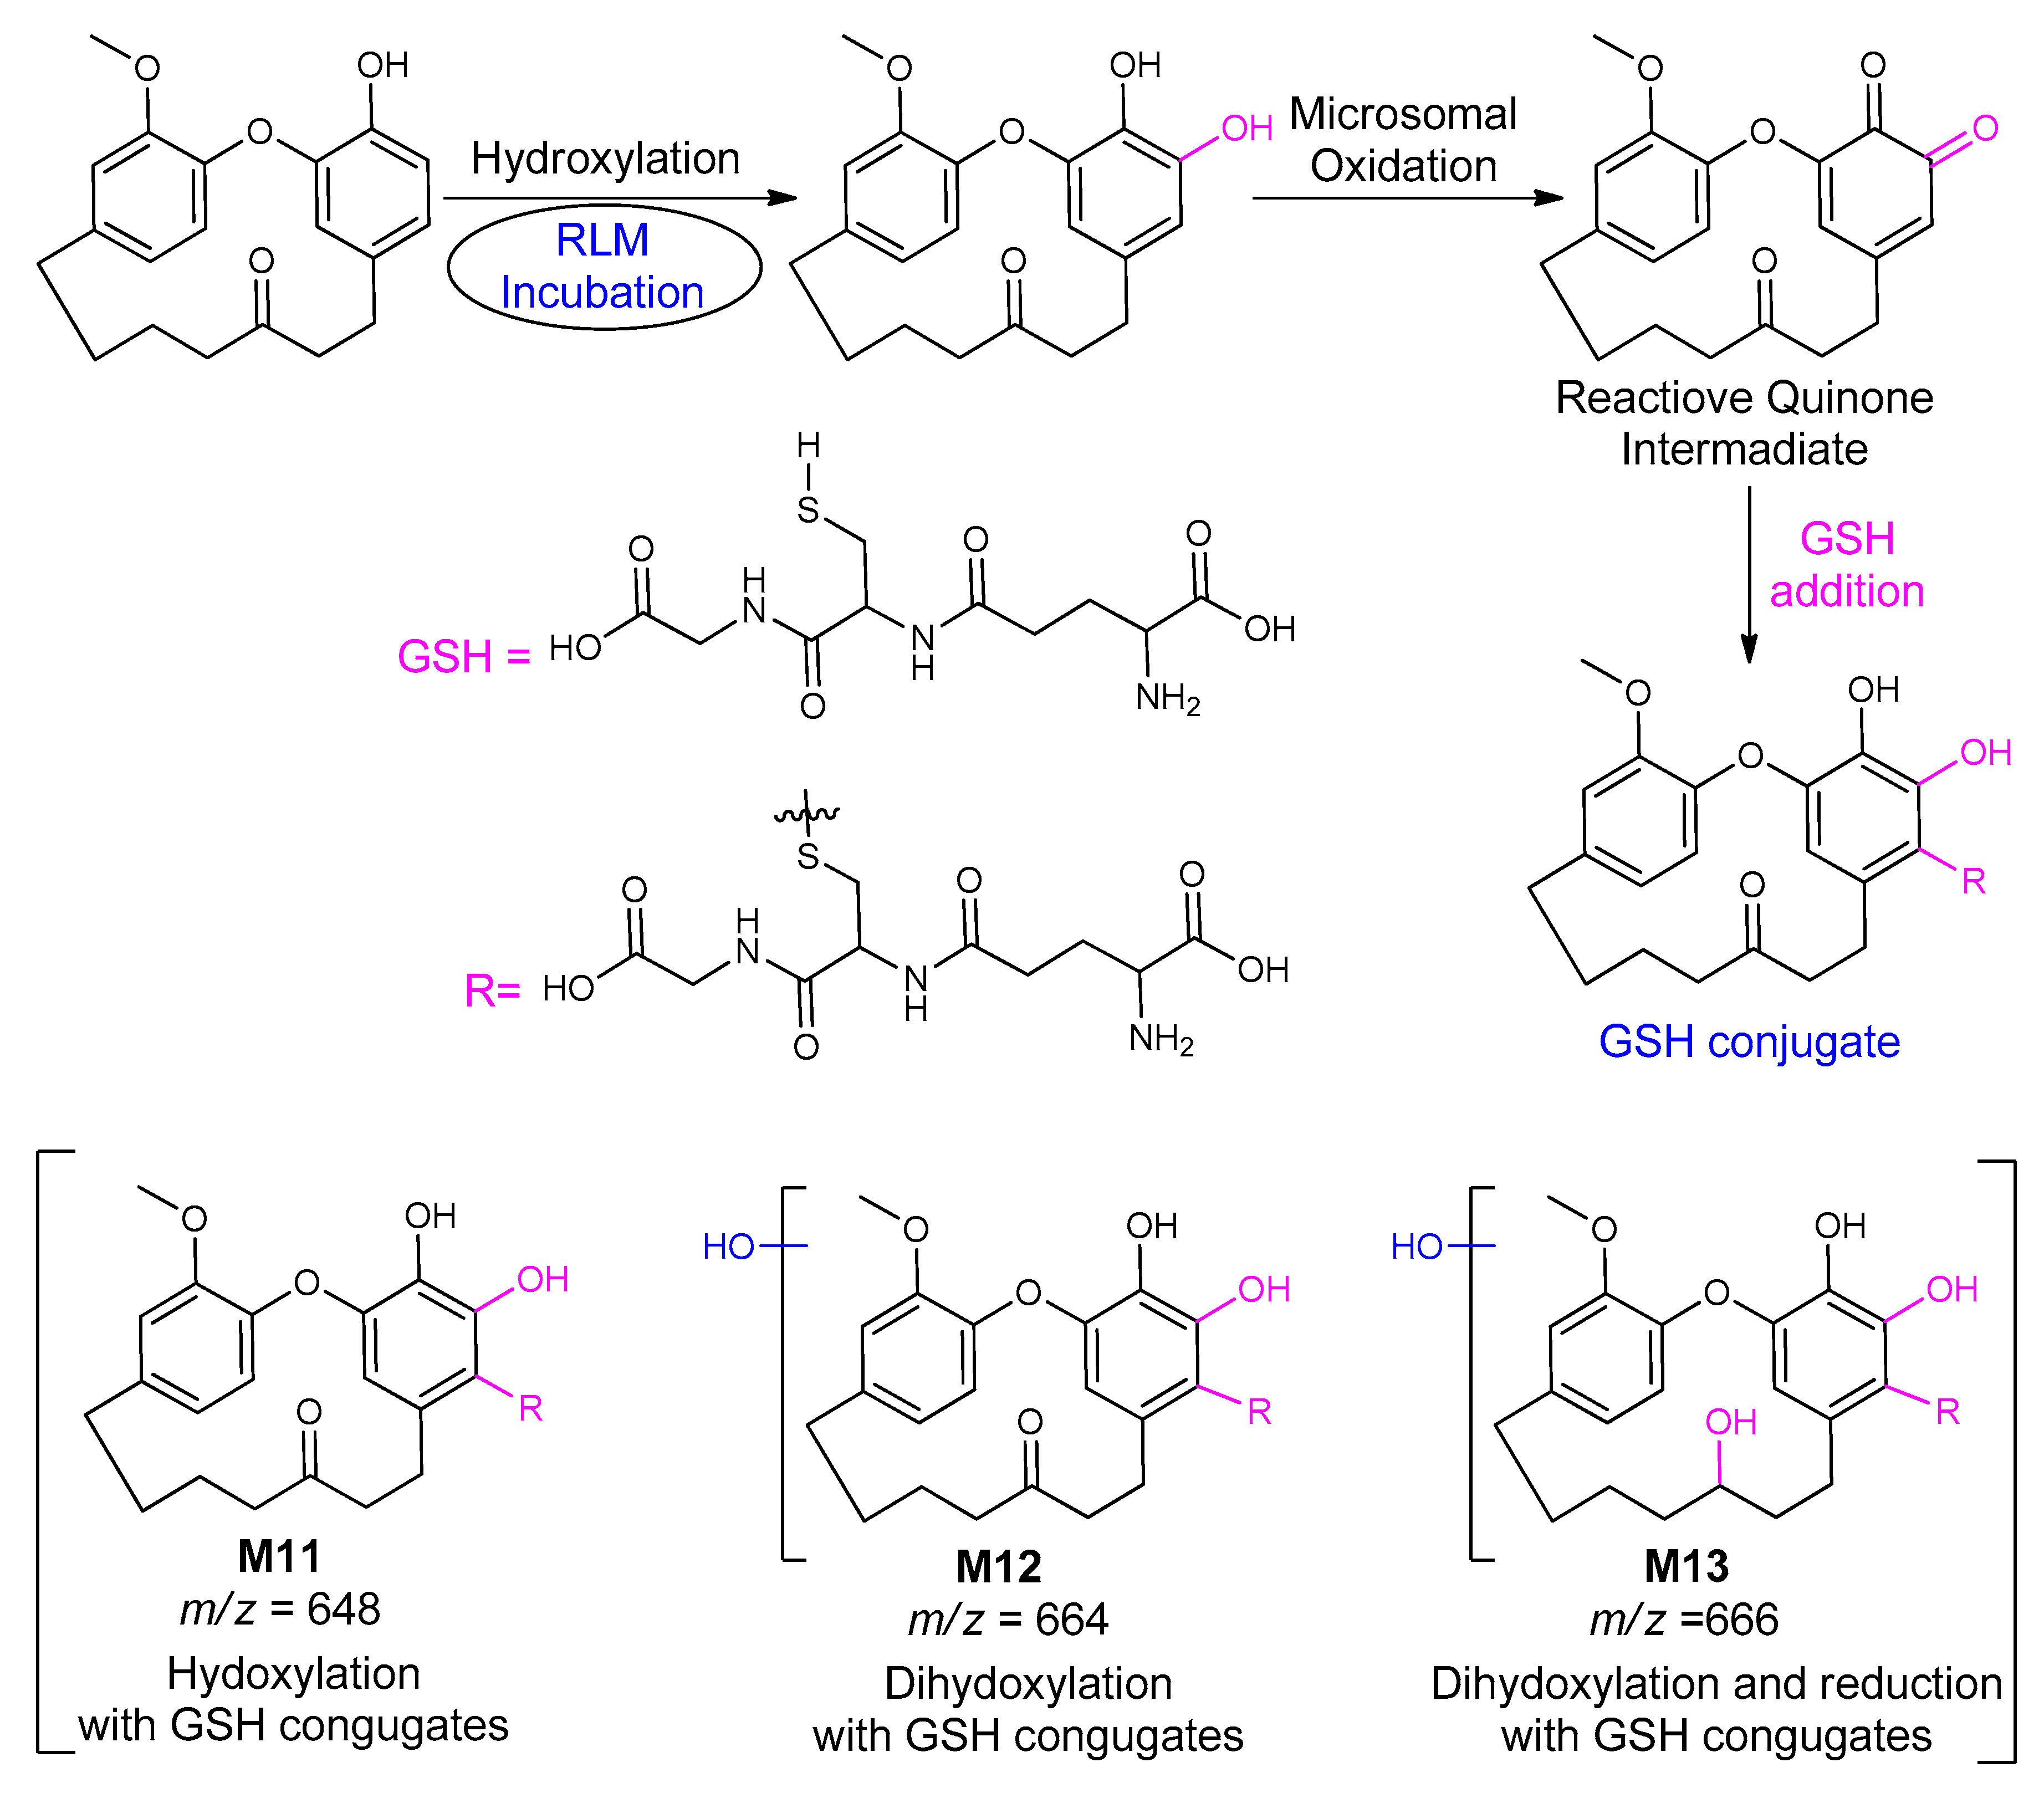
Screening for GSH adducts in the control galeon incubation without RLMs revealed the absence of GSH peaks in the Total Ion Chromatogram (TIC). Bio-activation of galeon requires an enzyme for the hydroxylation and subsequent oxidation to form the quinone reactive intermediates, which only occurs in the presence of RLMs (Scheme 14).
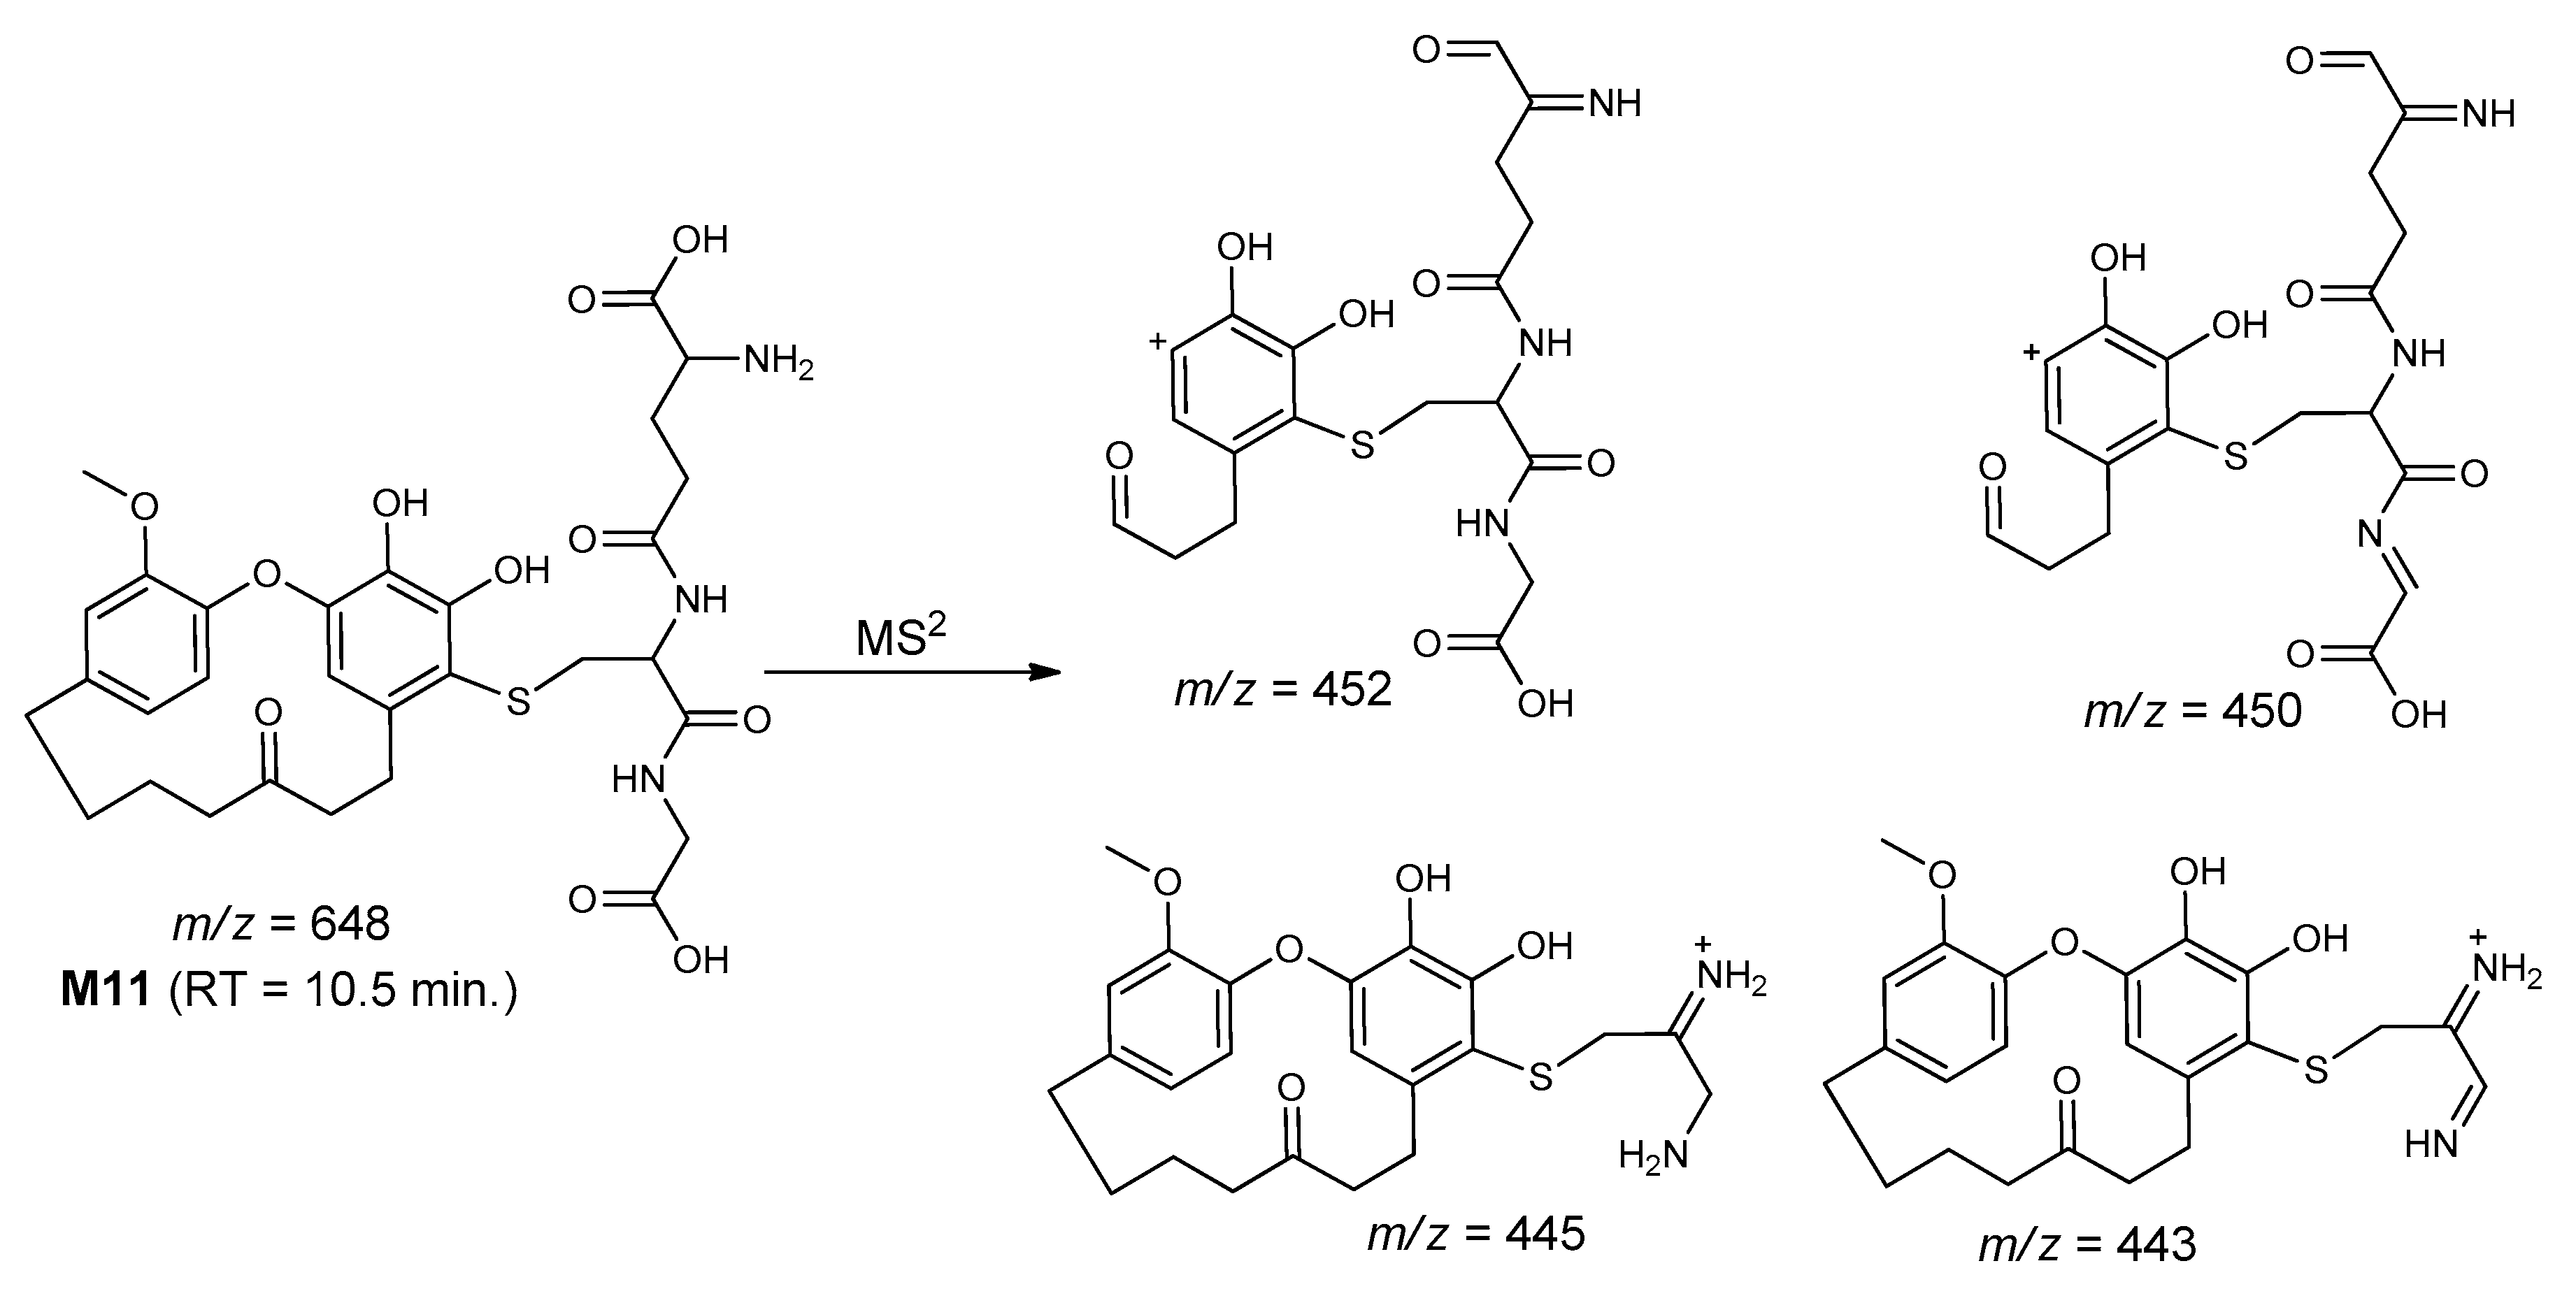
The metabolite M11 was tentatively identified as hydroxylation followed by GSH conjugation of galeon at m/z 648. A protonated molecular ion peak at the retention time 10.5 min gave m/z 648 [M + H]+ (Figure S11A) with a mass shift of 323 Da compared to the parent, where hydroxylation followed by GSH conjugation took place. The MS2 experiment of M11 at m/z 648 gave fragments at m/z 452, 450, 445, and 443 (Figure S11C). Based on the fragmentation pattern, these fragments were only possible if the structure of the metabolite was the same as proposed in Scheme 15, indicating the confirmation of the GSH conjugate of galeon (M11).
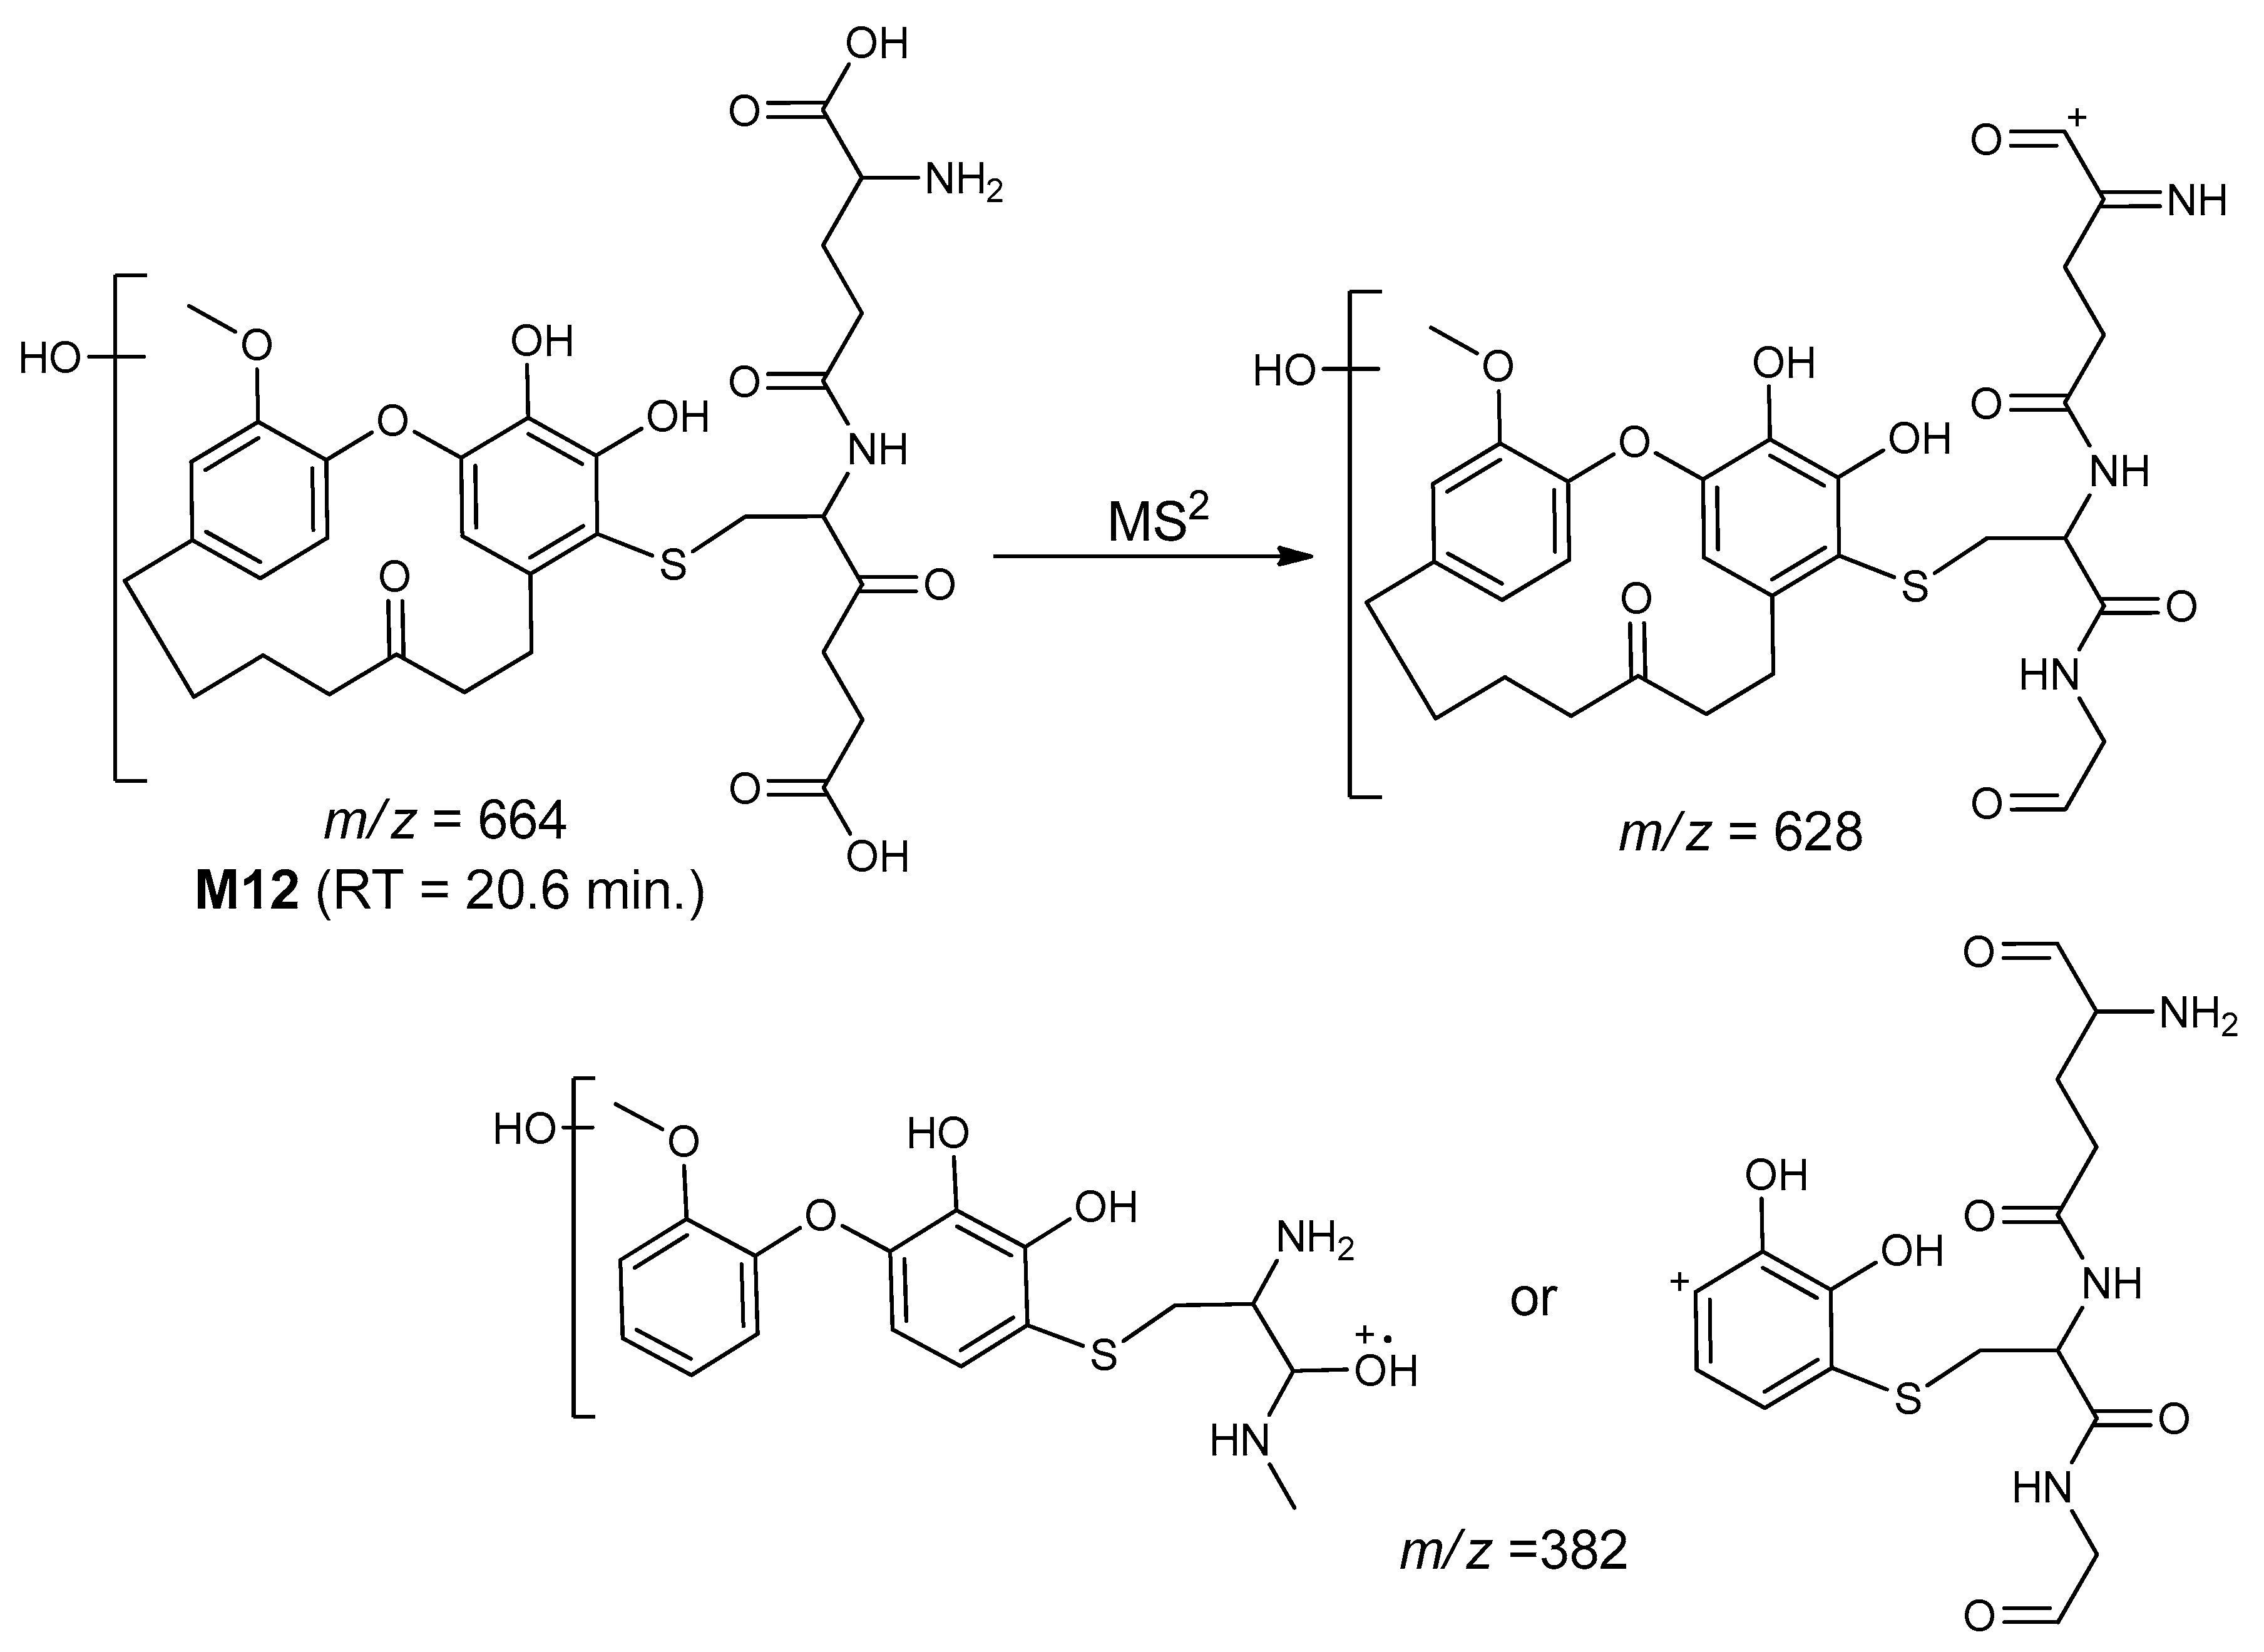
The metabolites M12 was tentatively identified as dihydroxylation followed by GSH conjugation of galeon at m/z 664. A protonated molecular ion peak at the retention time 20.6 min gave m/z 664 [M + H]+ (Figure S12A) with mass shift of 337 Da compared to the parent, where dihydroxylation followed by GSH conjugation occurred. The MS2 experiment of M12 at m/z 664 gave fragments at m/z 628 and 382 (Figure S12B). Based on the fragmentation pattern, these fragments were only possible if the structure of the metabolite M12 was the same as proposed in Scheme 16, indicating the confirmation of the GSH conjugate of galeon (M12).
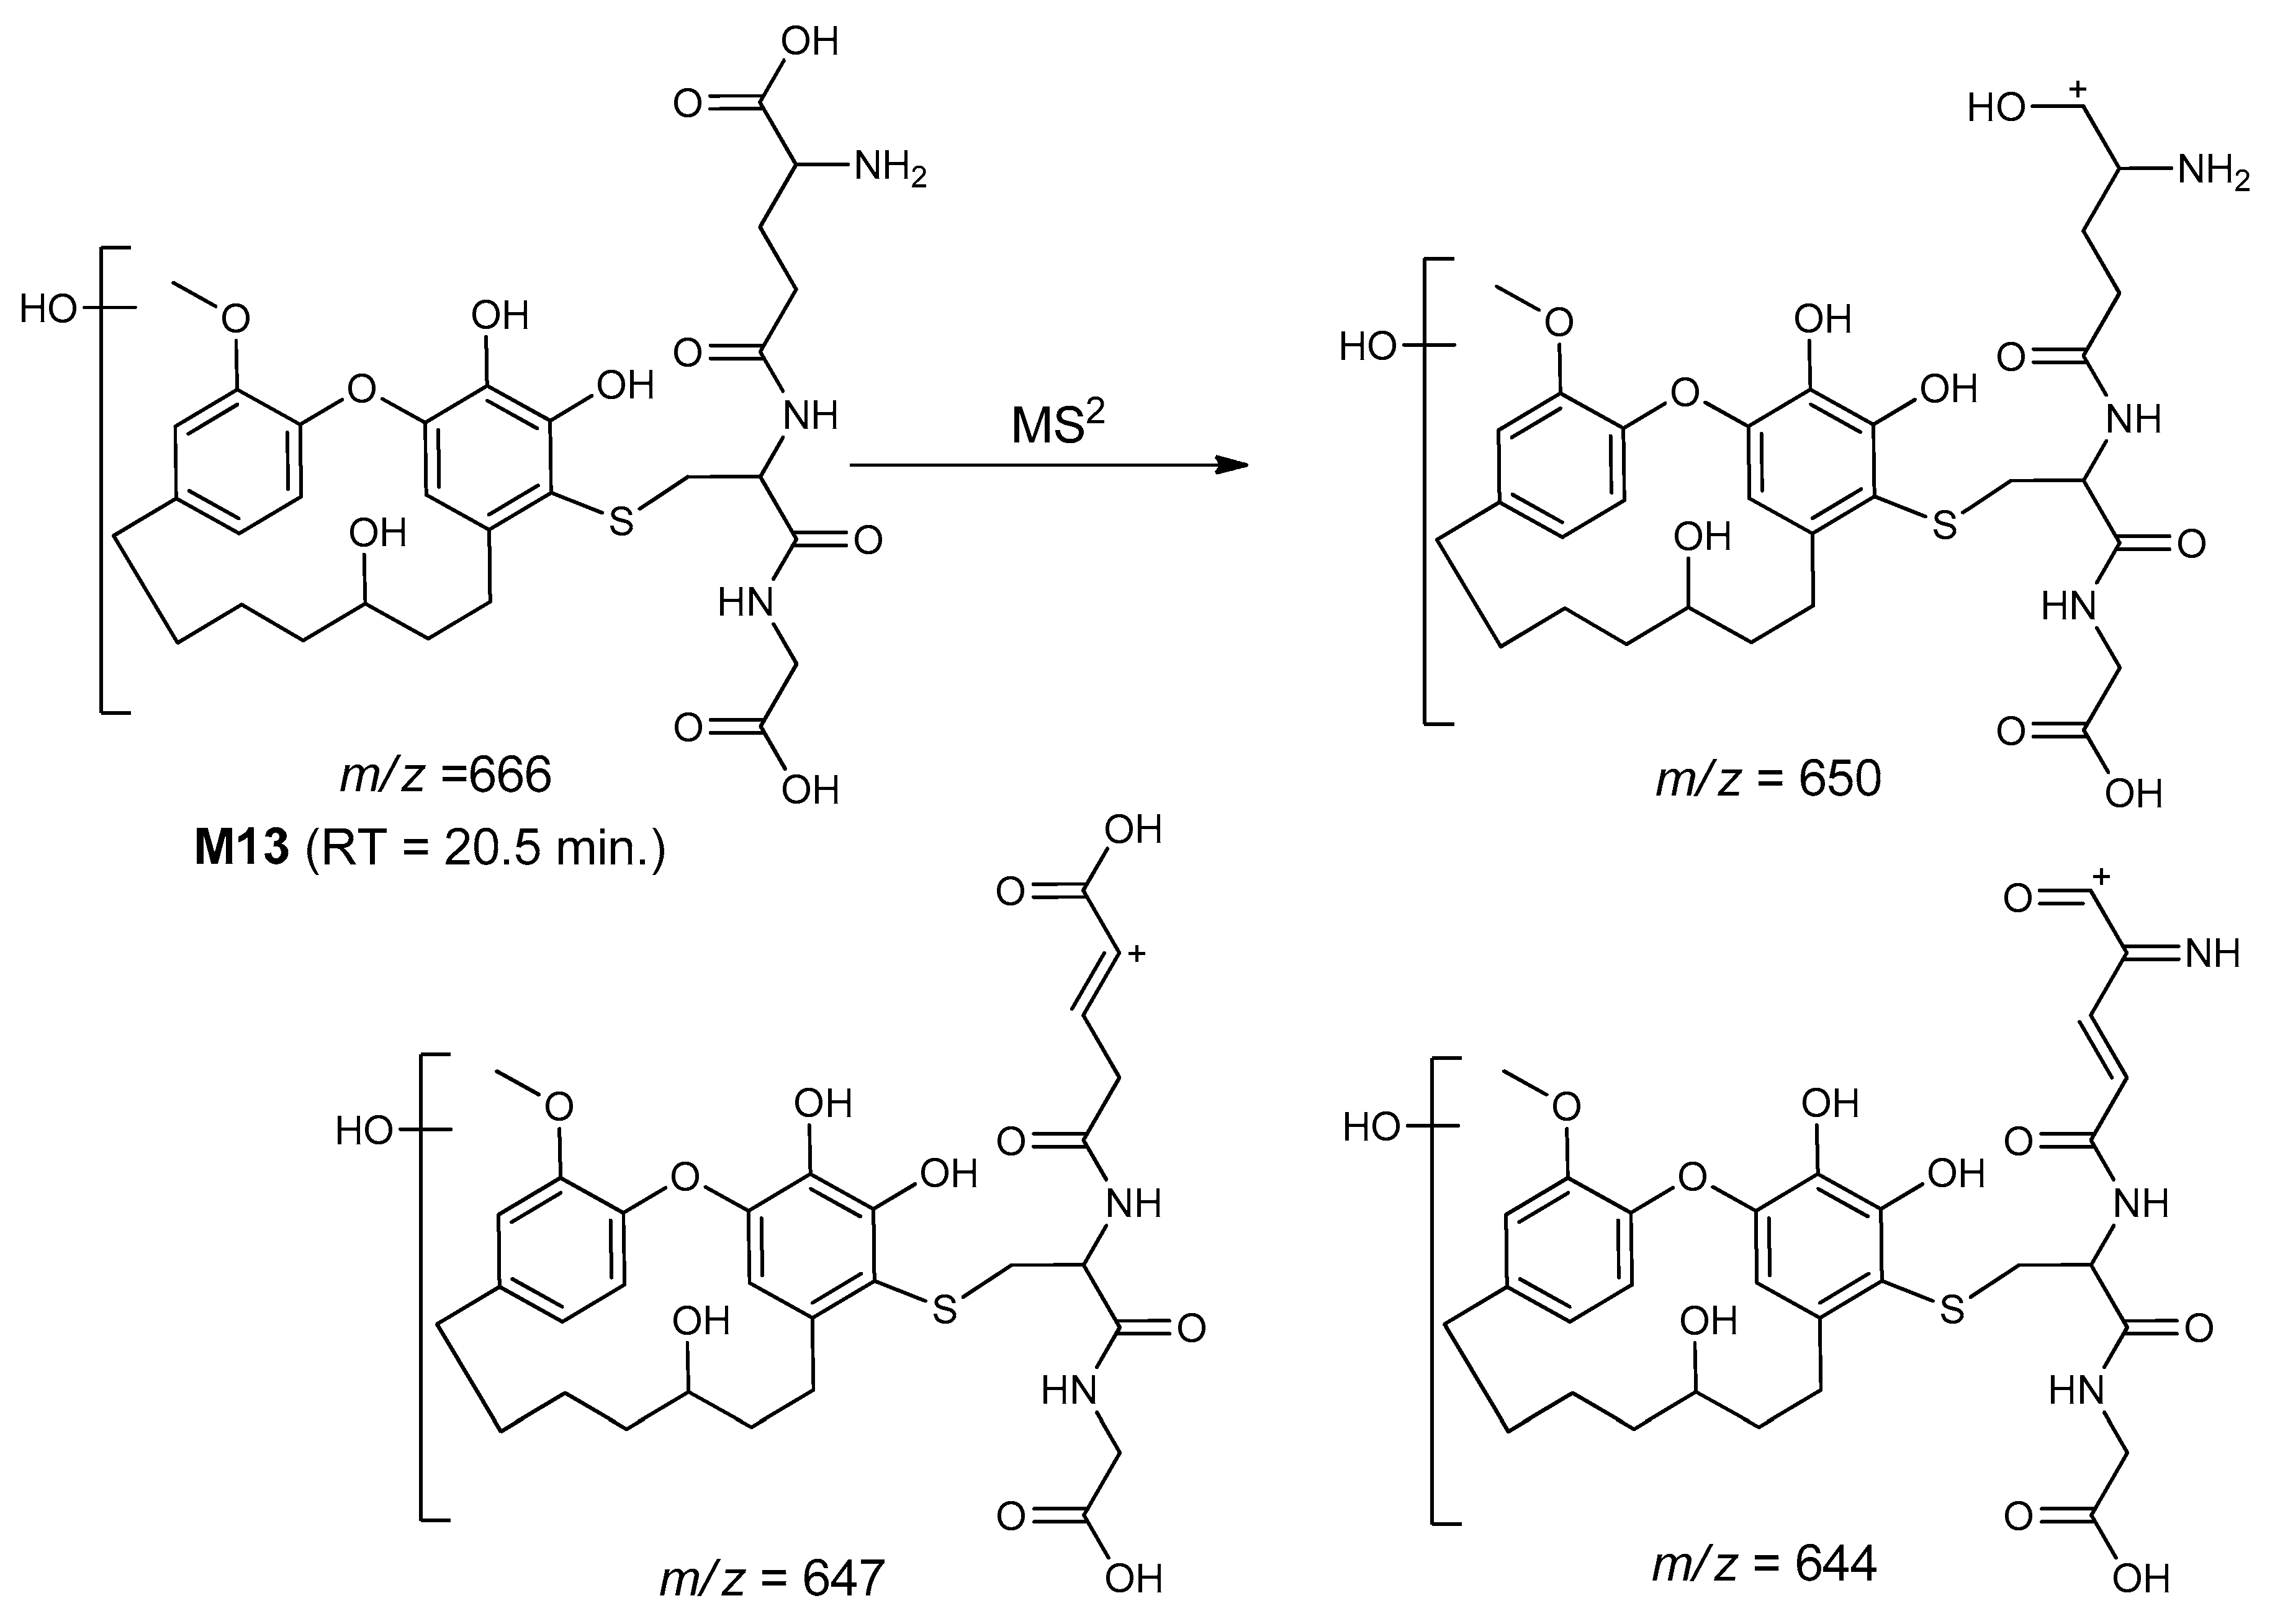
The metabolite M13 was tentatively identified as dihydroxylation and reduction followed by GSH conjugation of galeon at m/z 666. A protonated molecular ion peak at the retention time 20.5 min gave m/z 666 [M + H]+ (Figure S13A) with a mass shift of 339 Da compared to the parent, where dihydroxylation and reduction followed by GSH conjugation occurred. The MS2 experiment of M13 at m/z 666 gave fragments at m/z 650, 647, and 644 (Figure S13B). Based on the fragmentation pattern, theses fragments were only possible if the structure of the metabolite M13 was the same as proposed in Scheme 17, indicating the confirmation of the GSH conjugate of galeon (M13).

2.4. In Silico Binding Mechanism of Galeon with Cytochrome P450 Isoforms

The in silico metabolism analysis of galeon, as shown in Figure 2 and Figure 3, indicate that the C1 position was the most vulnerable metabolic site of galeon (Figure 2A), and CYP450 isoforms led to a variable range of metabolisms starting from 64% to 99% (Figure 3), where the CYP2C9 isoform gave the least (64%) and CYP1A2 gave the highest (99%) metabolism. In order to understand how galeon interacts with the CYP450 isoforms to lead to such a different range of metabolism, in silico docking analysis for the interaction of galeon with CYP450 isoforms was performed. Therefore, only the isoforms with more than 90% metabolism profiling were selected, excluding those below 90%, except for CYP3A4, as the software predicted its involvement in various metabolic reactions at various target sites in galeon.
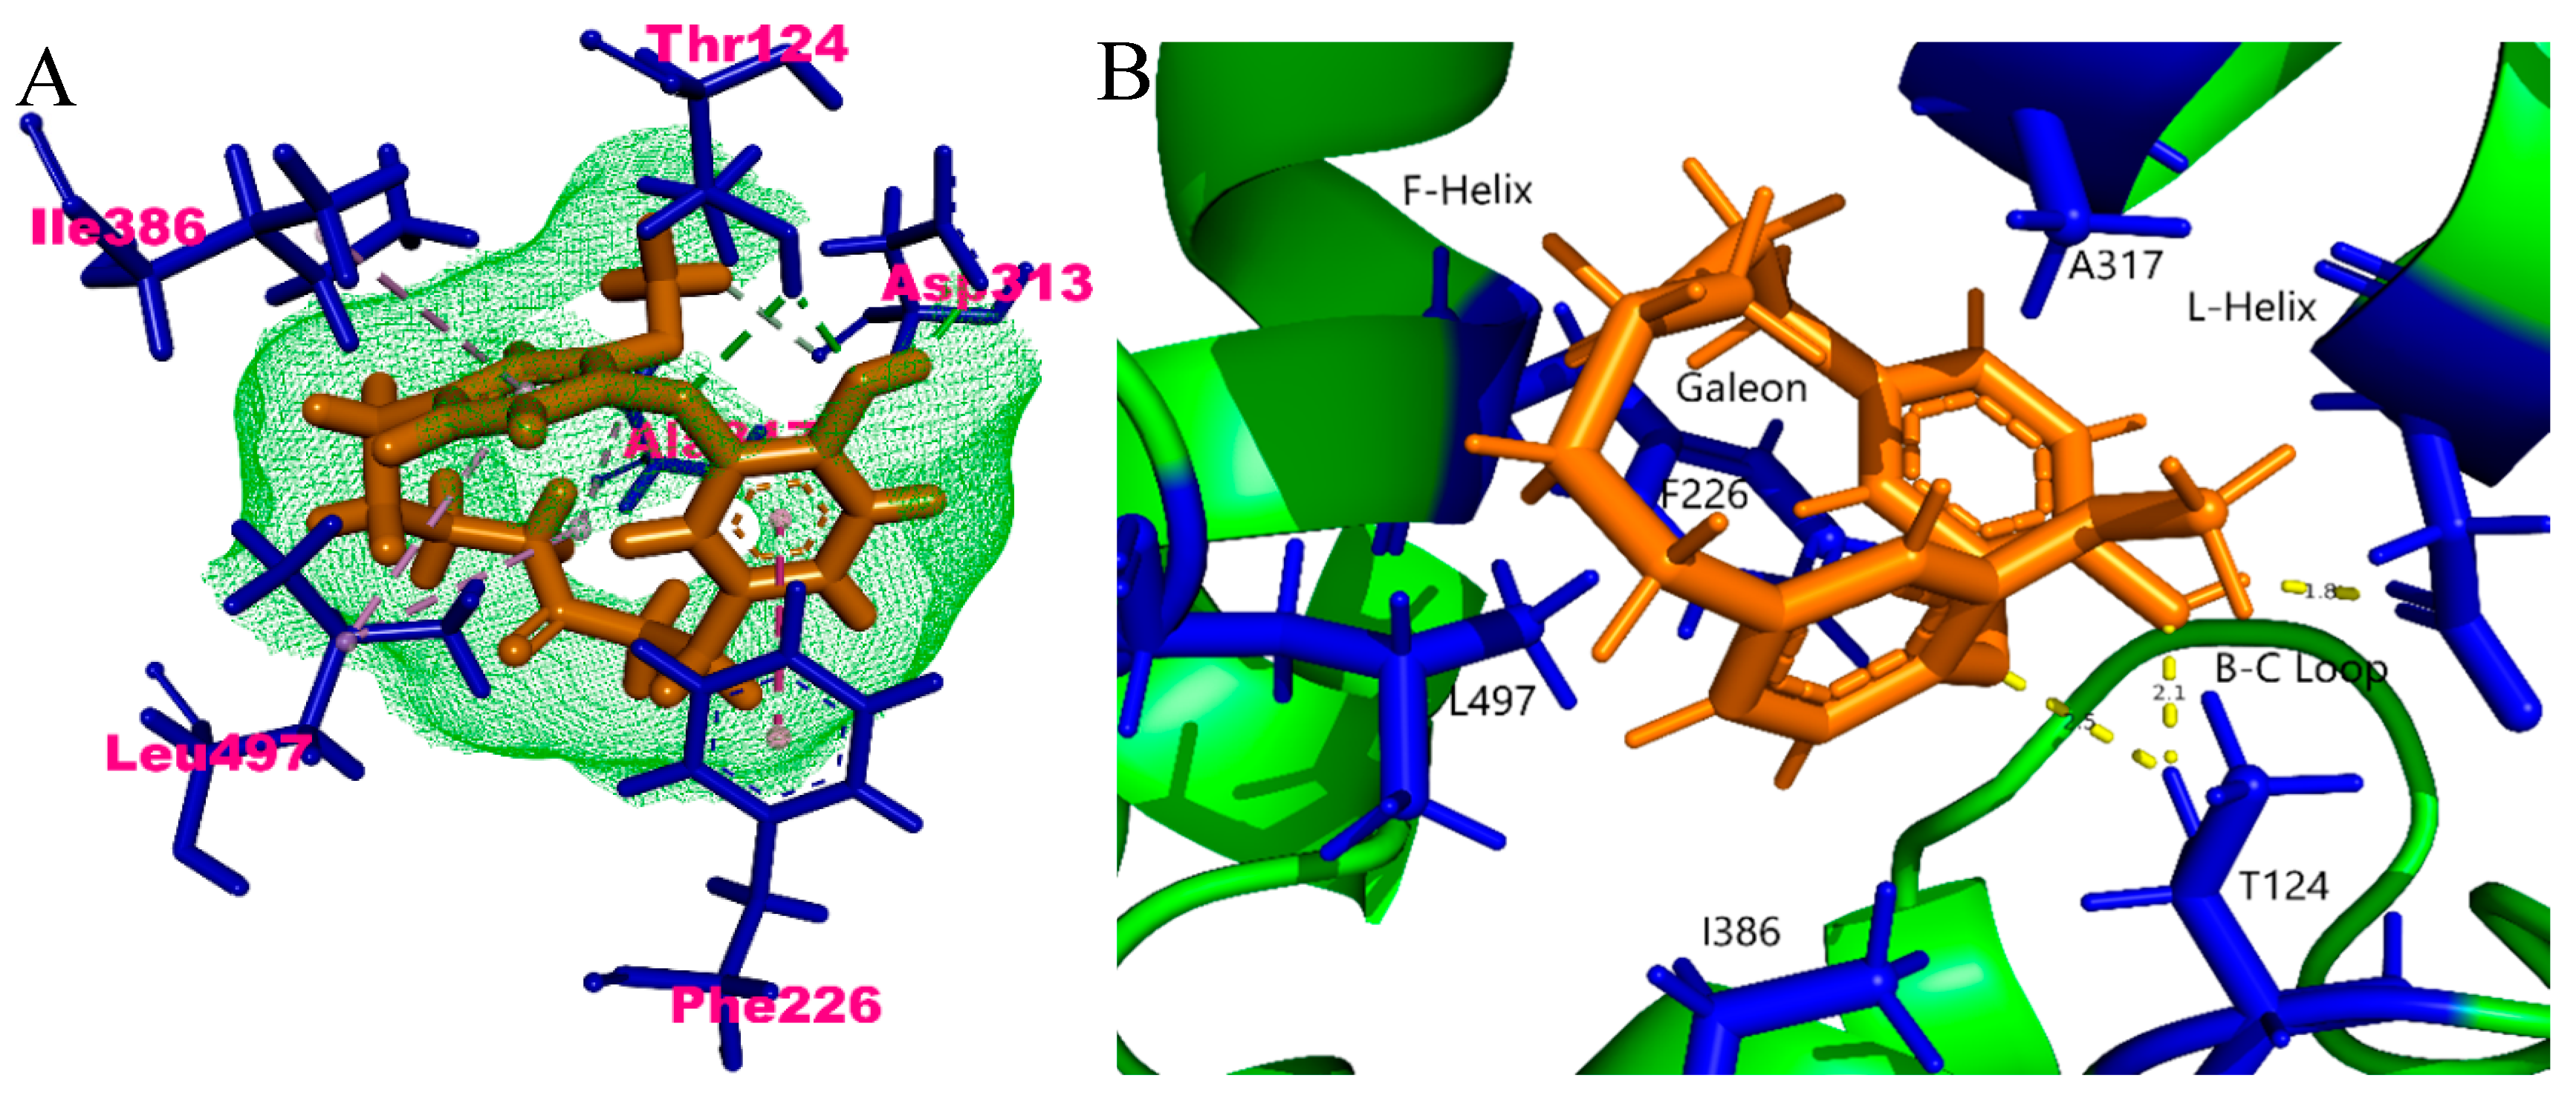
Firstly, in silico docking analysis was carried out for the CYP1A2 isoform which showed the maximum metabolic profiling (99%) prediction. We found that galeon interacts with the active site of CYP1A2 via the Thr124, Phe226, Asp313, Ala317, Ile386, and Leu497 residues (Figure 5A). Among these residues, Thr124 and Asp313 formed conventional hydrogen bonds with the –OH group at the number 16 position of galeon. Additionally, Phe226 formed π–π stacked bond, while Ala317, Ile386, and Leu497 formed π–alkyl interactions. Analyzing the crystal structure of CYP1A2 isoforms, it was evident that Phe226 from Helix-F produced a substrate binding surface as well as a Ala317 side chain from Helix-L and other residues forming the binding cavity [38]. Further hydrogen bonding interactions with the side chain of Thr223 on Helix-F with the side chain of Asp320 on Helix-L, connecting both helices at the roof of the cavity. Both Thr223 and Asp320 provide an extensive network of interactions supporting the active site. Although galeon missed some important residue interactions of the CYP1A2 active site, the docking study revealed clear interactions of galeon with Phe226 of Helix-F and Ala317 of Helix-L (Figure 5A,B), which is enough to support the in silico metabolic profiling with only one metabolic target site in galeon by the CYP1A2 isoform.
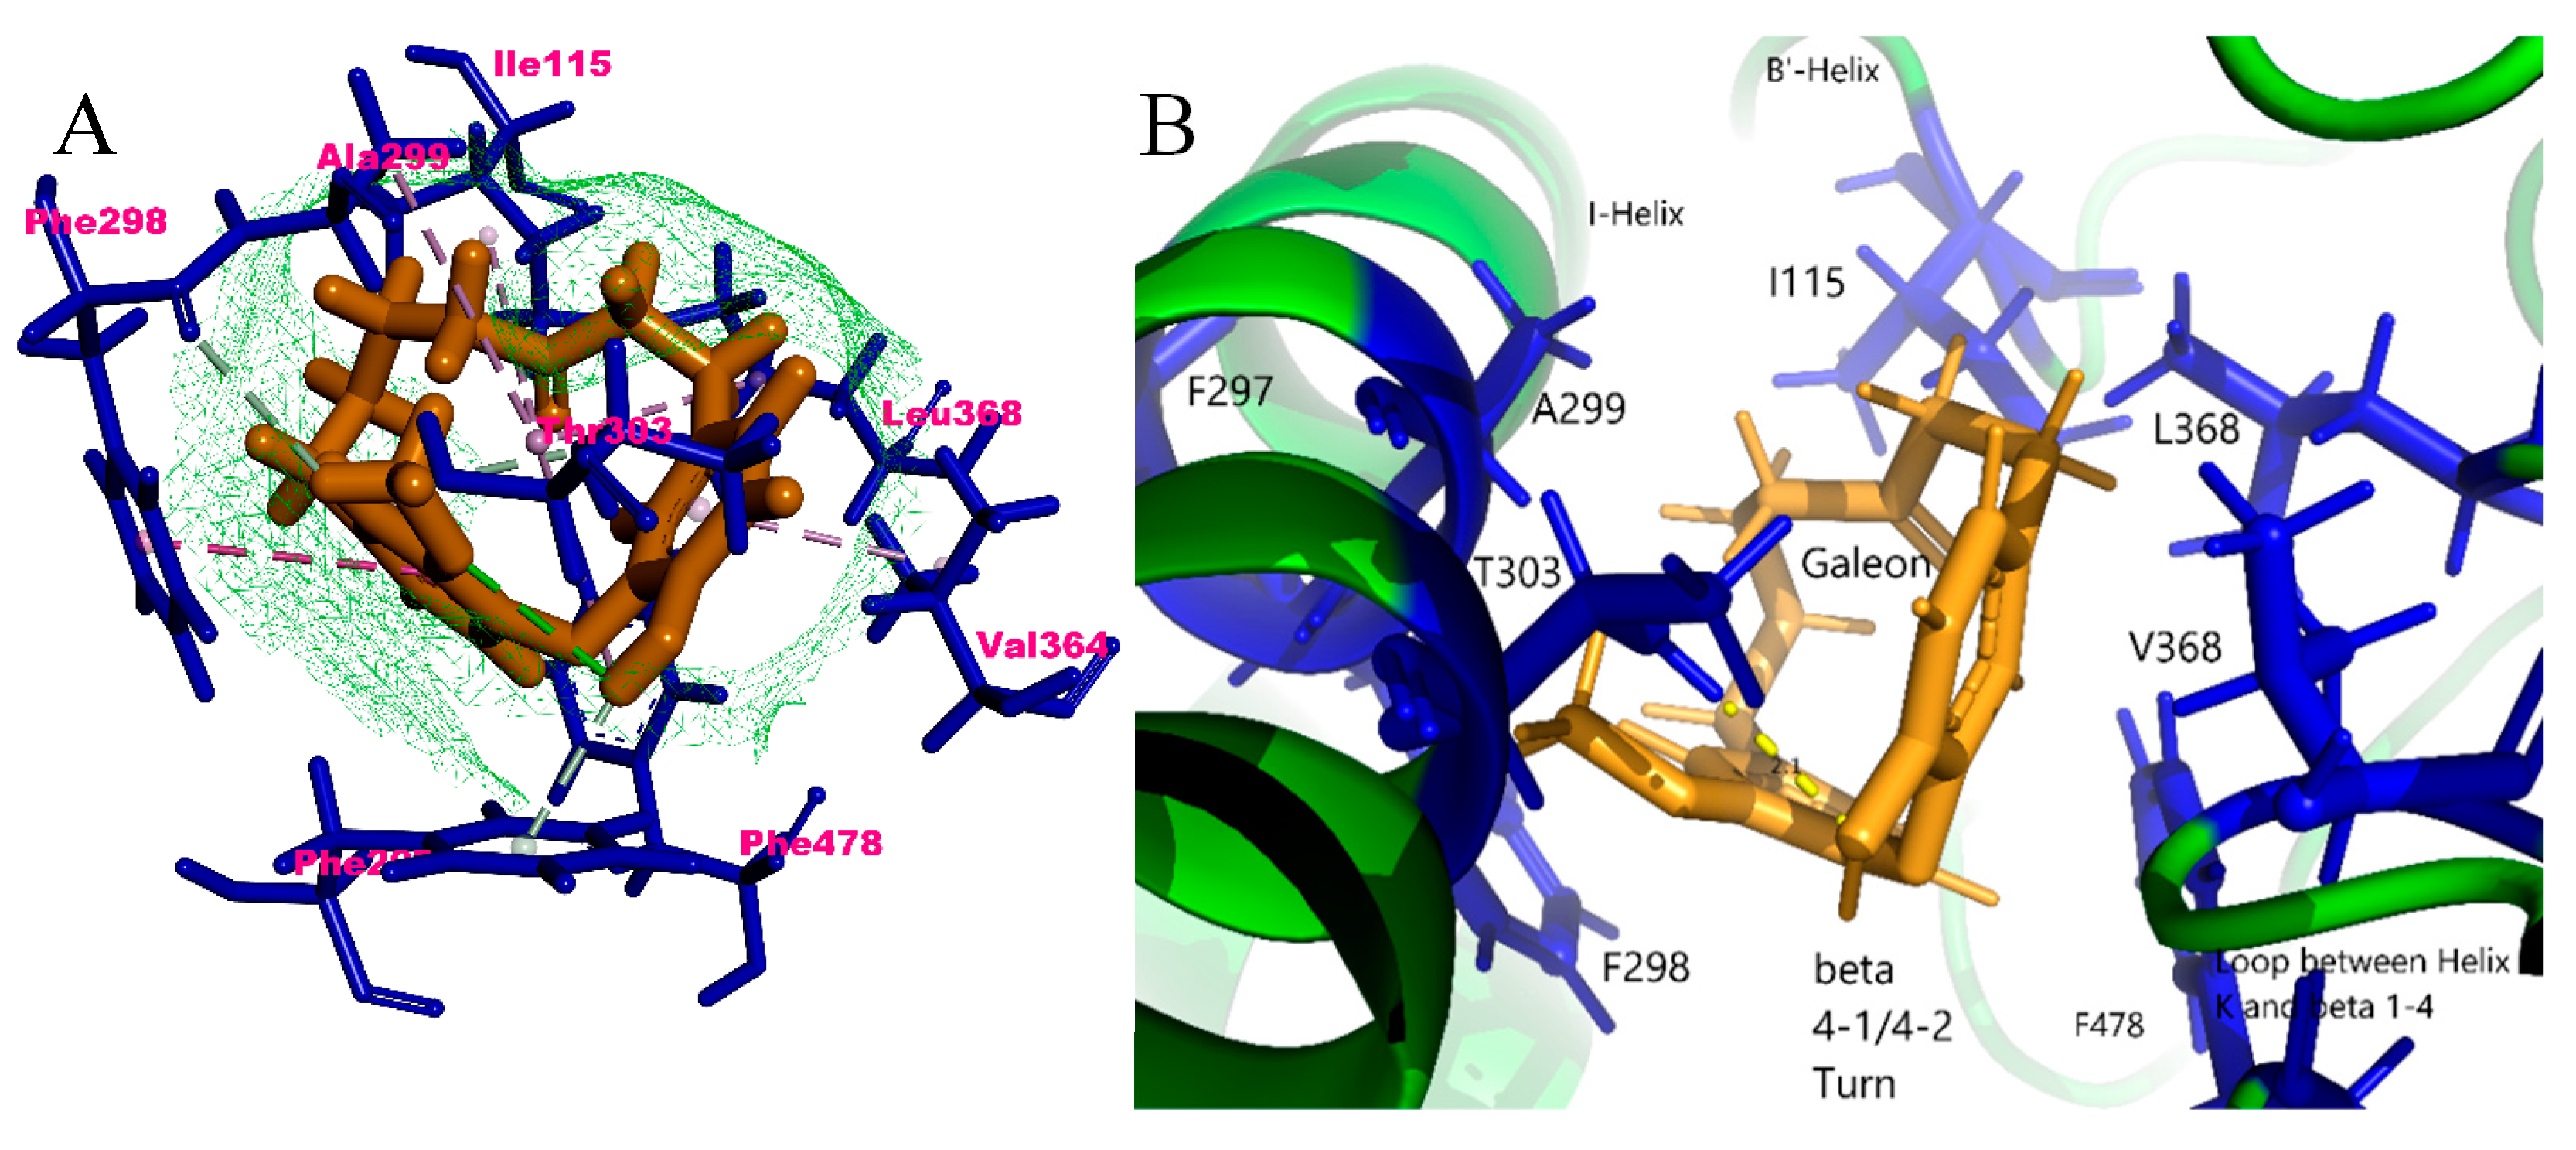
Secondly, galeon was docked with the CYP2E1 isoform which showed a 96% metabolic profiling, and the results are shown in Figure 6. Galeon and CYP2E1’s interaction involved Ile115, Phe207, Phe298, Ala299, Thr303, Val364, Leu368, and Phe478 residues (Figure 6A). The amino acid residues Phe207 and Thr303 were involved to form π–donor hydrogen bonds interactions with H of the –OH group; Phe298 and Phe478 by π–π T-shaped interactions; Ile115, Ala299, Val364, and Leu368 by π–alkyl interactions. According to CYP2E1’s crystal structure [39], the main binding site for ligands were Phe106, Phe116, Ile115, and Val364. Galeon would, thus, interact with Ile115 among these residues of the active site. Thr303’s polar side chain lining the active site cavity was highly conserved which interacted with galeon via hydrogen bonding. This residue may play a similar role in the positioning of smaller substrates. Evidence suggests that this conserved Thr303 plays an important role in proton delivery to the active site in other P-450 enzymes [40,41]. In addition, CYP2E1 [42], Val364, Leu368, and Phe478 would form a constriction between the active site cavity and access channel thereby helping the translocation of the substrate. The location of the main residues involved is depicted in Figure 3, where Ile115 belongs to the B’-Helix, Val364 and Leu368 belong to the loop between Helix-K and beta 1-4, Phe478 belongs to the beta 4-1/4-2 turn, and Thr303 belongs to the Helix-I (Figure 6B).
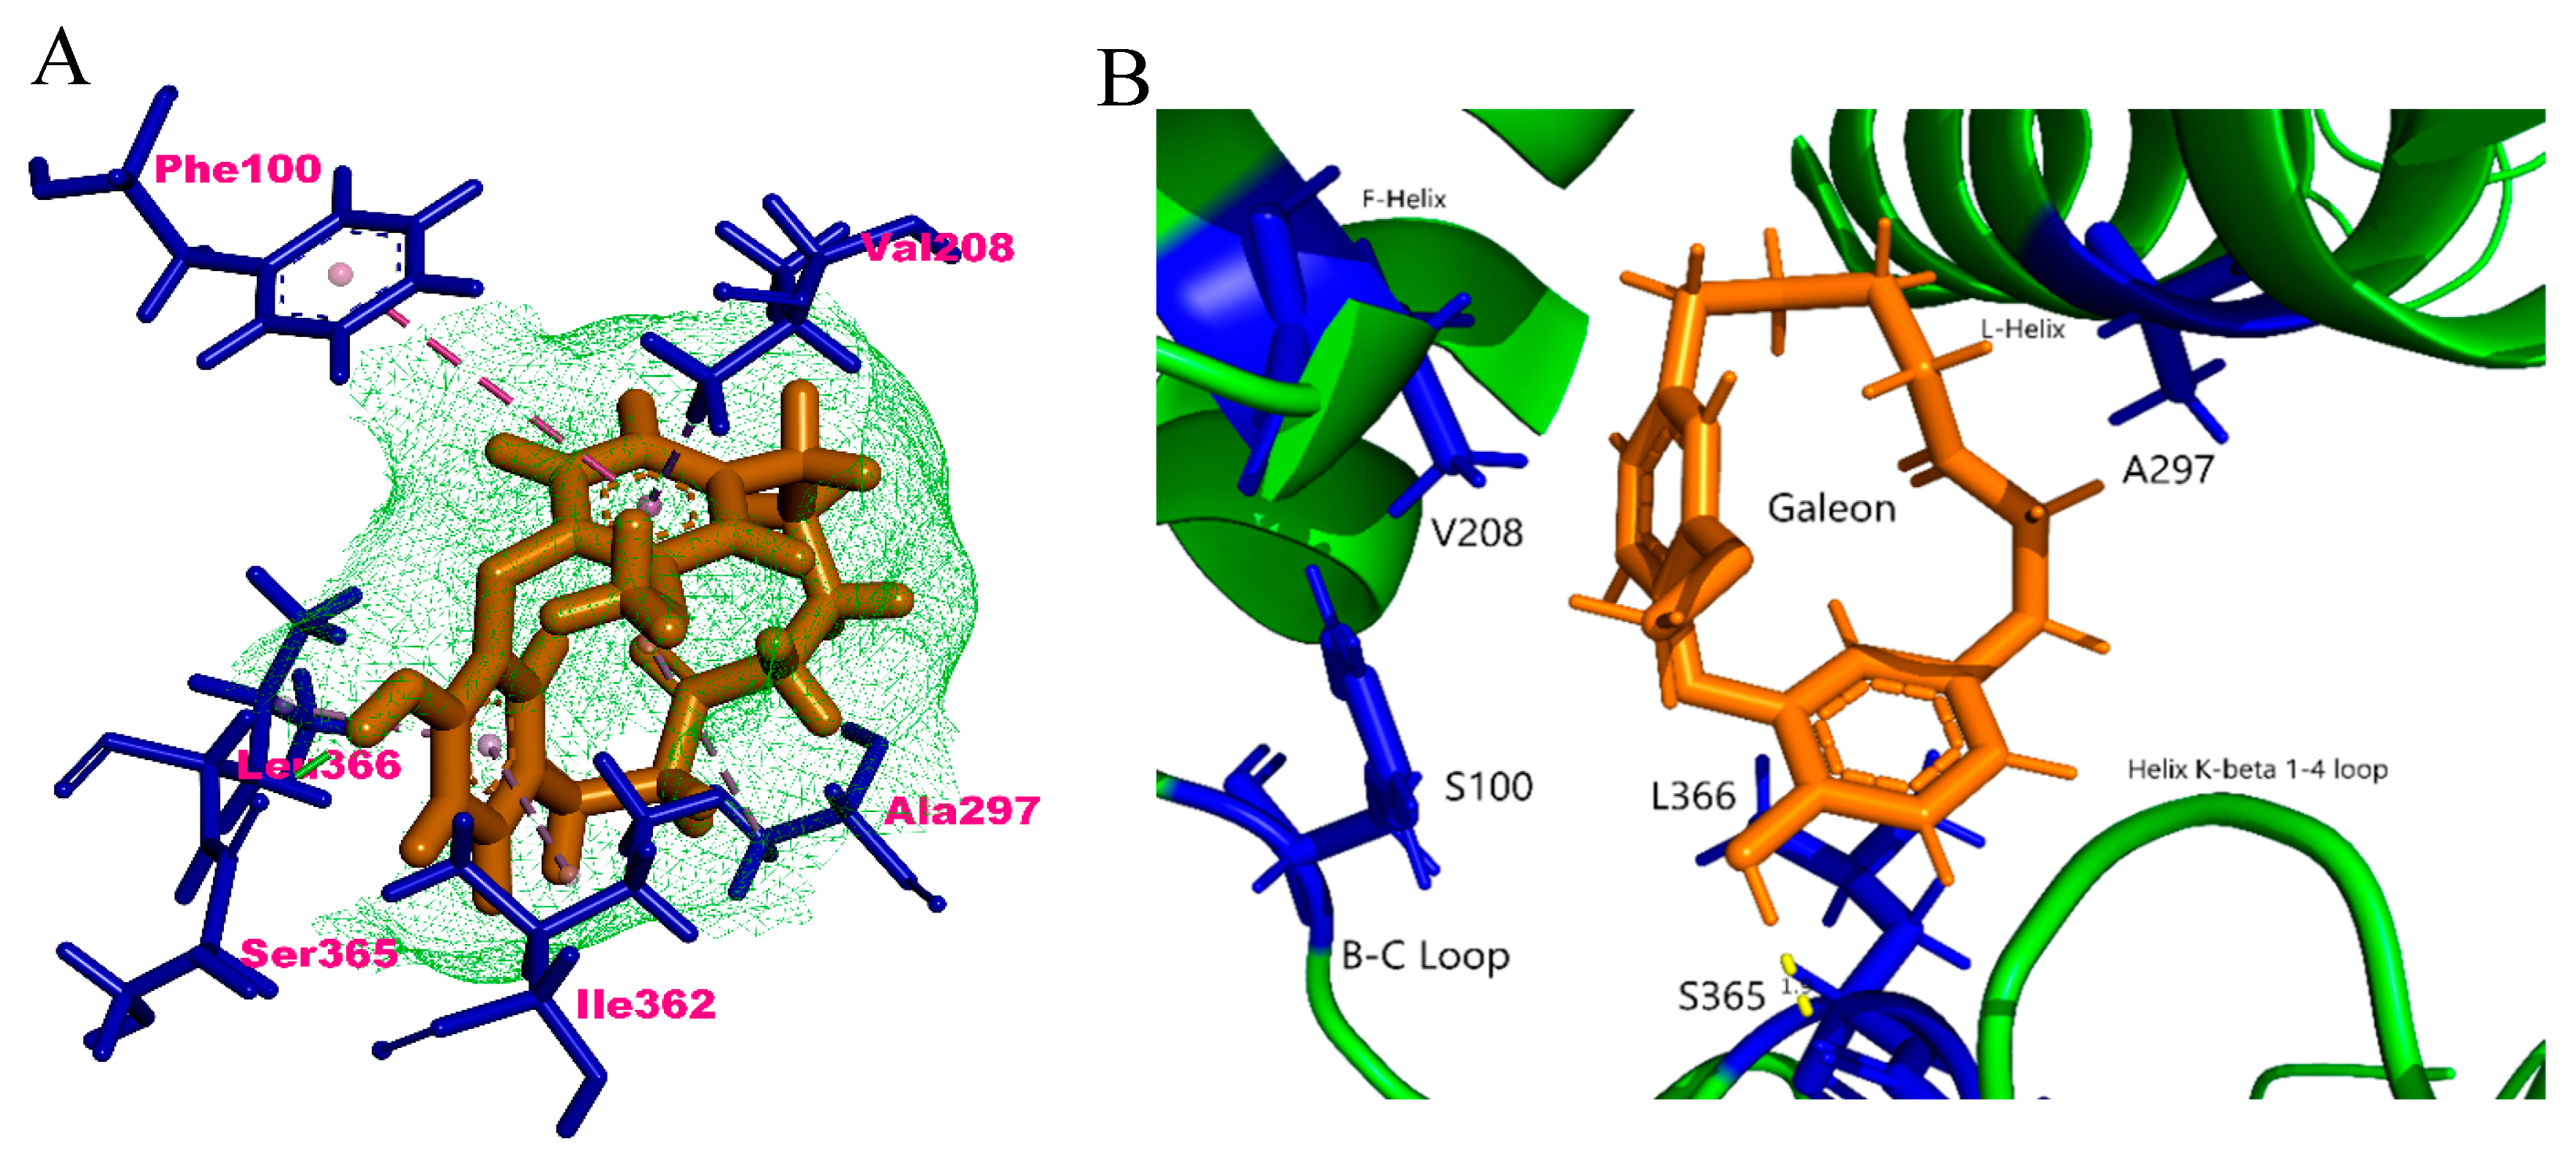
Next, a docking analysis for galeon with the CYP2C19 isoform with a 96% metabolic profiling is shown in Figure 7. It shows one conventional hydrogen bond interaction of the –OH group with Ser365 residue; three π–alkyl interactions with Ala297, Ile362, and Leu366; a π–π stacked bonding with Phe10; a single van der Waals interaction with Val208 (Figure 7A). Structural analysis from the previously published crystal structure of CYP2C19 revealed important residues responsible for substrate binding and metabolism [39]. The location of the main residues involved is depicted in Figure 6, where Ser365, Ile362, and Leu36 belong to Helix-K/Beta 1-4 and Ala297 belongs to the Helix-L loop of the active site (Figure 7B). Arg108 mainly functions for higher substrate binding affinity, but galeon did not interact with it. Phe100 resides in the B–C loop and Val208 in the Helix-F (Figure 7B). Phe100 performs the open–close mechanism of CYP2C19’s active site by changing the conformation of the B–C loop. The Helix-K/Beta 1-4 loop’s residues help surround the active site’s cavities formed by two separate cavities. However, galeon lacks interactions with Arg108, an important active site residue of CYP2C19, thus showing the lower affinity and fewer metabolic sites to support in silico metabolic profile analyses (Figure 7).
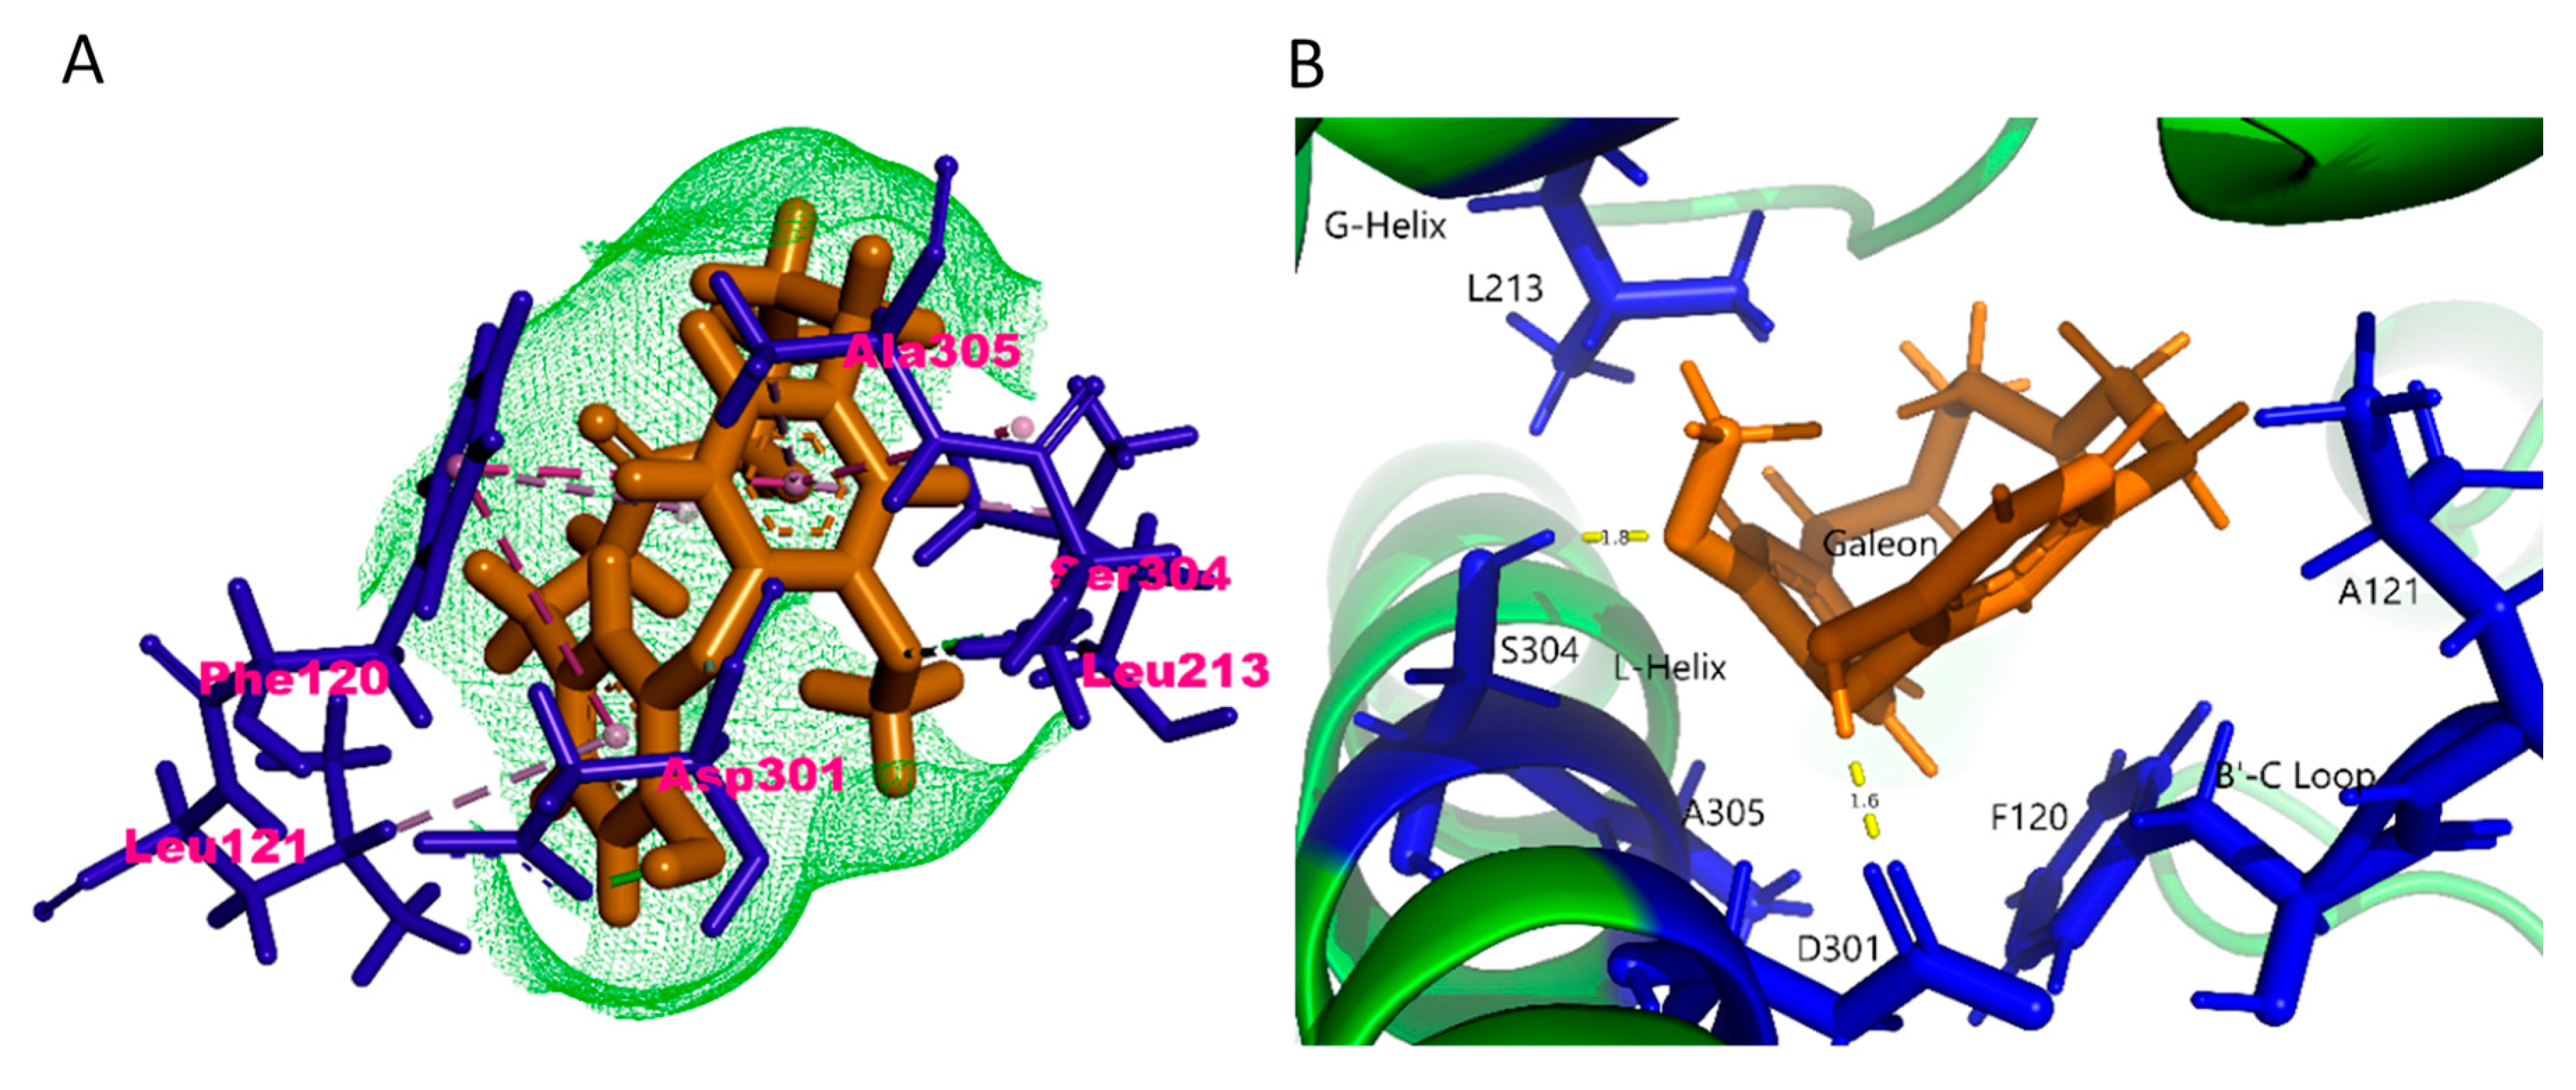
Docking analysis for galeon with the CYP2D6 isoform with a 93% metabolic profiling is shown in Figure 8. One of the important interaction sites involved between CYP2D6 and galeon is Phe120 in the B’–C loop, which plays key roles for two π–π stacked bonding between the benzene rings, Leu121 in the B’–C loop for π–alkyl interaction, and Leu213 in the G-helix region for one T-shaped π–π bonding. In addition, Asp301 in the L-Helix region was involved in the interaction with the H of –OH group via conventional hydrogen bonding, Ser304 and Ala305 in the L-helix via hydrogen bonding as well as π–π stacked T-shaped π–π interaction (Figure 8A,B). The docking analysis data clearly showed that galeon interacted with the residues mostly present in the L-helix, G-helix, and B’–C loop region. The crystal structure of CYP2D6 suggests that an active site cavity would be formed by residues from the B-helix, the B′–C loop (side chains of Leu-110, Phe-112, Phe-120, and Leu-121 and the main chain atoms of Gln-117, Gly-118, Val-119, and Ala-122), the F-helix (side chains of Leu-213, Glu-216, Ser-217, and Leu-220), the G-helix, the L-helix (side chains of Ile-297, Ala-300, Asp-301, Ser-304, Ala-305, Val-308, and Thr-309), the loop between K-helix and β sheet 1 strand 4, and residues from the loop between the strands of the β sheet 4 [43].
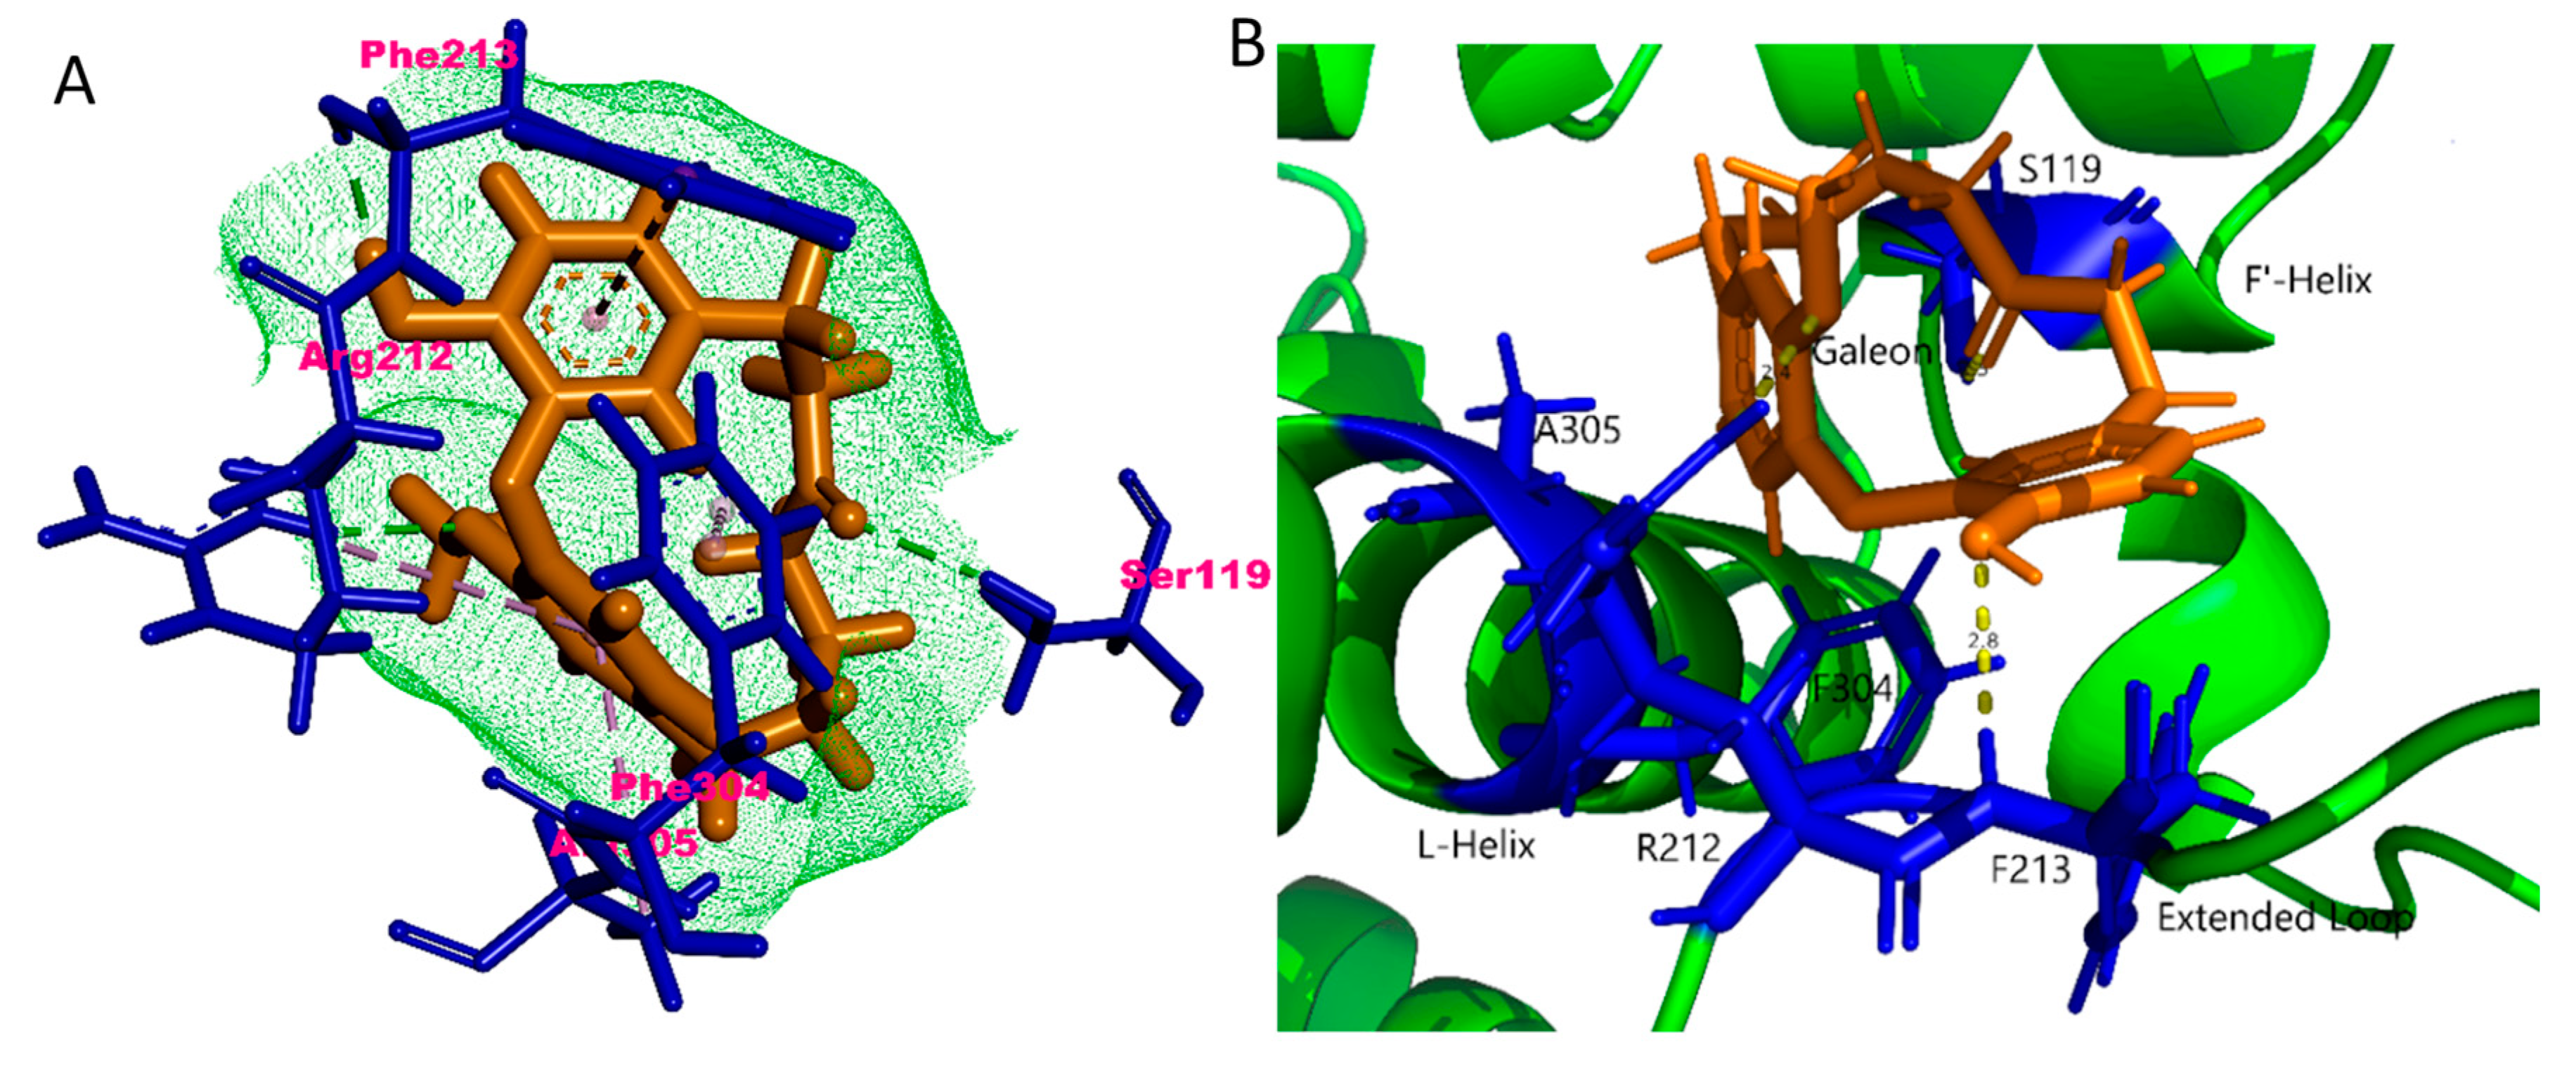
Finally, a docking analysis was performed for galeon with the CYP3A4 isoform with an 81% metabolic profile (Figure 9). It should be noted that, the CYP3A4 isoforms are not present in the rat liver microsomes (RLMs) but in the human liver microsomes (HLMs). Galeon interacted with Ser119 of CYP3A4 in the F-helix via hydrogen bonding with =O group, Arg212 in the L-helix by H-bonding and pi-alkyl bonding, respectively, with the –OCH3 group and the corresponding benzene ring, Phe213, in the extended loop by H-bonding and T-shaped π–π bonding, respectively, with the –OH group and the corresponding benzene ring, Phe304, in the L-helix via π–alkyl interaction with the center of the compound, and Ala305 in the L-helix by π–alkyl interaction with benzene ring of the –OCH3 group. Structural analysis revealed that [44] Phe213 and Phe215 form the active site and, together with another five phenylalanine residues (Phe108, Phe219, Phe220, Phe241, and Phe304), form a “Phe-cluster”, which have also been shown by mutagenesis studies to be involved in CYP3A4 activity. Ala305 is highly conserved and functionally important for enzymatic activity. Galeon successfully made important interactions with Phe-cluster residues thus showing the highest metabolic sites within galeon and proving to be a superior metabolic substrate (Figure 9A,B).
Overall, galeon showed significant interactions with active site residues of approximately all CYP450 isoforms, although CYP1A2 and CYP2C19 showed to be less active metabolically against galeon due to the lack of important interactions with the active site residues. Interestingly, CYP3A4 and CYP2E1 gave the best metabolic activity against galeon. The CYP2D6 isoform on the other hand showed a measurable amount of enzymatic activity against galeon.
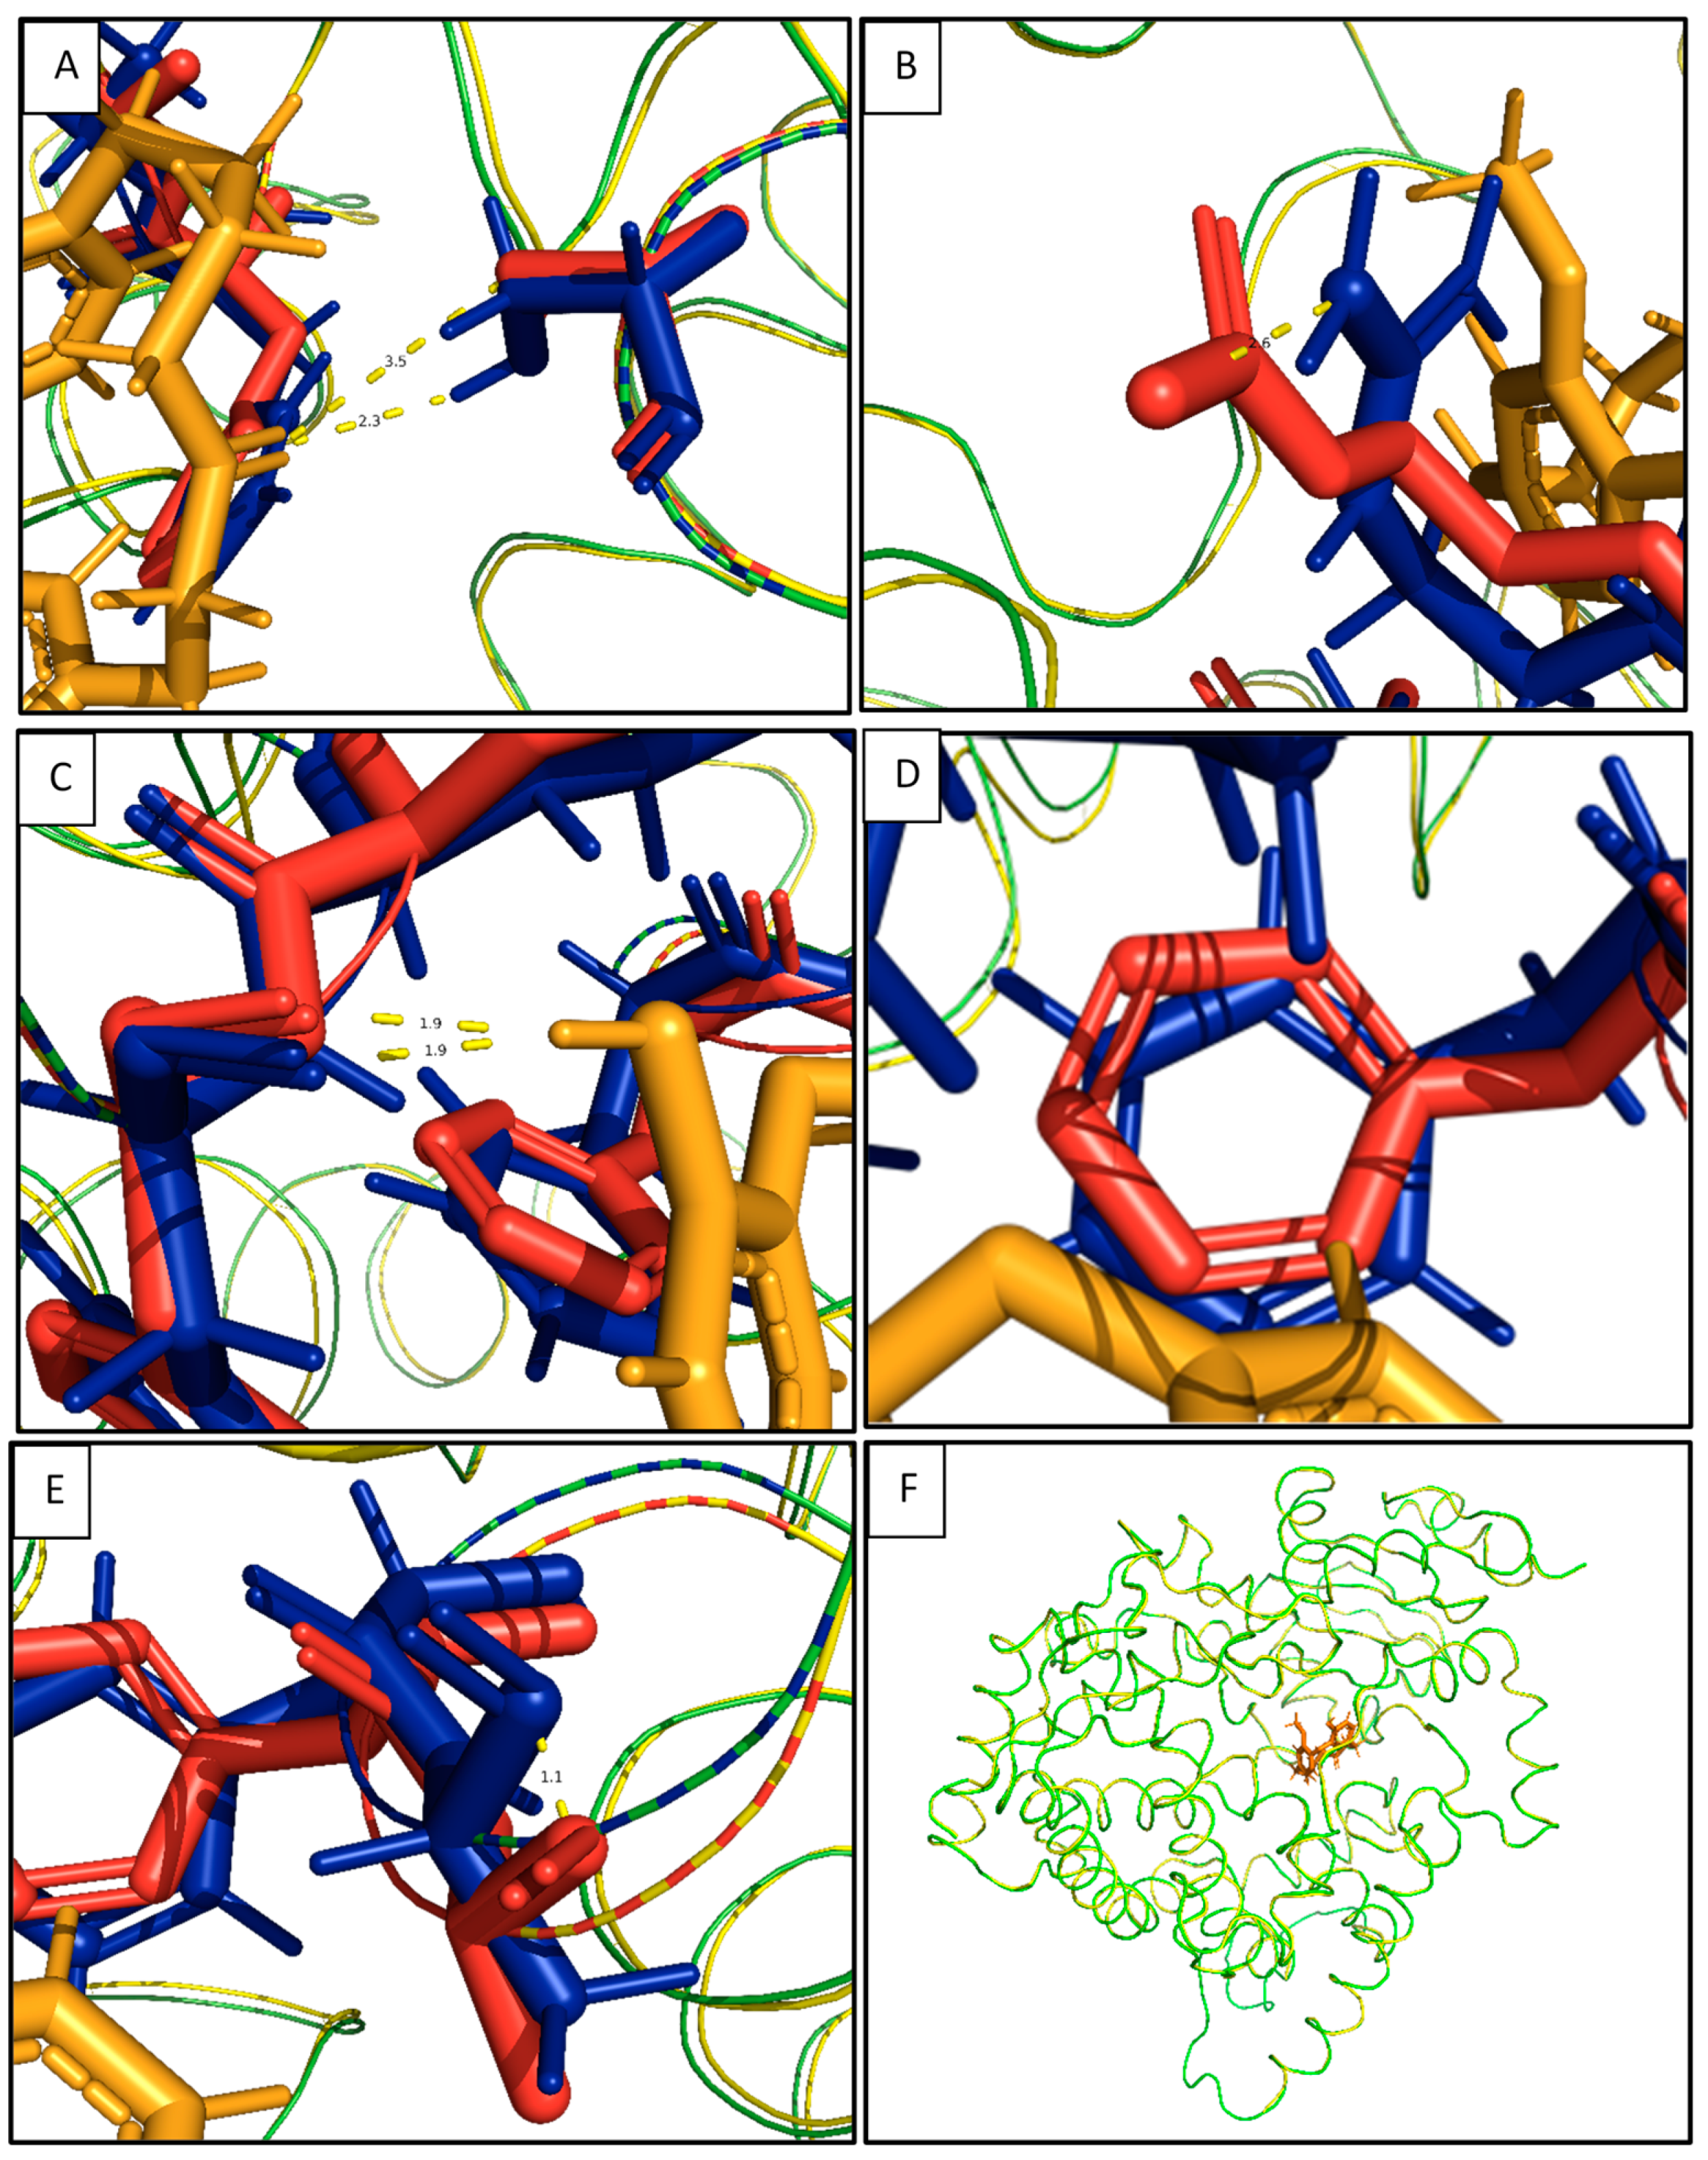
From the docking analysis, we found that the CYP3A4 isoform showed the highest metabolic activity against galeon. We analyzed the conformational difference in the interacting residues of the active site between the apo and ligand bound states. The overall root-mean-square deviation (RMSD) between the apo and galeon bound states was 0.163 Å of 438 C∝ atoms. When analyzing the active site, Ser119 moved inward to the galeon by approximately 1 Å (Figure 10A). In addition, Arg212 gave a clockwise rotation of 2.6 Å towards galeon, making it possible for interaction to occur (Figure 10B). However, Phe213 did not show any significant change in both the apo and ligand bound states (Figure 10C). Similarly, Phe304 lacked inward or outward movement, but showed a slight rotatory movement among themselves (Figure 10D). On the other hand, Ala305 showed approximately a 1Å anti-clockwise rotation (Figure 10E). The overall structural alignment between the apo and galeon bound states can be found in Figure 10F.

3. Materials and Methods

3.1. In Silico Study

Structural modification of galeon to reduce their side effects was proposed using the StarDrop software. The result from the StarDrop WhichP450™ model, shown using a pie chart, was used for the indication of the most likely CYP450 isoform that played a major role in galeon metabolism. The DEREK software was utilized to screen for structural alerts to confirm our bio-activation proposal and predicted toxicity of galeon metabolites. In order to identify the binding mechanism of galeon with all CYP450 isoforms, molecular docking was carried out using a previously reported method [37]. The protein structures of the corresponding CYP450 isoforms were downloaded from the Research Collaboratory for Structural Bioinformatics (RCSB) Protein Data Bank (PDB) database (https://www.rcsb.org/) in PDB format. The PDB IDs used for the isoforms were 2HI4, 3E4E, 4GQS, 2F9Q, and 1W0G for CYP1A2, CYP2E1, CYP2C19, CYP2D6, and CYP3A4, respectively. Proteins and ligands were prepared for docking by the established procedure [37]. Structural alignment of apo and galeon bound states of CYP3A4 was performed using Pymol.

3.2. Chemicals, Reagents, and Instrumentation

Synthesized galeon was used for metabolic experiments [4]. Rat liver microsomes (RLMs) were obtained from our colleague, Mohamed W. Attwa, College of Pharmacy, KSU. Mass spectrometric data analysis was performed in a 1200 series LC (Agilent Technologies) coupled with Agilent 6320 ion trap MS fitted with electrospray ionization (ESI) ion source. Column: Eclipse XDB-C18 (150 × 4.6 mm, 5 µm). Gradient solvent system: acetonitrile (ACN) and water (H2O) (Table S2). Flow rate: 0.3 mL/min, run time: 60 min (Table S2). Temperature of the capillary 350 °C; flow rate of dry gas was 10.0 L/min; nebulizer pressure: 60 psi; maximum accumulation time was 100,000 μs. The capillary voltage was set at 1.50 V. The ion source was ESI and the capillary voltage was 4000 V. Spectra were taken in the positive/negative modes, and the scan range was 50–700 m/z; the injection volume was 1–10 μL.

3.3. RLMs Incubations

Metabolism of galeon (1 µL of 1 mM stock solution; 0.326 mg/mL in DMSO) was determined in 40 µL (2 mg/mL) of RLMs in potassium phosphate buffer (0.08 M KH2PO4/NaH2PO4, pH 7.4) at 37 °C for 30 min, with freshly prepared ice-cold MgCl2 (20.33 mg/mL) solution (final incubation volume was 1 mL). The incubation mixtures were allowed to stand at 37 °C in the shaking water bath for 5 min, before adding NADPH (0.1 mL; 0.8 mM; 8.33 mg/mL) to the incubation mixture to initiate the reaction. For reactive metabolites incubation, galeon with RLMs in the presence of chemical trapping agents 2.5 mM methoxylamine/1.0 mM GSH were added before adding NADPH. Two duplicate tests along with three controls were performed (the values are summarized in Table S1).

4. Conclusions

In silico galeon metabolite analysis revealed demethylated galeon was the most predicted metabolite in addition to mono-hydroxy metabolites. According to the alert site prediction, the isoforms CYP1A2, CYP2E1, CYP2C19, CYP2D6, and CYP3A4 were involved in metabolic profiling. Among the predicted metabolites, mono-hydroxy metabolites were found to have plausible toxicity, due to the formation of 1,2-dihydroxybenzene (catechol) and 1,3-dihydroxybenzene, (resorcinol), in skin sensitization, thyroid toxicity, chromosome damage, and carcinogenicity. From the in vitro metabolic profiling of galeon in RLMs, eighteen Phase-I metabolites, nine methoxylamine, and three GSH conjugates were identified in the presence of NADPH, chemical trapping agents N,O-dimethylhydroxylamine, and GSH, respectively. Identification and elucidation of the structures of possible identified metabolites were performed using LC-MS/MS mass and their corresponding fragmentation pattern. In silico docking analysis of galeon showed significant interactions with active site residues of approximately all CYP450 isoforms.

Supplementary Materials

The following are available online, Figure S1: MS/MSn Spectra of metabolite M1, Figure S2: MS/MSn Spectra of metabolite M2, Figure S3: MS/MSn Spectra of metabolite M3, Figure S4a: MS/MSn Spectra of metabolite M4a, Figure S4b: MS/MSn Spectra of metabolite M4b, Figure S4c: MS/MSn Spectra of metabolite M4c, Figure S4d: MS/MSn Spectra of metabolite M4d, Figure S4e: MS/MSn Spectra of metabolite M4e, Figure S4f/g: MS/MSn Spectra of metabolite M4f/g, Figure S4h: MS/MSn Spectra of metabolite M4h, Figure S5a: MS/MSn Spectra of metabolite M5a, Figure S5b: MS/MSn Spectra of metabolite M5b, Figure S6: MS/MSn Spectra of metabolite M6, Figure S7: MS/MSn Spectra of metabolite M7, Figure S8: MS/MSn Spectra of metabolite M8, Figure S9a/b: MS/MSn Spectra of metabolite M9a/b, Figure S9c/d: MS/MSn Spectra of metabolite M9c/d, Figure S10: MS/MSn Spectra of metabolite M10, Figure S11: MS/MSn Spectra of metabolite M11, Figure S12: MS/MSn Spectra of metabolite M12, Figure S13: MS/MSn Spectra of metabolite M13, Table S1: RLMs incubations of Galeon and Table S2: LC Gradient solvent system.

Author Contributions

Conceptualization, A.F.M.M.R. and Y.J.; methodology, A.F.M.M.R., W.Y. and A.A.K.; software, A.F.M.M.R. and W.Y.; validation, A.F.M.M.R.; formal analysis, A.F.M.M.R., W.Y. and A.A.K.; investigation, A.F.M.M.R.; resources, A.F.M.M.R., A.A.K. and Y.J.; data curation, A.F.M.M.R. and W.Y.; writing—original draft preparation, A.F.M.M.R.; writing—review and editing, A.F.M.M.R., W.Y. and A.A.K.; supervision, A.F.M.M.R.; project administration, A.F.M.M.R. and Y.J.; funding acquisition, A.F.M.M.R. All authors have read and agreed to the published version of the manuscript.

Funding

This research was funded by the NSTIP Strategic Technologies Program (Grant number 12-MED-2439-02) in the Kingdom of Saudi Arabia.

Acknowledgments

This work was supported by the NSTIP Strategic Technologies Program (Grant number 12-MED-2439-02) in the Kingdom of Saudi Arabia.

Conflicts of Interest

The authors declare no conflict of interest.

References

  1. Attwa, M.W.; Darwish, H.W.; Alhazmi, H.A.; Kadi, A.A. Investigation of metabolic degradation of new ALK inhibitor: Entrectinib by LC-MS/MS. Clin. Chim. Acta 2018, 485, 298–304. [Google Scholar] [CrossRef]
  2. Attwa, M.W.; Kadi, A.A.; Darwish, H.W.; Abdelhameed, A.S. Investigation of the metabolic stability of olmutinib by validated LC-MS/MS: Quantification in human plasma. RSC Adv. 2018, 8, 40387–40394. [Google Scholar] [CrossRef] [Green Version]
  3. Attia, S.M. Deleterious effects of reactive metabolites. Oxid. Med. Cell Longev. 2010, 3, 238–253. [Google Scholar] [CrossRef] [Green Version]
  4. Yang, L.; Hyunji, J.; Md, A.; Hwa-Jong, L.; Wencui, Y.; Mohammad, S.A.; Moinul, K.; Adnan, A.K.; Yurngdong, J.; Youngjoo, K.; et al. Synthesis, Biological Evaluation and Molecular Docking Study of Cyclic Diarylheptanoids as Potential Anticancer Therapeutics. Anti-Cancer Agents Med. Chem. 2020, 20, 464–475. [Google Scholar] [CrossRef]
  5. Kadi, A.A.; Yin, W.; Rahman, A.M. In-vitro metabolic profiling study of potential topoisomerase inhibitors ‘pyrazolines’ in RLMs by mass spectrometry. J. Chromatogr. B 2019, 1114, 125–133. [Google Scholar] [CrossRef]
  6. Rahman, A.M.; Lu, Y.; Lee, H.-J.; Jo, H.; Yin, W.; Alam, M.S.; Cha, H.; Kadi, A.A.; Kwon, Y.; Jahng, Y. Linear diarylheptanoids as potential anticancer therapeutics: Synthesis, biological evaluation, and structure–activity relationship studies. Arch. Pharmacal Res. 2018, 41, 1131–1148. [Google Scholar] [CrossRef]
  7. Islam, M.S.; Park, S.; Song, C.; Kadi, A.A.; Kwon, Y.; Rahman, A.M. Fluorescein hydrazones: A series of novel non-intercalative topoisomerase IIα catalytic inhibitors induce G1 arrest and apoptosis in breast and colon cancer cells. Eur. J. Med. Chem. 2017, 125, 49–67. [Google Scholar] [CrossRef] [PubMed]
  8. Kadi, A.A.; Al-Shakliah, N.S.; Yin, W.; Rahman, A.M. In vitro investigation of metabolic profiling of newly developed topoisomerase inhibitors (ethyl fluorescein hydrazones, EtFLHs) in RLMs by LC–MS/MS. J. Chromatogr. B 2017, 1054, 93–104. [Google Scholar] [CrossRef] [PubMed]
  9. Ahmad, P.; Woo, H.; Jun, K.-Y.; Kadi, A.A.; Abdel-Aziz, H.A.; Kwon, Y.; Rahman, A.M. Design, synthesis, topoisomerase I & II inhibitory activity, antiproliferative activity, and structure–activity relationship study of pyrazoline derivatives: An ATP-competitive human topoisomerase IIα catalytic inhibitor. Bioorg. Med. Chem. 2016, 24, 1898–1908. [Google Scholar] [PubMed]
  10. Rahman, A.F.M.M.; Park, S.-E.; Kadi, A.A.; Kwon, Y. Fluorescein hydrazones as novel nonintercalative topoisomerase catalytic inhibitors with low DNA toxicity. J. Med. Chem. 2014, 57, 9139–9151. [Google Scholar] [CrossRef]
  11. Lee, K.-S.; Li, G.; Kim, S.H.; Lee, C.-S.; Woo, M.-H.; Lee, S.-H.; Jhang, Y.-D.; Son, J.-K. Cytotoxic diarylheptanoids from the roots of Juglans mandshurica. J. Nat. Prod. 2002, 65, 1707–1708. [Google Scholar] [CrossRef] [PubMed]
  12. Morihara, M.; Sakurai, N.; Inoue, T.; Kawai, K.-I.; Nagai, M. Two novel diarylheptanoid glucosides from Myrica gale var. tomentosa and absolute structure of plane-chiral galeon. Chem. Pharm. Bull. 1997, 45, 820–823. [Google Scholar] [CrossRef] [Green Version]
  13. Malterud, K.E.; Anthonsen, T.; Hjortas, J. 14-Oxa-[7.1]-metapara-cyclophanes from Myrica gale L., a new class of natural products. Tetrahedron Lett 1976, 3069–3072. [Google Scholar] [CrossRef]
  14. Rahman, A.M.; Al-Shakliah, N.S.; Yin, W.; Kadi, A.A. In vitro Investigation of Metabolic Profiling of a Potent Topoisomerase Inhibitors Fluorescein Hydrazones (FLHs) in RLMs by LC-MS/MS. J. Chromatogr. B 2017, 1054, 27–35. [Google Scholar] [CrossRef] [PubMed]
  15. Lin, Y.; Peng, X.; Ruan, H. Diarylheptanoids from the fresh pericarps of Juglans hopeiensis. Fitoterapia 2019, 136, 104165. [Google Scholar] [CrossRef] [PubMed]
  16. Liang, J.; Peng, X.; Zhou, J.; Zhou, M.; Ruan, H. Diarylheptanoids from the fresh pericarps of Juglans sigillata. Nat. Product Res. 2018, 32, 2457–2463. [Google Scholar] [CrossRef] [PubMed]
  17. Jang, H.S.; Choi, S.Y.; Jeong, B.; Min, H.J.; Yang, H.; Bae, Y.S. Chemical constituents of branches and barks of Juglans mandshurica. Chem. Nat. Compd. 2018, 54, 342–343. [Google Scholar] [CrossRef]
  18. Ting, Y.-C.; Wang, H.-C.; Ko, H.-H.; Peng, C.-F.; Chang, H.-S.; Hsieh, P.-C.; Chen, I.-S. Biological evaluation of secondary metabolites from the roots of Myrica adenophora. Phytochemistry 2014, 103, 89–98. [Google Scholar] [CrossRef]
  19. Li, J.; Sun, J.-X.; Yu, H.-Y.; Chen, Z.-Y.; Zhao, X.-Y.; Ruan, H.-L. Diarylheptanoids from the root bark of Juglans cathayensis. Chin. Chem. Lett. 2013, 24, 521–523. [Google Scholar] [CrossRef]
  20. Zhou, Y.Y.; Wang, D.; Niu, F. Studies on constituents from pericarps of Juglans mandshurica with anti-tumor activity. Chin. Tradit. Herbal Drugs 2010, 41, 11–14. [Google Scholar]
  21. Li, Y.-X.; Ruan, H.-L.; Zhou, X.-F.; Zhang, Y.-H.; Pi, H.-F.; Wu, J.-Z. Cytotoxic diarylheptanoids from pericarps of Juglans cathayensis Dode. Chem. Res. Chin. Univ. 2008, 24, 427–429. [Google Scholar] [CrossRef]
  22. Inoue, T. Constituents of Acer nikoense and Myrica rubra. On Diarylheptanoids. Yakugaku Zasshi 1993, 113, 181–197. [Google Scholar] [CrossRef] [PubMed] [Green Version]
  23. Ishida, J.; Kozuka, M.; Tokuda, H.; Nishino, H.; Nagumo, S.; Lee, K.-H.; Nagai, M. Chemopreventive potential of cyclic diarylheptanoids. Bioorg. Med. Chem. 2002, 10, 3361–3365. [Google Scholar] [CrossRef]
  24. Ding, Q.; Wang, Q.; He, H.; Cai, Q.; Wang, Q.; He, H. Asymmetric Synthesis of (-)-Pterocarine and (-)-Galeon via Chiral Phase Transfer-Catalyzed Atropselective Formation of Diarylether Cyclophane Skeleton. Org. Lett. 2017, 19, 1804–1807. [Google Scholar] [CrossRef] [PubMed]
  25. Fu, L.; Zhang, C.-j.; Zhang, L.; Jiang, H. Total synthesis of macrocyclic diarylheptanoids galeon from natural products. Zhongyiyao Xuebao 2015, 43, 12–14. [Google Scholar]
  26. Salih, M.Q.; Beaudry, C.M. Chirality in diarylether heptanoids: Synthesis of myricatomentogenin, jugcathanin, and congeners. Org. Lett. 2012, 14, 4026–4029. [Google Scholar] [CrossRef]
  27. Pitsinos, E.N.; Vidali, V.P.; Couladouros, E.A. Diaryl Ether Formation in the Synthesis of Natural Products. Eur. J. Org. Chem. 2011, 1207–1222. [Google Scholar] [CrossRef]
  28. Jeong, B.-S.; Wang, Q.; Son, J.-K.; Jahng, Y. A versatile synthesis of cyclic diphenyl ether-type diarylheptanoids: Acerogenins, (±)-galeon, and (±)-pterocarine. Eur. J. Med. Chem. 2007, 1338–1344. [Google Scholar] [CrossRef]
  29. Al-Shakliah, N.S.; Attwa, M.W.; Kadi, A.A.; AlRabiah, H. Identification and characterization of in silico, in vivo, in vitro, and reactive metabolites of infigratinib using LC-ITMS: Bioactivation pathway elucidation and in silico toxicity studies of its metabolites. RSC Adv. 2020, 10, 16231–16244. [Google Scholar] [CrossRef] [Green Version]
  30. Attwa, M.W.; Kadi, A.A.; Abdelhameed, A.S. Phase I metabolic profiling and unexpected reactive metabolites in human liver microsome incubations of X-376 using LC-MS/MS: Bioactivation pathway elucidation and in silico toxicity studies of its metabolites. RSC Adv. 2020, 10, 5412–5427. [Google Scholar] [CrossRef] [Green Version]
  31. Attwa, M.W.; Kadi, A.A.; Abdelhameed, A.S.; Alhazmi, H.A. Metabolic Stability Assessment of New PARP Inhibitor Talazoparib Using Validated LC-MS/MS Methodology: In silico Metabolic Vulnerability and Toxicity Studies. Drug Des. Devel. Ther. 2020, 14, 783–793. [Google Scholar] [CrossRef] [PubMed]
  32. Available online: https://www.selectscience.net/products/stardrop-5---drug-discovery-software/?prodID=105769#tab-1 (accessed on 31 October 2020).
  33. Available online: https://www.optibrium.com/stardrop/stardrop6.5.php (accessed on 31 October 2020).
  34. Shin, Y.G.; Le, H.; Khojasteh, C.; Hop, C.E. Comparison of metabolic soft spot predictions of CYP3A4, CYP2C9 and CYP2D6 substrates using MetaSite and StarDrop. Comb. Chem. High Throughput Screen 2011, 14, 811–823. [Google Scholar] [CrossRef] [PubMed]
  35. Segall, M.; Champness, E.; Obrezanova, O.; Leeding, C. Beyond profiling: Using ADMET models to guide decisions. Chem. Biodivers 2009, 6, 2144–2151. [Google Scholar] [CrossRef] [PubMed]
  36. Marchant, C.A.; Briggs, K.A.; Long, A. In Silico Tools for Sharing Data and Knowledge on Toxicity and Metabolism: Derek for Windows, Meteor, and Vitic. Toxicol. Mech. Methods 2008, 18, 177–187. [Google Scholar] [CrossRef] [PubMed]
  37. Arifuzzaman, M.; Hamza, A.; Zannat, S.S.; Fahad, R.; Rahman, A.; Hosen, S.M.Z.; Dash, R.; Hossain, M.K. Targeting galectin-3 by natural glycosides: A computational approach. Netw. Modeling Anal. Health Inform. Bioinform. 2020, 9, 14. [Google Scholar] [CrossRef]
  38. Sansen, S.; Yano, J.K.; Reynald, R.L.; Schoch, G.A.; Griffin, K.J.; Stout, C.D.; Johnson, E.F. Adaptations for the oxidation of polycyclic aromatic hydrocarbons exhibited by the structure of human P450 1A2. J. Biol. Chem. 2007, 282, 14348–14355. [Google Scholar] [CrossRef] [Green Version]
  39. Porubsky, P.R.; Meneely, K.M.; Scott, E.E. Structures of human cytochrome P-450 2E1. Insights into the binding of inhibitors and both small molecular weight and fatty acid substrates. J. Biol. Chem. 2008, 283, 33698–33707. [Google Scholar] [CrossRef] [Green Version]
  40. Vaz, A.D.; McGinnity, D.F.; Coon, M.J. Epoxidation of olefins by cytochrome P450: Evidence from site-specific mutagenesis for hydroperoxo-iron as an electrophilic oxidant. Proc. Natl. Acad. Sci. USA 1998, 95, 3555–3560. [Google Scholar] [CrossRef] [Green Version]
  41. Vaz, A.D.; Pernecky, S.J.; Raner, G.M.; Coon, M.J. Peroxo-iron and oxenoid-iron species as alternative oxygenating agents in cytochrome P450-catalyzed reactions: Switching by threonine-302 to alanine mutagenesis of cytochrome P450 2B4. Proc. Natl. Acad. Sci. USA 1996, 93, 4644–4648. [Google Scholar] [CrossRef] [Green Version]
  42. Blobaum, A.L.; Kent, U.M.; Alworth, W.L.; Hollenberg, P.F. Novel reversible inactivation of cytochrome P450 2E1 T303A by tert-butyl acetylene: The role of threonine 303 in proton delivery to the active site of cytochrome P450 2E1. J. Pharmacol. Exp. Ther. 2004, 310, 281–290. [Google Scholar] [CrossRef] [Green Version]
  43. Rowland, P.; Blaney, F.E.; Smyth, M.G.; Jones, J.J.; Leydon, V.R.; Oxbrow, A.K.; Lewis, C.J.; Tennant, M.G.; Modi, S.; Eggleston, D.S.; et al. Crystal structure of human cytochrome P450 2D6. J. Biol. Chem. 2006, 281, 7614–7622. [Google Scholar] [CrossRef] [PubMed] [Green Version]
  44. Williams, P.A.; Cosme, J.; Vinković, D.M.; Ward, A.; Angove, H.C.; Day, P.J.; Vonrhein, C.; Tickle, I.J.; Jhoti, H. Crystal Structures of Human Cytochrome P450 3A4 Bound to Metyrapone and Progesterone. Science 2004. [Google Scholar] [CrossRef] [PubMed]
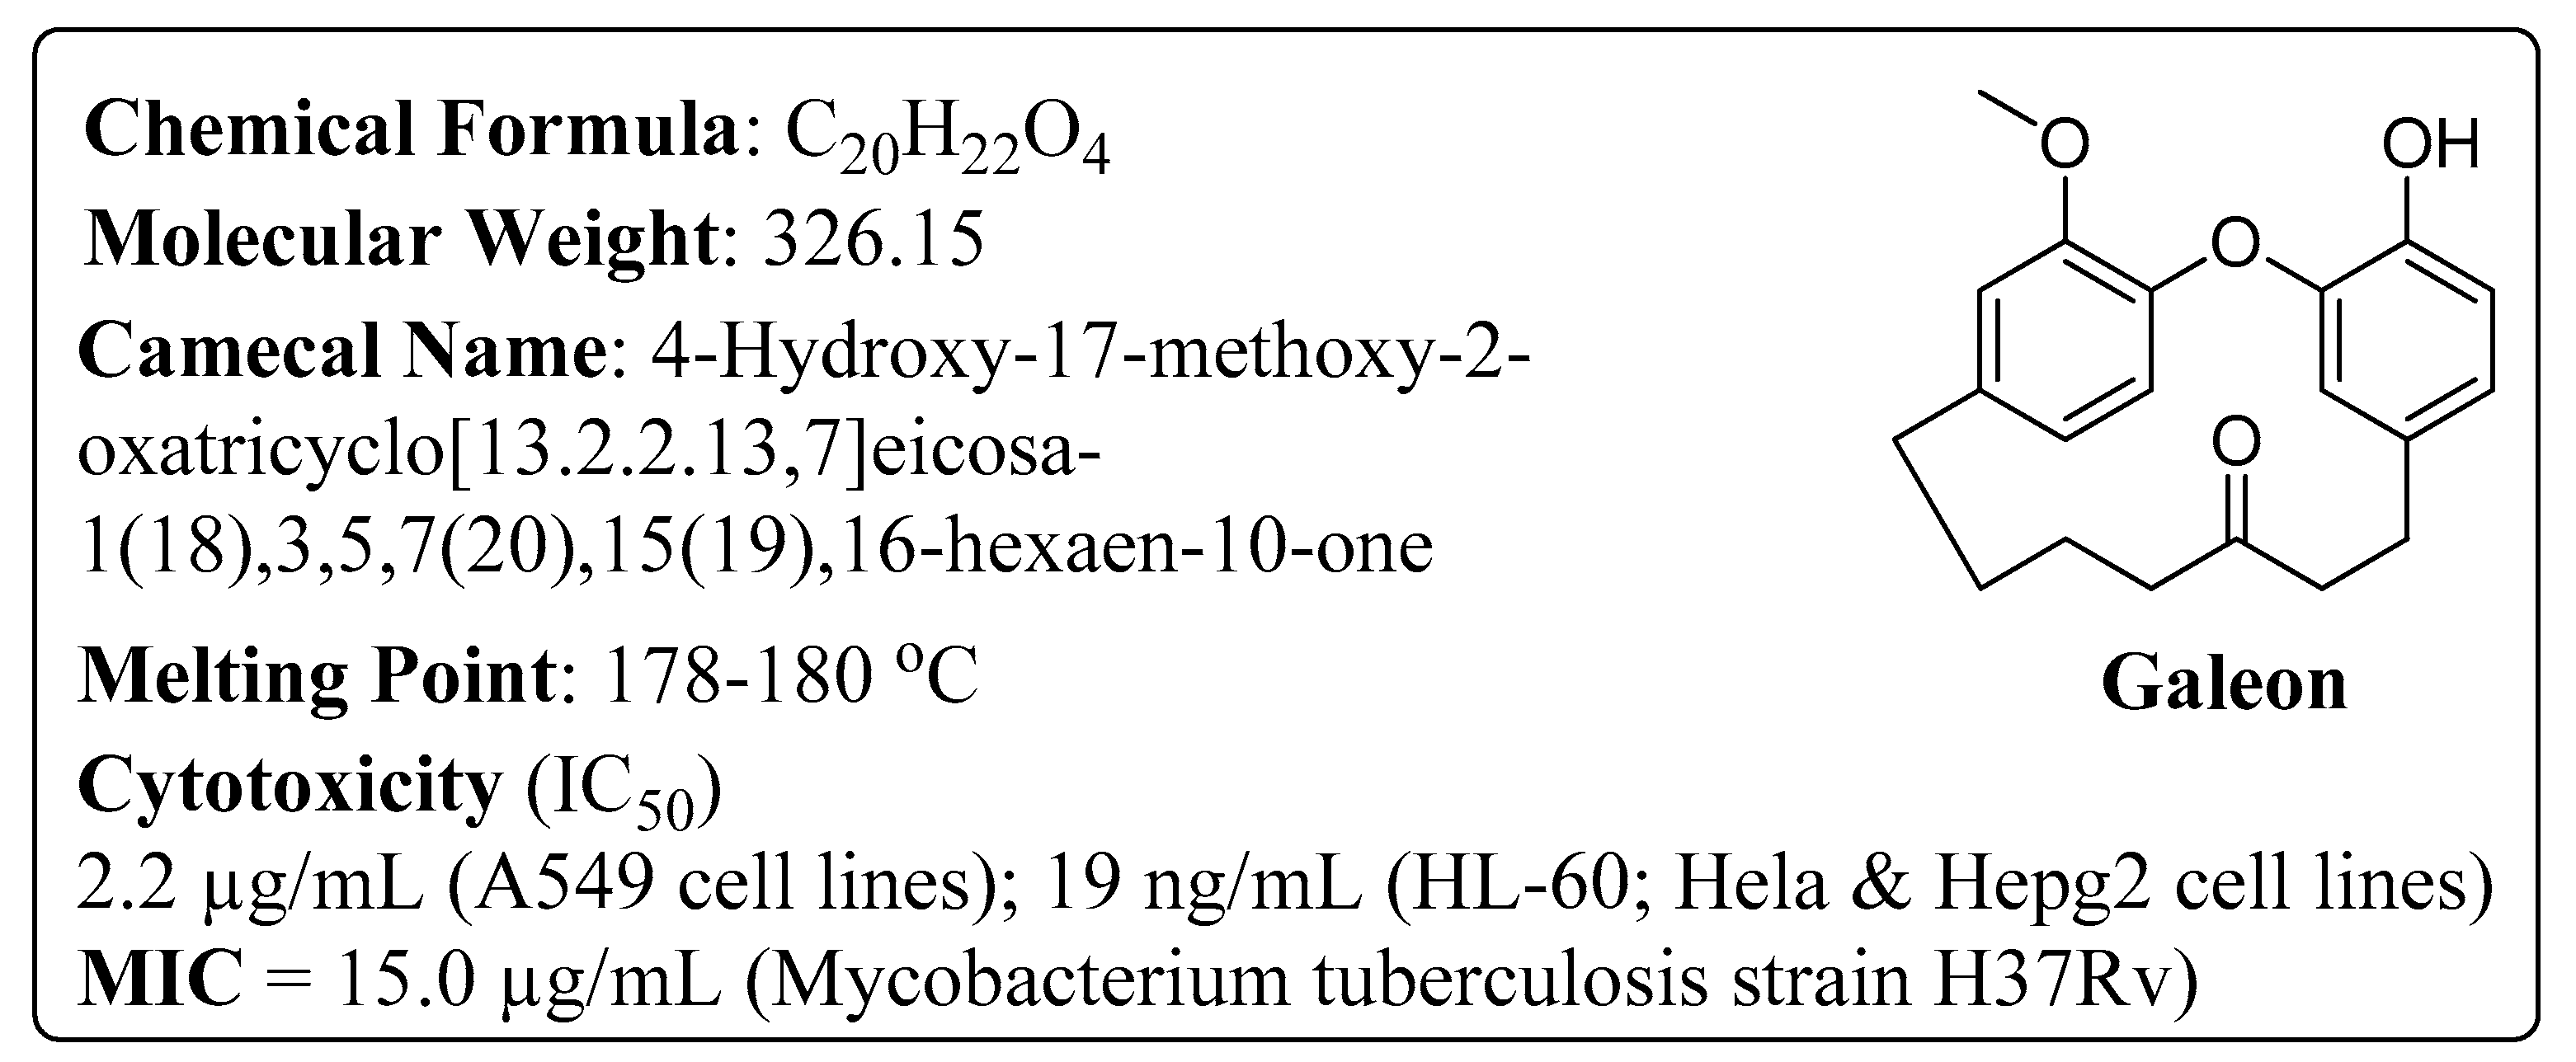
Figure 1. Chemical structure and properties of galeon.
Molecules 25 05903 g001
Figure 2. Proposed metabolic sites of galeon using the StarDrop WhichP450™ model: (A) Graph showing labile metabolic position; (B) pie chart showing enzyme effect in %; (C) summary for the major metabolic site (in %) showing the enzymes’ effect. (The pictured was inserted directly from the StarDrop WhichP450™ software).
Molecules 25 05903 g002
Figure 3. In silico results for CYP450 subtypes affecting galeon. (The picture was inserted directly from the StarDrop WhichP450™ software).
Molecules 25 05903 g003
Figure 4. Mass spectra of galeon: (A) MS spectrum; (B) MS2 spectrum; (C) MS3 spectrum.
Molecules 25 05903 g004
Scheme 1. MS/MSn of galeon in ion-trap MS.
Molecules 25 05903 sch001
Scheme 2. MS2 fragmentation pattern of metabolite M1 (m/z 313).
Molecules 25 05903 sch002
Scheme 3. MS2 fragmentation pattern of metabolite M2 (m/z 315).
Molecules 25 05903 sch003
Scheme 4. MS2 fragmentation pattern of metabolite M3 (m/z 329).
Molecules 25 05903 sch004
Scheme 5. MS2 fragmentation pattern of metabolite M4 (m/z 343).
Molecules 25 05903 sch005
Scheme 6. MS2 fragmentation pattern of metabolite M5 (m/z 331).
Molecules 25 05903 sch006
Scheme 7. MS2 fragmentation pattern of metabolite M6 (m/z 359).
Molecules 25 05903 sch007
Scheme 8. MS2 fragmentation pattern of metabolite M7 (m/z 361).
Molecules 25 05903 sch008
Scheme 9. Possible detected metabolic reactions and their proposed structures are depicted. Rat liver microsome, (RLM).
Molecules 25 05903 sch009
Scheme 10. MS2 fragmentation pattern of metabolite M8 (m/z 356).
Molecules 25 05903 sch010
Scheme 11. MS2 fragmentation pattern of the metabolite M9 (m/z 342).
Molecules 25 05903 sch011
Scheme 12. MS2 fragmentation pattern of metabolite M10 (m/z 360).
Molecules 25 05903 sch012
Scheme 13. Possible methoxylamine conjugates.
Molecules 25 05903 sch013
Scheme 14. Mechanism of GSH conjugation of galeon.
Molecules 25 05903 sch014
Scheme 15. MS2 fragmentation pattern of metabolite M11 (m/z 648).
Molecules 25 05903 sch015
Scheme 16. MS2 fragmentation pattern of metabolite M12 (m/z 664).
Molecules 25 05903 sch016
Scheme 17. MS2 fragmentation pattern of metabolite M13 (m/z 666).
Molecules 25 05903 sch017
Figure 5. (A) 2D interaction mechanism of CYP1A2–galeon; (B) 3D interaction mechanism of CYP1A2–galeon.
Molecules 25 05903 g005
Figure 6. (A) 2D interaction mechanism of CYP2E1-galeon; (B) 3D interaction mechanism of CYP2E1-galeon.
Molecules 25 05903 g006
Figure 7. (A) 2D interaction mechanism of CYP2C19-galeon; (B) 3D interaction mechanism of CYP2C19-galeon.
Molecules 25 05903 g007
Figure 8. (A) 2D interaction mechanism of CYP2D6-galeon; (B) 3D interaction mechanism of CYP2D6-galeon.
Molecules 25 05903 g008
Figure 9. (A) 2D interaction mechanism of CYP3A4-galeon; (B) 3D interaction mechanism of CYP3A4-galeon.
Molecules 25 05903 g009
Figure 10. Conformational changes of the interacting residues: (A) Ser119, (B) Arg212, (C) Phe213, (D) Phe304, (E) Ala305, and (F) the overall structural alignment. The Apo state is represented in yellow, while the ligand bound state is shown in green. The Apo state interacting residues are in red, and ligand bound state residues are in blue.
Molecules 25 05903 g010
Table 1. Qualitative toxicity prediction of galeon and its metabolites by Deductive Estimation of Risk from Existing Knowledge (DEREK) software analysis.
Galeon and Its MetabolitesSkin SensitizationThyroid ToxicityChromosome DamageCarcinogenicityTeratogenicity, Genotoxicity, and Mutagenicity
Molecules 25 05903 i001
Galeon
NANANANANA
Molecules 25 05903 i002
Hydroxy(C11)-galeon
PlausibleNANANANA
Molecules 25 05903 i003
Hydroxy(C13)-galeon
PlausiblePlausibleNAPlausibleNA
Molecules 25 05903 i004
Hydroxy(C14)-galeon
PlausibleNAPlausibleNANA
Molecules 25 05903 i005
Hydroxy(C4)-galeon
PlausibleNANANANA
Molecules 25 05903 i006
Hydroxy(C6)-galeon
PlausibleNANAPlausibleNA
Molecules 25 05903 i007
Hydroxy(C7)-galeon
PlausibleNANANANA
NA = Not applicable (i.e., no toxicity).
Table 2. Possible Phase-I metabolites of galeon.
MetabolitesNominal Observed Mass (m/z)Retention Time (min)Fragments (MS2 in m/z)Possible Metabolic Reactions
M131325.0295, 281, 249, 209, 167, 139, 129Demethylation
M231528.9297, 279, 243, 165Demethylation with Reduction
M3a/b or M3c/d32940.0 or 40.6311, 257, 121 133, 124, 110Reduction or Demethylation with Hydroxylation
M4a34322.6327, 323Hydroxylation
M4b23.5325, 223, 203, 191, 179, 167, 147
M4c24.0331, 296
M4d24.4203, 193
M4e24.9240, 147
M4f/g25.2322, 310, 255, 240/325, 322, 310, 240
M4h19.3297, 223
M5a33141.0313, 108Demethylation with Hydroxylation and Reduction
M5b41.8313, 215
M635921.1341, 323, 251Dihydroxylation
M736130.2352, 337, 315Dihydroxylation with Reduction
Table 3. Reactive metabolites of galeon.
MetabolitesNominal Observed Mass (m/z)Retention Time (min)Fragments (MS2 in m/z)Metabolic Reactions
Methoxylamine–Galeon Conjugate
M8a35631.3338, 240Oxidative alkylation followed by oxime formation
M8b31.7294, 192, 129
M9a34225.9292, 211Oxidative alkylation and demethylation followed by oxime formation
M9b26.4324, 316, 297
M9c6.1298, 179, 91
M9d6.4225, 222
M10a36020.8343, 325Oxidative alkylation, demethylation and hydroxylation followed by oxime formation
M10b22.8342, 331, 316
M10c23.8325, 316, 250
Glutathione (GHS)–Galeon Conjugate
M1164810.5452, 450, 445, 443Mono-hydroxygaleon–GSH conjugate
M1266420.6628, 382Di-hydroxygaleon–GSH conjugate
M1366620.5650, 647, 644Reduction of carbonyl and Di-hydroxygaleon–GSH conjugate
Sample Availability: Galeon is available but metabolites are not available from the authors.
Publisher’s Note: MDPI stays neutral with regard to jurisdictional claims in published maps and institutional affiliations.