
Lanthanide(III) Complexes of Cyclen Triacetates and Triamides Bearing Tertiary Amide-Linked Antennae

 ,
,  ,
,  and
and
Abstract
1. Introduction
2. Results
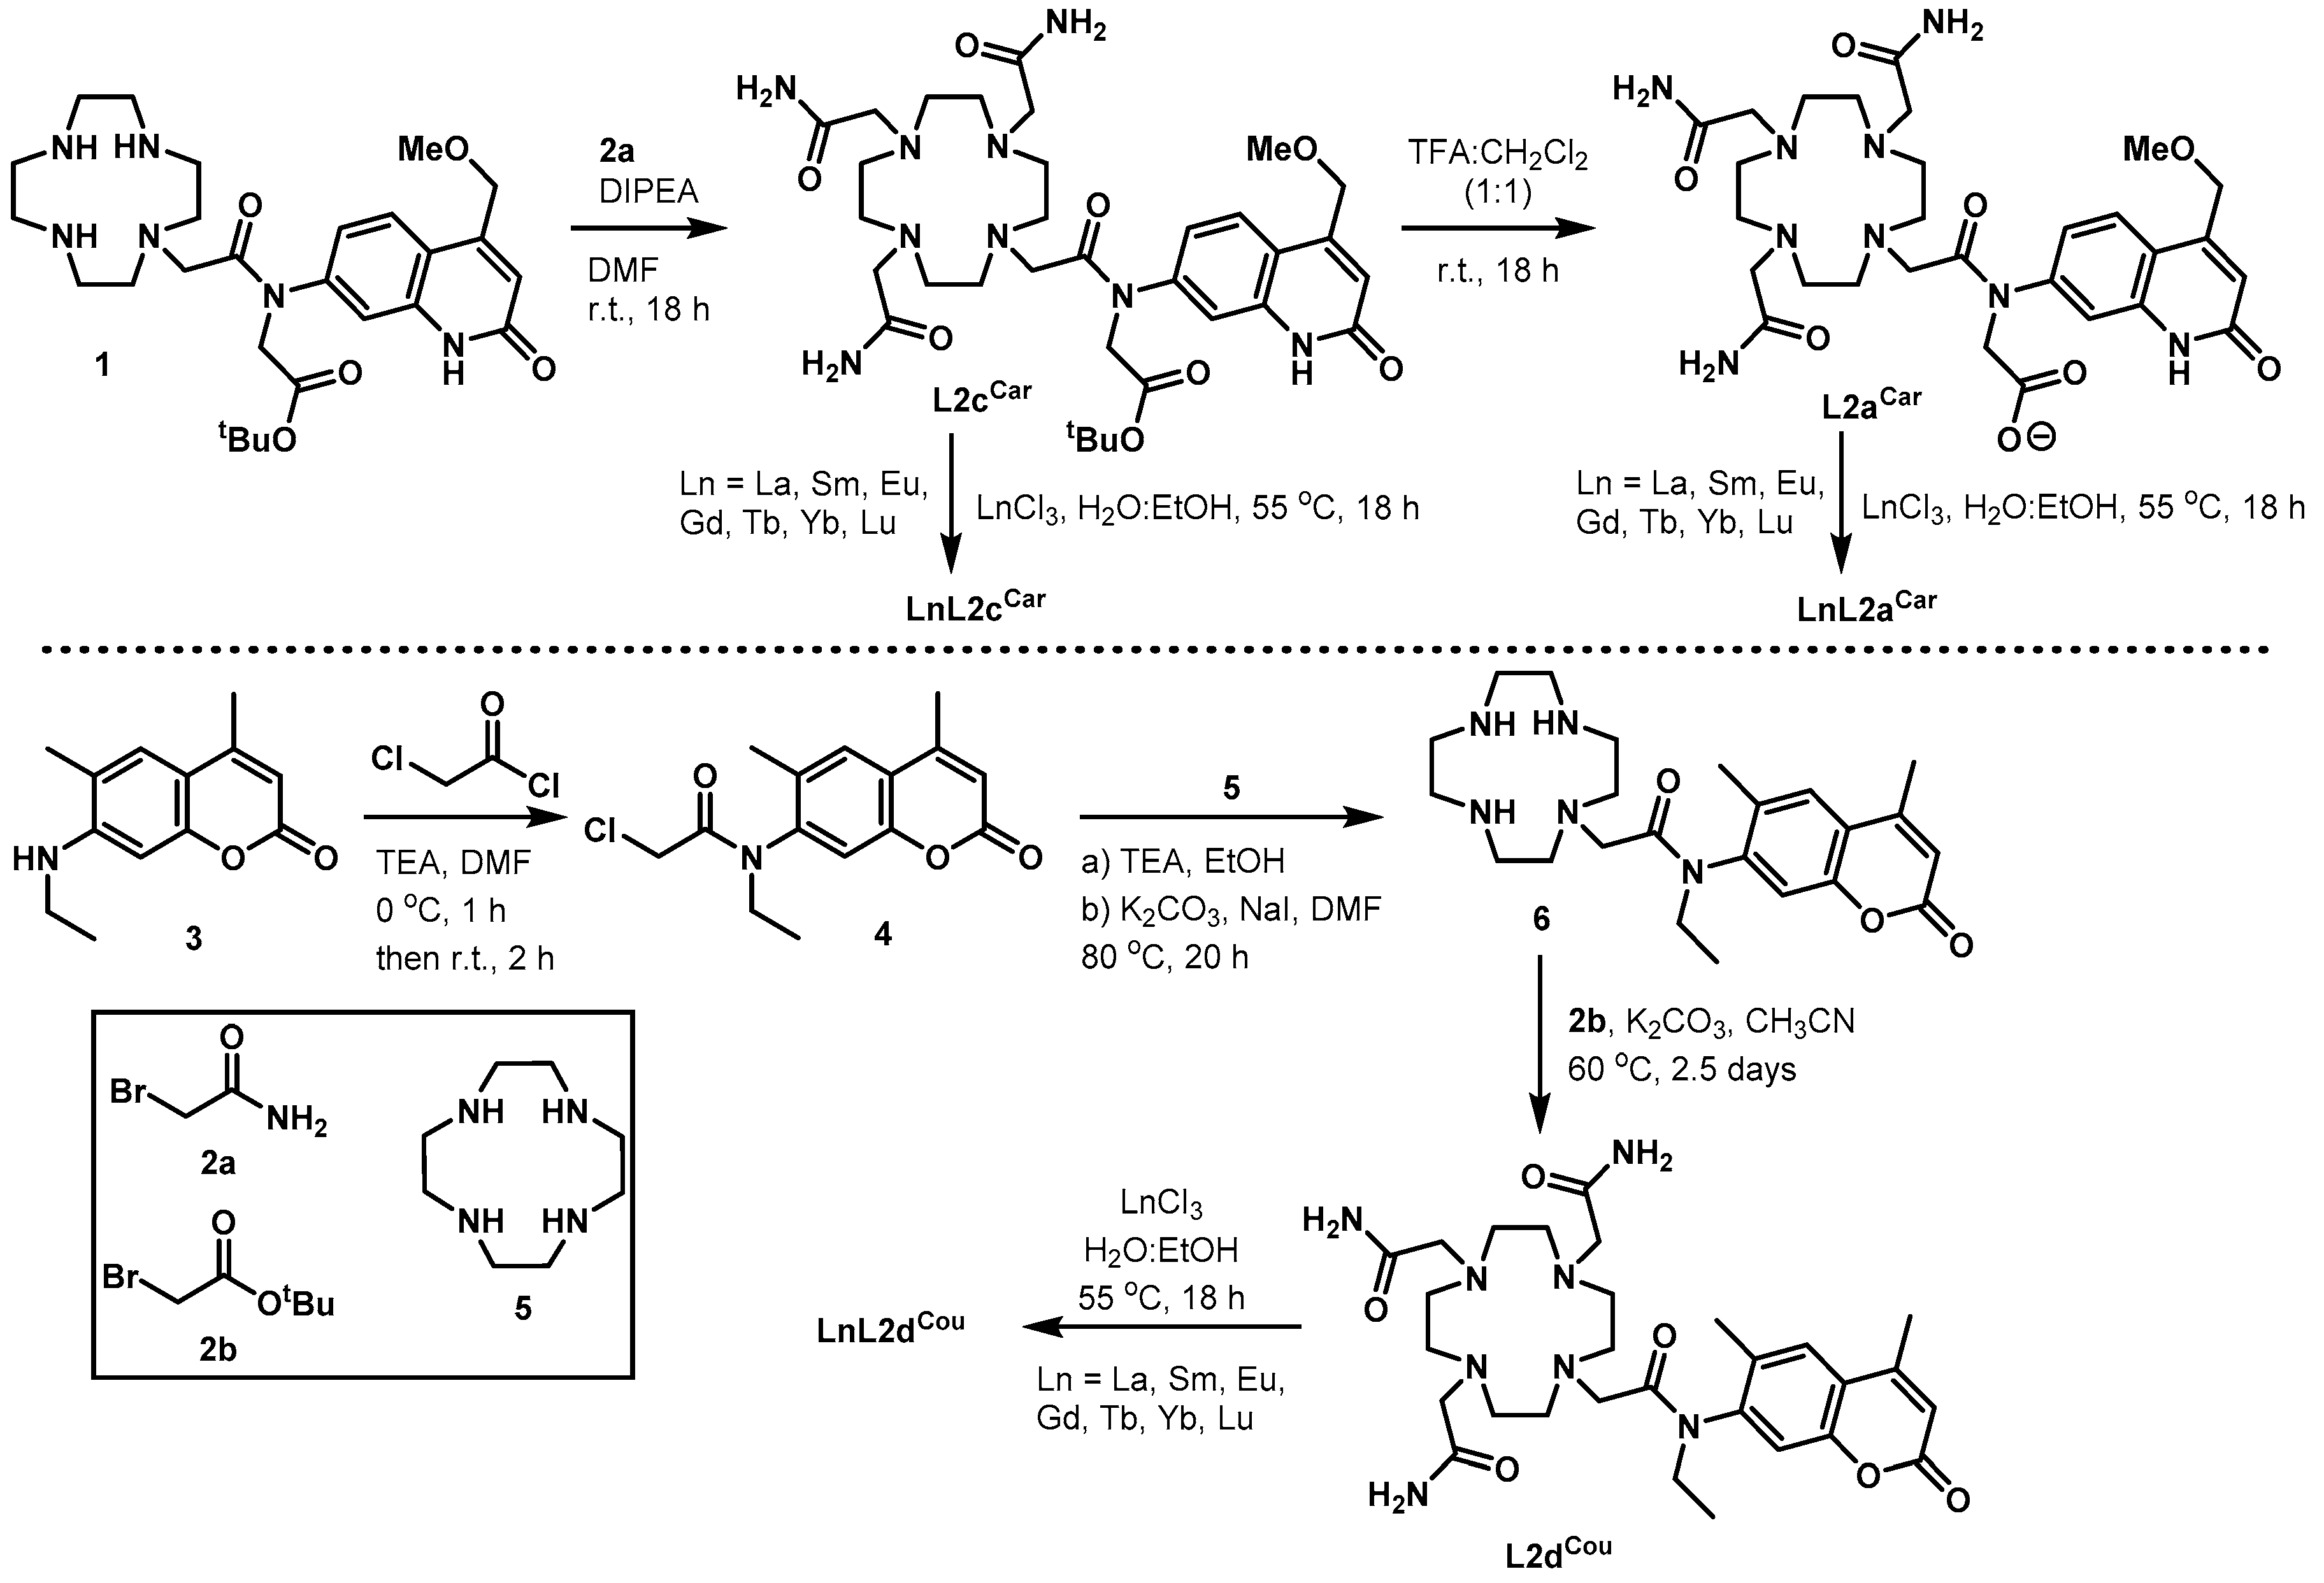
2.1. Synthesis
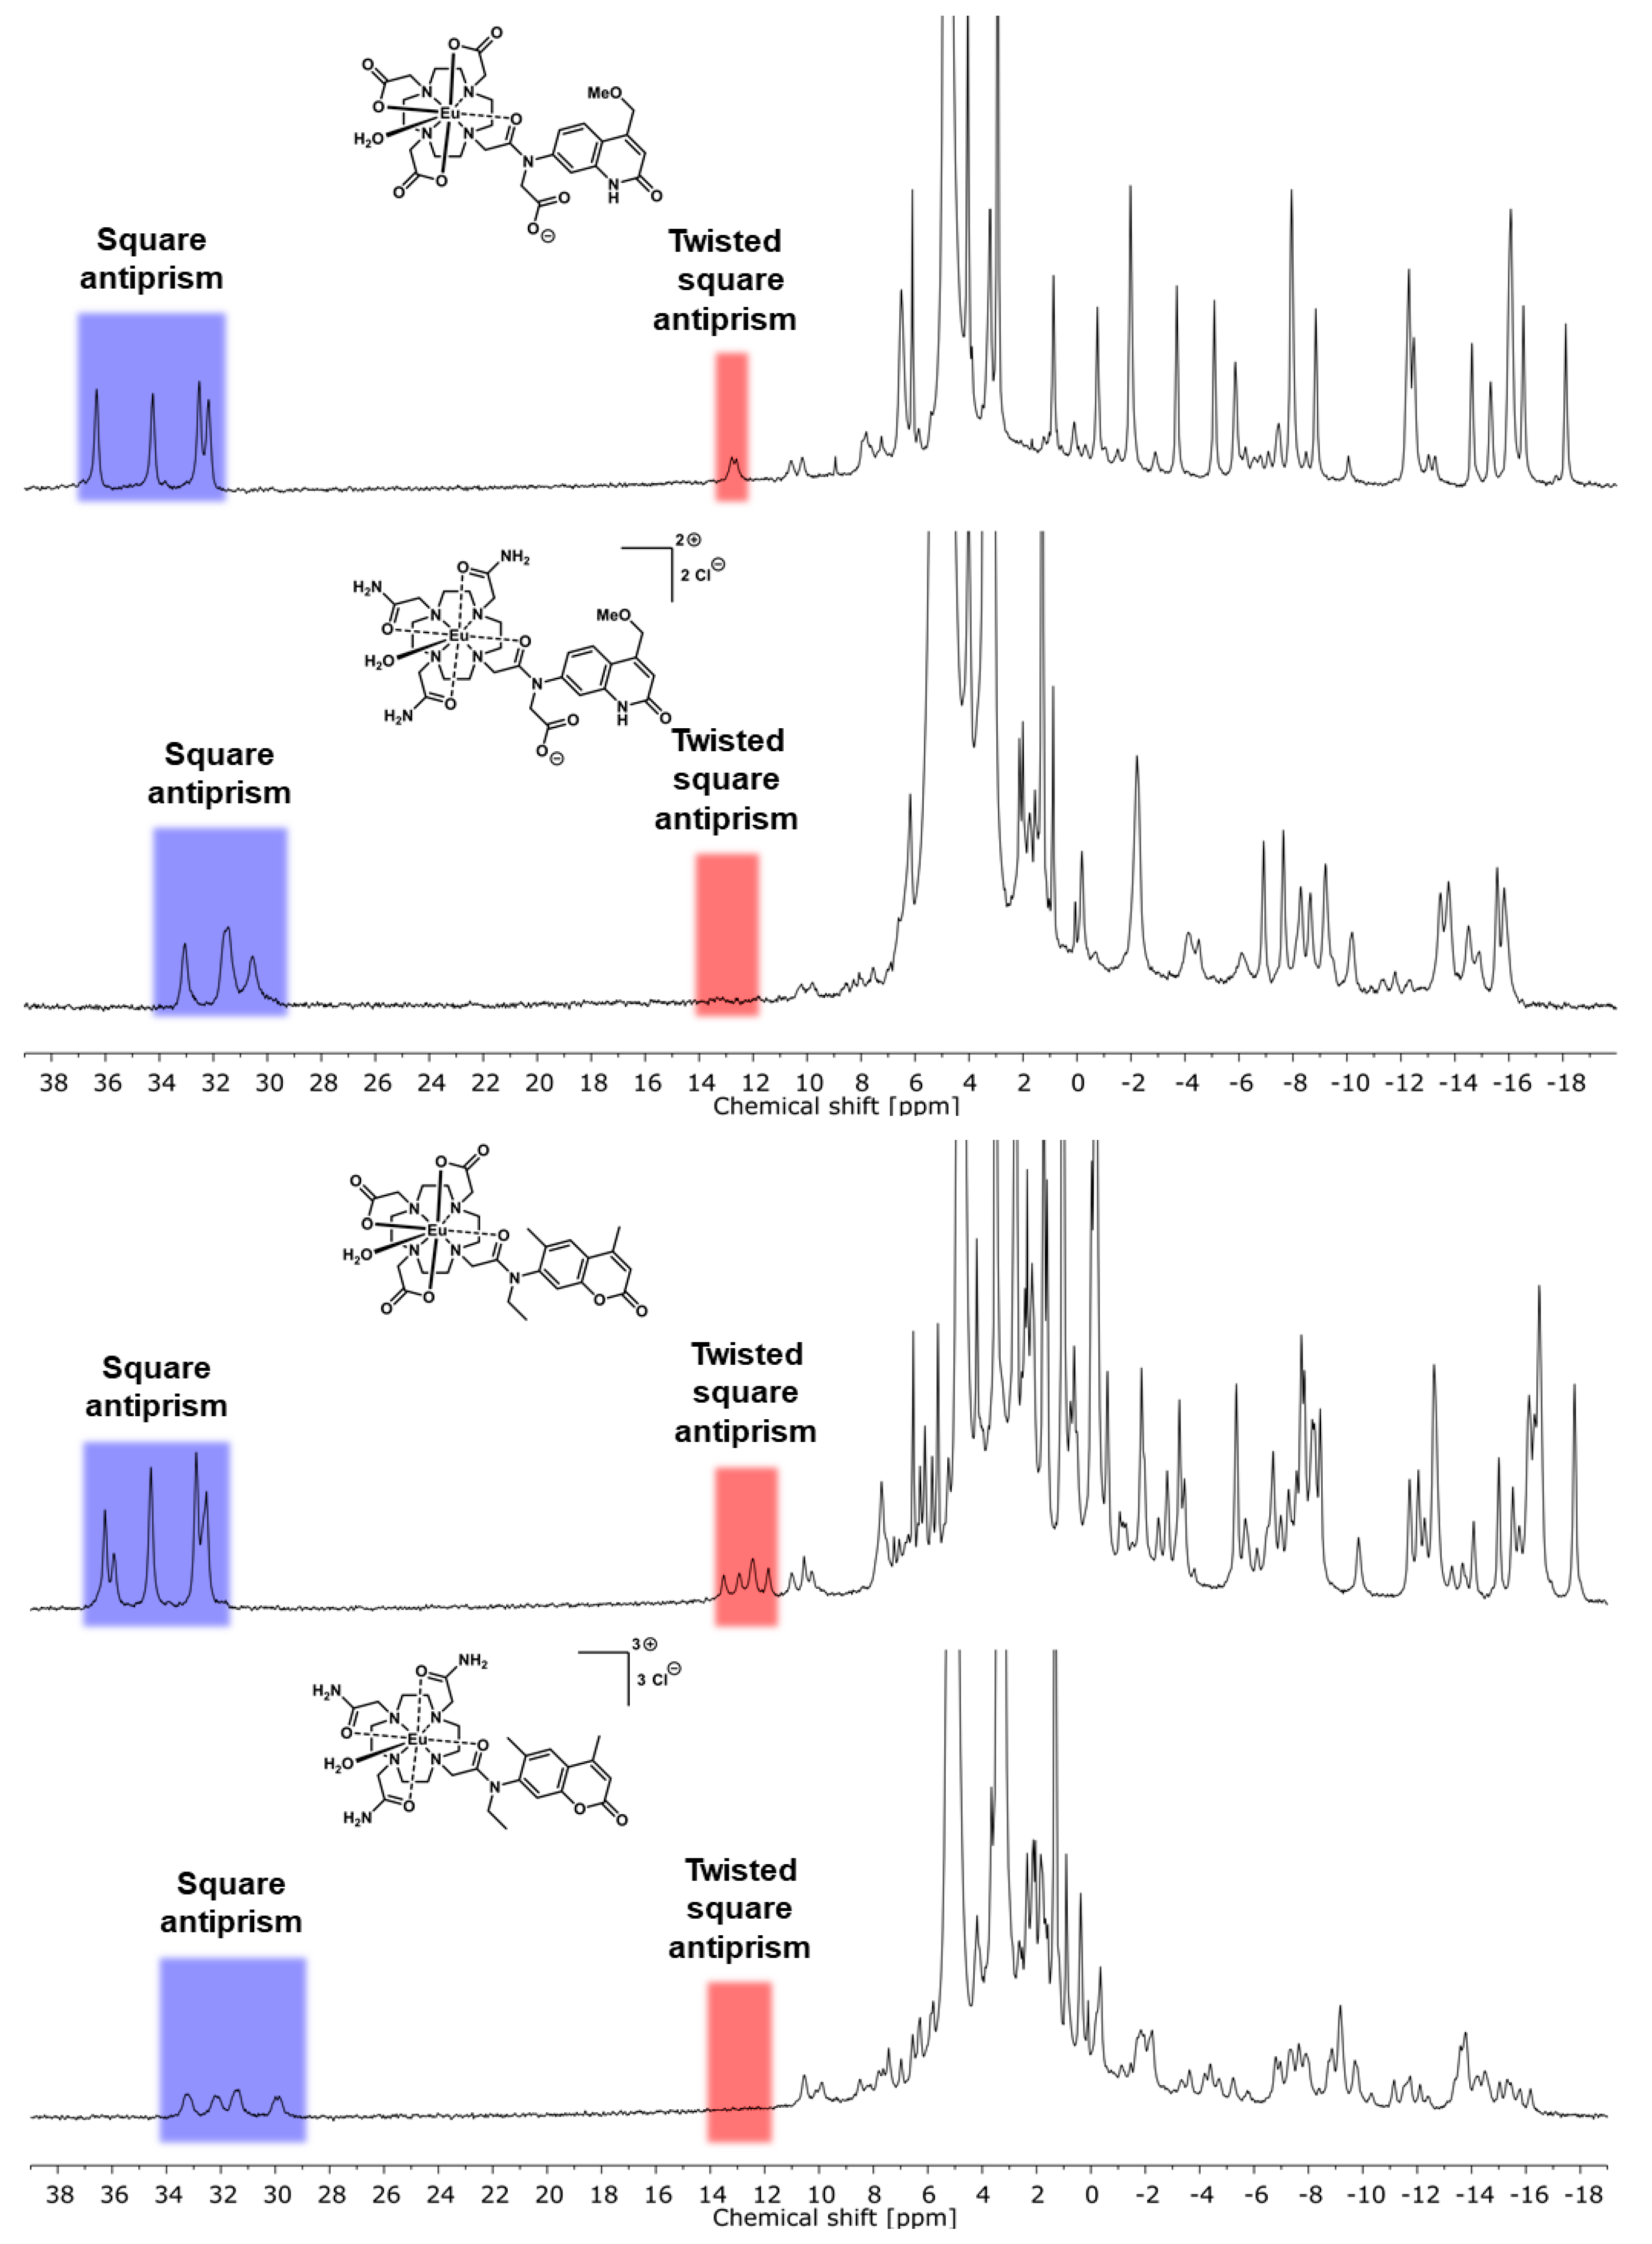
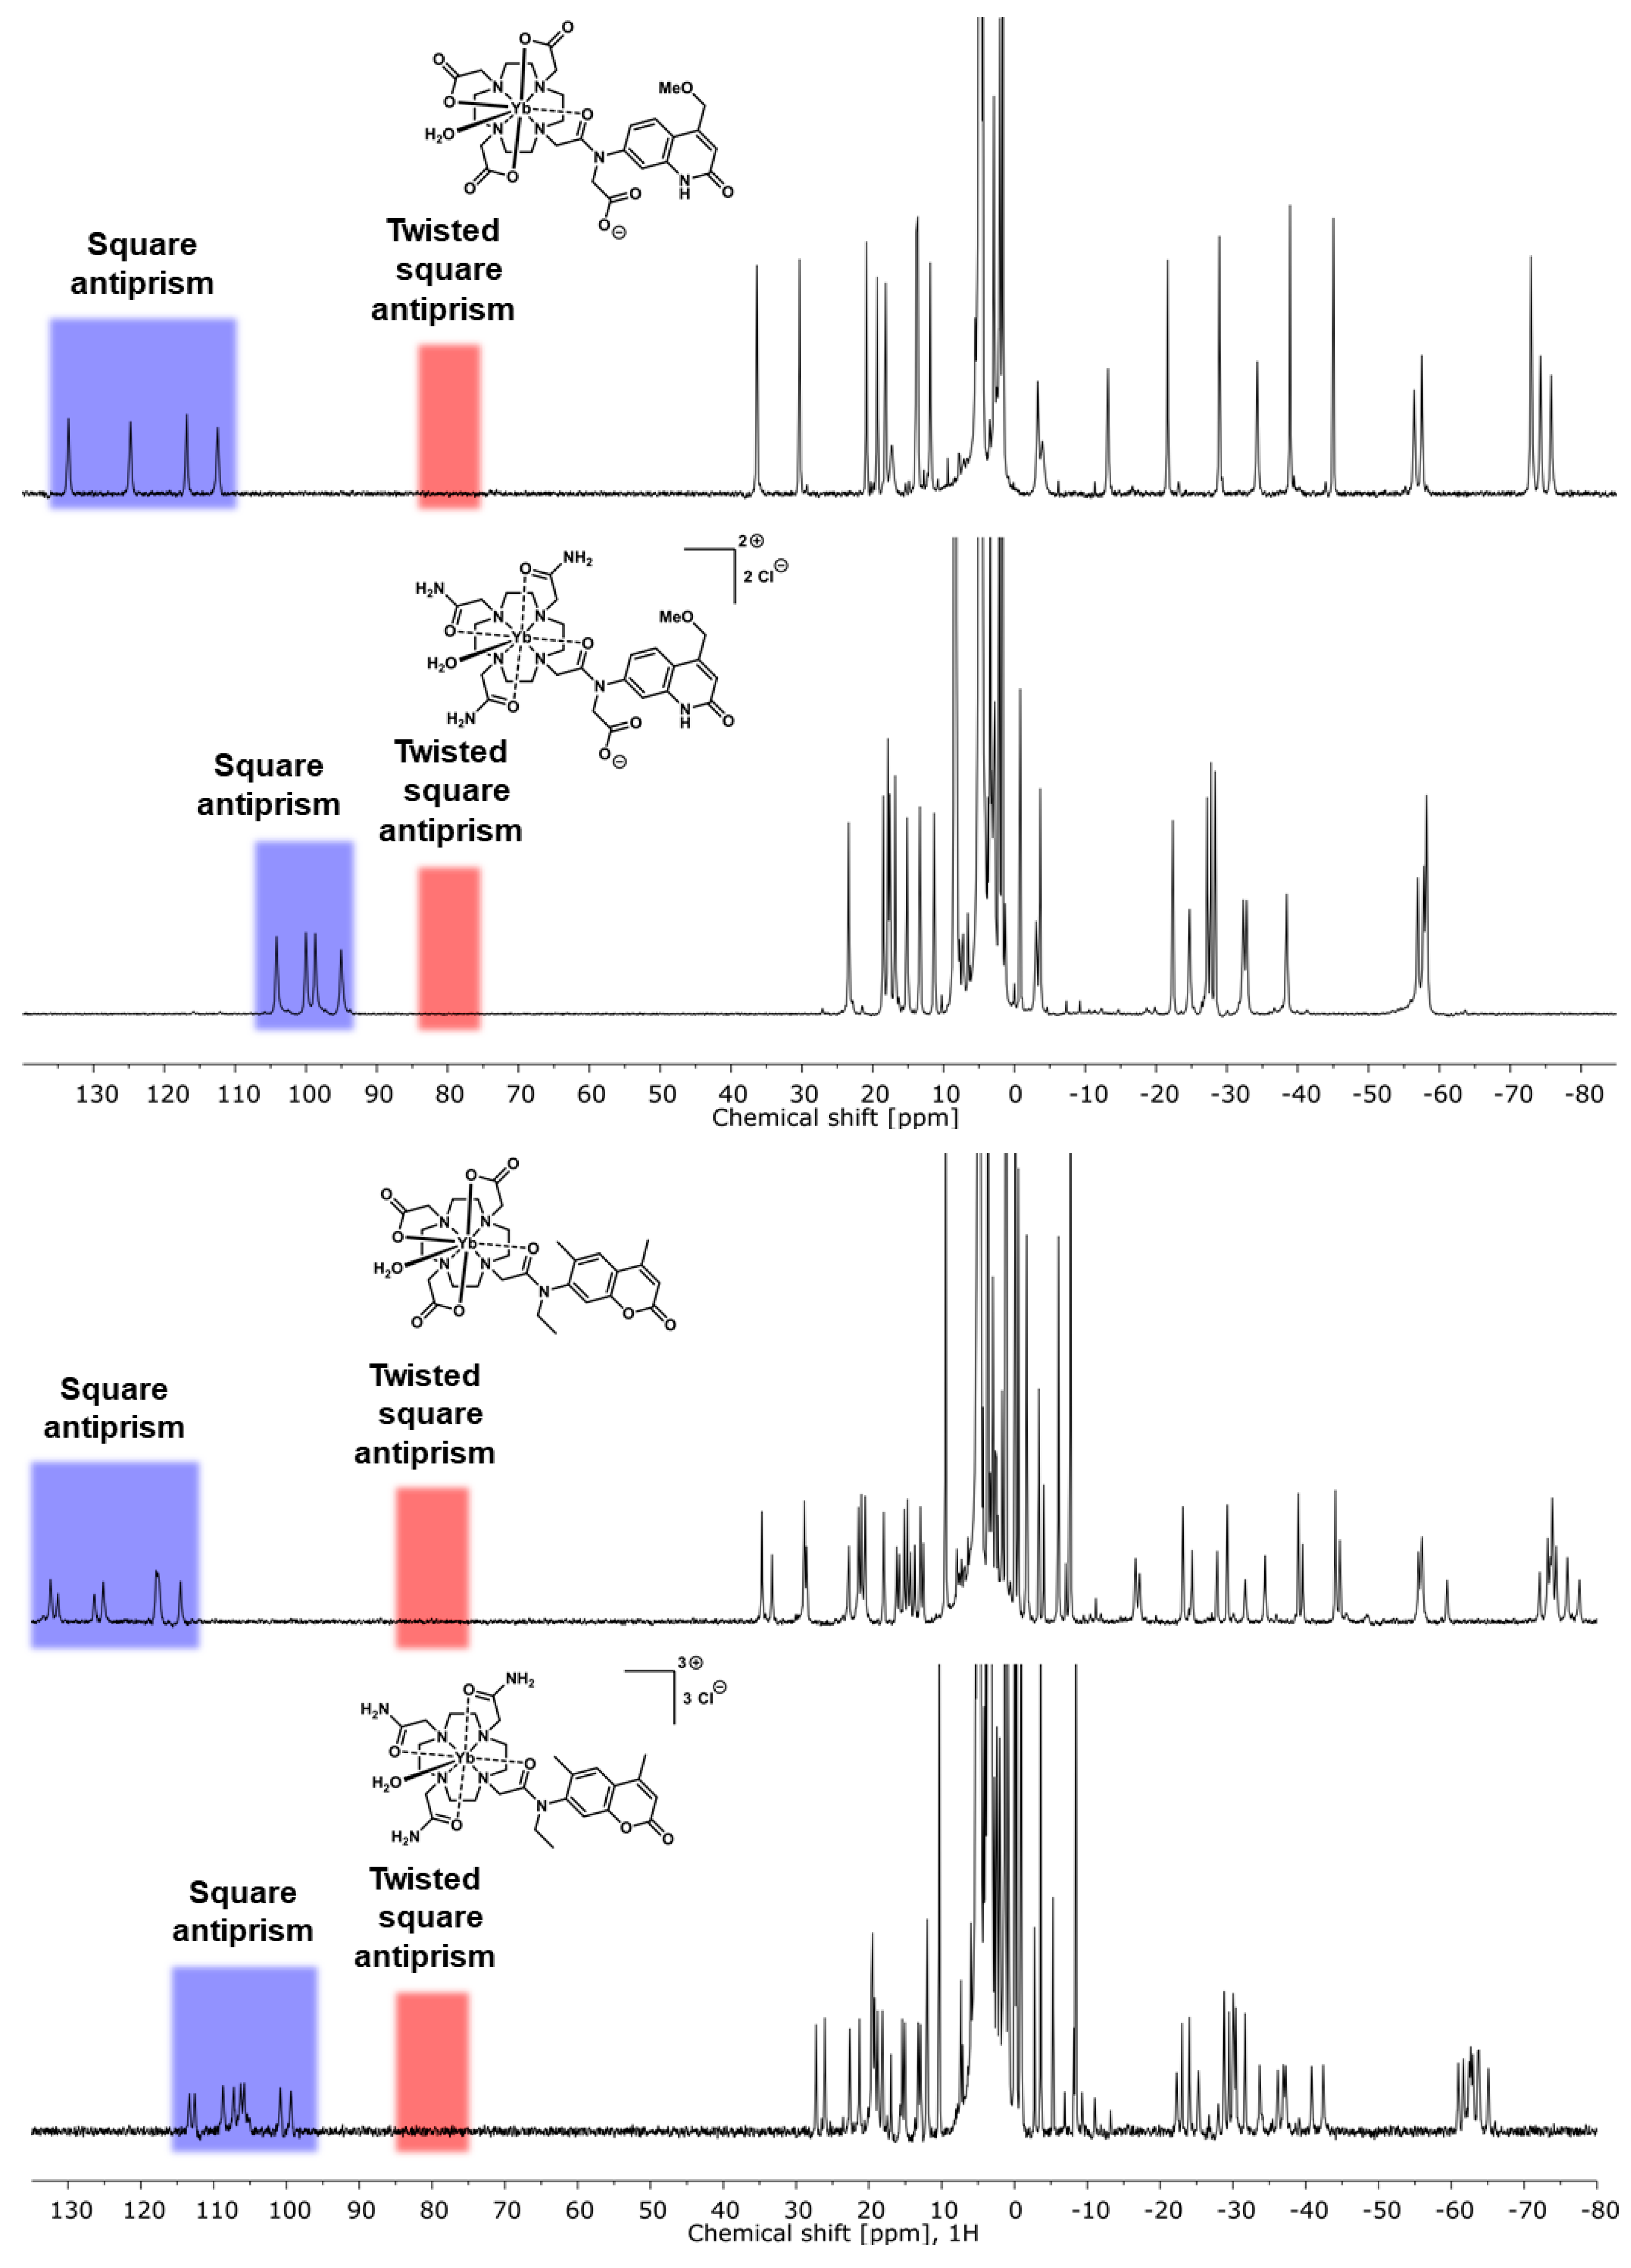
2.2. Paramagnetic 1H NMR Spectroscopy
2.3. Cyclic Voltammetry
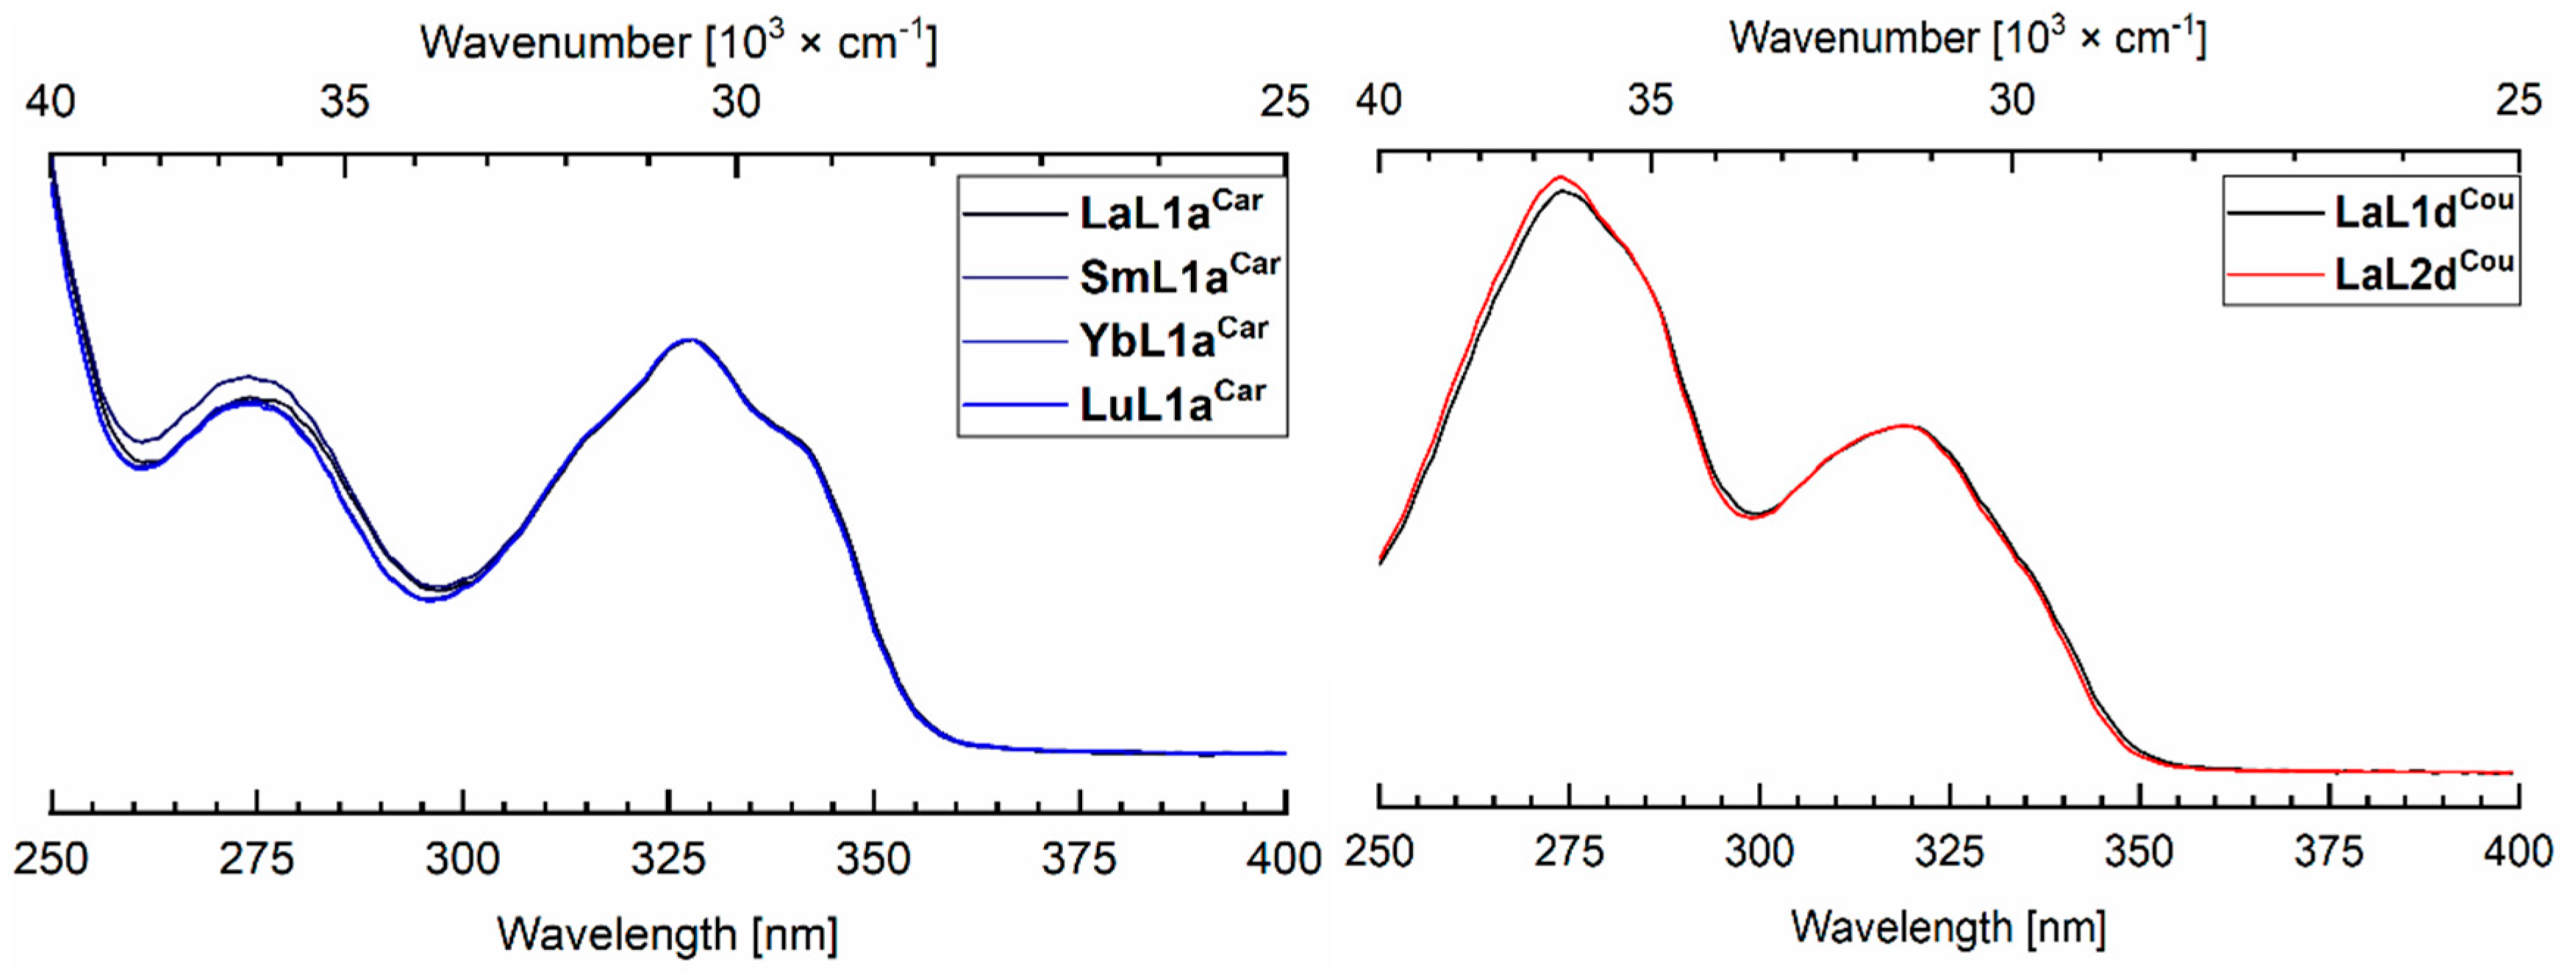
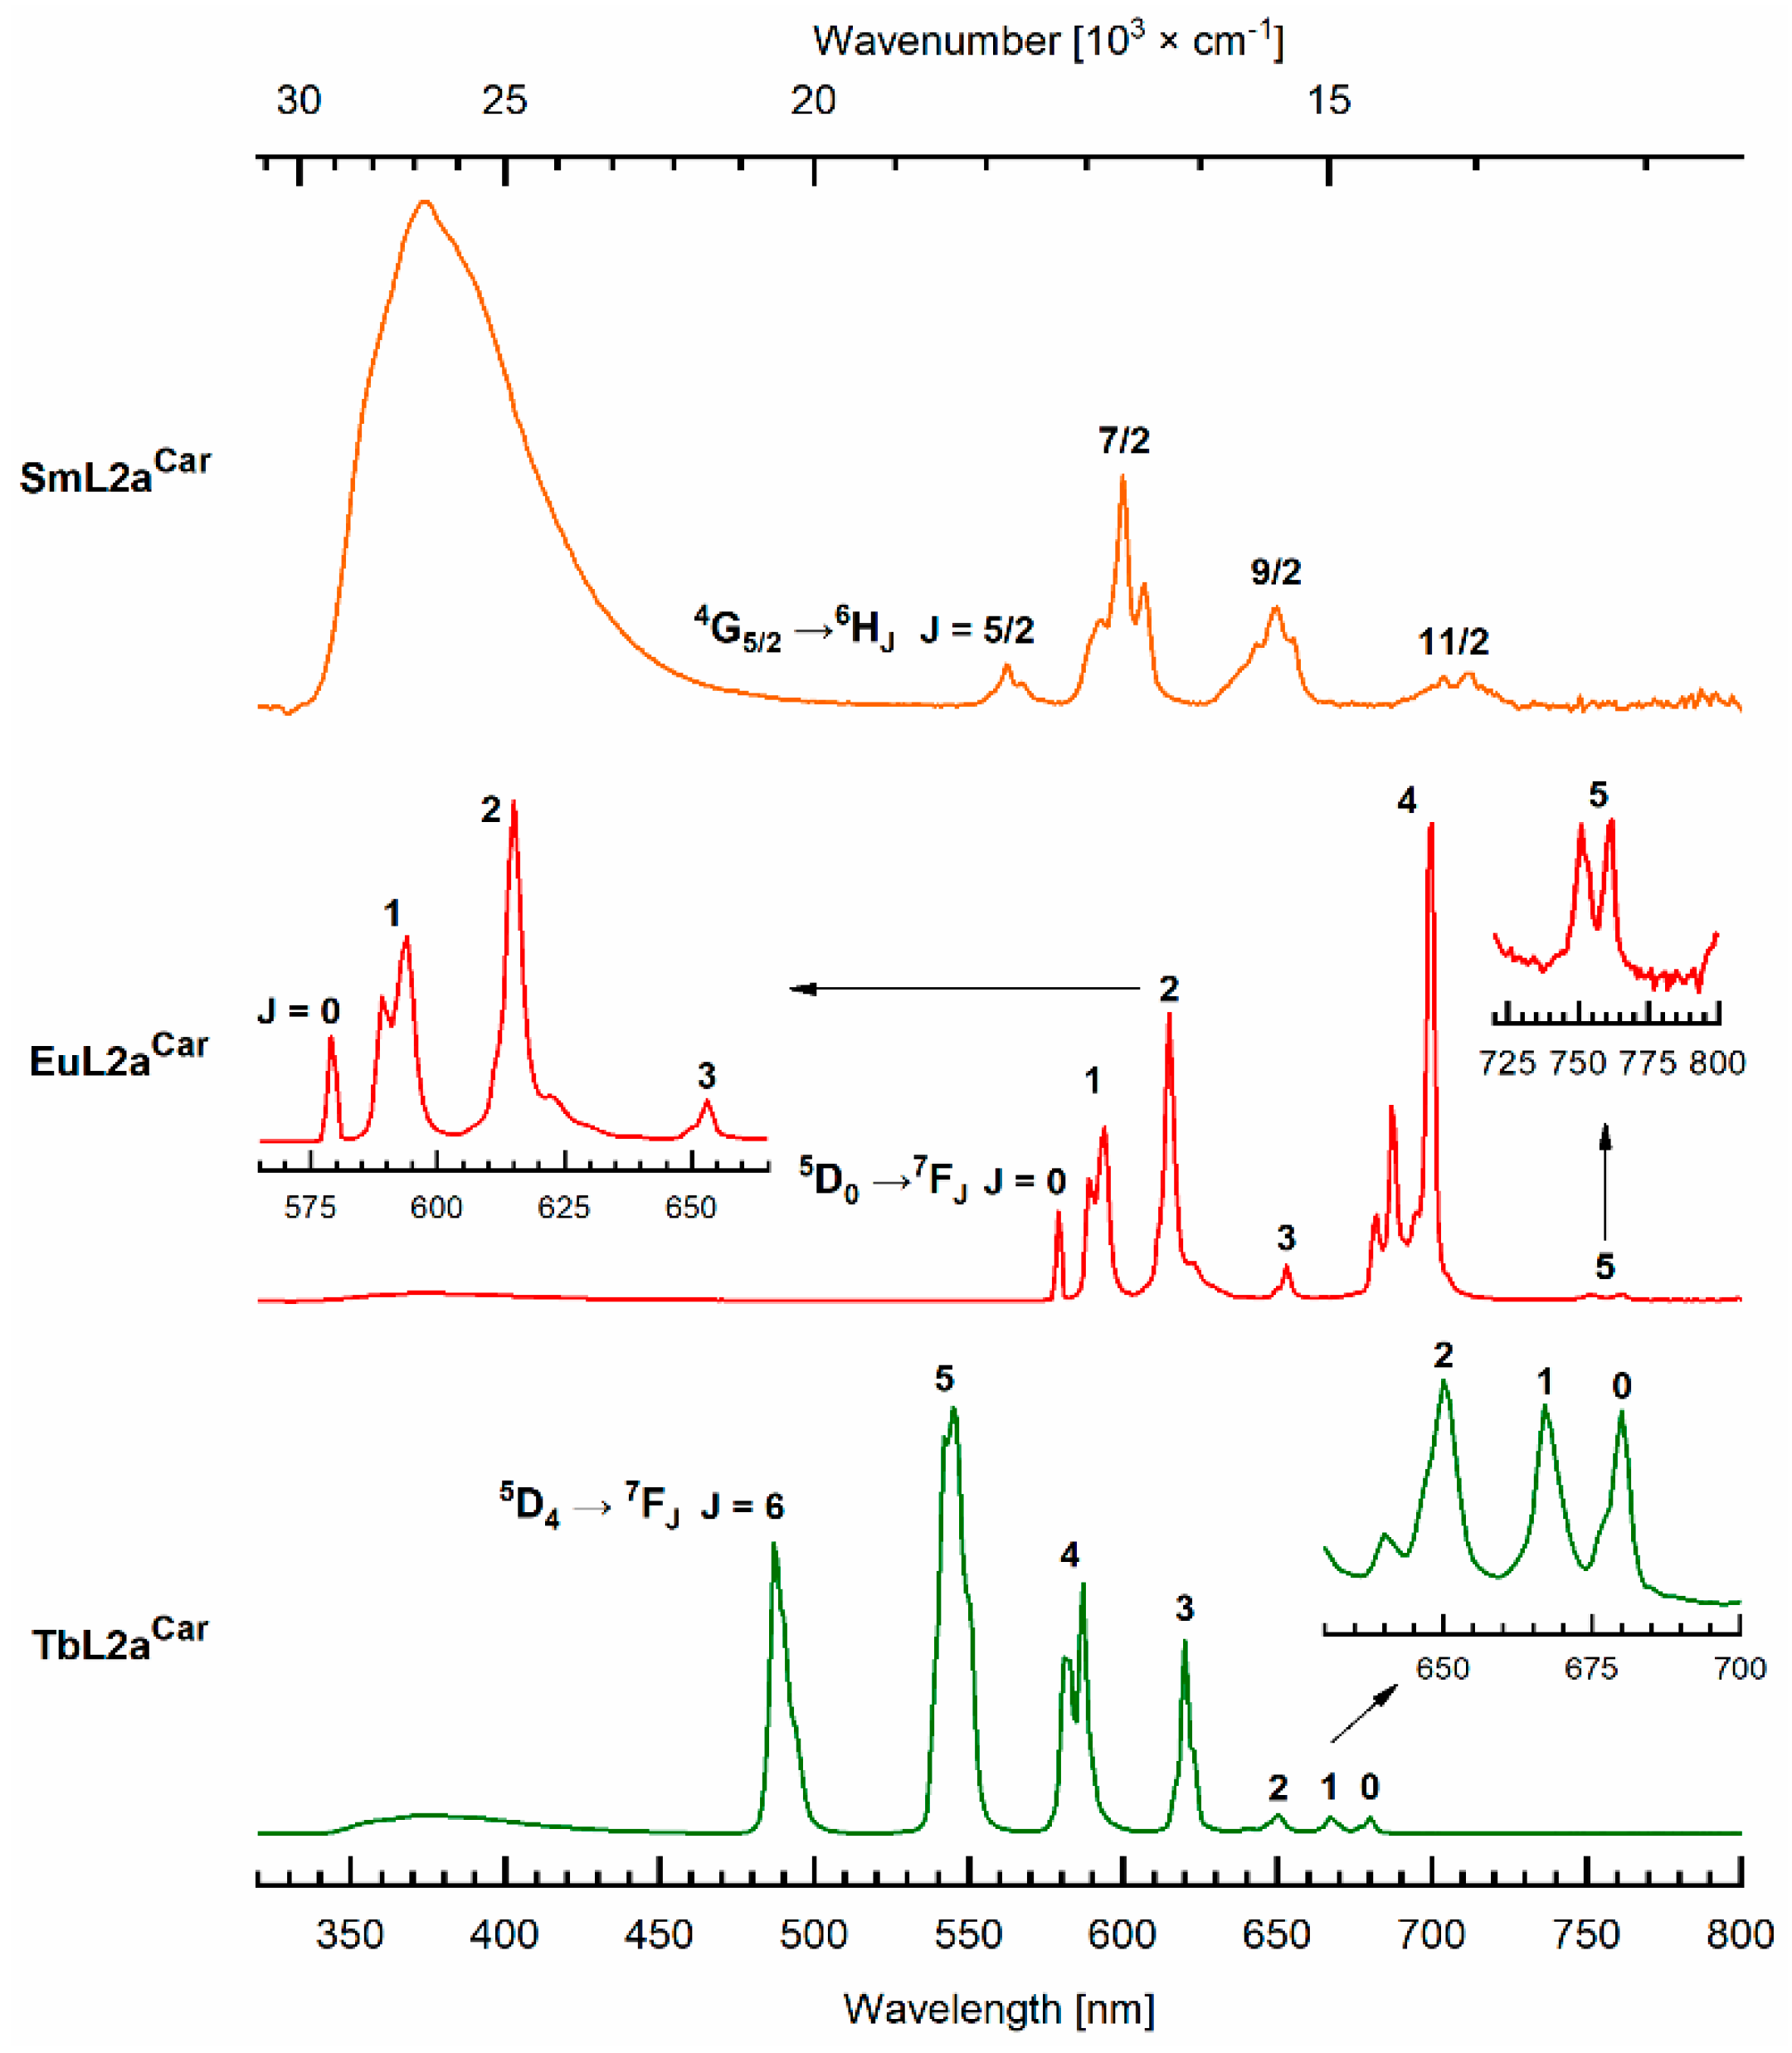
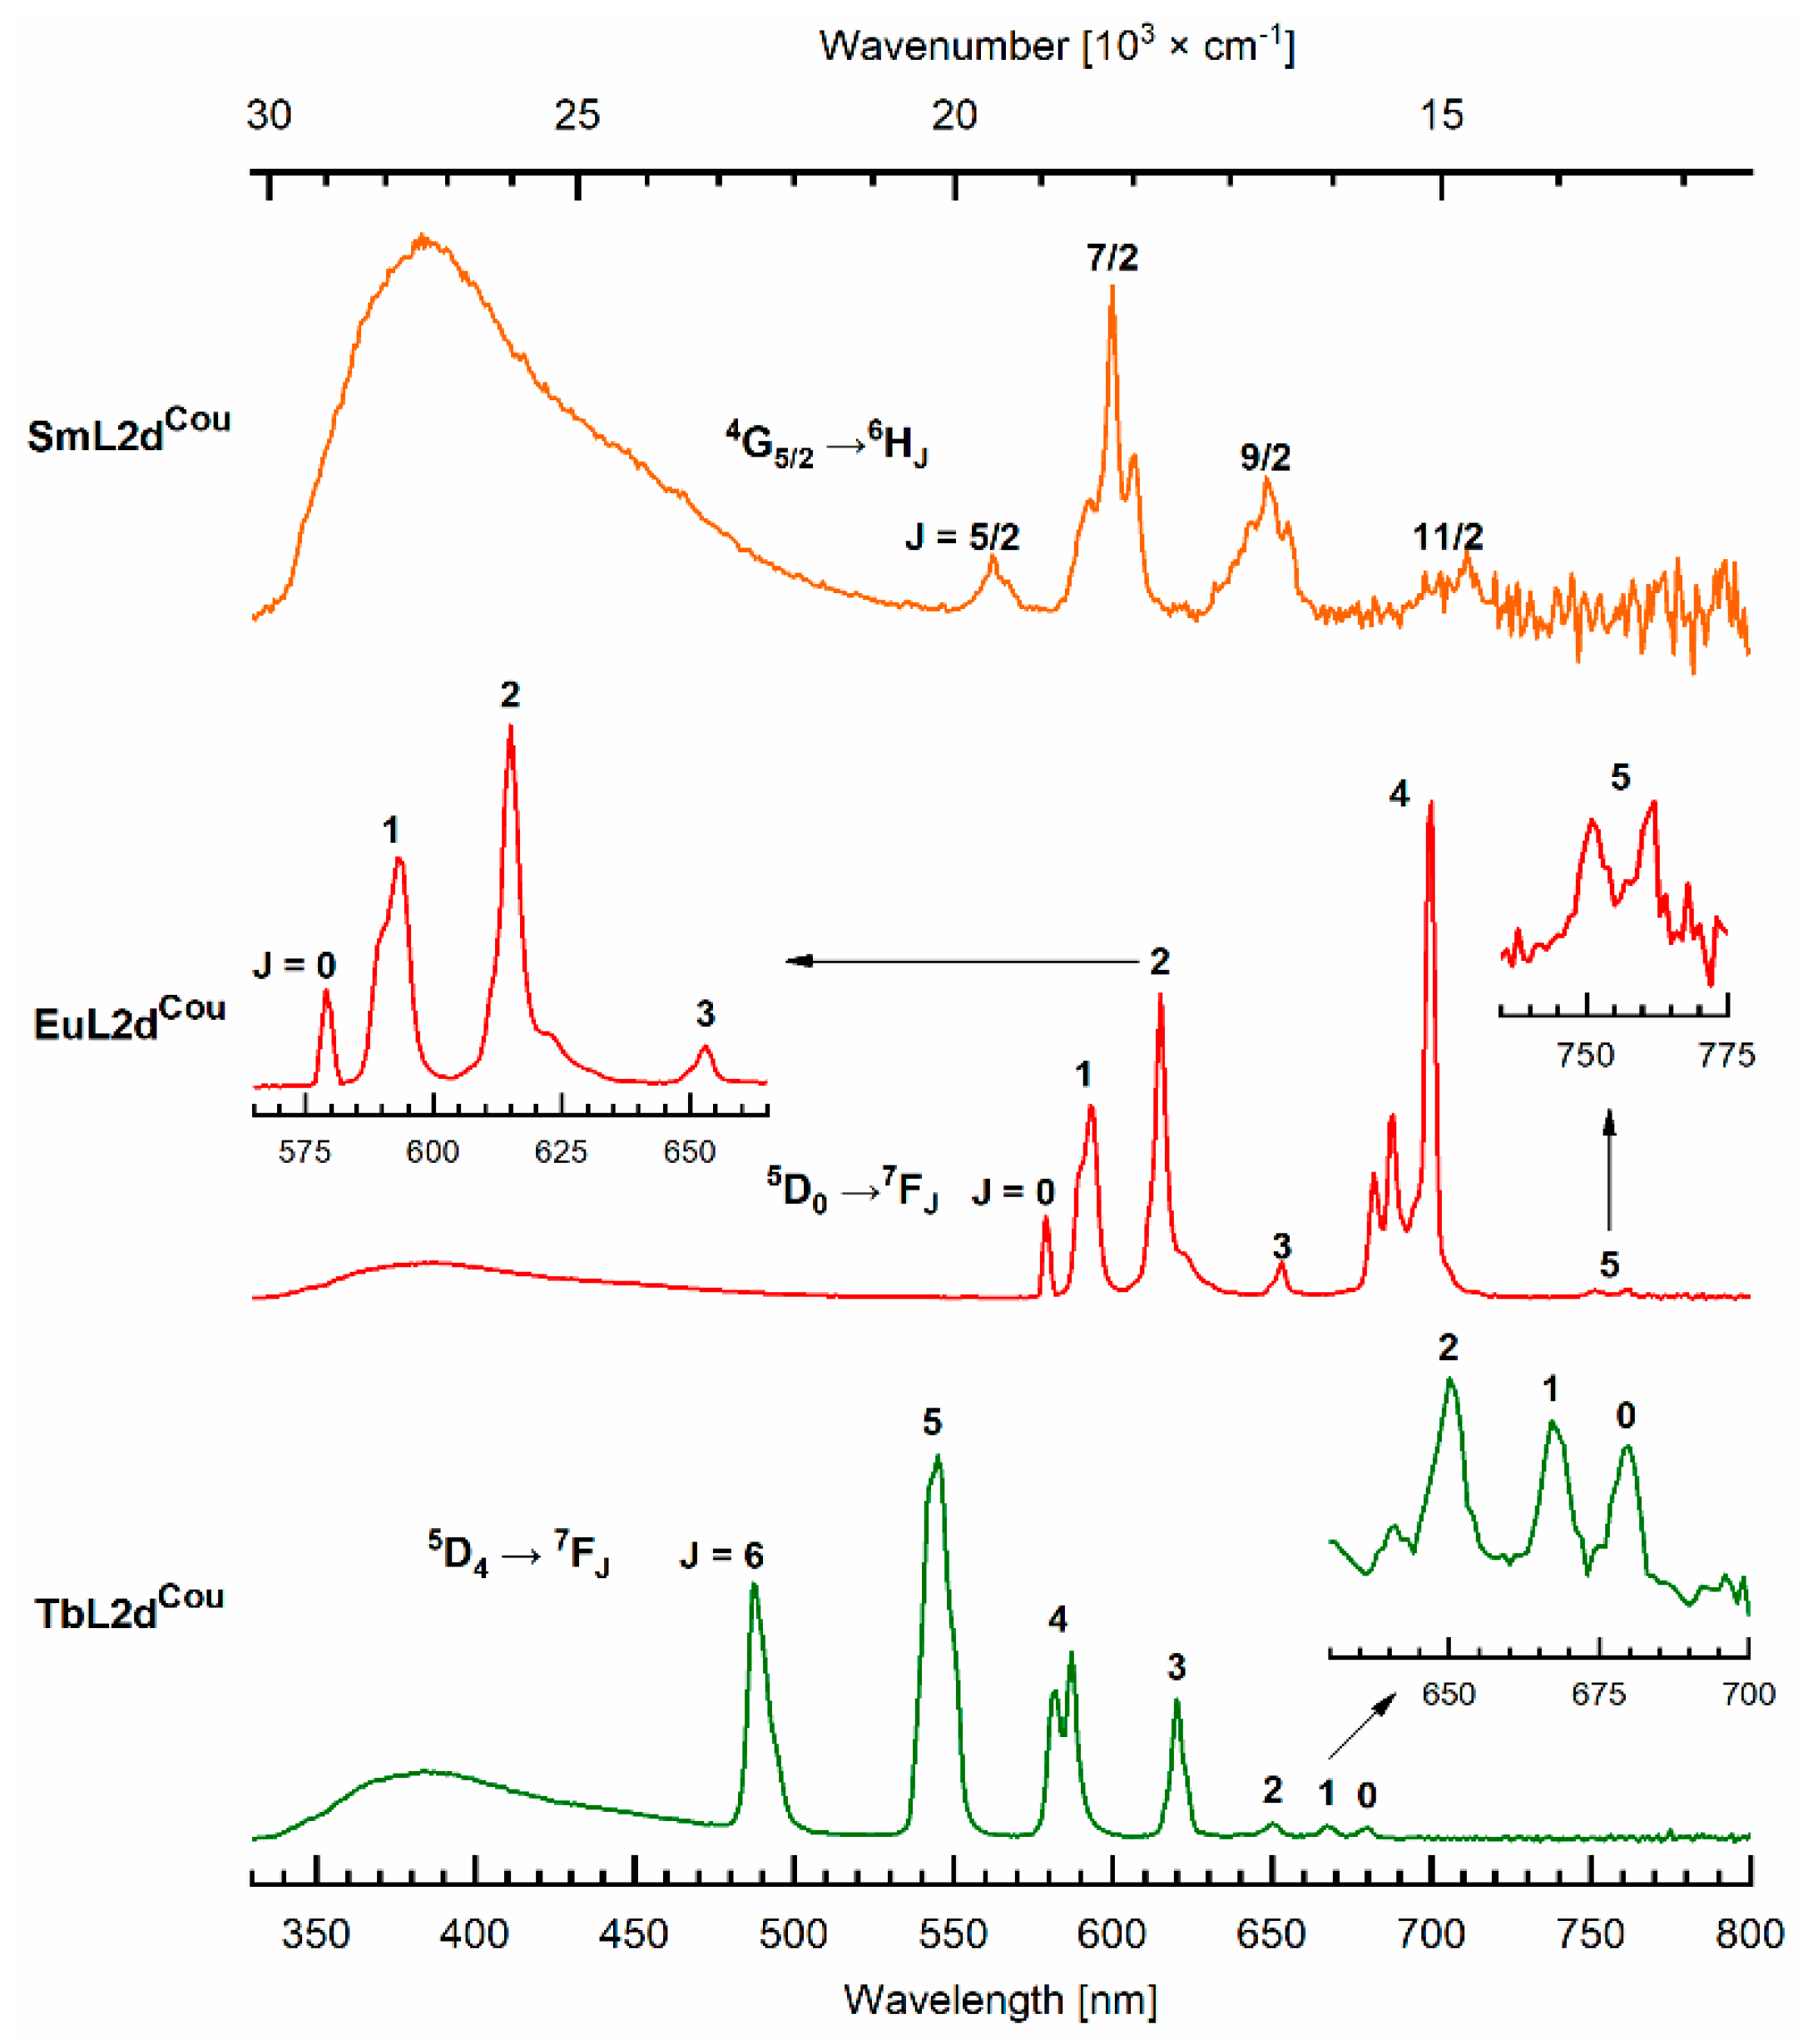
2.4. Photophysical Characterization
3. Materials and Methods
3.1. General Procedures
3.2. Paramagnetic 1H NMR
3.3. Chromatography
3.4. Electrochemistry
3.5. UV-Vis Absorption and Emission Spectroscopy
3.6. Synthetic Procedures and Characterization Data
3.7. General Procedure for Ln (III) Complexation
4. Conclusions
Supplementary Materials
Author Contributions
Funding
Conflicts of Interest
References
- Bünzli, J.-C.G. Lanthanide Luminescence for Biomedical Analyses and Imaging. Chem. Rev. 2010, 110, 2729–2755. [Google Scholar] [CrossRef] [PubMed]
- Eliseeva, S.V.; Bünzli, J.-C.G. Lanthanide luminescence for functional materials and bio-sciences. Chem. Soc. Rev. 2009, 39, 189–227. [Google Scholar] [CrossRef] [PubMed]
- Andres, J.; Hersch, R.D.; Moser, J.-E.; Chauvin, A.-S. A New Anti-Counterfeiting Feature Relying on Invisible Luminescent Full Color Images Printed with Lanthanide-Based Inks. Adv. Funct. Mater. 2014, 24, 5029–5036. [Google Scholar] [CrossRef]
- Guillou, O.; Daiguebonne, C.; Calvez, G.; Bernot, K. A Long Journey in Lanthanide Chemistry: From Fundamental Crystallogenesis Studies to Commercial Anticounterfeiting Taggants. Acc. Chem. Res. 2016, 49, 844–856. [Google Scholar] [CrossRef]
- Kaczmarek, A.M.; Liu, Y.-Y.; Wang, C.; Laforce, B.; Vincze, L.; Van Der Voort, P.; Van Hecke, K.; Van Deun, R. Lanthanide “Chameleon” Multistage Anti-Counterfeit Materials. Adv. Funct. Mater. 2017, 27, 1700258. [Google Scholar] [CrossRef]
- de Bettencourt-Dias, A. Introduction to Lanthanide Ion Luminescence. In Luminescence of Lanthanide Ions in Coordination Compounds and Nanomaterials; John Wiley & Sons Ltd.: Hoboken, NJ, USA, 2014; pp. 1–48. [Google Scholar]
- Bünzli, J.-C.G.; Eliseeva, S.V. Basics of Lanthanide Photophysics. In Lanthanide Luminescence: Photophysical, Analytical and Biological Aspects; Hänninen, P., Härmä, H., Eds.; Springer: Berlin/Heidelberg, Germany, 2011; pp. 1–45. [Google Scholar]
- Kovacs, D.; Kiraev, S.R.; Phipps, D.; Orthaber, A.; Borbas, K.E. Eu(III) and Tb(III) Complexes of Octa- and Nonadentate Macrocyclic Ligands Carrying Azide, Alkyne, and Ester Reactive Groups. Inorg. Chem. 2020, 59, 106–117. [Google Scholar] [CrossRef]
- Kenwright, A.M.; Kuprov, I.; De Luca, E.; Parker, D.; Pandya, S.U.; Senanayake, P.K.; Smith, D.G. 19F NMR based pH probes: Lanthanide(iii) complexes with pH-sensitive chemical shifts. Chem. Commun. 2008, 22, 2514–2516. [Google Scholar] [CrossRef]
- Pershagen, E.; Borbas, K.E. Designing reactivity-based responsive lanthanide probes for multicolor detection in biological systems. Coord. Chem. Rev. 2014, 273–274, 30–46. [Google Scholar] [CrossRef]
- Pershagen, E.; Nordholm, J.; Borbas, K.E. Luminescent Lanthanide Complexes with Analyte-Triggered Antenna Formation. J. Am. Chem. Soc. 2012, 134, 9832–9835. [Google Scholar] [CrossRef]
- Pershagen, E.; Borbas, K.E. Multiplex Detection of Enzymatic Activity with Responsive Lanthanide-Based Luminescent Probes. Angew. Chem. Int. Ed. 2015, 54, 1787–1790. [Google Scholar] [CrossRef]
- Parker, D. Luminescent lanthanide sensors for pH, pO2 and selected anions. Coord. Chem. Rev. 2000, 205, 109–130. [Google Scholar] [CrossRef]
- Law, G.-L.; Pal, R.; Palsson, L.O.; Parker, D.; Wong, K.-L. Responsive and reactive terbium complexes with an azaxanthone sensitiser and one naphthyl group: Applications in ratiometric oxygen sensing in vitro and in regioselective cell killing. Chem. Commun. 2009, 47, 7321–7323. [Google Scholar] [CrossRef] [PubMed]
- Bunzli, J.-C.G. On the design of highly luminescent lanthanide complexes. Coord. Chem. Rev. 2015, 293–294, 19–47. [Google Scholar] [CrossRef]
- Cotton, S. Coordination Chemistry of the Lanthanides. In Lanthanide and Actinide Chemistry; Wiley: Hoboken, NJ, USA, 2006; pp. 35–60. [Google Scholar]
- Supkowski, R.M.; Horrocks, W.D., Jr. On the determination of the number of water molecules, q, coordinated to europium(III) ions in solution from luminescence decay lifetimes. Inorg. Chim. Acta 2002, 340, 44–48. [Google Scholar] [CrossRef]
- Beeby, A.; Clarkson, I.M.; Dickins, R.S.; Faulkner, S.; Parker, D.; Royle, L.; de Sousa, A.S.; Williams, J.A.G.; Woods, M. Non-radiative deactivation of the excited states of europium, terbium and ytterbium complexes by proximate energy-matched OH, NH and CH oscillators: An improved luminescence method for establishing solution hydration states. J. Chem. Soc. Perkin Trans. 1999, 2, 493–504. [Google Scholar] [CrossRef]
- Kovacs, D.; Phipps, D.; Orthaber, A.; Borbas, K.E. Highly luminescent lanthanide complexes sensitized by tertiary amide-linked carbostyril antennae. Dalton Trans. 2018, 47, 10702–10714. [Google Scholar] [CrossRef] [PubMed]
- Kovacs, D.; Lu, X.; Mészáros, L.S.; Ott, M.; Andres, J.; Borbas, K.E. Photophysics of Coumarin and Carbostyril-Sensitized Luminescent Lanthanide Complexes: Implications for Complex Design in Multiplex Detection. J. Am. Chem. Soc. 2017, 139, 5756–5767. [Google Scholar] [CrossRef]
- Vithanarachchi, S.M.; Kovacs, D.; Borbas, K.E. Synthesis and photophysical characterization of luminescent lanthanide complexes of nucleotide-functionalized cyclen- and dipicolinate-based ligands. Inorg. Chim. Acta 2017, 460, 148–158. [Google Scholar] [CrossRef]
- Borbas, K.E.; Bruce, J.I. Synthesis of asymmetrically substituted cyclen-based ligands for the controlled sensitization of lanthanides. Org. Biomol. Chem. 2007, 5, 2274–2282. [Google Scholar] [CrossRef]
- Nielsen, L.G.; Sørensen, T.J. Including and Declaring Structural Fluctuations in the Study of Lanthanide(III) Coordination Chemistry in Solution. Inorg. Chem. 2020, 59, 94–105. [Google Scholar] [CrossRef]
- Mani, T.; Tircsó, G.; Zhao, P.; Sherry, A.D.; Woods, M. Effect of the Regiochemistry of Butyl Amide Substituents on the Solution-State Structures of Lanthanide(III) DOTA-Tetraamide Complexes. Inorg. Chem. 2009, 48, 10338–10345. [Google Scholar] [CrossRef]
- Blackburn, O.A.; Routledge, J.D.; Jennings, L.B.; Rees, N.H.; Kenwright, A.M.; Beer, P.D.; Faulkner, S. Substituent effects on fluoride binding by lanthanide complexes of DOTA-tetraamides. Dalton Trans. 2016, 45, 3070–3077. [Google Scholar] [CrossRef] [PubMed]
- Hoeft, S.; Roth, K. Struktur und Dynamik von Lanthanoid-Tetraazacyclododecantetraacetat-(DOTA-)Komplexen in Lösung. Chem. Ber. 1993, 126, 869–873. [Google Scholar] [CrossRef]
- Jacques, V.; Desreux, J.F. Quantitative Two-Dimensional EXSY Spectroscopy and Dynamic Behavior of a Paramagnetic Lanthanide Macrocyclic Chelate: YbDOTA(DOTA = 1,4,7,10-Tetraazacyclododecane-N,N′,N″,N‴-tetraacetic Acid). Inorg. Chem. 1994, 33, 4048–4053. [Google Scholar] [CrossRef]
- Cotton, S. The Lanthanides—Principles and Energetics. In Lanthanide and Actinide Chemistry; John Wiley & Sons, Ltd.: Hoboken, NJ, USA, 2006; pp. 9–22. [Google Scholar]
- Parker, D.; Williams, J.A.G. Modest effectiveness of carbostyril 124 as a sensitizing chromophore in europium and terbium amide complexes based on 1,4,7,10-tetraazacyclododecane. J. Chem. Soc. Perkin Trans. 1996, 2, 1581–1586. [Google Scholar] [CrossRef]
- Kovacs, D.; Borbas, K.E. The role of photoinduced electron transfer in the quenching of sensitized Europium emission. Coord. Chem. Rev. 2018, 364, 1–9. [Google Scholar] [CrossRef]
- Gamage, N.-D.H.; Mei, Y.; Garcia, J.; Allen, M.J. Oxidatively Stable, Aqueous Europium(II) Complexes through Steric and Electronic Manipulation of Cryptand Coordination Chemistry. Angew. Chem. Int. Ed. 2010, 49, 8923–8925. [Google Scholar] [CrossRef]
- Burai, L.; Tóth, É.; Moreau, G.; Sour, A.; Scopelliti, R.; Merbach, A.E. Novel Macrocyclic EuII Complexes: Fast Water Exchange Related to an Extreme M—Owater Distance. Chem. A Eur. J. 2003, 9, 1394–1404. [Google Scholar] [CrossRef]
- Burai, L.; Scopelliti, R.; Tóth, É. EuII-cryptate with optimal water exchange and electronic relaxation: A synthon for potential pO2 responsive macromolecular MRI contrast agents. Chem. Commun. 2002, 20, 2366–2367. [Google Scholar] [CrossRef]
- Tóth, É.; Burai, L.; Merbach, A.E. Similarities and differences between the isoelectronic GdIII and EuII complexes with regard to MRI contrast agent applications. Coord. Chem. Rev. 2001, 216–217, 363–382. [Google Scholar]
- Burai, L.; Tóth, É.; Seibig, S.; Scopelliti, R.; Merbach, A.E. Solution and Solid-State Characterization of EuII Chelates: A Possible Route Towards Redox Responsive MRI Contrast Agents. Chem. A Eur. J. 2000, 6, 3761–3770. [Google Scholar] [CrossRef]
- Kovacs, D.; Mathieu, E.; Kiraev, S.R.; Wells, J.A.L.; Demeyere, E.; Sipos, A.; Borbas, K.E. Coordination Environment-Controlled Photoinduced Electron Transfer Quenching in Luminescent Europium Complexes. J. Am. Chem. Soc. 2020, 142, 13190–13200. [Google Scholar] [CrossRef] [PubMed]
- Carnall, W.T.; Crosswhite, H.; Crosswhite, H.M. Energy Level Structure and Transition Probabilities in the Spectra of the Trivalent Lanthanides in LaF3; ANL-78-XX-95; TRN: 79-005910 United States 10.2172/6417825 TRN: 79-005910 Dep. NTIS, PC A09/MF A01. ANL English; Argonne National Lab. (ANL): Argonne, IL, USA, 1978; 195p. [Google Scholar]
- Latva, M.; Takalo, H.; Mukkala, V.-M.; Matachescu, C.; Rodriguez-Ubis, J.C.; Kankare, J. Correlation between the lowest triplet state energy level of the ligand and lanthanide(III) luminescence quantum yield. J. Lumin. 1997, 75, 149–169. [Google Scholar] [CrossRef]
- Suzuki, K.; Kobayashi, A.; Kaneko, S.; Takehira, K.; Yoshihara, T.; Ishida, H.; Shiina, Y.; Oishi, S.; Tobita, S. Reevaluation of absolute luminescence quantum yields of standard solutions using a spectrometer with an integrating sphere and a back-thinned CCD detector. Phys. Chem. Chem. Phys. 2009, 11, 9850–9860. [Google Scholar] [CrossRef] [PubMed]
- Horrocks, W.D.; Sudnick, D.R. Lanthanide ion luminescence probes of the structure of biological macromolecules. Acc. Chem. Res. 1981, 14, 384–392. [Google Scholar] [CrossRef]
- Binnemans, K. Interpretation of europium(III) spectra. Coord. Chem. Rev. 2015, 295, 1–45. [Google Scholar] [CrossRef]
- Werts, M.H.V.; Jukes, R.T.F.; Verhoeven, J.W. The emission spectrum and the radiative lifetime of Eu3+ in luminescent lanthanide complexes. Phys. Chem. Chem. Phys. 2002, 4, 1542–1548. [Google Scholar] [CrossRef]
- Harvey, A.H.; Gallagher, J.S.; Sengers, J.M.H.L. Revised Formulation for the Refractive Index of Water and Steam as a Function of Wavelength, Temperature and Density. J. Phys. Chem. Ref. Data 1998, 27, 761–774. [Google Scholar] [CrossRef]
- Odhner, H.; Jacobs, D.T. Refractive Index of Liquid D2O for Visible Wavelengths. J. Chem. Eng. Data 2012, 57, 166–168. [Google Scholar] [CrossRef]
- Connelly, N.G.; Geiger, W.E. Chemical Redox Agents for Organometallic Chemistry. Chem. Rev. 1996, 96, 877–910. [Google Scholar] [CrossRef]
Sample Availability: Samples of the compounds LnL2dCou (Ln = La, Lu—15 mg, Ln = Sm, Gd, Tb—10 mg, Ln = Eu, Yb—20 mg) are available from the authors. |


| Compound | E1/2[b] | Epa[b] | Epc[b] | ΔE [b] |
|---|---|---|---|---|
| EuCl3 | −384 | −337 | −431 | 94 |
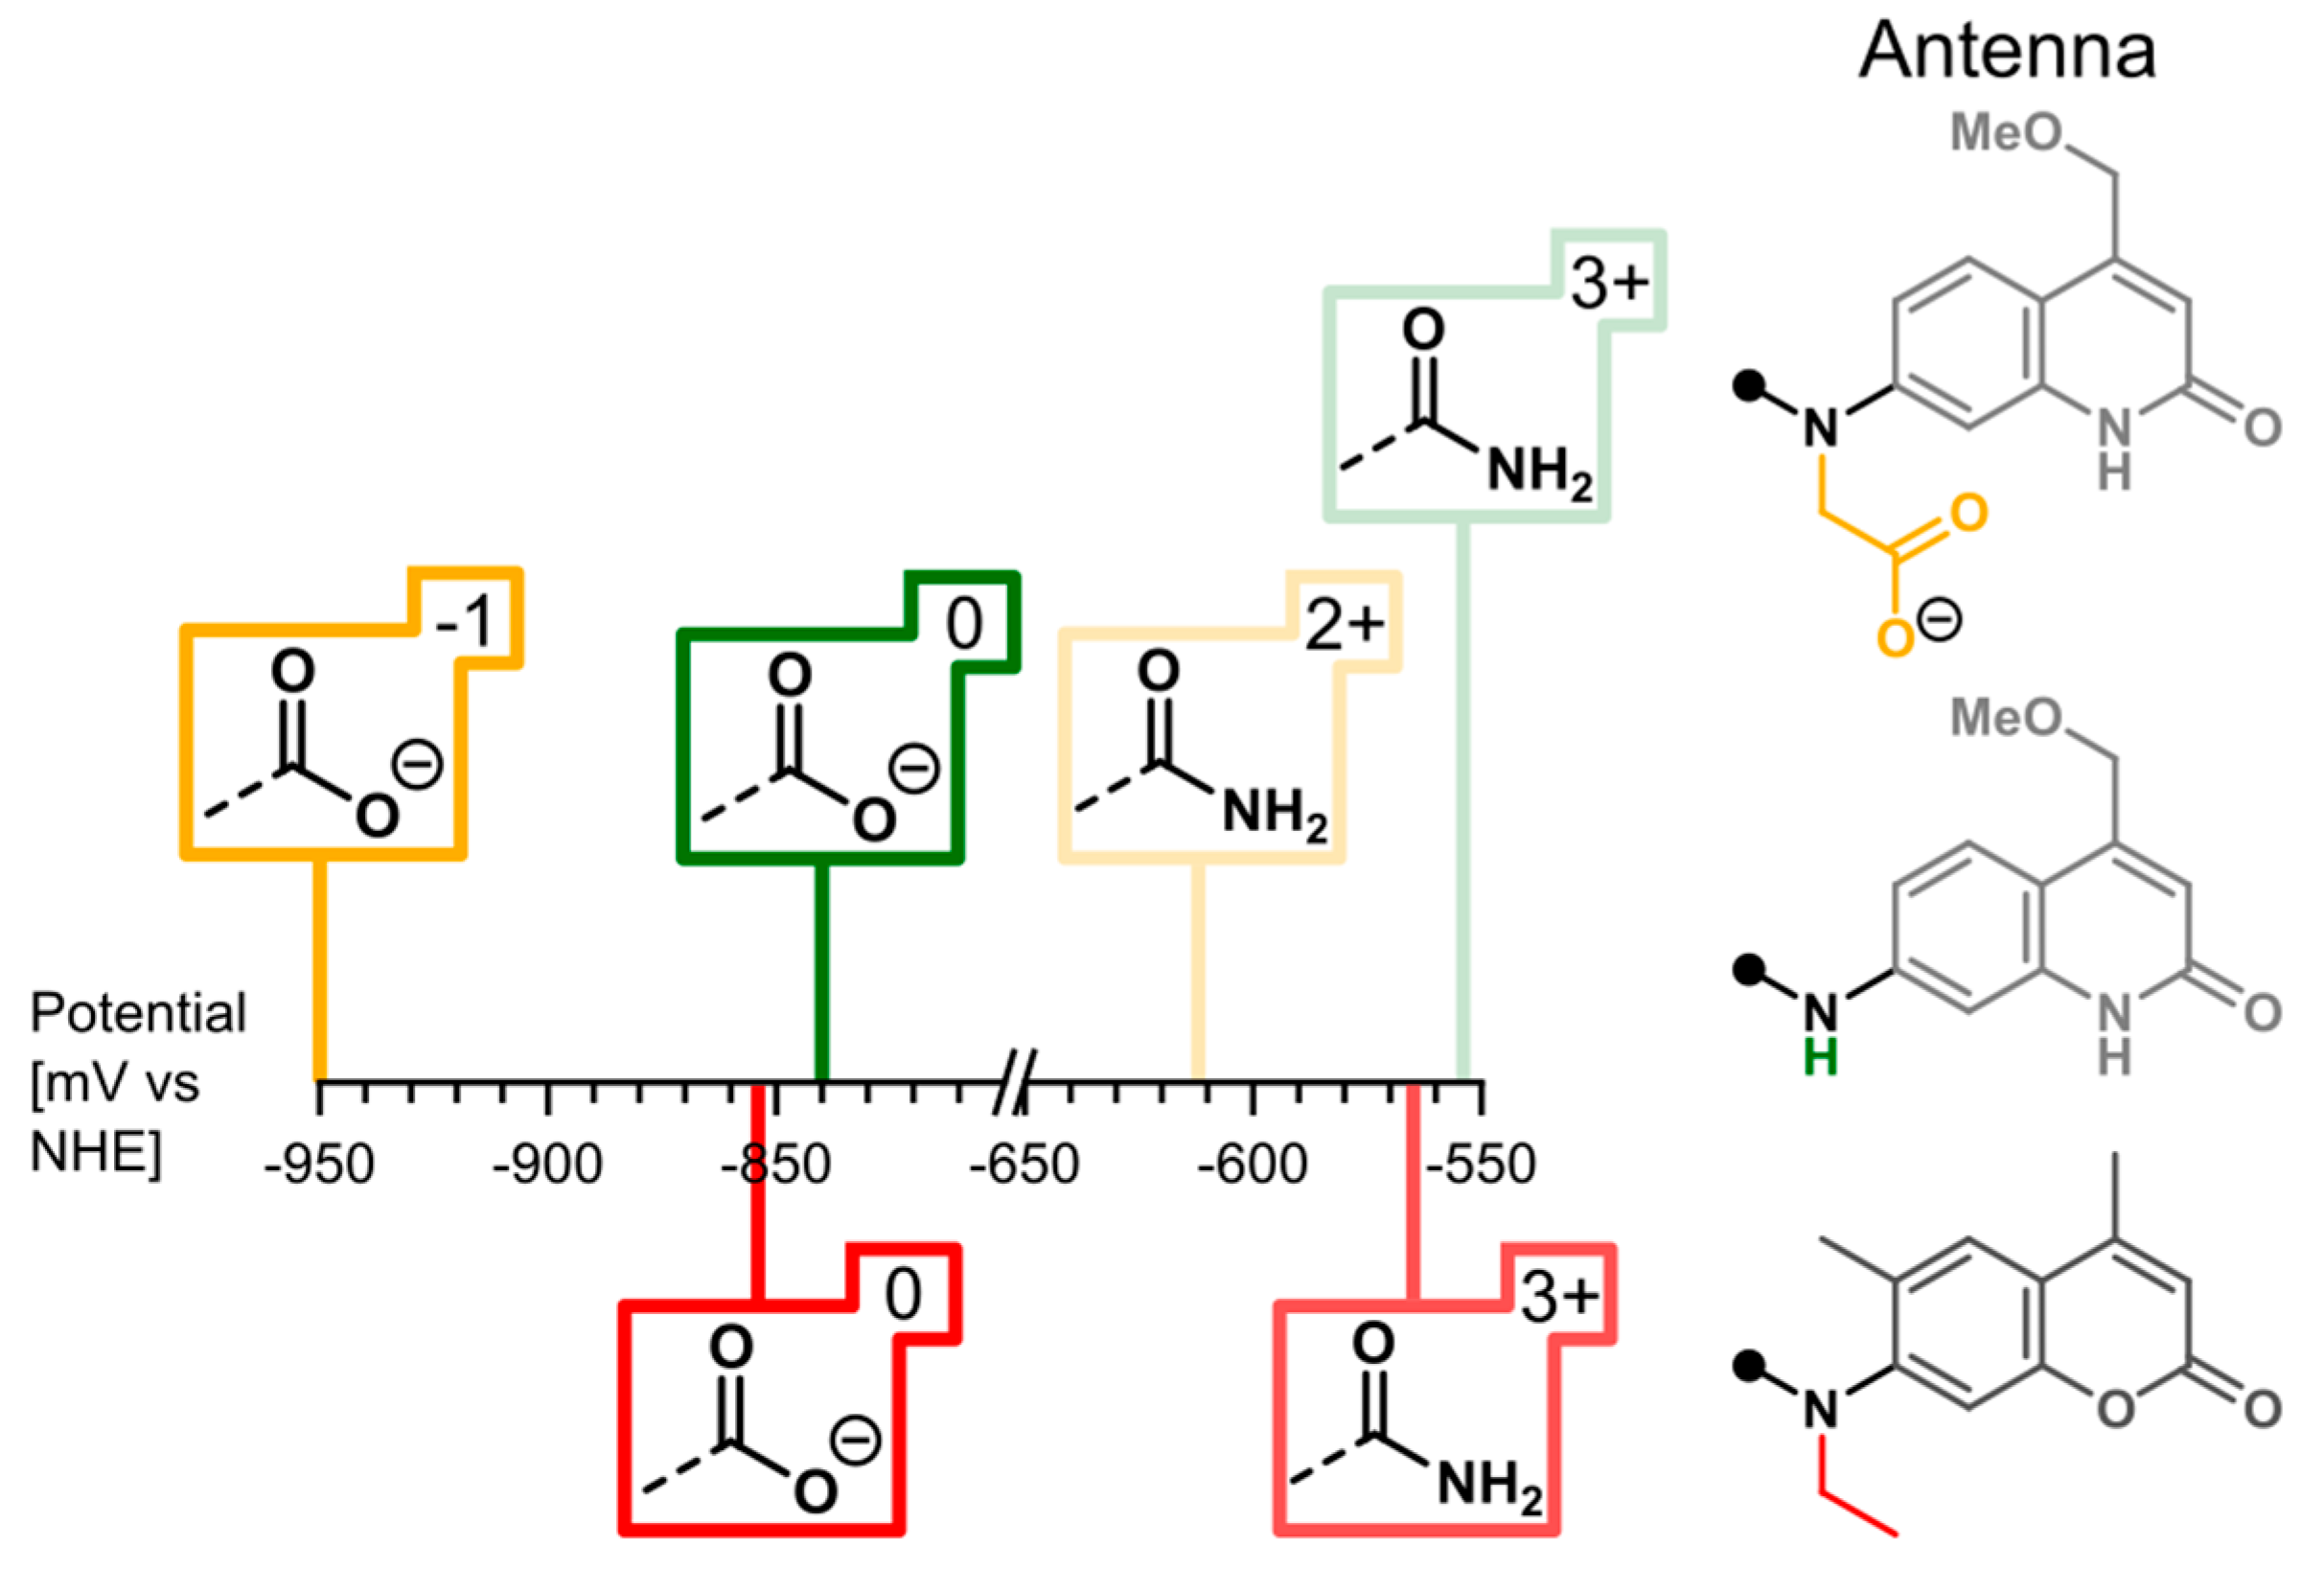
| EuL1aCar | −948 (–839 [c]) | −766 | −1131 | 365 |
| EuL2aCar | −612 (–554 [d]) | −437 | −787 | 350 |
| EuL2cCar | −564 | −437 | −691 | 254 |
| EuL1dCou | −854 | −744 | −965 | 221 |
| EuL2dCou | −565 | −512 | −617 | 105 |
| Complex | ΦL [%] [a] | ΦLn [%] [a] | τH2O [ms] | τD2O [ms] | q[b] |
|---|---|---|---|---|---|
| LaL1aCar | 4.9 | - | - | - | - |
| SmL1aCar | 3.6 [c] | 0.19 [c] | 0.009 | 0.032 | - |
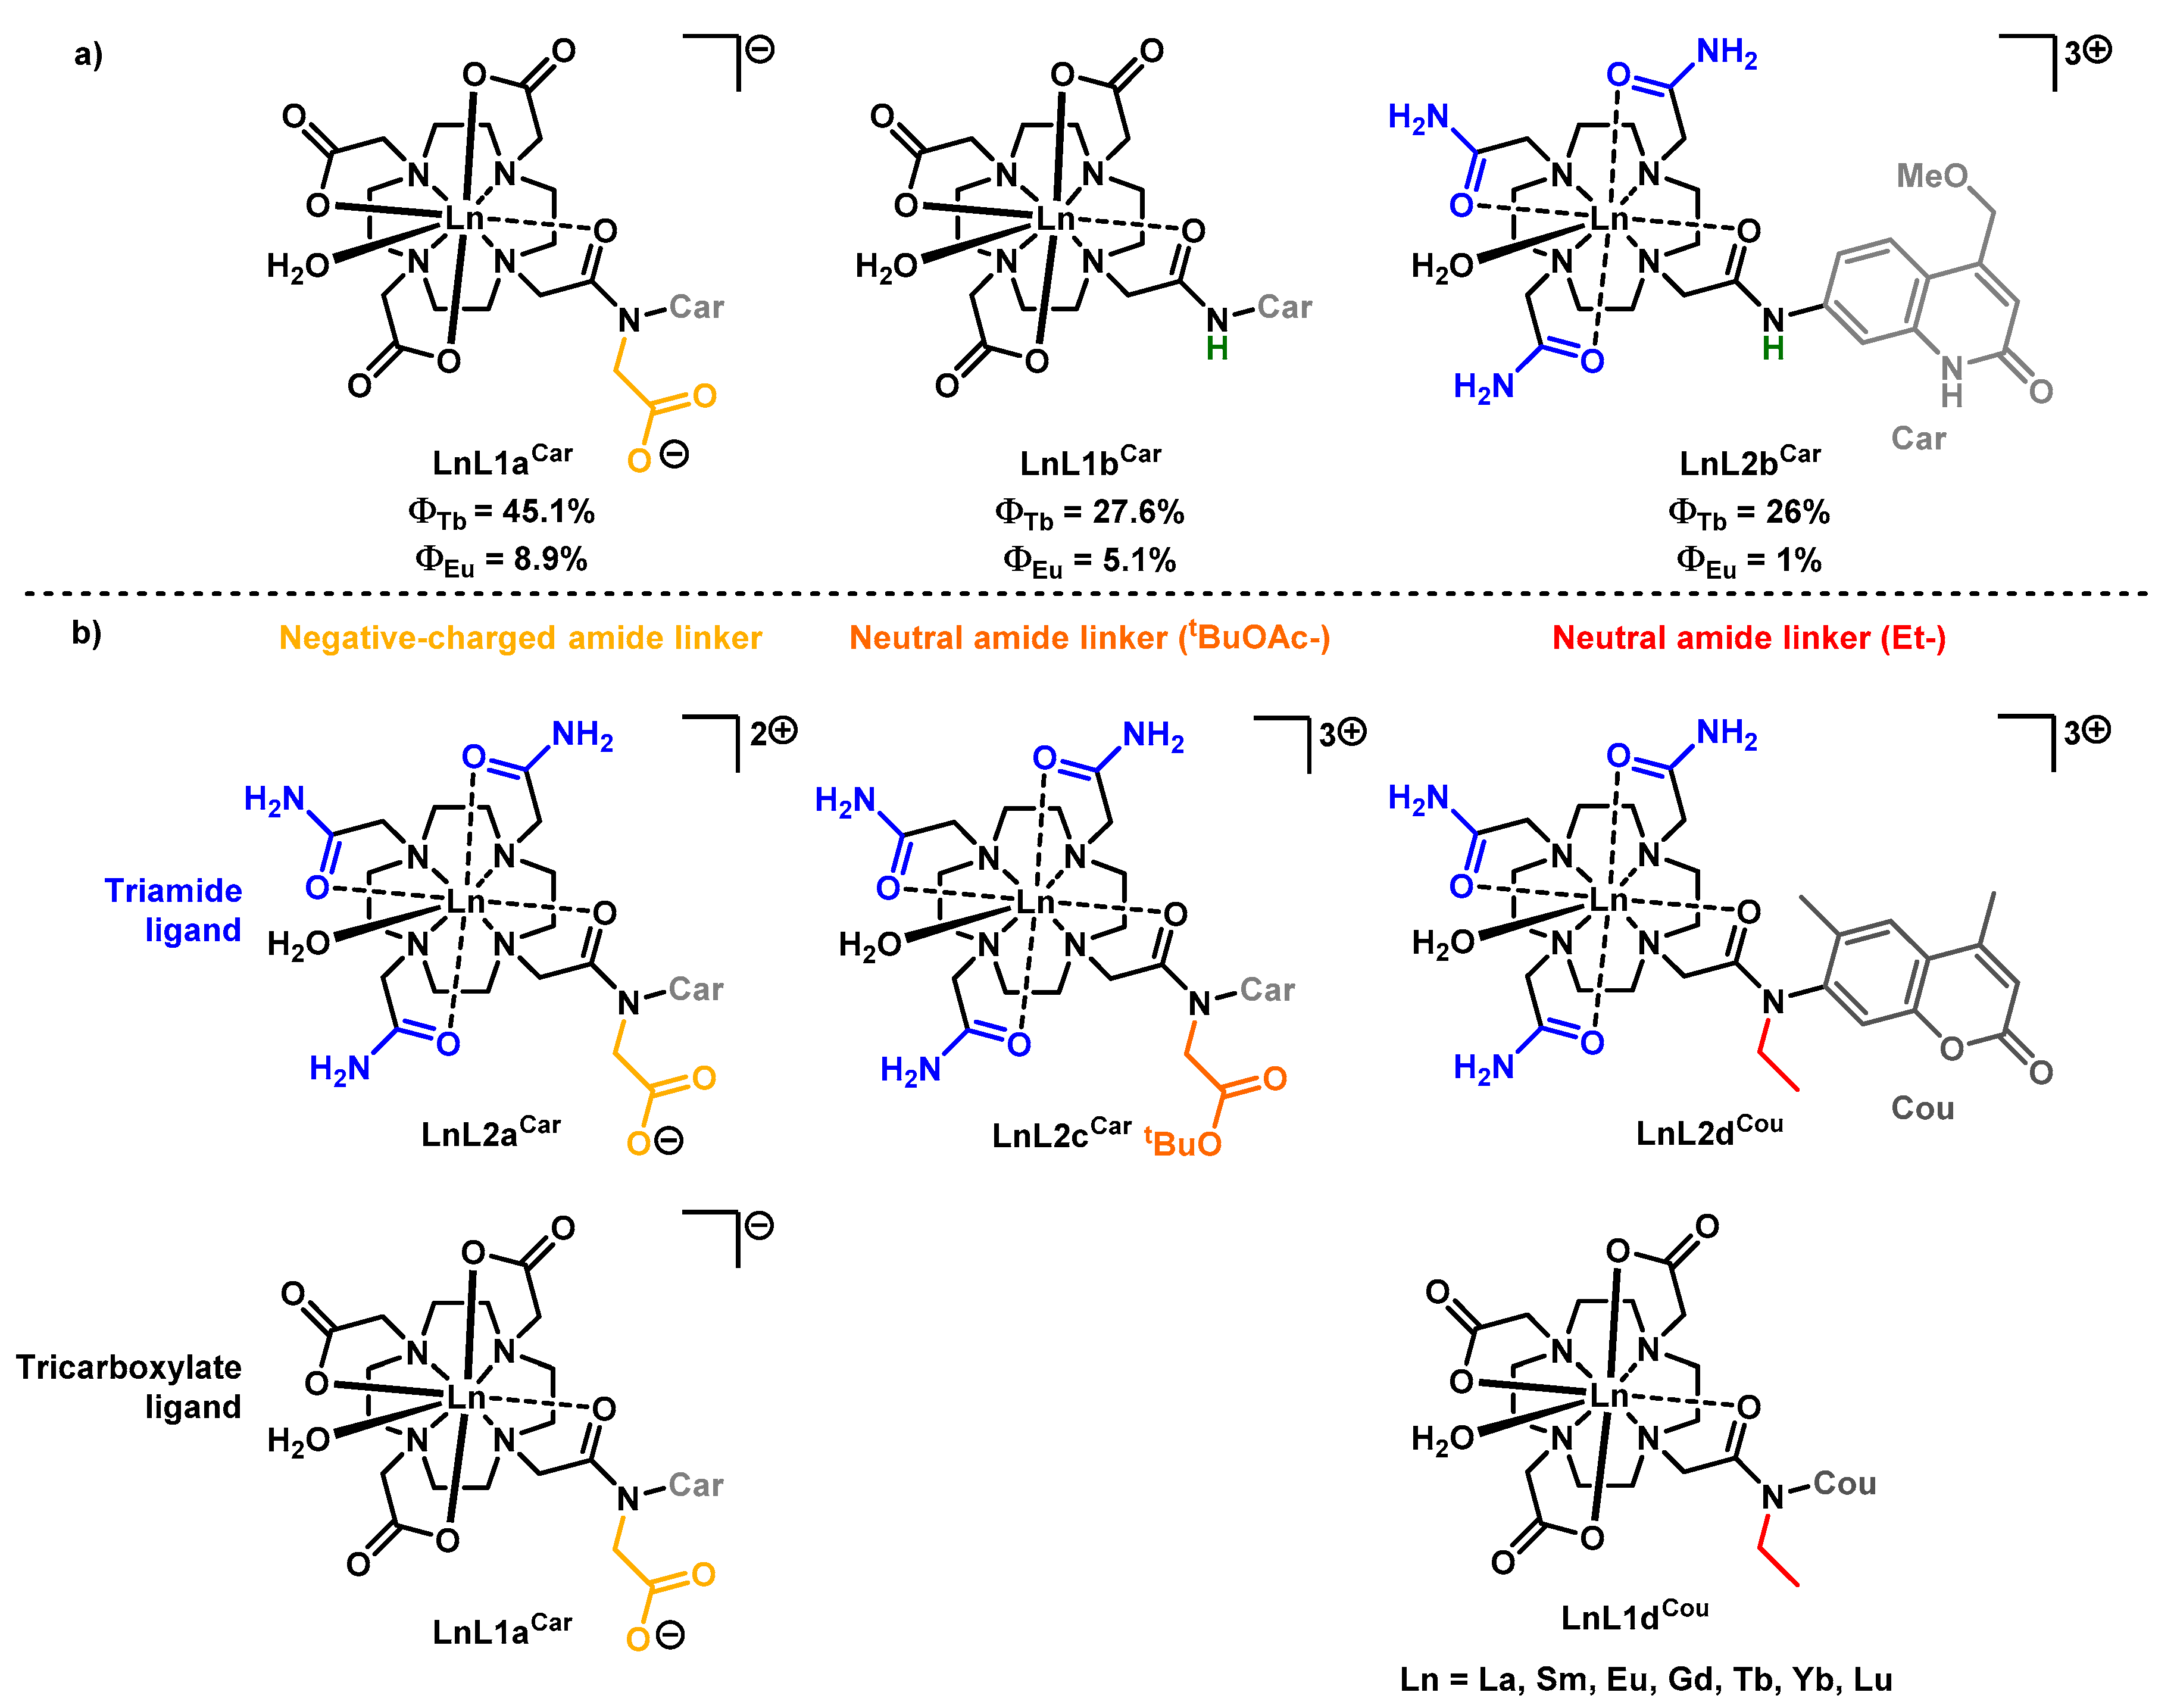
| EuL1aCar[d] | 2.5 | 8.9 | 0.66 | 2.17 | 1.0 |
| GdL1aCar[d] | 5.1 | - | - | - | - |
| TbL1aCar[d] | 4.5 | 45.1 | 1.81 | 2.92 | 0.8 |
| YbL1aCar | 4.5 | - | - | - | - |
| LuL1aCar | 4.7 | - | - | - | - |
| LaL2aCar | 4.1 | - | - | - | - |
| SmL2aCar | 3.4 [c] | 0.21 [c] | 0.010 | 0.032 | - |
| EuL2aCar | 0.77 [e] | 2.7 [e] | 0.51 | 2.05 | 0.9 |
| GdL2aCar | 4.3 [c] | - | - | - | - |
| TbL2aCar | 4.1 | 36.6 | 1.50 | 2.70 | 1.2 |
| YbL2aCar | 4.3 | - | - | - | - |
| LuL2aCar | 4.5 | - | - | - | - |
| LaL1dCou | 0.66 | - | - | - | - |
| SmL1dCou | 0.64 [c] | 0.059 [c] | 0.010 | 0.031 | - |
| EuL1dCou | 0.62 [e] | 2.2 [e] | 0.62 | 1.96 | 1.0 |
| GdL1dCou | 0.66 [c] | - | - | - | - |
| TbL1dCou | 0.62 | 1.7 | 0.47 | 0.61 | - |
| YbL1dCou | 0.66 | - | - | - | - |
| LuL1dCou | 0.64 | - | - | - | - |
| LaL2dCou | 0.66 | - | - | - | - |
| SmL2dCou | 0.64 [c] | 0.067 [c] | 0.012 | 0.032 | - |
| EuL2dCou | 0.58 [e] | 1.5 [e] | 0.54 | 2.01 | 0.8 |
| GdL2dCou | 0.63 [c] | - | - | - | - |
| TbL2dCou | 0.67 | 1.0 | 0.29 | 0.45 | - |
| YbL2dCou | 0.57 | - | - | - | - |
| LuL2dCou | 0.61 | - | - | - | - |
| Complex | τrad,Ln[b] | ηsens[c] | ΦL,D2O[d] | ΦLn,D2O[d] | τrad,Ln (D2O) [e] | ηsens (D2O) [f] | ||
|---|---|---|---|---|---|---|---|---|
| EuL1aCar | 5.36 | 12.2 | 72.8 | 2.6 (1.04) | 32.3 (3.6) | 5.39 | 40.3 (3.30) | 80.3 (1.10) |
| EuL2aCar | 5.11 | 10.0 | 27.6 | 0.83 (1.08) | 11.8 (4.2) | 5.16 | 39.7 (3.97) | 29.8 (1.08) |
| EuL1dCou | 5.26 | 11.8 | 17.6 | 0.66 (1.10) | 8.5 (4.0) | 5.31 | 36.9 (3.15) | 23.0 (1.30) |
| EuL2dCou | 5.03 | 10.7 | 14.1 | 0.60 (1.03) | 6.3 (4.2) | 5.11 | 39.3 (3.67) | 16.0 (1.14) |
| Complex | ΦL [%] [b] | ΦLn [%] [b] | τrad,Ln[c] | τobs [ms] | ηsens[e] | |
|---|---|---|---|---|---|---|
| EuL1aCar-F | 2.5 | 9.5 (×1.07) | 5.33 | 0.68 | 12.8 (×1.05) | 73.4 (1.01) |
| EuL2aCar-F | 2.1 (×2.73) | 12.3 (×4.56) | 4.86 | 1.01 | 20.7 (×2.07) | 58.9 (2.13) |
| EuL1dCou-F | 0.64 (×1.03) | 2.3 (×1.10) | 5.19 | 0.69 | 13.3 (×1.14) | 17.3 (0.98) |
| EuL2dCou-F | 0.65 (×1.12) | 3.3 (×2.20) | 4.81 | 1.01 | 21.0 (×1.96) | 15.7 (1.12) |
| Complex | ΦL [%] [b] | ΦLn [%] [b] | τrad,Ln[c] | τobs [ms] | ηsens[e] | |
|---|---|---|---|---|---|---|
| EuL1aCar-F | 2.6 (1.04) | 32.3 (3.4) | 5.38 | 2.29 | 42.6 (3.33) | 75.7 (1.03) |
| EuL2aCar-F | 2.2 (1.05) | 31.3 (2.6) | 4.89 | 2.40 | 49.1 (2.37) | 63.7 (1.08) |
| EuL1dCou-F | 0.67 (1.06) | 8.2 (3.6) | 5.29 | 2.25 | 42.6 (3.20) | 19.2 (1.11) |
| EuL2dCou-F | 0.69 (1.08) | 8.7 (2.6) | 4.88 | 2.39 | 48.9 (2.33) | 17.8 (1.13) |
Publisher’s Note: MDPI stays neutral with regard to jurisdictional claims in published maps and institutional affiliations. |
© 2020 by the authors. Licensee MDPI, Basel, Switzerland. This article is an open access article distributed under the terms and conditions of the Creative Commons Attribution (CC BY) license (http://creativecommons.org/licenses/by/4.0/).
Share and Cite
Kiraev, S.R.; Mathieu, E.; Siemens, F.; Kovacs, D.; Demeyere, E.; Borbas, K.E. Lanthanide(III) Complexes of Cyclen Triacetates and Triamides Bearing Tertiary Amide-Linked Antennae. Molecules 2020, 25, 5282. https://doi.org/10.3390/molecules25225282
Kiraev SR, Mathieu E, Siemens F, Kovacs D, Demeyere E, Borbas KE. Lanthanide(III) Complexes of Cyclen Triacetates and Triamides Bearing Tertiary Amide-Linked Antennae. Molecules. 2020; 25(22):5282. https://doi.org/10.3390/molecules25225282
Chicago/Turabian StyleKiraev, Salauat R., Emilie Mathieu, Fiona Siemens, Daniel Kovacs, Ellen Demeyere, and K. Eszter Borbas. 2020. "Lanthanide(III) Complexes of Cyclen Triacetates and Triamides Bearing Tertiary Amide-Linked Antennae" Molecules 25, no. 22: 5282. https://doi.org/10.3390/molecules25225282
APA StyleKiraev, S. R., Mathieu, E., Siemens, F., Kovacs, D., Demeyere, E., & Borbas, K. E. (2020). Lanthanide(III) Complexes of Cyclen Triacetates and Triamides Bearing Tertiary Amide-Linked Antennae. Molecules, 25(22), 5282. https://doi.org/10.3390/molecules25225282