Development of an LC-MS Targeted Metabolomics Methodology to Study Proline Metabolism in Mammalian Cell Cultures

 , , , , , and
Abstract
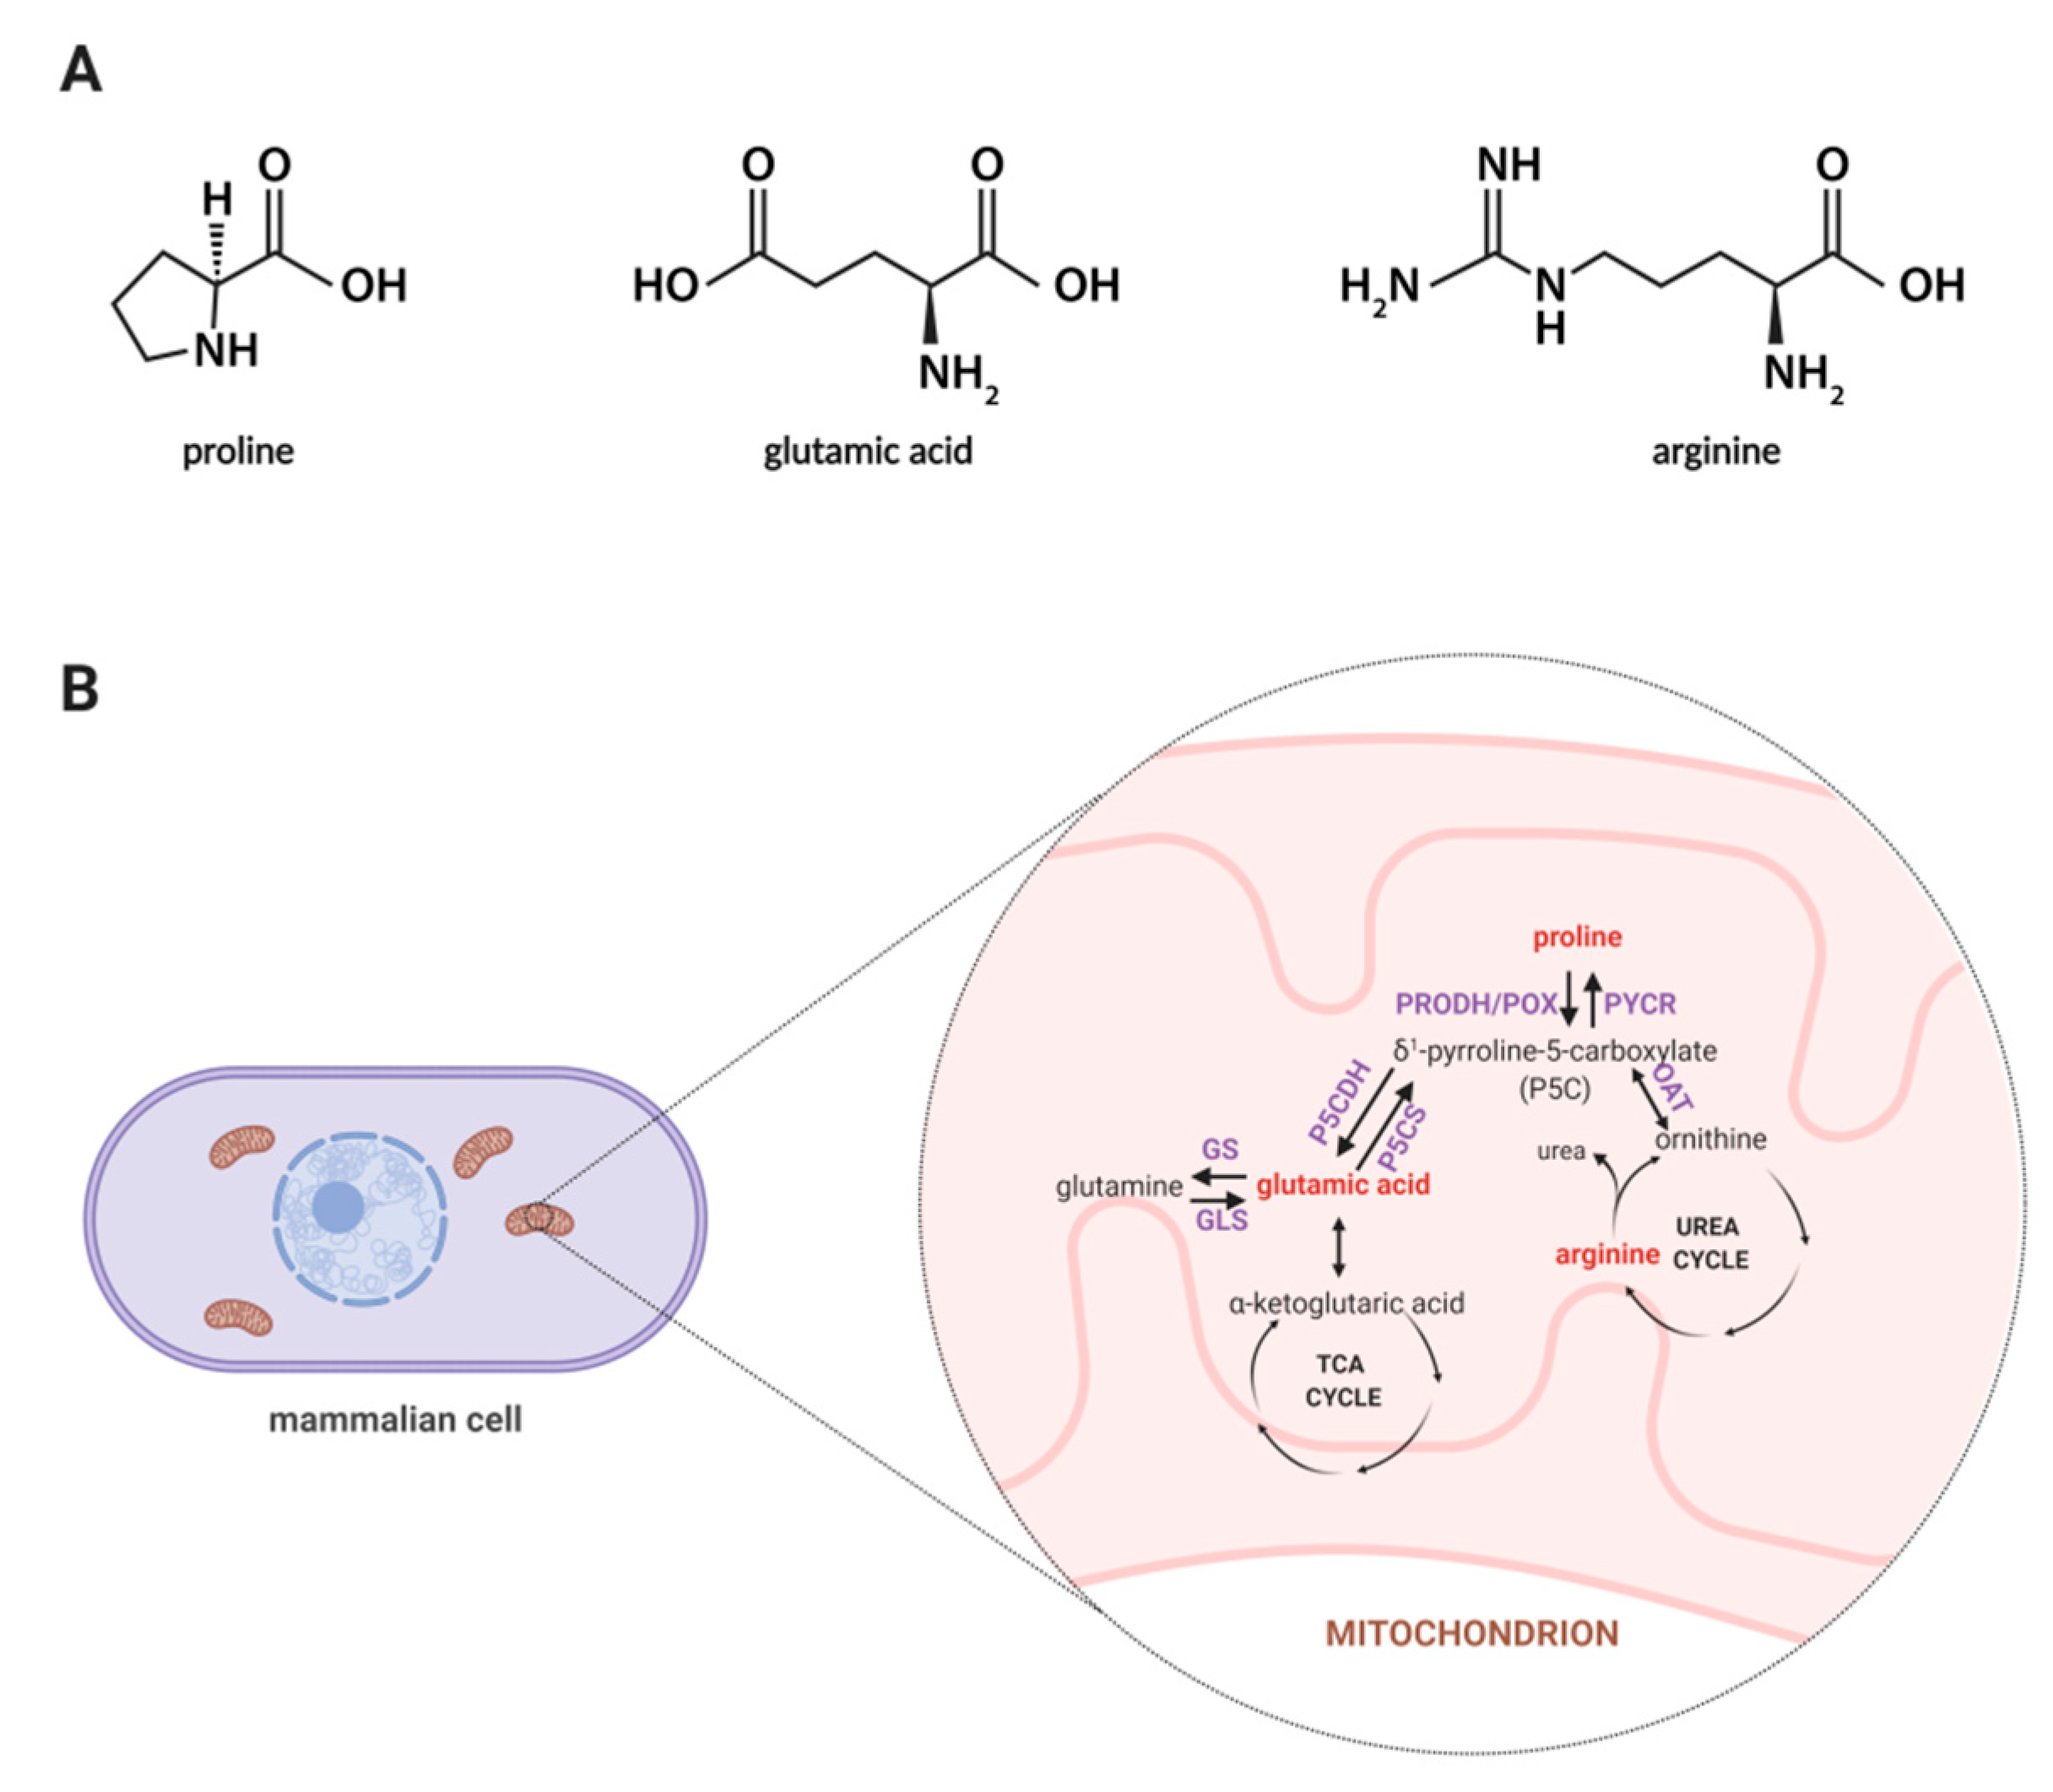
1. Introduction
2. Results and Discussion
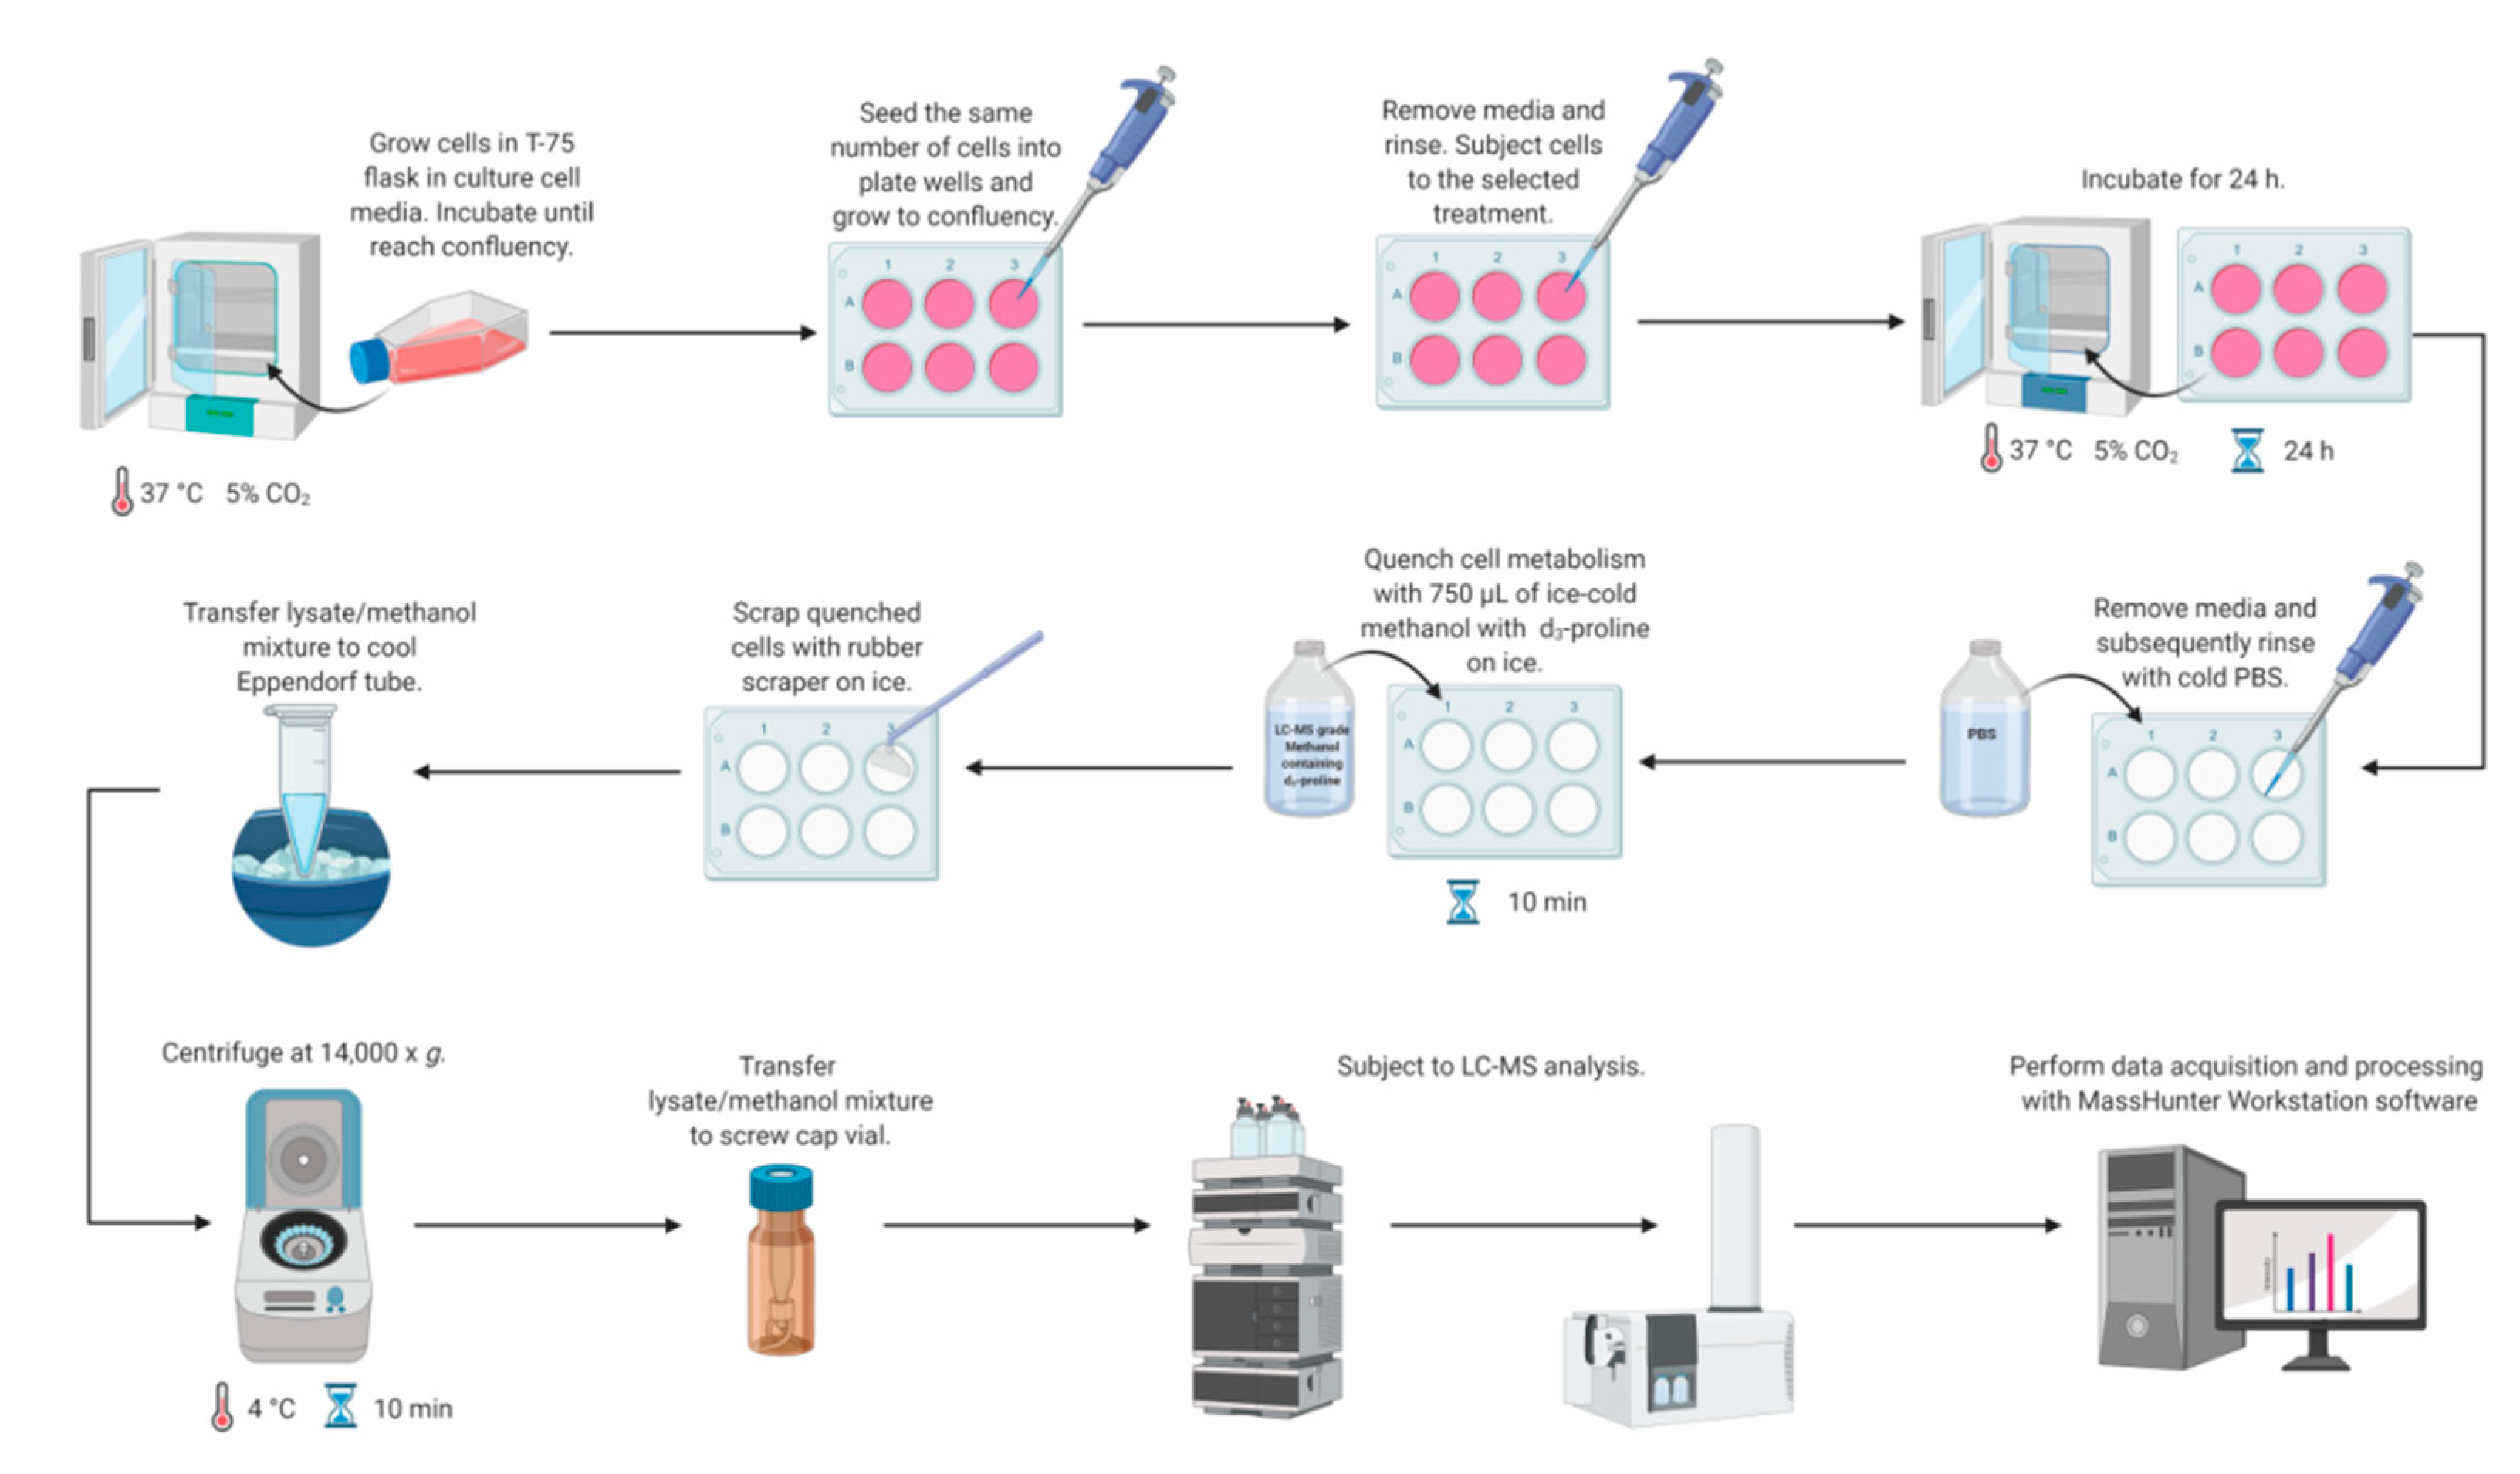
2.1. Sample Preparation Method Development
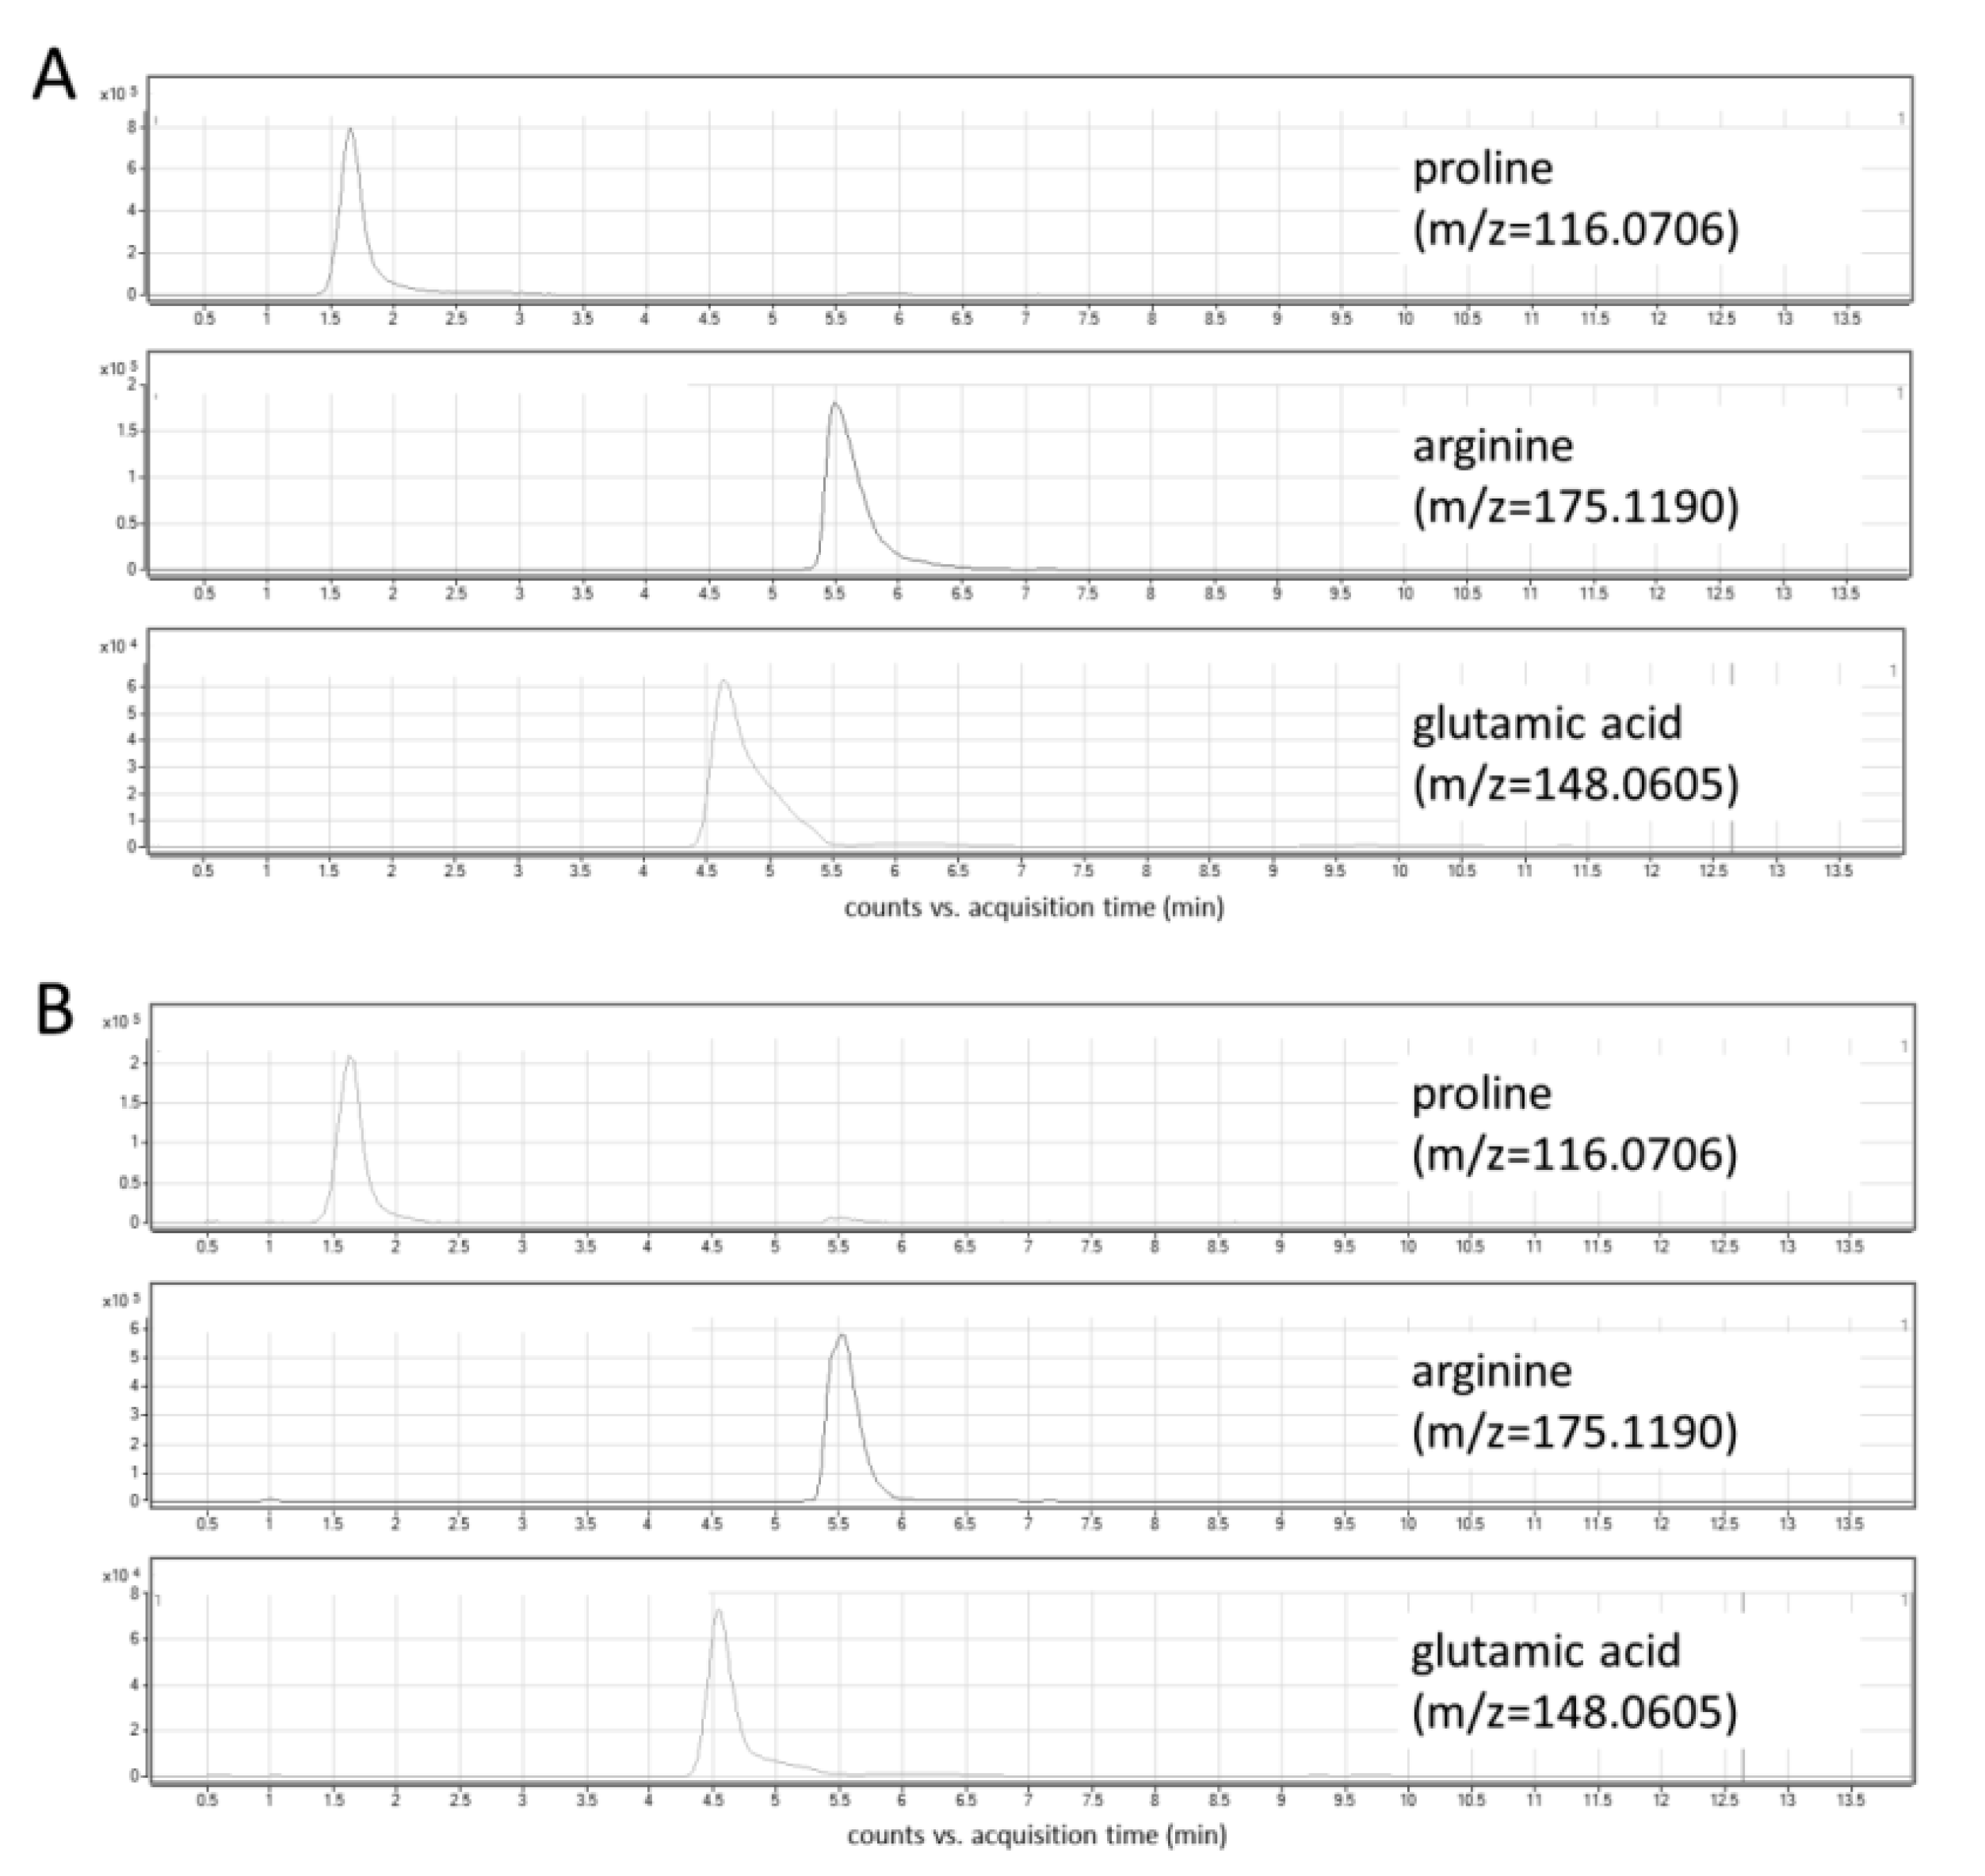
2.2. LC-MS Method Development
2.3. Method Validation
2.4. Application to Real Samples
3. Materials and Methods
3.1. Reagents
3.2. Preparation of Standard Solutions
3.3. Cell Culture
3.4. Quenching and Extraction
3.5. Instrumentation and Conditions
3.6. Method Validation
Supplementary Materials
Author Contributions
Funding
Acknowledgments
Conflicts of Interest
References
- Zhang, A.; Sun, H.; Xu, H.; Qiu, S.; Wang, X. Cell Metabolomics. Omics 2013, 17, 495–501. [Google Scholar] [CrossRef] [PubMed]
- Sims, J.K.; Manteiga, S.; Lee, K. Towards high resolution analysis of metabolic flux in cells and tissues. Curr. Opin. Biotechnol. 2013, 24, 933–939. [Google Scholar] [CrossRef] [PubMed][Green Version]
- Balcke, G.; Kolle, S.; Kamp, H.; Bethan, B.; Looser, R.; Wagner, S.; Landsiedel, R.; Van Ravenzwaay, B. Linking energy metabolism to dysfunctions in mitochondrial respiration—A metabolomics in vitro approach. Toxicol. Lett. 2011, 203, 200–209. [Google Scholar] [CrossRef] [PubMed]
- Van Vliet, E.; Morath, S.; Eskes, C.; Linge, J.P.; Rappsilber, J.; Honegger, P.; Hartung, T.; Coecke, S. A novel in vitro metabolomics approach for neurotoxicity testing, proof of principle for methyl mercury chloride and caffeine. Neuro Toxicol. 2008, 29, 1–12. [Google Scholar] [CrossRef]
- Kleinstreuer, N.C.; Smith, A.; West, P.; Conard, K.; Fontaine, B.; Weir-Hauptman, A.; Palmer, J.A.; Knudsen, T.; Dix, D.; Donley, E.; et al. Identifying developmental toxicity pathways for a subset of ToxCast chemicals using human embryonic stem cells and metabolomics. Toxicol. Appl. Pharmacol. 2011, 257, 111–121. [Google Scholar] [CrossRef]
- Cañaveras, J.C.G.; Castell, J.V.; Donato, M.T.; Lahoz, A. A metabolomics cell-based approach for anticipating and investigating drug-induced liver injury. Sci. Rep. 2016, 6, 27239. [Google Scholar] [CrossRef]
- Bai, J.; Wang, M.X.; Chowbay, B.; Ching, C.B.; Chen, W.N. Metabolic profiling of HepG2 cells incubated with S(−) and R(+) enantiomers of anti-coagulating drug warfarin. Metabolomics 2011, 7, 353–362. [Google Scholar] [CrossRef]
- Wang, M.; Bai, J.; Chen, W.N.; Ching, C.B. Metabolomic Profiling of Cellular Responses to Carvedilol Enantiomers in Vascular Smooth Muscle Cells. PLoS ONE 2010, 5, e15441. [Google Scholar] [CrossRef]
- Chen, Y.; Chen, Z.; Feng, J.; Chen, Y.-B.; Liao, N.-S.; Su, Y.; Zou, C.-Y. Metabolic profiling of normal hepatocyte and hepatocellular carcinoma cells via 1 H nuclear magnetic resonance spectroscopy. Cell Biol. Int. 2018, 42, 425–434. [Google Scholar] [CrossRef]
- Semreen, M.H.; Alniss, H.; Cacciatore, S.; El-Awady, R.; Mousa, M.; Almehdi, A.M.; El-Huneidi, W.; Zerbini, L.; Soares, N.C. GC–MS based comparative metabolomic analysis of MCF-7 and MDA-MB-231 cancer cells treated with Tamoxifen and/or Paclitaxel. J. Proteom. 2020, 225, 103875. [Google Scholar] [CrossRef]
- Celińska-Janowicz, K.; Zaręba, I.; Lazarek, U.; Teul, J.; Tomczyk, M.; Pałka, J.; Miltyk, W. Constituents of Propolis: Chrysin, Caffeic Acid, p-Coumaric Acid, and Ferulic Acid Induce PRODH/POX-Dependent Apoptosis in Human Tongue Squamous Cell Carcinoma Cell (CAL-27). Front. Pharmacol. 2018, 9, 336. [Google Scholar] [CrossRef] [PubMed]
- Seo, S.-H.; Jo, J.K.; Kim, E.-J.; Park, S.-E.; Shin, S.Y.; Park, K.-M.; Son, H.-S. Metabolomics Reveals the Alteration of Metabolic Pathway by Alpha-Melanocyte-Stimulating Hormone in B16F10 Melanoma Cells. Molecules 2020, 25, 3384. [Google Scholar] [CrossRef]
- Chong, W.P.K.; Thng, S.H.; Hiu, A.P.; Lee, D.-Y.; Chan, E.C.Y.; Ho, Y.S. LC-MS-based metabolic characterization of high monoclonal antibody-producing Chinese hamster ovary cells. Biotechnol. Bioeng. 2012, 109, 3103–3111. [Google Scholar] [CrossRef] [PubMed]
- Hayton, S.; Maker, G.L.; Mullaney, I.; Trengove, R.D. Experimental design and reporting standards for metabolomics studies of mammalian cell lines. Cell. Mol. Life Sci. 2017, 74, 4421–4441. [Google Scholar] [CrossRef]
- León, Z.; García-Cañaveras, J.C.; Donato, M.T.; Lahoz, A. Mammalian cell metabolomics: Experimental design and sample preparation. Electrophoresis 2013, 34, 2762–2775. [Google Scholar] [CrossRef] [PubMed]
- Cuperlovic-Culf, M.; Barnett, D.A.; Culf, A.S.; Chute, I. Cell culture metabolomics: Applications and future directions. Drug Discov. Today 2010, 15, 610–621. [Google Scholar] [CrossRef]
- Kapoore, R.V.; Vaidyanathan, S. Towards quantitative mass spectrometry-based metabolomics in microbial and mammalian systems. Philos. Trans. R. Soc. A Math. Phys. Eng. Sci. 2016, 374, 20150363. [Google Scholar] [CrossRef]
- Cambeiro-Pérez, N.; Hidalgo-Cantabrana, C.; Moro-García, M.A.; Alonso-Arias, R.; Simal-Gándara, J.; Sánchez, B.; Martínez-Carballo, E. A Metabolomics Approach Reveals Immunomodulatory Effects of Proteinaceous Molecules Derived from Gut Bacteria over Human Peripheral Blood Mononuclear Cells. Front. Microbiol. 2018, 9, 2701. [Google Scholar] [CrossRef]
- Jin, C.; Liu, Y.; Sun, L.; Chen, T.; Zhang, Y.; Zhao, A.; Wang, X.; Cristau, M.; Wang, K.; Jia, W. Metabolic profiling reveals disorder of carbohydrate metabolism in mouse fibroblast cells induced by titanium dioxide nanoparticles. J. Appl. Toxicol. 2012, 33, 1442–1450. [Google Scholar] [CrossRef]
- Yu, Z.; Huang, M.; Clowers, B.H. Comparative metabolite profiling of a metastatic and primary melanoma cell line using untargeted metabolomics: A case study. Clin. Mass Spectrom. 2018, 10, 16–24. [Google Scholar] [CrossRef]
- Alghamdi, A.A.; Mohammed, M.R.S.; Zamzami, M.A.; Al-Malki, A.L.; Qari, M.H.; Khan, M.I.; Choudhry, H. Untargeted Metabolomics Identifies Key Metabolic Pathways Altered by Thymoquinone in Leukemic Cancer Cells. Nutrients 2020, 12, 1792. [Google Scholar] [CrossRef] [PubMed]
- Klupczynska, A.; Derezinski, P.; Kokot, Z.J. Metabolomics in medical sciences—Trends, challenges and perspectives. Acta Pol. Pharm. 2015, 72, 629–641. [Google Scholar] [PubMed]
- Zareba, I.; Palka, J. Prolidase-proline dehydrogenase/proline oxidase-collagen biosynthesis axis as a potential interface of apoptosis/autophagy. BioFactors 2016, 42, 341–348. [Google Scholar] [CrossRef] [PubMed]
- Misiura, M.; Miltyk, W. Current Understanding of the Emerging Role of Prolidase in Cellular Metabolism. Int. J. Mol. Sci. 2020, 21, 5906. [Google Scholar] [CrossRef]
- Albaugh, V.L.; Mukherjee, K.; Barbul, A. Proline Precursors and Collagen Synthesis: Biochemical Challenges of Nutrient Supplementation and Wound Healing. J. Nutr. 2017, 147, 2011–2017. [Google Scholar] [CrossRef]
- Surazynski, A.; Donald, S.P.; Cooper, S.K.; Whiteside, M.A.; Salnikow, K.; Liu, Y.; Phang, J.M. Extracellular matrix and HIF-1 signaling: The role of prolidase. Int. J. Cancer 2008, 122, 1435–1440. [Google Scholar] [CrossRef]
- Tanner, J.J.; Fendt, S.-M.; Becker, D.F. The Proline Cycle as a Potential Cancer Therapy Target. Biochemistry 2018, 57, 3433–3444. [Google Scholar] [CrossRef]
- Hanko, V.P.; Rohrer, J.S. Determination of amino acids in cell culture and fermentation broth media using anion-exchange chromatography with integrated pulsed amperometric detection. Anal. Biochem. 2004, 324, 29–38. [Google Scholar] [CrossRef]
- Ubhi, B.K.; Davenport, P.W.; Welch, M.; Riley, J.; Griffin, J.L.; Connor, S.C. Analysis of chloroformate-derivatised amino acids, dipeptides and polyamines by LC–MS/MS. J. Chromatogr. B Anal. Technol. Biomed. Life Sci. 2013, 934, 79–88. [Google Scholar] [CrossRef]
- Li, X.; Wong, C.C.; Tang, Z.; Wu, J.; Li, S.; Qian, Y.; Xu, J.; Yang, Z.; Shen, Y.; Yu, J.; et al. Determination of amino acids in colon cancer cells by using UHPLC-MS/MS and [U-13C5]-glutamine as the isotope tracer. Talanta 2017, 162, 285–292. [Google Scholar] [CrossRef]
- Li, J.; Wang, Q.-L.; Liu, Y.; Ke, Y.; Fan, Q.-Q.; Zhou, P.; An, M.-C.; Liu, H.-M. Simultaneous determination of 24 free amino acids in MGC803 cells by hydrophilic interaction liquid chromatography with tandem mass spectrometry. J. Chromatogr. B Anal. Technol. Biomed. Life Sci. 2019, 1132, 121792. [Google Scholar] [CrossRef] [PubMed]
- Zhu, B.; Li, L.; Wei, H.; Zhou, W.; Zhou, W.; Li, F.; Lin, P.; Sheng, J.; Wang, Q.; Yan, C.; et al. A simultaneously quantitative profiling method for 40 endogenous amino acids and derivatives in cell lines using hydrophilic interaction liquid chromatography coupled with tandem mass spectrometry. Talanta 2020, 207, 120256. [Google Scholar] [CrossRef] [PubMed]
- Gaudiano, M.C.; Valvo, L.; Rodomonte, A.L. A Q-TOF LC/MS method for identification and quantitation of Histamine in the antibiotic Gentamicin at ppm level: Validation and uncertainty evaluation. J. Pharm. Biomed. Anal. 2019, 162, 158–163. [Google Scholar] [CrossRef] [PubMed]
- Liu, Z.; Rochfort, S. A fast liquid chromatography–mass spectrometry (LC–MS) method for quantification of major polar metabolites in plants. J. Chromatogr. B Anal. Technol. Biomed. Life Sci. 2013, 912, 8–15. [Google Scholar] [CrossRef]
- Williamson, L.N.; Bartlett, M.G. Quantitative liquid chromatography/time-of-flight mass spectrometry. Biomed. Chromatogr. 2007, 21, 567–576. [Google Scholar] [CrossRef]
- Bi, H.; Krausz, K.W.; Manna, S.K.; Li, F.; Johnson, C.H.; Gonzalez, F.J. Optimization of harvesting, extraction, and analytical protocols for UPLC-ESI-MS-based metabolomic analysis of adherent mammalian cancer cells. Anal. Bioanal. Chem. 2013, 405, 5279–5289. [Google Scholar] [CrossRef]
- Dettmer, K.; Nürnberger, N.; Kaspar, H.; Gruber, M.A.; Almstetter, M.F.; Oefner, P.J.; Nurnberger, N.; Kaspar, H.; Gruber, M.A.; Almstetter, M.F.; et al. Metabolite extraction from adherently growing mammalian cells for metabolomics studies. Anal. Bioanal. Chem. 2011, 399, 1127–1139. [Google Scholar] [CrossRef]
- Hutschenreuther, A.; Kiontke, A.; Birkenmeier, G.; Birkemeyer, C. Comparison of extraction conditions and normalization approaches for cellular metabolomics of adherent growing cells with GC-MS. Anal. Methods 2012, 4, 1953–1963. [Google Scholar] [CrossRef]
- Teng, Q.; Huang, W.; Collette, T.W.; Ekman, D.R.; Tan, C. A direct cell quenching method for cell-culture based metabolomics. Metabolomics 2009, 5, 199–208. [Google Scholar] [CrossRef]
- Hounoum, B.M.; Blasco, H.; Nadal-Desbarats, L.; Diémé, B.; Montigny, F.; Andres, C.; Emond, P.; Mavel, S. Analytical methodology for metabolomics study of adherent mammalian cells using NMR, GC-MS and LC-HRMS. Anal. Bioanal. Chem. 2015, 407, 8861–8872. [Google Scholar] [CrossRef]
- Yuan, M.; Breitkopf, S.B.; Yang, X.; Asara, J.M. A positive/negative ion–switching, targeted mass spectrometry–based metabolomics platform for bodily fluids, cells, and fresh and fixed tissue. Nat. Protoc. 2012, 7, 872–881. [Google Scholar] [CrossRef]
- Bennett, B.D.; Yuan, J.; Kimball, E.H.; Rabinowitz, J.D. Absolute quantitation of intracellular metabolite concentrations by an isotope ratio-based approach. Nat. Protoc. 2008, 3, 1299–1311. [Google Scholar] [CrossRef] [PubMed]
- Deng, C.; Li, N.; Zhang, X. Rapid determination of amino acids in neonatal blood samples based on derivatization with isobutyl chloroformate followed by solid-phase microextraction and gas chromatography/mass spectrometry. Rapid Commun. Mass Spectrom. 2004, 18, 2558–2564. [Google Scholar] [CrossRef]
- De Paiva, M.J.N.; Menezes, H.C.; Christo, P.P.; Resende, R.R.; Cardeal, Z.D.L. An alternative derivatization method for the analysis of amino acids in cerebrospinal fluid by gas chromatography–mass spectrometry. J. Chromatogr. B Anal. Technol. Biomed. Life Sci. 2013, 931, 97–102. [Google Scholar] [CrossRef]
- Tang, D.-Q.; Zou, L.; Yin, X.-X.; Ong, C.N. HILIC-MS for metabolomics: An attractive and complementary approach to RPLC-MS. Mass Spectrom. Rev. 2016, 35, 574–600. [Google Scholar] [CrossRef] [PubMed]
- Le Boucher, J.; Charret, C.; Coudray-Lucas, C.; Giboudeau, J.; Cynober, L. Amino acid determination in biological fluids by automated ion-exchange chromatography: Performance of Hitachi L-8500A. Clin. Chem. 1997, 43, 1421–1428. [Google Scholar] [CrossRef]
- Shi, T.; Tang, T.; Qian, K.; Wang, F.; Li, J.; Cao, Y. High-performance liquid chromatographic method for determination of amino acids by precolumn derivatization with 4-chloro-3,5-dinitrobenzotrifluoride. Anal. Chim. Acta 2009, 654, 154–161. [Google Scholar] [CrossRef]
- Li, W.; Hou, M.; Cao, Y.; Song, H.; Shi, T.; Gao, X.; Wang, D. Determination of 20 Free Amino Acids in Asparagus Tin by High-Performance Liquid Chromatographic Method after Pre-Column Derivatization. Food Anal. Methods 2012, 5, 62–68. [Google Scholar] [CrossRef]
- Shang, S.F.; Wang, H. Sensitive determination of amino acids in kelp by reversed phase high performance liquid chromatography with precolumn derivatization using phenylisothiocyanate. Chromatographia 1996, 43, 309–312. [Google Scholar] [CrossRef]
- Onorato, J.M.; Langish, R.; Bellamine, A.; Shipkova, P. Applications of HILIC for targeted and non-targeted LC/MS analyses in drug discovery. J. Sep. Sci. 2010, 33, 923–929. [Google Scholar] [CrossRef] [PubMed]
- Guo, C.; Xue, Y.; Seddik, H.E.; Yin, Y.; Hu, F.; Mao, S. A quantitative HILIC–MS/MS assay of the metabolic response of Huh-7 cells exposed to 2,3,7,8-tetrachlorodibenzo- p-dioxin. Metabolites 2019, 9, 118. [Google Scholar] [CrossRef]
- Ghosson, H.; Schwarzenberg, A.; Jamois, F.; Yvin, J.-C. Simultaneous untargeted and targeted metabolomics profiling of underivatized primary metabolites in sulfur-deficient barley by ultra-high performance liquid chromatography-quadrupole/time-of-flight mass spectrometry. Plant Methods 2018, 14, 62. [Google Scholar] [CrossRef] [PubMed]
- Phang, J.M. Proline Metabolism in Cell Regulation and Cancer Biology: Recent Advances and Hypotheses. Antioxidants Redox Signal. 2019, 30, 635–649. [Google Scholar] [CrossRef] [PubMed]
- Yang, L.; Li, Y.; Ding, Y.; Choi, K.-S.; Kazim, A.L.; Zhang, Y. Prolidase Directly Binds and Activates Epidermal Growth Factor Receptor and Stimulates Downstream Signaling. J. Biol. Chem. 2012, 288, 2365–2375. [Google Scholar] [CrossRef]
- Golja, M.V.; Trontelj, J.; Geršak, K.; Mlinarič-Raščan, I.; Šmid, A. Simultaneous quantification of intracellular concentrations of clinically important metabolites of folate-homocysteine cycle by LC-MS/MS. Anal. Biochem. 2020, 605, 113830. [Google Scholar] [CrossRef] [PubMed]
- Zhang, S.; Jian, W.; Sullivan, S.; Sankaran, B.; Edom, R.W.; Weng, N.; Sharkey, D. Development and validation of an LC–MS/MS based method for quantification of 25 hydroxyvitamin D2 and 25 hydroxyvitamin D3 in human serum and plasma. J. Chromatogr. B Anal. Technol. Biomed. Life Sci. 2014, 961, 62–70. [Google Scholar] [CrossRef]
- Soh, S.F.; Yin, X.; Sun, J.; Li, J.; Yong, E.-L.; Wei, Q.; Gong, Y. Simultaneous determination of multiple androgens in mice organs with liquid chromatography tandem mass spectrometry. J. Pharm. Biomed. Anal. 2015, 115, 457–466. [Google Scholar] [CrossRef]
Sample Availability: Samples of the compounds are not available from the authors. |


| Analyte | Sample | Intra-Day Precision (n = 5) | Inter-Day Precision (n = 5) | ||||
|---|---|---|---|---|---|---|---|
| RT 1 (min), %RSD 2 | Peak Area, %RSD 2 | Conc 3, %RSD 2 | RT 1 (min), %RSD 2 | Peak Area, %RSD 2 | Conc 3, %RSD 2 | ||
| Proline | QC1 | 0.04 | 2.95 | 0.18 | 0.92 | 10.53 | 0.66 |
| QC2 | 0.74 | 7.25 | 1.29 | 0.69 | 6.21 | 0.84 | |
| QC3 | 1.06 | 7.13 | 1.71 | 0.78 | 6.07 | 1.24 | |
| Arginine | QC1 | 0.14 | 6.85 | 3.34 | 0.15 | 14.27 | 5.67 |
| QC2 | 0.18 | 1.59 | 12.41 | 0.23 | 4.98 | 8.46 | |
| QC3 | 0.07 | 4.01 | 14.97 | 0.14 | 5.25 | 10.26 | |
| Glutamic acid | QC1 | 0.23 | 6.12 | 4.87 | 0.33 | 7.27 | 5.19 |
| QC2 | 0.45 | 8.04 | 0.92 | 0.41 | 5.21 | 3.61 | |
| QC3 | 0.31 | 5.65 | 3.40 | 0.33 | 4.17 | 3.68 | |
| Analyte | Recovery, % | Matrix Effect 1 % | ||
|---|---|---|---|---|
| QC1 (n = 3) | QC2 (n = 3) | QC3 (n = 3) | ||
| Proline | 103.76 | 99.96 | 105.84 | 98.79 |
| Arginine | 98.08 | 100.33 | 88.46 | 96.03 |
| Glutamic acid | 103.01 | 99.86 | 108.54 | 82.13 |
| Analyte | Sample | 24 h Storage | 48 h Storage | ||
|---|---|---|---|---|---|
| Peak Area, % | Conc 1, % | Peak Area, % | Conc 1, % | ||
| Proline | Standard solution | 99.17 | 99.72 | 123.93 | 99.22 |
| Cell lysate | 104.67 | 99.32 | 112.27 | 99.23 | |
| Arginine | Standard solution | 101.25 | 102.97 | 118.05 | 93.24 |
| Cell lysate | 98.12 | 91.63 | 100.35 | 86.64 | |
| Glutamic acid | Standard solution | 94.66 | 95.12 | 118.03 | 93.97 |
| Cell lysate | 105.47 | 100.03 | 111.28 | 98.27 | |
© 2020 by the authors. Licensee MDPI, Basel, Switzerland. This article is an open access article distributed under the terms and conditions of the Creative Commons Attribution (CC BY) license (http://creativecommons.org/licenses/by/4.0/).
Share and Cite
Klupczynska, A.; Misiura, M.; Miltyk, W.; Oscilowska, I.; Palka, J.; Kokot, Z.J.; Matysiak, J. Development of an LC-MS Targeted Metabolomics Methodology to Study Proline Metabolism in Mammalian Cell Cultures. Molecules 2020, 25, 4639. https://doi.org/10.3390/molecules25204639
Klupczynska A, Misiura M, Miltyk W, Oscilowska I, Palka J, Kokot ZJ, Matysiak J. Development of an LC-MS Targeted Metabolomics Methodology to Study Proline Metabolism in Mammalian Cell Cultures. Molecules. 2020; 25(20):4639. https://doi.org/10.3390/molecules25204639
Chicago/Turabian StyleKlupczynska, Agnieszka, Magdalena Misiura, Wojciech Miltyk, Ilona Oscilowska, Jerzy Palka, Zenon J. Kokot, and Jan Matysiak. 2020. "Development of an LC-MS Targeted Metabolomics Methodology to Study Proline Metabolism in Mammalian Cell Cultures" Molecules 25, no. 20: 4639. https://doi.org/10.3390/molecules25204639
APA StyleKlupczynska, A., Misiura, M., Miltyk, W., Oscilowska, I., Palka, J., Kokot, Z. J., & Matysiak, J. (2020). Development of an LC-MS Targeted Metabolomics Methodology to Study Proline Metabolism in Mammalian Cell Cultures. Molecules, 25(20), 4639. https://doi.org/10.3390/molecules25204639