
NMR as a “Gold Standard” Method in Drug Design and Discovery

 , , , and
Abstract
:
1. Introduction
2. An Introduction to NMR Spectroscopy
2.1. One Dimensional NMR Spectroscopy
2.1.1. 1D 1H-NMR
2.1.2. 1D 13C-NMR
2.1.3. 1D 15N-NMR
2.1.4. 1D 31P-NMR
2.2. Multi-Dimensional NMR Spectroscopy
2.2.1. 2D 1H,1H-COSY
2.2.2. 2D 1H,1H-TOCSY
2.2.3. 2D 1H,13C-HSQC
2.2.4. 2D 1H, 13C-HMBC
2.2.5. Relaxation-Edited NMR Spectroscopy
3. NMR Methods for Drug Discovery and Drug Development
3.1. NMR in Fragment Based Drug Design (FBDD)
3.1.1. Target Based Screening
3.1.2. NMR Ligand-Based Screening
3.1.3. Saturation Transfer Difference (STD)
3.1.4. Transferred NOE (tr-NOE) in Ligand Based Screening
3.1.5. The INPHARMA Method for Pharmacophore Mapping
3.1.6. Diffusion Based Spectroscopy in Drug Design
3.2. NMR and In Silico Screening-Two Complementary Approaches
3.3. Paramagnetic Resonance in Drug Discovery
3.4. Solid State NMR in Drug Discovery
3.5. NMR Validation in Drug Design
3.6. Other Methods Used to Determine the Drug-Target Complexes
3.6.1. DIRECTION
3.6.2. ILOE
3.6.3. SOS-NMR
3.6.4. Tert-butyl Labelling
3.6.5. SALMON
3.6.6. LOGSY Titration
3.6.7. Nuclear Magnetic Resonance Molecular Replacement (NMR2)
3.6.8. HECSP
3.6.9. SAMPLEX
4. In-Cell NMR Approaches
4.1. Compound-Detected In-Cell NMR
4.2. Target-Detected In-Cell NMR
4.3. Reporter-Detected In-Cell NMR
4.4. “In-Virus” NMR Strategy
5. Final Remarks
6. Conclusions
Author Contributions
Funding
Acknowledgments
Conflicts of Interest
References
- Adams, C.P.; Brantner, V.V. Estimating the Cost Of New Drug Development: Is It Really $802 Million? Health Aff. (Millwood) 2006, 25, 420–428. [Google Scholar] [CrossRef] [PubMed] [Green Version]
- DiMasi, J.A.; Hansen, R.W.; Grabowski, H.G. The price of innovation: New estimates of drug development costs. J. Health Econ. 2003, 22, 151–185. [Google Scholar] [CrossRef] [Green Version]
- Meigs, L.; Smirnova, L.; Rovida, C.; Leist, M.; Hartung, T. Animal testing and its alternatives—The most important omics is economics. ALTEX Altern. Anim. Exp. 2018, 35, 275–305. [Google Scholar] [CrossRef] [PubMed] [Green Version]
- Friedman, L.M.; Furberg, C.D.; DeMets, D.L. What Is the Question? In Fundamentals of Clinical Trials; Friedman, L.M., Furberg, C.D., DeMets, D.L., Eds.; Springer: New York, NY, USA, 2010; pp. 37–53. ISBN 978-1-4419-1586-3. [Google Scholar]
- Harner, M.J.; Mueller, L.; Robbins, K.J.; Reily, M.D. NMR in drug design. Arch. Biochem. Biophys. 2017, 628, 132–147. [Google Scholar] [CrossRef]
- Chu, S.; Zhou, G.; Gochin, M. Evaluation of ligand-based NMR screening methods to characterize small molecule binding to HIV-1 glycoprotein-41. Org. Biomol. Chem. 2017, 15, 5210–5219. [Google Scholar] [CrossRef]
- Zartler, E.R.; Hanson, J.; Jones, B.E.; Kline, A.D.; Martin, G.; Mo, H.; Shapiro, M.J.; Wang, R.; Wu, H.; Yan, J. RAMPED-UP NMR: Multiplexed NMR-Based Screening for Drug Discovery. J. Am. Chem. Soc. 2003, 125, 10941–10946. [Google Scholar] [CrossRef]
- Dhahri, M.; Sioud, S.; Dridi, R.; Hassine, M.; Boughattas, N.A.; Almulhim, F.; Al Talla, Z.; Jaremko, M.; Emwas, A.-H.M. Extraction, Characterization, and Anticoagulant Activity of a Sulfated Polysaccharide from Bursatella leachii Viscera. ACS Omega 2020, 5, 14786–14795. [Google Scholar] [CrossRef]
- Alahmari, F.; Dey, S.; Emwas, A.-H.; Davaasuren, B.; Rothenberger, A. Ultra-low thermal conductivity in Na/Sb chalcobismuthates: Synthesis, crystal structures, optical properties and 23Na NMR spectroscopy. New J. Chem. 2019, 43, 10814–10820. [Google Scholar] [CrossRef]
- Alahmari, F.; Dey, S.; Emwas, A.-H.; Davaasuren, B.; Rothenberger, A. Layered copper thioaluminate K2Cu3AlS4: Synthesis, crystal structure, characterization and solid-state 27Al and 39K NMR studies. J. Alloys Compd. 2019, 776, 1041–1047. [Google Scholar] [CrossRef]
- Manzoor, S.; Bilal, A.; Khan, S.; Ullah, R.; Iftikhar, S.; Emwas, A.-H.; Alazmi, M.; Gao, X.; Jawaid, A.; Saleem, R.S.Z.; et al. Identification and characterization of SSE15206, a microtubule depolymerizing agent that overcomes multidrug resistance. Sci. Rep. 2018, 8, 1–12. [Google Scholar] [CrossRef] [Green Version]
- Qiu, X.; Redwine, D.; Beshah, K.; Livazovic, S.; Canlas, C.G.; Guinov, A.; Emwas, A.-H.M. Amide versus amine ratio in the discrimination layer of reverse osmosis membrane by solid state 15N NMR and DNP NMR. J. Membr. Sci. 2019, 581, 243–251. [Google Scholar] [CrossRef]
- Dias, D.A.; Jones, O.A.H.; Beale, D.J.; Boughton, B.A.; Benheim, D.; Kouremenos, K.A.; Wolfender, J.-L.; Wishart, D.S. Current and Future Perspectives on the Structural Identification of Small Molecules in Biological Systems. Metabolites 2016, 6, 46. [Google Scholar] [CrossRef] [PubMed]
- Duchardt-Ferner, E.; Wöhnert, J. NMR experiments for the rapid identification of P=O···H–X type hydrogen bonds in nucleic acids. J. Biomol. NMR 2017, 69, 101–110. [Google Scholar] [CrossRef]
- Lee, H.-M.; Kim, C.S.; Jang, Y.M.; Kwon, S.W.; Lee, B.-J. Separation and structural elucidation of a novel analogue of vardenafil included as an adulterant in a dietary supplement by liquid chromatography–electrospray ionization mass spectrometry, infrared spectroscopy and nuclear magnetic resonance spectroscopy. J. Pharm. Biomed. Anal. 2011, 54, 491–496. [Google Scholar] [CrossRef] [PubMed]
- Lu, X.; Skomski, D.; Thompson, K.C.; McNevin, M.J.; Xu, W.; Su, Y. Three-Dimensional NMR Spectroscopy of Fluorinated Pharmaceutical Solids under Ultrafast Magic Angle Spinning. Anal. Chem. 2019, 91, 6217–6224. [Google Scholar] [CrossRef]
- Pauli, G.F.; Chen, S.-N.; Lankin, D.C.; Bisson, J.; Case, R.J.; Chadwick, L.R.; Gödecke, T.; Inui, T.; Krunic, A.; Jaki, B.U.; et al. Essential Parameters for Structural Analysis and Dereplication by 1H-NMR Spectroscopy. J. Nat. Prod. 2014, 77, 1473–1487. [Google Scholar] [CrossRef] [Green Version]
- Silva, M.F.S.; Silva, L.M.A.; Quintela, A.L.; dos Santos, A.G.; Silva, F.A.N.; de Oliveira, F.d.C.E.; Alves Filho, E.G.; de Brito, E.S.; Canuto, K.M.; Pessoa, C.; et al. UPLC-HRMS and NMR applied in the evaluation of solid-phase extraction methods as a rational strategy of dereplication of Phyllanthus spp. aiming at the discovery of cytotoxic metabolites. J. Chromatogr. B 2019, 1120, 51–61. [Google Scholar] [CrossRef]
- Samai, S.; Sapsanis, C.; Patil, S.P.; Ezzeddine, A.; Moosa, B.A.; Omran, H.; Emwas, A.-H.; Salama, K.N.; Khashab, N.M. A light responsive two-component supramolecular hydrogel: A sensitive platform for the fabrication of humidity sensors. Soft Matter. 2016, 12, 2842–2845. [Google Scholar] [CrossRef] [Green Version]
- Oommen, J.M.; Hussain, M.M.; Emwas, A.-H.M.; Agarwal, P.; Archer, L.A. Nuclear Magnetic Resonance Study of Nanoscale Ionic Materials. Electrochem. Solid State Lett. 2010, 13, K87. [Google Scholar] [CrossRef] [Green Version]
- Santos, S.C.; Carvalho, A.G.; Fortes, G.A.C.; Ferri, P.H.; De Oliveira, A. Variable-temperature NMR and conformational analysis of Oenothein, B. J. Braz. Chem. Soc. 2014, 25, 282–289. [Google Scholar] [CrossRef]
- Tycko, R. NMR at Low and Ultralow Temperatures. Acc. Chem. Res. 2013, 46, 1923–1932. [Google Scholar] [CrossRef] [Green Version]
- Xia, Z.; Nguyen, B.D.; Brunori, M.; Cutruzzolà, F.; La Mar, G.N. 1H-NMR Study of the Effect of Temperature through Reversible Unfolding on the Heme Pocket Molecular Structure and Magnetic Properties of Aplysia limacina Cyano-Metmyoglobin. Biophys. J. 2005, 89, 4149–4158. [Google Scholar] [CrossRef] [PubMed] [Green Version]
- Mattar, S.M.; Emwas, A.H.; Calhoun, L.A. Spectroscopic Studies of the Intermediates in the Conversion of 1,4,11,12-Tetrahydro-9,10-anthraquinone to 9,10-Anthraquinone by Reaction with Oxygen under Basic Conditions. J. Phys. Chem. A 2004, 108, 11545–11553. [Google Scholar] [CrossRef]
- Davaasuren, B.; Emwas, A.-H.; Rothenberger, A. MAu2GeS4-Chalcogel (M = Co, Ni): Heterogeneous Intra- and Intermolecular Hydroamination Catalysts. Inorg. Chem. 2017, 56, 9609–9616. [Google Scholar] [CrossRef] [PubMed]
- Blindauer, C.A.; Emwas, A.H.; Holý, A.; Dvořáková, H.; Sletten, E.; Sigel, H. Complex Formation of the Antiviral 9-[2-(Phosphonomethoxy)Ethyl]Adenine (PMEA) and of Its N 1, N 3, and N 7 Deaza Derivatives with Copper(II) in Aqueous Solution. Chem. Eur. J. 1997, 3, 1526–1536. [Google Scholar] [CrossRef]
- Jacquemmoz, C.; Giraud, F.; Dumez, J.-N. Online reaction monitoring by single-scan 2D NMR under flow conditions. Analyst 2020, 145, 478–485. [Google Scholar] [CrossRef] [PubMed]
- Leverick, G.; Tatara, R.; Feng, S.; Crabb, E.; France-Lanord, A.; Tułodziecki, M.; Lopez, J.; Stephens, R.M.; Grossman, J.C.; Shao-Horn, Y. Solvent- and Anion-Dependent Li+–O2– Coupling Strength and Implications on the Thermodynamics and Kinetics of Li–O2 Batteries. J. Phys. Chem. C 2020, 124, 4953–4967. [Google Scholar] [CrossRef]
- Dias, D.M.; Ciulli, A. NMR approaches in structure-based lead discovery: Recent developments and new frontiers for targeting multi-protein complexes. Prog. Biophys. Mol. Biol. 2014, 116, 101–112. [Google Scholar] [CrossRef] [Green Version]
- Foot, J.N.; Feracci, M.; Dominguez, C. Screening protein–Single stranded RNA complexes by NMR spectroscopy for structure determination. Methods 2014, 65, 288–301. [Google Scholar] [CrossRef] [Green Version]
- Kijewska, M.; Czerwińska, A.; Al-Harthi, S.; Wołczański, G.; Waliczek, M.; Emwas, A.-H.; Jaremko, M.; Jaremko, Ł.; Stefanowicz, P.; Szewczuk, Z. Intramolecularly stapled amphipathic peptides via a boron–sugar interaction. Chem. Commun. 2020, 56, 8814–8817. [Google Scholar] [CrossRef]
- Takeuchi, K.; Baskaran, K.; Arthanari, H. Structure determination using solution NMR: Is it worth the effort? J. Magn. Reson. 2019, 306, 195–201. [Google Scholar] [CrossRef] [PubMed]
- Baldwin, A.J.; Kay, L.E. NMR spectroscopy brings invisible protein states into focus. Nat. Chem. Biol. 2009, 5, 808–814. [Google Scholar] [CrossRef] [PubMed]
- Jhoti, H.; Cleasby, A.; Verdonk, M.; Williams, G. Fragment-based screening using X-ray crystallography and NMR spectroscopy. Curr. Opin. Chem. Biol. 2007, 11, 485–493. [Google Scholar] [CrossRef] [PubMed]
- Emwas, A.-H.M.; Al-Talla, Z.A.; Guo, X.; Al-Ghamdi, S.; Al-Masri, H.T. Utilizing NMR and EPR spectroscopy to probe the role of copper in prion diseases. Magn. Reson. Chem. 2013, 51, 255–268. [Google Scholar] [CrossRef]
- Wyss, D.F.; Wang, Y.-S.; Eaton, H.L.; Strickland, C.; Voigt, J.H.; Zhu, Z.; Stamford, A.W. Combining NMR and X-ray Crystallography in Fragment-Based Drug Discovery: Discovery of Highly Potent and Selective BACE-1 Inhibitors. In Fragment-Based Drug Discovery and X-Ray Crystallography; Topics in Current Chemistry; Davies, T.G., Hyvönen, M., Eds.; Springer: Berlin, Germany, 2012; pp. 83–114. ISBN 978-3-642-27540-1. [Google Scholar]
- Jack, R.; Sem, D.; Yu, L. Real-time structure-based drug development—Tutorial: Triad’s NMR-based structural determinations are smart chemistry. Genet. Eng. News 2001, 21, 34. [Google Scholar]
- Jadeja, Y.; Chomal, B.; Patel, M.; Jebaliya, H.; Khunt, R.; Shah, A. Method development and validation: Quantitation of telmisartan bulk drug and its tablet formulation by 1H-NMR spectroscopy. Magn. Reson. Chem. 2017, 55, 634–638. [Google Scholar] [CrossRef]
- Kozlova, A.S.; Cross, T.A.; Brey, W.W.; Gor’kov, P.L. 31P and 15N Solid-State NMR Study for the Development of a Novel Membrane Protein Drug-Screening Methodology. Biophys. J. 2012, 102, 390a. [Google Scholar] [CrossRef] [Green Version]
- Shimada, I. Functional analyses of target proteins for drug development by NMR. Proc. J. Pharmacol. Sci. 2015, 128, 54. [Google Scholar]
- Soulsby, D. Band-selective excitation NMR spectroscopy and quantitative time-domain analysis using Complete Reduction to Amplitude-Frequency Table (CRAFT) to determine distribution coefficients during drug development. Magn. Reson. Chem. 2019, 57, 953–960. [Google Scholar] [CrossRef]
- Ali, M.; Shaw, D.R.; Zhang, L.; Haroon, M.F.; Narita, Y.; Emwas, A.-H.; Saikaly, P.E.; Okabe, S. Aggregation ability of three phylogenetically distant anammox bacterial species. Water Res. 2018, 143, 10–18. [Google Scholar] [CrossRef]
- Cui, G.; Liew, Y.J.; Li, Y.; Kharbatia, N.; Zahran, N.I.; Emwas, A.-H.; Eguiluz, V.M.; Aranda, M. Host-dependent nitrogen recycling as a mechanism of symbiont control in Aiptasia. PLoS Genet. 2019, 15, e1008189. [Google Scholar] [CrossRef] [PubMed] [Green Version]
- Emwas, A.-H.; Saccenti, E.; Gao, X.; McKay, R.T.; dos Santos, V.A.P.M.; Roy, R.; Wishart, D.S. Recommended strategies for spectral processing and post-processing of 1D 1H-NMR data of biofluids with a particular focus on urine. Metabolomics 2018, 14, 31. [Google Scholar] [CrossRef] [PubMed] [Green Version]
- Hajjar, D.; Kremb, S.; Sioud, S.; Emwas, A.-H.; Voolstra, C.R.; Ravasi, T. Anti-cancer agents in Saudi Arabian herbals revealed by automated high-content imaging. PLoS ONE 2017, 12. [Google Scholar] [CrossRef] [PubMed] [Green Version]
- Iftikhar, S.; Khan, S.; Bilal, A.; Manzoor, S.; Abdullah, M.; Emwas, A.-H.; Sioud, S.; Gao, X.; Chotana, G.A.; Faisal, A.; et al. Synthesis and evaluation of modified chalcone based p53 stabilizing agents. Bioorg. Med. Chem. Lett. 2017, 27, 4101–4106. [Google Scholar] [CrossRef] [PubMed] [Green Version]
- Alqahtani, F.Y.; Aleanizy, F.S.; El Tahir, E.; Alkahtani, H.M.; AlQuadeib, B.T. Chapter Three-Paclitaxel. In Profiles of Drug Substances, Excipients and Related Methodology; Brittain, H.G., Ed.; Academic Press: Cambridge, MA, USA, 2019; Volume 44, pp. 205–238. ISBN 978-0-12-817165-3. [Google Scholar]
- Dey, R.; Samantaray, M.K.; Poater, A.; Hamieh, A.; Kavitake, S.; Abou-Hamad, E.; Callens, E.; Emwas, A.-H.; Cavallo, L.; Basset, J.-M. Synthesis and characterization of a homogeneous and silica supported homoleptic cationic tungsten(VI) methyl complex: Application in olefin metathesis. Chem. Commun. 2016, 52, 11270–11273. [Google Scholar] [CrossRef]
- Elbaz, A.M.; Gani, A.; Hourani, N.; Emwas, A.-H.; Sarathy, S.M.; Roberts, W.L. TG/DTG, FT-ICR Mass Spectrometry, and NMR Spectroscopy Study of Heavy Fuel Oil. Energy Fuels 2015, 29, 7825–7835. [Google Scholar] [CrossRef] [Green Version]
- Emwas, A.-H.; Roy, R.; McKay, R.T.; Ryan, D.; Brennan, L.; Tenori, L.; Luchinat, C.; Gao, X.; Zeri, A.C.; Gowda, G.A.N.; et al. Recommendations and Standardization of Biomarker Quantification Using NMR-Based Metabolomics with Particular Focus on Urinary Analysis. J. Proteome Res. 2016, 15, 360–373. [Google Scholar] [CrossRef] [Green Version]
- Li, S.; Winters, H.; Jeong, S.; Emwas, A.-H.; Vigneswaran, S.; Amy, G.L. Marine bacterial transparent exopolymer particles (TEP) and TEP precursors: Characterization and RO fouling potential. Desalination 2016, 379, 68–74. [Google Scholar] [CrossRef]
- Fordwour, O.B.; Wolthers, K.R. Active site arginine controls the stereochemistry of hydride transfer in cyclohexanone monooxygenase. Arch. Biochem. Biophys. 2018, 659, 47–56. [Google Scholar] [CrossRef]
- Hamzi, I.; Fray, M.; Abidi, R.; Barhoumi-Slimi, T. Synthesis, characterization and conformational study of new α,β-unsaturated acylhydrazones based on calix [4] arene backbone. J. Mol. Struct. 2019, 1185, 78–84. [Google Scholar] [CrossRef]
- Jeziorowski, S.; Thiele, C.M. Poly-γ-p-Biphenylmethyl-Glutamate as Enantiodifferentiating Alignment Medium for NMR Spectroscopy with Temperature-Tunable Properties. Chem. Eur. J. 2018, 24, 15631–15637. [Google Scholar] [CrossRef] [PubMed]
- Mazzola, E.P.; Deeds, J.R.; Stutts, W.L.; Ridge, C.D.; Dickey, R.W.; White, K.D.; Williamson, R.T.; Martin, G.E. Elucidation and partial NMR assignment of monosulfated maitotoxins from the Caribbean. Toxicon 2019, 164, 44–50. [Google Scholar] [CrossRef] [PubMed]
- Mphahlele, M.J.; Maluleka, M.M.; Mampa, R.M. Elucidation of the Structure of the 2-amino-3,5-Dibromochalcone Epoxides in Solution and Solid State. Crystals 2019, 9, 277. [Google Scholar] [CrossRef] [Green Version]
- Kobyłka, K.; Żuchowski, G.; Tejchman, W.; Zborowski, K.K. Synthesis, spectroscopy, and theoretical calculations of some 2-thiohydantoin derivatives as possible new fungicides. J. Mol. Model. 2019, 25, 268. [Google Scholar] [CrossRef] [Green Version]
- Li, P.; Deng, J.; Xiao, N.; Cai, X.; Wu, Q.; Lu, Z.; Yang, Y.; Du, B. Identification of polyunsaturated triacylglycerols and CC location isomers in sacha inchi oil by photochemical reaction mass spectrometry combined with nuclear magnetic resonance spectroscopy. Food Chem. 2020, 307, 125568. [Google Scholar] [CrossRef]
- Ólafsson, S.N.; Bjornsson, R.; Helgason, Ö.; Jonsdottir, S.; Suman, S.G. Coordination geometry determination of stannane compounds with phosphinoyldithioformate ligands using multinuclear NMR, Sn Mössbauer and DFT methods. J. Organomet. Chem. 2016, 825–826, 125–138. [Google Scholar] [CrossRef]
- Selent, M.; Nyman, J.; Roukala, J.; Ilczyszyn, M.; Oilunkaniemi, R.; Bygrave, P.J.; Laitinen, R.; Jokisaari, J.; Day, G.M.; Lantto, P. Clathrate Structure Determination by Combining Crystal Structure Prediction with Computational and Experimental 129Xe NMR Spectroscopy. Chem. Eur. J. 2017, 23, 5258–5269. [Google Scholar] [CrossRef] [Green Version]
- Şenkardeş, S.; Tatar, E.; Nepravishta, R.; Cela, D.; Paci, M.; Özakpınar, Ö.B.; Şekerler, T.; De Clercq, E.; Pannecouque, C.; Küçükgüzel, Ş.G.; et al. Synthesis and Biological Activity of N-(arylsulfonyl) Valine Hydrazones and Assistance of NMR Spectroscopy for Definitive 3D Structure. Lett. Drug Des. Discov. 2019, 16, 974–983. [Google Scholar] [CrossRef]
- Sousa, F.F.O.; Luzardo-Álvarez, A.; Blanco-Méndez, J.; Otero-Espinar, F.J.; Martín-Pastor, M.; Sández Macho, I. Use of 1H-NMR STD, WaterLOGSY, and Langmuir monolayer techniques for characterization of drug–zein protein complexes. Eur. J. Pharm. Biopharm. 2013, 85, 790–798. [Google Scholar] [CrossRef] [Green Version]
- Meyer, B.; Peters, T. NMR Spectroscopy Techniques for Screening and Identifying Ligand Binding to Protein Receptors. Angew. Chem. Int. Ed. 2003, 42, 864–890. [Google Scholar] [CrossRef]
- Mohanty, S.; Sieker, L.C.; Drobny, G.P. Sequential 1H-NMR Assignment of the Complex of Aponeocarzinostatin with Ethidium Bromide and Investigation of Protein-Drug Interactions in the Chromophore Binding Site. Biochemistry 1994, 33, 10579–10590. [Google Scholar] [CrossRef] [PubMed]
- Chen, C.; Gao, J.; Wang, T.-S.; Guo, C.; Yan, Y.-J.; Mao, C.-Y.; Gu, L.-W.; Yang, Y.; Li, Z.-F.; Liu, A. NMR-based Metabolomic Techniques Identify the Toxicity of Emodin in HepG2 Cells. Sci. Rep. 2018, 8, 1–10. [Google Scholar] [CrossRef] [PubMed]
- Xu, C.; Rezeng, C.; Li, J.; Zhang, L.; Yan, Y.; Gao, J.; Wang, Y.; Li, Z.; Chen, J. 1H-NMR-Based Metabolomics Study of the Toxicological Effects in Rats Induced by “Renqing Mangjue” Pill, a Traditional Tibetan Medicine. Front. Pharmacol. 2017, 8. [Google Scholar] [CrossRef] [PubMed] [Green Version]
- Dallons, M.; Schepkens, C.; Dupuis, A.; Tagliatti, V.; Colet, J.-M. New Insights About Doxorubicin-Induced Toxicity to Cardiomyoblast-Derived H9C2 Cells and Dexrazoxane Cytoprotective Effect: Contribution of In Vitro 1H-NMR Metabonomics. Front. Pharmacol. 2020, 11. [Google Scholar] [CrossRef] [Green Version]
- Zhang, X.; Wu, H.; Liao, P.; Li, X.; Ni, J.; Pei, F. NMR-based metabonomic study on the subacute toxicity of aristolochic acid in rats. Food Chem. Toxicol. 2006, 44, 1006–1014. [Google Scholar] [CrossRef]
- Al-Talla, Z.A.; Akrawi, S.H.; Emwas, A.-H.M. Solid state NMR and bioequivalence comparison of the pharmacokinetic parameters of two formulations of clindamycin. Int. J. Clin. Pharmacol. Ther. 2011, 49, 469–476. [Google Scholar] [CrossRef]
- Cai, H.; Wang, Y.; McCarthy, D.; Wen, H.; Borchelt, D.R.; Price, D.L.; Wong, P.C. BACE1 is the major β-secretase for generation of Aβ peptides by neurons. Nat. Neurosci. 2001, 4, 233–234. [Google Scholar] [CrossRef]
- Huang, C.; Rossi, P.; Saio, T.; Kalodimos, C.G. Structural basis for the antifolding activity of a molecular chaperone. Nature 2016, 537, 202–206. [Google Scholar] [CrossRef] [Green Version]
- Ziarek, J.J.; Peterson, F.C.; Lytle, B.L.; Volkman, B.F. Chapter ten—Binding Site Identification and Structure Determination of Protein–Ligand Complexes by NMR: A Semiautomated Approach. In Methods in Enzymology; Fragment-Based Drug Design; Kuo, L.C., Ed.; Academic Press: San Diego, CA, USA, 2011; Volume 493, pp. 241–275. ISBN 978-0-12-381274-2. [Google Scholar]
- Keiffer, S.; Carneiro, M.G.; Hollander, J.; Kobayashi, M.; Pogoryelev, D.; AB, E.; Theisgen, S.; Müller, G.; Siegal, G. NMR in target driven drug discovery: Why not? J. Biomol. NMR 2020. [Google Scholar] [CrossRef]
- Marshall, C.B.; KleinJan, F.; Gebregiworgis, T.; Lee, K.-Y.; Fang, Z.; Eves, B.J.; Liu, N.F.; Gasmi-Seabrook, G.M.C.; Enomoto, M.; Ikura, M. NMR in integrated biophysical drug discovery for RAS: Past, present, and future. J. Biomol. NMR 2020. [Google Scholar] [CrossRef]
- Norton, R.S.; Jahnke, W. NMR in pharmaceutical discovery and development. J. Biomol. NMR 2020. [Google Scholar] [CrossRef] [PubMed]
- Cady, E.B. Clinical Magnetic Resonance Spectroscopy; Springer: New York, NY, USA, 1990; ISBN 978-0-306-43449-5. [Google Scholar]
- Farrar, T.C. Principles of Pulse NMR Spectroscopy. In NMR: Principles and Applications to Biomedical Research; Pettegrew, J.W., Ed.; Springer: New York, NY, USA, 1990; pp. 1–36. ISBN 978-1-4612-3300-8. [Google Scholar]
- Levitt, M.H. Spin Dynamics: Basics of Nuclear Magnetic Resonance; John Wiley & Sons: Hoboken, NJ, USA, 2013; ISBN 978-1-118-68184-8. [Google Scholar]
- Jacobsen, N.E. NMR Spectroscopy Explained: Simplified Theory, Applications and Examples for Organic Chemistry and Structural Biology; John Wiley & Sons: Hoboken, NJ, USA, 2007; ISBN 0-470-17334-3. [Google Scholar]
- Chu, S.; Maltsev, S.; Emwas, A.-H.; Lorigan, G.A. Solid-state NMR paramagnetic relaxation enhancement immersion depth studies in phospholipid bilayers. J. Magn. Reson. 2010, 207, 89–94. [Google Scholar] [CrossRef] [PubMed] [Green Version]
- Ishima, R.; Torchia, D.A. Protein dynamics from NMR. Nat. Struct. Biol. 2000, 7, 740–743. [Google Scholar] [CrossRef] [PubMed]
- Kleckner, I.R.; Foster, M.P. An introduction to NMR-based approaches for measuring protein dynamics. Biochim. Biophys. Acta 2011, 1814, 942–968. [Google Scholar] [CrossRef] [PubMed] [Green Version]
- Alsiary, R.A.; Alghrably, M.; Saoudi, A.; Al-Ghamdi, S.; Jaremko, L.; Jaremko, M.; Emwas, A.-H. Using NMR spectroscopy to investigate the role played by copper in prion diseases. Neurol. Sci. Off. J. Ital. Neurol. Soc. Ital. Soc. Clin. Neurophysiol. 2020, 41, 2389–2406. [Google Scholar] [CrossRef]
- Taraban, M.B.; Deredge, D.J.; Smith, M.E.; Briggs, K.T.; Li, Y.; Jiang, Z.-X.; Wintrode, P.L.; Yu, Y.B. Monitoring dendrimer conformational transition using 19F and 1H2O NMR. Magn. Reson. Chem. 2019, 57, 861–872. [Google Scholar] [CrossRef]
- Kumar Patel, A.; Kumar Mishra, S.; Krishnamurthy, K.; Suryaprakash, N. Retention of strong intramolecular hydrogen bonds in high polarity solvents in binaphthalene–benzamide derivatives: Extensive NMR studies. RSC Adv. 2019, 9, 32759–32770. [Google Scholar] [CrossRef] [Green Version]
- Feng, X.; Xu, H.; Chen, J.-F.; Ruan, L.-Y.; Zhao, W.-L.; Meng, H.-H.; Liu, W.-Y.; Zhao, W.-L.; Zheng, Q.; Liu, Z.-C.; et al. Potential hepatoxicity risk of the shell of Herpetospermum caudigerum Wall in rats based on 1H-NMR metabonomics. J. Pharm. Biomed. Anal. 2019, 176, 112800. [Google Scholar] [CrossRef]
- Liu, X.; Zhu, W.; Guan, S.; Feng, R.; Zhang, H.; Liu, Q.; Sun, P.; Lin, D.; Zhang, N.; Shen, J. Metabolomic Analysis of Anti-Hypoxia and Anti-anxiety Effects of Fu Fang Jin Jing Oral Liquid. PLoS ONE 2013, 8. [Google Scholar] [CrossRef] [Green Version]
- Zhang, Z.-Z.; Fan, M.-L.; Hao, X.; Qin, X.-M.; Li, Z.-Y. Integrative drug efficacy assessment of Danggui and European Danggui using NMR-based metabolomics. J. Pharm. Biomed. Anal. 2016, 120, 1–9. [Google Scholar] [CrossRef]
- Gimeno, A.; Reichardt, N.-C.; Cañada, F.J.; Perkams, L.; Unverzagt, C.; Jiménez-Barbero, J.; Ardá, A. NMR and Molecular Recognition of N-Glycans: Remote Modifications of the Saccharide Chain Modulate Binding Features. ACS Chem. Biol. 2017, 12, 1104–1112. [Google Scholar] [CrossRef] [PubMed]
- Palivec, V.; Bour, P.; Jungwirth, P.; Kaminsky, J.; Martinez-Seara, H. Obtaining 3D Atomistic Structure of Saccharides from Raman/ROA/NMR Spectroscopic Techniques. Biophys. J. 2020, 118, 298a. [Google Scholar] [CrossRef]
- Emwas, A.-H.; Roy, R.; McKay, R.T.; Tenori, L.; Saccenti, E.; Gowda, G.A.N.; Raftery, D.; Alahmari, F.; Jaremko, L.; Jaremko, M.; et al. NMR Spectroscopy for Metabolomics Research. Metabolites 2019, 9, 123. [Google Scholar] [CrossRef] [PubMed] [Green Version]
- Emwas, A.-H.M. The Strengths and Weaknesses of NMR Spectroscopy and Mass Spectrometry with Particular Focus on Metabolomics Research. In Metabonomics: Methods and Protocols; Methods in Molecular Biology; Bjerrum, J.T., Ed.; Humana Press: New York, NY, USA, 2015; Volume 1277, pp. 161–193. ISBN 978-1-4939-2377-9. [Google Scholar]
- Krafcikova, M.; Dzatko, S.; Caron, C.; Granzhan, A.; Fiala, R.; Loja, T.; Teulade-Fichou, M.-P.; Fessl, T.; Hänsel-Hertsch, R.; Mergny, J.-L.; et al. Monitoring DNA–Ligand Interactions in Living Human Cells Using NMR Spectroscopy. J. Am. Chem. Soc. 2019, 141, 13281–13285. [Google Scholar] [CrossRef] [Green Version]
- Overall, S.A.; Zhu, S.; Hanssen, E.; Separovic, F.; Sani, M.-A. In Situ Monitoring of Bacteria under Antimicrobial Stress Using 31P Solid-State NMR. Int. J. Mol. Sci. 2019, 20, 181. [Google Scholar] [CrossRef] [Green Version]
- Kay, L.E. NMR studies of protein structure and dynamics. J. Magn. Reson. 2011, 213, 477–491. [Google Scholar] [CrossRef]
- Shockcor, J.P.; Unger, S.E.; Wilson, I.D.; Foxall, P.J.D.; Nicholson, J.K.; Lindon, J.C. Combined HPLC, NMR Spectroscopy, and Ion-Trap Mass Spectrometry with Application to the Detection and Characterization of Xenobiotic and Endogenous Metabolites in Human Urine. Anal. Chem. 1996, 68, 4431–4435. [Google Scholar] [CrossRef]
- Al-Talla, Z.A.; Akrawi, S.H.; Tolley, L.T.; Sioud, S.H.; Zaater, M.F.; Emwas, A.-H.M. Bioequivalence assessment of two formulations of ibuprofen. Drug Des. Devel. Ther. 2011, 5, 427–433. [Google Scholar] [CrossRef] [Green Version]
- Corcoran, O.; Spraul, M. LC–NMR–MS in drug discovery. Drug Discov. Today 2003, 8, 624–631. [Google Scholar] [CrossRef]
- Tardivel, P.J.C.; Canlet, C.; Lefort, G.; Tremblay-Franco, M.; Debrauwer, L.; Concordet, D.; Servien, R. ASICS: An automatic method for identification and quantification of metabolites in complex 1D 1H-NMR spectra. Metabolomics 2017, 13, 109. [Google Scholar] [CrossRef] [Green Version]
- Cui, Q.; Lewis, I.A.; Hegeman, A.D.; Anderson, M.E.; Li, J.; Schulte, C.F.; Westler, W.M.; Eghbalnia, H.R.; Sussman, M.R.; Markley, J.L. Metabolite identification via the Madison Metabolomics Consortium Database. Nat. Biotechnol. 2008, 26, 162–164. [Google Scholar] [CrossRef] [PubMed]
- Cañueto, D.; Gómez, J.; Salek, R.M.; Correig, X.; Cañellas, N. rDolphin: A GUI R package for proficient automatic profiling of 1D 1H-NMR spectra of study datasets. Metabolomics 2018, 14, 24. [Google Scholar] [CrossRef] [PubMed]
- Lewis, I.A.; Schommer, S.C.; Markley, J.L. rNMR: Open source software for identifying and quantifying metabolites in NMR spectra. Magn. Reson. Chem. 2009, 47, S123–S126. [Google Scholar] [CrossRef] [PubMed]
- Cavanagh, J.; Fairbrother, W.J.; Palmer, A.G.; Rance, M.; Skelton, N.J. Chapter 3—experimental aspects of NMR spectroscopy. In Protein NMR Spectroscopy. Principles and Practice, 2nd ed.; Cavanagh, J., Fairbrother, W.J., Palmer, A.G., Rance, M., Skelton, N.J., Eds.; Academic Press: Burlington, MA, USA, 2007; pp. 114–270. ISBN 978-0-12-164491-8. [Google Scholar]
- Rule, G.S.; Hitchens, T.K. (Eds.) Practical Aspects of N-Dimensional Data Acquisition and Processing. In Fundamentals of Protein NMR Spectroscopy; Focus on Structural Biology; Springer: Dordrecht, The Netherlands, 2006; pp. 313–351. ISBN 978-1-4020-3500-5. [Google Scholar]
- Tsang-Lin, H.; Shaka, A.J. Water suppression that works. Excitation sculpting using arbitrary waveforms and pulsed field gradients. Water Suppr. Works Excit. Sculpt. Using Arbitr. Waveforms Pulsed Field Gradients 1995, 112, 275–279. [Google Scholar]
- Callihan, D.; West, J.; Kumar, S.; Schweitzer, B.I.; Logan, T.M. Simple, Distortion-Free Homonuclear Spectra of Peptides and Nucleic Acids in Water Using Excitation Sculpting. J. Magn. Reson. B 1996, 1, 82–85. [Google Scholar] [CrossRef] [PubMed]
- Hwang, T.L.; Shaka, A.J. Water Suppression That Works. Excitation Sculpting Using Arbitrary Wave-Forms and Pulsed-Field Gradients. J. Magn. Reson. A 1995, 112, 275–279. [Google Scholar] [CrossRef]
- Piotto, M.; Saudek, V.; Sklenár, V. Gradient-tailored excitation for single-quantum NMR spectroscopy of aqueous solutions. J. Biomol. NMR 1992, 2, 661–665. [Google Scholar] [CrossRef] [PubMed]
- Zheng, G.; Price, W.S. Solvent signal suppression in NMR. Prog. Nucl. Magn. Reson. Spectrosc. 2010, 267–288. [Google Scholar] [CrossRef]
- Levitt, M.H. Experiments on AX systems. In Spin Dynamics: Basics of Nuclear Magnetic Resonance; John Wiley & Son: Hoboken, NJ, USA, 2008; pp. 409–452. ISBN 978-0-470-51117-6. [Google Scholar]
- Doddrell, D.M.; Pegg, D.T.; Bendall, M.R. Distortionless enhancement of NMR signals by polarization transfer. J. Magn. Reson. 1969 1982, 48, 323–327. [Google Scholar] [CrossRef]
- Tsujimoto, T.; Yoshitomi, T.; Maruyama, T.; Yamamoto, Y.; Hakamatsuka, T.; Uchiyama, N. 13C-NMR-based metabolic fingerprinting of Citrus-type crude drugs. J. Pharm. Biomed. Anal. 2018, 161, 305–312. [Google Scholar] [CrossRef]
- Ye, T.; Mo, H.; Shanaiah, N.; Gowda, G.A.N.; Zhang, S.; Raftery, D. Chemoselective 15N Tag for Sensitive and High-Resolution Nuclear Magnetic Resonance Profiling of the Carboxyl-Containing Metabolome. Anal. Chem. 2009, 81, 4882–4888. [Google Scholar] [CrossRef] [PubMed] [Green Version]
- Tayyari, F.; Gowda, G.A.N.; Gu, H.; Raftery, D. 15N-Cholamine—A Smart Isotope Tag for Combining NMR- and MS-Based Metabolite Profiling. Anal. Chem. 2013, 85, 8715–8721. [Google Scholar] [CrossRef] [PubMed] [Green Version]
- Luo, J.; Zeng, Q.; Wu, K.; Lin, Y. Fast reconstruction of non-uniform sampling multidimensional NMR spectroscopy via a deep neural network. J. Magn. Reson. 2020, 317, 106772. [Google Scholar] [CrossRef]
- Rossi, P.; Xia, Y.; Khanra, N.; Veglia, G.; Kalodimos, C.G. 15N and 13C-SOFAST-HMQC editing enhances 3D-NOESY sensitivity in highly deuterated, selectively [1H,13C]-labeled proteins. J. Biomol. NMR 2016, 66, 259–271. [Google Scholar] [CrossRef]
- Emwas, A.-H.; Alghrably, M.; Al-Harthi, S.; Poulson, B.; Szczepski, K.; Chandra, K.; Jaremko, M. Chapter 5—New Advances in Fast Methods of 2D NMR Experiments. In Nuclear Magnetic Resonance; Khaneja, N., Ed.; IntechOpen: London, UK, 2019; pp. 83–106. ISBN 978-1-83880-420-6. [Google Scholar]
- Kovtunov, K.V.; Kovtunova, L.M.; Gemeinhardt, M.E.; Bukhtiyarov, A.V.; Gesiorski, J.; Bukhtiyarov, V.I.; Chekmenev, E.Y.; Koptyug, I.V.; Goodson, B.M. Heterogeneous Microtesla SABRE Enhancement of 15N NMR Signals. Angew. Chem. Int. Ed. 2017, 56, 10433–10437. [Google Scholar] [CrossRef]
- Kaplan, O.; van Zijl, P.C.M.; Cohen, J.S. Information from combined 1H and 31P NMR studies of cell extracts: Differences in metabolism between drug-sensitive and drug-resistant MCF-7 human breast cancer cells. Biochem. Biophys. Res. Commun. 1990, 169, 383–390. [Google Scholar] [CrossRef]
- Nunnally, R.L.; Bottomley, P.A. Assessment of pharmacological treatment of myocardial infarction by phosphorus-31 NMR with surface coils. Science 1981, 211, 177–180. [Google Scholar] [CrossRef] [PubMed]
- DeSilva, M.A.; Shanaiah, N.; Gowda, G.A.N.; Rosa-Pérez, K.; Hanson, B.A.; Raftery, D. Application of 31P NMR spectroscopy and chemical derivatization for metabolite profiling of lipophilic compounds in human serum. Magn. Reson. Chem. 2009, 47, S74–S80. [Google Scholar] [CrossRef] [PubMed] [Green Version]
- Carvalho, J.; Alves, S.; Castro, M.M.C.A.; Geraldes, C.F.G.C.; Queiroz, J.A.; Fonseca, C.P.; Cruz, C. Development of a bioreactor system for cytotoxic evaluation of pharmacological compounds in living cells using NMR spectroscopy. J. Pharmacol. Toxicol. Methods 2019, 95, 70–78. [Google Scholar] [CrossRef] [PubMed]
- Findeisen, M.; Berger, S. The organic set of NMR spectra. In 50 and More Essential NMR Experiments: A Detailed Guide; Wiley-VCH: Weinheim, Germany, 2013; pp. 11–16. ISBN 978-3-527-33694-4. [Google Scholar]
- Jeener, J.; Alewaeters, G. Pulse pair technique in high resolution NMR a reprint of the historical 1971 lecture notes on two-dimensional spectroscopy. Prog. Nucl. Magn. Reson. Spectrosc. 2016, 94–95, 75–80. [Google Scholar] [CrossRef]
- Reynolds, W.F.; Enríquez, R.G. Choosing the Best Pulse Sequences, Acquisition Parameters, Postacquisition Processing Strategies, and Probes for Natural Product Structure Elucidation by NMR Spectroscopy. J. Nat. Prod. 2002, 65, 221–244. [Google Scholar] [CrossRef] [PubMed]
- Lewis, P.; Kaltia, S.; Wähälä, K. The phase transfer catalysed synthesis of isoflavone-O-glucosides. J. Chem. Soc. Perkin 1 1998, 2481–2484. [Google Scholar] [CrossRef]
- Fontaine, X.L.R.; Kennedy, J.D.; Shaw, B.L.; Vila, J.M. Determination of the relative signs of 2J(31P–31P) in complexes of tungsten(0) and molybdenum(0) using two-dimensional [31P–31P]-COSY-45 nuclear magnetic resonance chemical shift correlation. J. Chem. Soc. Dalton Trans. 1987, 2401–2405. [Google Scholar] [CrossRef]
- Keeler, J. Two dimentional NMR. In Understanding NMR Spectroscopy; John Wiley & Sons: Hoboken, NJ, USA, 2011; pp. 139–162. ISBN 978-1-119-96493-3. [Google Scholar]
- Bingol, K.; Brüschweiler, R. Knowns and unknowns in metabolomics identified by multidimensional NMR and hybrid MS/NMR methods. Curr. Opin. Biotechnol. 2017, 43, 17–24. [Google Scholar] [CrossRef] [PubMed] [Green Version]
- Kingsley, P.B. Product operators, coherence pathways, and phase cycling. Part III: Phase cycling. Concepts Magn. Reson. 1995, 7, 167–192. [Google Scholar] [CrossRef]
- Bain, A.D.; Burton, I.W.; Reynolds, W.F. Artifacts in two-dimensional NMR. Prog. Nucl. Magn. Reson. Spectrosc. 1994, 26, 59–89. [Google Scholar] [CrossRef]
- Claridge, T.D.W. Chapter 6-Correlations through the Chemical Bond I: Homonuclear Shift Correlation. In High-Resolution NMR Techniques in Organic Chemistry, 3rd ed.; Claridge, T.D.W., Ed.; Elsevier: Amsterdam, The Netherlands, 2016; pp. 203–241. ISBN 978-0-08-099986-9. [Google Scholar]
- Coote, P.; Bermel, W.; Wagner, G.; Arthanari, H. Analytical optimization of active bandwidth and quality factor for TOCSY experiments in NMR spectroscopy. J. Biomol. NMR 2016, 66, 9–20. [Google Scholar] [CrossRef] [PubMed] [Green Version]
- MacKinnon, N.; While, P.T.; Korvink, J.G. Novel selective TOCSY method enables NMR spectral elucidation of metabolomic mixtures. J. Magn. Reson. 2016, 272, 147–157. [Google Scholar] [CrossRef]
- Thrippleton, M.J.; Keeler, J. Elimination of Zero-Quantum Interference in Two-Dimensional NMR Spectra. Angew. Chem. Int. Ed. 2003, 42, 3938–3941. [Google Scholar] [CrossRef]
- Li, Z.-Y.; Ding, L.-L.; Li, J.-M.; Xu, B.-L.; Yang, L.; Bi, K.-S.; Wang, Z.-T. 1H-NMR and MS Based Metabolomics Study of the Intervention Effect of Curcumin on Hyperlipidemia Mice Induced by High-Fat Diet. PLoS ONE 2015, 10. [Google Scholar] [CrossRef] [Green Version]
- Jiang, L.; Lee, S.C.; Ng, T.C. Pharmacometabonomics Analysis Reveals Serum Formate and Acetate Potentially Associated with Varying Response to Gemcitabine-Carboplatin Chemotherapy in Metastatic Breast Cancer Patients. J. Proteome Res. 2018, 17, 1248–1257. [Google Scholar] [CrossRef] [PubMed]
- Vermathen, M.; Paul, L.E.H.; Diserens, G.; Vermathen, P.; Furrer, J. 1H HR-MAS NMR Based Metabolic Profiling of Cells in Response to Treatment with a Hexacationic Ruthenium Metallaprism as Potential Anticancer Drug. PLoS ONE 2015, 10. [Google Scholar] [CrossRef] [PubMed] [Green Version]
- Powder-George, Y.; Frank, J.; Ramsewak, R.S.; Reynolds, W.F. The Use of Coupled HSQC Spectra to Aid in Stereochemical Assignments of Molecules with Severe Proton Spectral Overlap. Phytochem. Anal. 2012, 23, 274–277. [Google Scholar] [CrossRef] [PubMed]
- Parkinson, J.A. Chapter 2—NMR Spectroscopy Methods in Metabolic Phenotyping. In The Handbook of Metabolic Phenotyping; Lindon, J.C., Nicholson, J.K., Holmes, E., Eds.; Elsevier: Amsterdam, The Netherlands, 2019; pp. 53–96. ISBN 978-0-12-812293-8. [Google Scholar]
- Claridge, T.D.W. High-Resolution NMR Techniques in Organic Chemistry; Elsevier: Cambridge, MA, USA, 2016; ISBN 978-0-08-099993-7. [Google Scholar]
- Hu, H.; Krishnamurthy, K. Doubly compensated multiplicity-edited HSQC experiments utilizing broadband inversion pulses. Magn. Reson. Chem. 2008, 46, 683–689. [Google Scholar] [CrossRef]
- Szakács, Z.; Sánta, Z. Chapter 7-NMR Methodological Overview. In Anthropic Awareness; Szántay, C., Ed.; Elsevier: Amsterdam, The Netherlands, 2015; pp. 257–289. ISBN 978-0-12-419963-7. [Google Scholar]
- Norwood, T.J. Product Operator Formalism in NMR. In Encyclopedia of Spectroscopy and Spectrometry; Lindon, J.C., Ed.; Academic Press: Oxford, UK, 1999; pp. 1875–1884. ISBN 978-0-12-226680-5. [Google Scholar]
- De Castro, F.; Benedetti, M.; Antonaci, G.; Del Coco, L.; De Pascali, S.A.; Muscella, A.; Marsigliante, S.; Fanizzi, F.P. Response of Cisplatin Resistant Skov-3 Cells to [Pt(O,O′-Acac)(γ-Acac)(DMS)] Treatment Revealed by a Metabolomic 1H-NMR Study. Molecules 2018, 23, 2301. [Google Scholar] [CrossRef] [Green Version]
- Mandal, P.K.; Majumdar, A. A comprehensive discussion of HSQC and HMQC pulse sequences. Concepts Magn. Reson. Part A 2004, 20A, 1–23. [Google Scholar] [CrossRef]
- Caytan, E.; Ligny, R.; Carpentier, J.-F.; Guillaume, S.M. Evaluation of Band-Selective HSQC and HMBC: Methodological Validation on the Cyclosporin Cyclic Peptide and Application for Poly(3-hydroxyalkanoate)s Stereoregularity Determination. Polymers 2018, 10, 533. [Google Scholar] [CrossRef] [Green Version]
- Airoldi, C.; Merlo, S.; Sironi, E. Chapter 4—NMR Molecular Recognition Studies for the Elucidation of Protein and Nucleic Acid Structure and Function. In Applications of NMR Spectroscopy; ur-Rahman, A., Choudhary, M.I., Eds.; Elsevier: Amsterdam, The Netherlands, 2015; pp. 147–219. ISBN 978-1-60805-999-7. [Google Scholar]
- Xia, J.; Bjorndahl, T.C.; Tang, P.; Wishart, D.S. MetaboMiner–semi-automated identification of metabolites from 2D NMR spectra of complex biofluids. BMC Bioinform. 2008, 9, 507. [Google Scholar] [CrossRef] [Green Version]
- Hansen, D.F.; Vallurupalli, P.; Kay, L.E. An Improved 15N Relaxation Dispersion Experiment for the Measurement of Millisecond Time-Scale Dynamics in Proteins. J. Phys. Chem. B 2008, 112, 5898–5904. [Google Scholar] [CrossRef]
- Mulder, F.A.A.; Spronk, C.A.E.M.; Slijper, M.; Kaptein, R.; Boelens, R. Improved HSQC experiments for the observation of exchange broadened signals. J. Biomol. NMR 1996, 8, 223–228. [Google Scholar] [CrossRef]
- Wallmeier, J.; Samol, C.; Ellmann, L.; Zacharias, H.U.; Vogl, F.C.; Garcia, M.; Dettmer, K.; Oefner, P.J.; Gronwald, W. Quantification of Metabolites by NMR Spectroscopy in the Presence of Protein. J. Proteome Res. 2017, 16, 1784–1796. [Google Scholar] [CrossRef] [PubMed]
- Cavanagh, J.; Fairbrother, W.J.; Palmer, A.G.; Rance, M.; Skelton, N.J. Chapter 5—relaxation and dynamic processes. In Protein NMR Spectroscopy. Principles and Practice, 2nd ed.; Cavanagh, J., Fairbrother, W.J., Palmer, A.G., Rance, M., Skelton, N.J., Eds.; Academic Press: Burlington, MA, USA, 2007; pp. 333–404. ISBN 978-0-12-164491-8. [Google Scholar]
- Teng, Q. Basic Principles of NMR. In Structural Biology: Practical NMR Applications; Springer: New York, NY, USA, 2013; pp. 1–65. ISBN 978-1-4614-3963-9. [Google Scholar]
- Macomber, R.S. A Complete Introduction to Modern Nmr Spectroscopy; John Wiley & Sons: New York, NY, USA, 1998; ISBN 0-471-15736-8. [Google Scholar]
- Pellecchia, M.; Sem, D.S.; Wüthrich, K. NMR in drug discovery. Nat. Rev. Drug Discov. 2002, 1, 211–219. [Google Scholar] [CrossRef] [PubMed]
- Liu, M.; Nicholson, J.K.; Lindon, J.C. High-Resolution Diffusion and Relaxation Edited One- and Two-Dimensional 1H-NMR Spectroscopy of Biological Fluids. Anal. Chem. 1996, 68, 3370–3376. [Google Scholar] [CrossRef] [PubMed]
- Vold, R.L.; Waugh, J.S.; Klein, M.P.; Phelps, D.E. Measurement of Spin Relaxation in Complex Systems. J. Chem. Phys. 1968, 48, 3831–3832. [Google Scholar] [CrossRef] [Green Version]
- Balci, M. 15—Multiple-Pulse NMR Experiments. In Basic 1H- and 13C-NMR Spectroscopy; Balci, M., Ed.; Elsevier Science: Amsterdam, The Netherlands, 2005; pp. 339–375. ISBN 978-0-444-51811-8. [Google Scholar]
- Smith, P.E.S.; Donovan, K.J.; Szekely, O.; Baias, M.; Frydman, L. Ultrafast NMR T1 Relaxation Measurements: Probing Molecular Properties in Real Time. Chem. Phys. Chem. 2013, 14, 3138–3145. [Google Scholar] [CrossRef] [PubMed]
- Wang, H.; Zhao, M.; Ackerman, J.L.; Song, Y. Saturation-inversion-recovery: A method for T1 measurement. J. Magn. Reson. 2017, 274, 137–143. [Google Scholar] [CrossRef] [Green Version]
- Günther, H. Chapter 8—The Physical Basis of the Nuclear Magnetic Resonance Experiment. Part II: Pulse and Fourier-Transform NMR. In NMR Spectroscopy: Basic Principles, Concepts and Applications in Chemistry; Wiley-VCH: Weinheim, Germany, 2013; pp. 233–280. ISBN 978-3-527-67477-0. [Google Scholar]
- Figueroa-Villar, J.D.; Tinoco, L.W. Spin-Lattice Relaxation Time in Drug Discovery and Design. Curr. Top. Med. Chem. 2009, 9, 811–823. [Google Scholar] [CrossRef]
- Maity, S.; Gundampati, R.K.; Suresh Kumar, T.K. NMR Methods to Characterize Protein-Ligand Interactions. Nat. Prod. Commun. 2019, 14. [Google Scholar] [CrossRef] [Green Version]
- Casu, M.; Puligheddu, S.; Saba, G.; Marincola, F.C.; Orellana, G.; Lai, A. The Interaction of DNA with Intercalating Agents Probed by Sodium-23 NMR Relaxation Rates. J. Biomol. Struct. Dyn. 1997, 15, 37–43. [Google Scholar] [CrossRef]
- Stockman, B.J.; Dalvit, C. NMR screening techniques in drug discovery and drug design. Prog. Nucl. Magn. Reson. Spectrosc. 2002, 41, 187–231. [Google Scholar] [CrossRef]
- Hajduk, P.J.; Olejniczak, E.T.; Fesik, S.W. One-Dimensional Relaxation- and Diffusion-Edited NMR Methods for Screening Compounds That Bind to Macromolecules. J. Am. Chem. Soc. 1997, 119, 12257–12261. [Google Scholar] [CrossRef]
- Tang, H.; Wang, Y.; Nicholson, J.K.; Lindon, J.C. Use of relaxation-edited one-dimensional and two dimensional nuclear magnetic resonance spectroscopy to improve detection of small metabolites in blood plasma. Anal. Biochem. 2004, 325, 260–272. [Google Scholar] [CrossRef]
- Jaremko, Ł.; Jaremko, M.; Nowakowski, M.; Ejchart, A. The Quest for Simplicity: Remarks on the Free-Approach Models. J. Phys. Chem. B 2015, 119, 11978–11987. [Google Scholar] [CrossRef] [PubMed]
- Jaremko, Ł.; Jaremko, M.; Ejchart, A.; Nowakowski, M. Fast evaluation of protein dynamics from deficient 15N relaxation data. J. Biomol. NMR 2018, 70, 219–228. [Google Scholar] [CrossRef] [PubMed] [Green Version]
- Carr, H.Y.; Purcell, E.M. Effects of Diffusion on Free Precession in Nuclear Magnetic Resonance Experiments. Phys. Rev. 1954, 94, 630–638. [Google Scholar] [CrossRef]
- Meiboom, S.; Gill, D. Modified Spin-Echo Method for Measuring Nuclear Relaxation Times. Rev. Sci. Instrum. 1958, 29, 688–691. [Google Scholar] [CrossRef] [Green Version]
- Kowalewski, J.; Maler, L. Measuring T1 and T2 Relaxation Rates. In Nuclear Spin Relaxation in Liquids: Theory, Experiments, and Applications, 2nd ed.; CRC Press: Boca Raton, FL, USA, 2017; pp. 139–152. ISBN 978-1-351-26459-4. [Google Scholar]
- Baldwin, A.J. An exact solution for R2, eff in CPMG experiments in the case of two site chemical exchange. J. Magn. Reson. 2014, 244, 114–124. [Google Scholar] [CrossRef] [Green Version]
- Hajduk, P.J.; Meadows, R.P.; Fesik, S.W. NMR-based screening in drug discovery. Q. Rev. Biophys. 1999, 32, 211–240. [Google Scholar] [CrossRef]
- Mladenov, G.; Dimitrov, V.S. Extraction of T2 from NMR linewidths in simple spin systems by use of reference deconvolution. Magn. Reson. Chem. 2001, 39, 672–680. [Google Scholar] [CrossRef]
- Ghosh, S.; Sengupta, A.; Chandra, K. Quantitative metabolic profiling of NMR spectral signatures of branched chain amino acids in blood serum. Amino Acids 2015, 47, 2229–2236. [Google Scholar] [CrossRef]
- Ruan, L.-Y.; Fan, J.-T.; Hong, W.; Zhao, H.; Li, M.-H.; Jiang, L.; Fu, Y.-H.; Xing, Y.-X.; Chen, C.; Wang, J.-S. Isoniazid-induced hepatotoxicity and neurotoxicity in rats investigated by 1H-NMR based metabolomics approach. Toxicol. Lett. 2018, 295, 256–269. [Google Scholar] [CrossRef] [PubMed]
- Jung, J.; Park, M.; Park, H.J.; Shim, S.B.; Cho, Y.H.; Kim, J.; Lee, H.-S.; Ryu, D.H.; Choi, D.; Hwang, G.-S. 1H-NMR-based metabolic profiling of naproxen-induced toxicity in rats. Toxicol. Lett. 2011, 200, 1–7. [Google Scholar] [CrossRef] [PubMed]
- Ryu, S.H.; Lee, J.D.; Kim, J.W.; Kim, S.; Kim, S.; Kim, K.-B. 1H-NMR toxicometabolomics following cisplatin-induced nephrotoxicity in male rats. J. Toxicol. Sci. 2019, 44, 57–71. [Google Scholar] [CrossRef] [PubMed] [Green Version]
- Li, Y.; Man, S.; Li, J.; Chai, H.; Fan, W.; Liu, Z.; Gao, W. The antitumor effect of formosanin C on HepG2 cell as revealed by 1H-NMR based metabolic profiling. Chem. Biol. Interact. 2014, 220, 193–199. [Google Scholar] [CrossRef]
- Sun, Y.-J.; Wang, H.-P.; Liang, Y.-J.; Yang, L.; Li, W.; Wu, Y.-J. An NMR-based metabonomic investigation of the subacute effects of melamine in rats. J. Proteome Res. 2012, 11, 2544–2550. [Google Scholar] [CrossRef]
- Sweeney, S.R.; Kavanaugh, A.; Lodi, A.; Wang, B.; Boyle, D.; Tiziani, S.; Guma, M. Metabolomic profiling predicts outcome of rituximab therapy in rheumatoid arthritis. RMD Open 2016, 2, e000289. [Google Scholar] [CrossRef] [Green Version]
- Al Zweiri, M.; Sills, G.J.; Leach, J.P.; Brodie, M.J.; Robertson, C.; Watson, D.G.; Parkinson, J.A. Response to drug treatment in newly diagnosed epilepsy: A pilot study of 1H-NMR- and MS-based metabonomic analysis. Epilepsy Res. 2010, 88, 189–195. [Google Scholar] [CrossRef]
- Maulidiani; Abas, F.; Khatib, A.; Perumal, V.; Suppaiah, V.; Ismail, A.; Hamid, M.; Shaari, K.; Lajis, N.H. Metabolic alteration in obese diabetes rats upon treatment with Centella asiatica extract. J. Ethnopharmacol. 2016, 180, 60–69. [Google Scholar] [CrossRef]
- Raj, V.; Bhadauria, A.S.; Singh, A.K.; Kumar, U.; Rai, A.; Keshari, A.K.; Kumar, P.; Kumar, D.; Maity, B.; Nath, S.; et al. Novel 1,3,4-thiadiazoles inhibit colorectal cancer via blockade of IL-6/COX-2 mediated JAK2/STAT3 signals as evidenced through data-based mathematical modeling. Cytokine 2019, 118, 144–159. [Google Scholar] [CrossRef]
- Liu, C.-C.; Wu, Y.-F.; Feng, G.-M.; Gao, X.-X.; Zhou, Y.-Z.; Hou, W.-J.; Qin, X.-M.; Du, G.-H.; Tian, J.-S. Plasma-metabolite-biomarkers for the therapeutic response in depressed patients by the traditional Chinese medicine formula Xiaoyaosan: A 1H-NMR-based metabolomics approach. J. Affect. Disord. 2015, 185, 156–163. [Google Scholar] [CrossRef]
- Tan, G.; Liao, W.; Dong, X.; Yang, G.; Zhu, Z.; Li, W.; Chai, Y.; Lou, Z. Metabonomic Profiles Delineate the Effect of Traditional Chinese Medicine Sini Decoction on Myocardial Infarction in Rats. PLoS ONE 2012, 7. [Google Scholar] [CrossRef] [PubMed] [Green Version]
- Mason, S.; Reinecke, C.J.; Solomons, R.; Wevers, R.A.; Engelke, U.F.H. 1H-NMR spectral identification of medication in cerebrospinal fluid of pediatric meningitis. J. Pharm. Biomed. Anal. 2017, 143, 56–61. [Google Scholar] [CrossRef] [PubMed]
- Tian, J.-S.; Zhao, L.; Shen, X.-L.; Liu, H.; Qin, X.-M. 1H-NMR-based metabolomics approach to investigating the renal protective effects of Genipin in diabetic rats. Chin. J. Nat. Med. 2018, 16, 261–270. [Google Scholar] [CrossRef]
- Kim, K.-B.; Yang, J.-Y.; Kwack, S.J.; Kim, H.S.; Ryu, D.H.; Kim, Y.-J.; Bae, J.Y.; Lim, D.S.; Choi, S.M.; Kwon, M.J.; et al. Potential metabolomic biomarkers for evaluation of adriamycin efficacy using a urinary 1H-NMR spectroscopy. J. Appl. Toxicol. 2013, 33, 1251–1259. [Google Scholar] [CrossRef] [PubMed]
- Rawat, A.; Dubey, D.; Guleria, A.; Kumar, U.; Keshari, A.K.; Chaturvedi, S.; Prakash, A.; Saha, S.; Kumar, D. 1H-NMR-based serum metabolomics reveals erythromycin-induced liver toxicity in albino Wistar rats. J. Pharm. Bioallied Sci. 2016, 8, 327–334. [Google Scholar] [CrossRef]
- Sun, B.; Wang, X.; Cao, R.; Zhang, Q.; Liu, Q.; Xu, M.; Zhang, M.; Du, X.; Dong, F.; Yan, X. NMR-based metabonomics study on the effect of Gancao in the attenuation of toxicity in rats induced by Fuzi. J. Ethnopharmacol. 2016, 193, 617–626. [Google Scholar] [CrossRef] [PubMed]
- Singh, M.; Tam, B.; Akabayov, B. NMR-Fragment Based Virtual Screening: A Brief Overview. Molecules 2018, 23, 233. [Google Scholar] [CrossRef] [Green Version]
- Shuker, S.B.; Hajduk, P.J.; Meadows, R.P.; Fesik, S.W. Discovering High-Affinity Ligands for Proteins: SAR by NMR. Science 1996, 274, 1531–1534. [Google Scholar] [CrossRef]
- Romasanta, A.K.S.; van der Sijde, P.; Hellsten, I.; Hubbard, R.E.; Keseru, G.M.; van Muijlwijk-Koezen, J.; de Esch, I.J.P. When fragments link: A bibliometric perspective on the development of fragment-based drug discovery. Drug Discov. Today 2018, 23, 1596–1609. [Google Scholar] [CrossRef]
- van Montfort, R.L.M.; Workman, P.; Lamoree, B.; Hubbard, R.E. Current perspectives in fragment-based lead discovery (FBLD). Essays Biochem. 2017, 61, 453–464. [Google Scholar] [CrossRef]
- Szymański, P.; Markowicz, M.; Mikiciuk-Olasik, E. Adaptation of High-Throughput Screening in Drug Discovery—Toxicological Screening Tests. Int. J. Mol. Sci. 2012, 13, 427–452. [Google Scholar] [CrossRef] [PubMed] [Green Version]
- Martis, E.A.; Radhakrishnan, R.; Badve, R.R. High-throughput screening: The hits and leads of drug discovery-An overview. J. Appl. Pharm. Sci. 2011, 1, 2–10. [Google Scholar]
- Lightbody, G.; Haberland, V.; Browne, F.; Taggart, L.; Zheng, H.; Parkes, E.; Blayney, J.K. Review of applications of high-throughput sequencing in personalized medicine: Barriers and facilitators of future progress in research and clinical application. Brief. Bioinform. 2019, 20, 1795–1811. [Google Scholar] [CrossRef] [PubMed]
- Zhu, Z.; Cuozzo, J. Review Article: High-Throughput Affinity-Based Technologies for Small-Molecule Drug Discovery. J. Biomol. Screen. 2009, 14, 1157–1164. [Google Scholar] [CrossRef] [Green Version]
- Keserű, G.M.; Erlanson, D.A.; Ferenczy, G.G.; Hann, M.M.; Murray, C.W.; Pickett, S.D. Design Principles for Fragment Libraries: Maximizing the Value of Learnings from Pharma Fragment-Based Drug Discovery (FBDD) Programs for Use in Academia. J. Med. Chem. 2016, 59, 8189–8206. [Google Scholar] [CrossRef] [Green Version]
- Shi, Y.; von Itzstein, M. How Size Matters: Diversity for Fragment Library Design. Molecules 2019, 24, 2838. [Google Scholar] [CrossRef] [Green Version]
- Fox, S.; Farr-Jones, S.; Sopchak, L.; Boggs, A.; Nicely, H.W.; Khoury, R.; Biros, M. High-Throughput Screening: Update on Practices and Success. J. Biomol. Screen. 2006, 11, 864–869. [Google Scholar] [CrossRef] [Green Version]
- Clare, R.H.; Bardelle, C.; Harper, P.; Hong, W.D.; Börjesson, U.; Johnston, K.L.; Collier, M.; Myhill, L.; Cassidy, A.; Plant, D.; et al. Industrial scale high-throughput screening delivers multiple fast acting macrofilaricides. Nat. Commun. 2019, 10, 1–8. [Google Scholar] [CrossRef]
- Mballo, C.; Makarenkov, V. Virtual High Throughput Screening Using Machine Learning Methods. In Proceedings of the Classification as a Tool for Research, Dresden, Germany, 13–18 March 2009; Locarek-Junge, H., Weihs, C., Eds.; Springer: Berlin, Germany, 2010; pp. 517–524. [Google Scholar]
- Erlanson, D.A. Introduction to Fragment-Based Drug Discovery. In Fragment-Based Drug Discovery and X-Ray Crystallography; Topics in Current Chemistry; Davies, T.G., Hyvönen, M., Eds.; Springer: Berlin, Germany, 2012; Volume 317, pp. 1–32. ISBN 978-3-642-27540-1. [Google Scholar]
- Keserü, G.M.; Makara, G.M. The influence of lead discovery strategies on the properties of drug candidates. Nat. Rev. Drug Discov. 2009, 8, 203–212. [Google Scholar] [CrossRef]
- Robson-Tull, J. Biophysical screening in fragment-based drug design: A brief overview. Biosci. Horiz. Int. J. Stud. Res. 2018, 11. [Google Scholar] [CrossRef] [Green Version]
- Pellecchia, M. High-Throughput Screening and Fragment-Based Design: General Considerations for Lead Discovery and Optimization. In NMR of Biomolecules: Towards Mechanistic Systems Biology; Bertini, I., McGreevy, K.S., Parigi, G., Eds.; Wiley-VCH: Weinheim, Germany, 2012; pp. 253–263. ISBN 978-3-527-64450-6. [Google Scholar]
- Campos-Olivas, R. NMR Screening and Hit Validation in Fragment Based Drug Discovery. Curr. Top. Med. Chem. 2011, 11, 43–67. [Google Scholar] [CrossRef] [PubMed]
- Murray, C.W.; Blundell, T.L. Structural biology in fragment-based drug design. Curr. Opin. Struct. Biol. 2010, 20, 497–507. [Google Scholar] [CrossRef] [PubMed]
- Harner, M.J.; Frank, A.O.; Fesik, S.W. Fragment-Based Drug Discovery Using NMR Spectroscopy. J. Biomol. NMR 2013, 56, 65–75. [Google Scholar] [CrossRef] [PubMed] [Green Version]
- Lepre, C.A. Chapter Nine—Practical Aspects of NMR-Based Fragment Screening. In Methods in Enzymology; Fragment-Based Drug Design; Kuo, L.C., Ed.; Academic Press: San Diego, CA, USA, 2011; Volume 493, pp. 219–239. [Google Scholar]
- Klages, J.; Coles, M.; Kessler, H. NMR-based screening: A powerful tool in fragment-based drug discovery. Analyst 2007, 132, 692–705. [Google Scholar] [CrossRef] [PubMed]
- Gossert, A.D.; Jahnke, W. NMR in drug discovery: A practical guide to identification and validation of ligands interacting with biological macromolecules. Prog. Nucl. Magn. Reson. Spectrosc. 2016, 97, 82–125. [Google Scholar] [CrossRef] [PubMed]
- Coyle, J.; Walser, R. Applied Biophysical Methods in Fragment-Based Drug Discovery. SLAS Discov. Adv. Sci. Drug Discov. 2020, 25, 471–490. [Google Scholar] [CrossRef] [PubMed]
- Kirsch, P.; Hartman, A.M.; Hirsch, A.K.H.; Empting, M. Concepts and Core Principles of Fragment-Based Drug Design. Molecules 2019, 24, 4309. [Google Scholar] [CrossRef] [Green Version]
- Li, Q. Application of Fragment-Based Drug Discovery to Versatile Targets. Front. Mol. Biosci. 2020, 7. [Google Scholar] [CrossRef]
- Mashalidis, E.H.; Śledź, P.; Lang, S.; Abell, C. A three-stage biophysical screening cascade for fragment-based drug discovery. Nat. Protoc. 2013, 8, 2309–2324. [Google Scholar] [CrossRef]
- Blundell, T.L. Protein crystallography and drug discovery: Recollections of knowledge exchange between academia and industry. IUCrJ 2017, 4, 308–321. [Google Scholar] [CrossRef]
- Erlanson, D.A.; Fesik, S.W.; Hubbard, R.E.; Jahnke, W.; Jhoti, H. Twenty years on: The impact of fragments on drug discovery. Nat. Rev. Drug Discov. 2016, 15, 605–619. [Google Scholar] [CrossRef] [PubMed]
- Hughes, T.; Baldwin, I.; Churcher, I. Fragment-based drug discovery—From hit discovery to FDA approval: Lessons learned and future challenge. Int. Drug Discov. 2011, 6, 34. [Google Scholar]
- Bollag, G.; Tsai, J.; Zhang, J.; Zhang, C.; Ibrahim, P.; Nolop, K.; Hirth, P. Vemurafenib: The first drug approved for BRAF -mutant cancer. Nat. Rev. Drug Discov. 2012, 11, 873–886. [Google Scholar] [CrossRef] [PubMed]
- Juárez-Salcedo, L.M.; Desai, V.; Dalia, S. Venetoclax: Evidence to date and clinical potential. Drugs Context 2019, 8. [Google Scholar] [CrossRef] [PubMed]
- Chen, H.; Zhou, X.; Gao, Y.; Chen, H.; Zhou, J. Fragment-based drug design: Strategic advances and lessons learned. Drug Discov. Technol. 2017, 212–232. [Google Scholar] [CrossRef]
- Bancet, A.; Raingeval, C.; Lomberget, T.; Le Borgne, M.; Guichou, J.-F.; Krimm, I. Fragment Linking Strategies for Structure-Based Drug Design. J. Med. Chem. 2020. [Google Scholar] [CrossRef]
- Fairbrother, W.J.; Leverson, J.D.; Sampath, D.; Souers, A.J. Discovery and Development of Venetoclax, a Selective Antagonist of BCL-2. In Successful Drug Discovery; John Wiley & Sons: Hoboken, NJ, USA, 2019; pp. 225–245. ISBN 978-3-527-81469-5. [Google Scholar]
- Oltersdorf, T.; Elmore, S.W.; Shoemaker, A.R.; Armstrong, R.C.; Augeri, D.J.; Belli, B.A.; Bruncko, M.; Deckwerth, T.L.; Dinges, J.; Hajduk, P.J.; et al. An inhibitor of Bcl-2 family proteins induces regression of solid tumours. Nature 2005, 435, 677–681. [Google Scholar] [CrossRef]
- Muchmore, S.W.; Sattler, M.; Liang, H.; Meadows, R.P.; Harlan, J.E.; Yoon, H.S.; Nettesheim, D.; Chang, B.S.; Thompson, C.B.; Wong, S.-L.; et al. X-ray and NMR structure of human Bcl-x L, an inhibitor of programmed cell death. Nature 1996, 381, 335–341. [Google Scholar] [CrossRef]
- Hortobagyi, G.N. Ribociclib for the first-line treatment of advanced hormone receptor-positive breast cancer: A review of subgroup analyses from the MONALEESA-2 trial. Breast Cancer Res. 2018, 20, 123. [Google Scholar] [CrossRef] [Green Version]
- Merry, T.L.; Brooks, A.E.S.; Masson, S.W.; Adams, S.E.; Jaiswal, J.K.; Jamieson, S.M.F.; Shepherd, P.R. The CSF1 receptor inhibitor pexidartinib (PLX3397) reduces tissue macrophage levels without affecting glucose homeostasis in mice. Int. J. Obes. 2020, 44, 245–253. [Google Scholar] [CrossRef]
- Tap, W.D.; Wainberg, Z.A.; Anthony, S.P.; Ibrahim, P.N.; Zhang, C.; Healey, J.H.; Chmielowski, B.; Staddon, A.P.; Cohn, A.L.; Shapiro, G.I.; et al. Structure-Guided Blockade of CSF1R Kinase in Tenosynovial Giant-Cell Tumor. N. Engl. J. Med. 2015, 373, 428–437. [Google Scholar] [CrossRef] [PubMed] [Green Version]
- Smith, C.C.; Zhang, C.; Lin, K.C.; Lasater, E.A.; Zhang, Y.; Massi, E.; Damon, L.E.; Pendleton, M.; Bashir, A.; Sebra, R.; et al. Characterizing and Overriding the Structural Mechanism of the Quizartinib-Resistant FLT3 “Gatekeeper” F691L Mutation with PLX3397. Cancer Discov. 2015, 5, 668–679. [Google Scholar] [CrossRef] [PubMed] [Green Version]
- Thaisrivongs, D.A.; Morris, W.J.; Scott, J.D. Discovery and Chemical Development of Verubecestat, a BACE1 Inhibitor for the Treatment of Alzheimer’s Disease. In Complete Accounts of Integrated Drug Discovery and Development: Recent Examples from the Pharmaceutical Industry Volume 1; ACS Symposium Series; American Chemical Society: Washington, DC, USA, 2018; Volume 1307, pp. 53–89. ISBN 978-0-8412-3398-0. [Google Scholar]
- Scott, J.D.; Li, S.W.; Brunskill, A.P.J.; Chen, X.; Cox, K.; Cumming, J.N.; Forman, M.; Gilbert, E.J.; Hodgson, R.A.; Hyde, L.A.; et al. Discovery of the 3-Imino-1,2,4-thiadiazinane 1,1-Dioxide Derivative Verubecestat (MK-8931)–A β-Site Amyloid Precursor Protein Cleaving Enzyme 1 Inhibitor for the Treatment of Alzheimer’s Disease. J. Med. Chem. 2016, 59, 10435–10450. [Google Scholar] [CrossRef] [PubMed]
- Murray, C.W.; Carr, M.G.; Callaghan, O.; Chessari, G.; Congreve, M.; Cowan, S.; Coyle, J.E.; Downham, R.; Figueroa, E.; Frederickson, M.; et al. Fragment-Based Drug Discovery Applied to Hsp90. Discovery of Two Lead Series with High Ligand Efficiency. J. Med. Chem. 2010, 53, 5942–5955. [Google Scholar] [CrossRef] [PubMed]
- Woodhead, A.J.; Angove, H.; Carr, M.G.; Chessari, G.; Congreve, M.; Coyle, J.E.; Cosme, J.; Graham, B.; Day, P.J.; Downham, R.; et al. Discovery of (2,4-Dihydroxy-5-isopropylphenyl)-[5-(4-methylpiperazin-1-ylmethyl)-1,3-dihydroisoindol-2-yl]methanone (AT13387), a Novel Inhibitor of the Molecular Chaperone Hsp90 by Fragment Based Drug Design. J. Med. Chem. 2010, 53, 5956–5969. [Google Scholar] [CrossRef]
- Basarab, G.S.; Hill, P.J.; Garner, C.E.; Hull, K.; Green, O.; Sherer, B.A.; Dangel, P.B.; Manchester, J.I.; Bist, S.; Hauck, S.; et al. Optimization of Pyrrolamide Topoisomerase II Inhibitors Toward Identification of an Antibacterial Clinical Candidate (AZD5099). J. Med. Chem. 2014, 57, 6060–6082. [Google Scholar] [CrossRef]
- Lamoree, B.; Hubbard, R.E. Using Fragment-Based Approaches to Discover New Antibiotics. SLAS Discov. Adv. Sci. Drug Discov. 2018, 23, 495–510. [Google Scholar] [CrossRef] [Green Version]
- Wyatt, P.G.; Woodhead, A.J.; Berdini, V.; Boulstridge, J.A.; Carr, M.G.; Cross, D.M.; Davis, D.J.; Devine, L.A.; Early, T.R.; Feltell, R.E.; et al. Identification of N-(4-Piperidinyl)-4-(2,6-dichlorobenzoylamino)-1H-pyrazole-3-carboxamide (AT7519), a Novel Cyclin Dependent Kinase Inhibitor Using Fragment-Based X-Ray Crystallography and Structure Based Drug Design. J. Med. Chem. 2008, 51, 4986–4999. [Google Scholar] [CrossRef]
- Dolman, M.E.M.; Poon, E.; Ebus, M.E.; den Hartog, I.J.M.; van Noesel, C.J.M.; Jamin, Y.; Hallsworth, A.; Robinson, S.P.; Petrie, K.; Sparidans, R.W.; et al. Cyclin-Dependent Kinase Inhibitor AT7519 as a Potential Drug for MYCN-Dependent Neuroblastoma. Clin. Cancer Res. 2015, 21, 5100–5109. [Google Scholar] [CrossRef] [Green Version]
- Squires, M.S.; Feltell, R.E.; Wallis, N.G.; Lewis, E.J.; Smith, D.-M.; Cross, D.M.; Lyons, J.F.; Thompson, N.T. Biological characterization of AT7519, a small-molecule inhibitor of cyclin-dependent kinases, in human tumor cell lines. Mol. Cancer Ther. 2009, 8, 324–332. [Google Scholar] [CrossRef] [Green Version]
- Hazlitt, R.A.; Teitz, T.; Bonga, J.D.; Fang, J.; Diao, S.; Iconaru, L.; Yang, L.; Goktug, A.N.; Currier, D.G.; Chen, T.; et al. Development of Second-Generation CDK2 Inhibitors for the Prevention of Cisplatin-Induced Hearing Loss. J. Med. Chem. 2018, 61, 7700–7709. [Google Scholar] [CrossRef] [PubMed]
- Erlanson, D. Practical Fragments: Fragments in the clinic: 2016 edition. Pract. Fragm. 2016, 489–499. [Google Scholar]
- Hajduk, P.J. SAR by NMR: Putting the Pieces Together. Mol. Interv. 2006, 6, 266. [Google Scholar] [CrossRef] [PubMed]
- Oschkinat, H. SAR-by-NMR. In Encyclopedia of Molecular Pharmacology; Offermanns, S., Rosenthal, W., Eds.; Springer: Berlin, Germany, 2008; pp. 1107–1109. ISBN 978-3-540-38918-7. [Google Scholar]
- Barile, E.; Pellecchia, M. NMR-Based Approaches for the Identification and Optimization of Inhibitors of Protein–Protein Interactions. Chem. Rev. 2014, 114, 4749–4763. [Google Scholar] [CrossRef]
- Hajduk, P.J.; Augeri, D.J.; Mack, J.; Mendoza, R.; Yang, J.; Betz, S.F.; Fesik, S.W. NMR-Based Screening of Proteins Containing 13C-Labeled Methyl Groups. J. Am. Chem. Soc. 2000, 122, 7898–7904. [Google Scholar] [CrossRef]
- Shortridge, M.D.; Hage, D.S.; Harbison, G.S.; Powers, R. Estimating Protein−Ligand Binding Affinity Using High-Throughput Screening by NMR. J. Comb. Chem. 2008, 10, 948–958. [Google Scholar] [CrossRef] [Green Version]
- Kang, C.; Gayen, S.; Wang, W.; Severin, R.; Chen, A.S.; Lim, H.A.; Chia, C.S.B.; Schüller, A.; Doan, D.N.P.; Poulsen, A.; et al. Exploring the binding of peptidic West Nile virus NS2B–NS3 protease inhibitors by NMR. Antiviral Res. 2013, 97, 137–144. [Google Scholar] [CrossRef]
- Chiou, J.W.; Fu, B.; Chou, R.-H.; Yu, C. Blocking the Interactions between Calcium-Bound S100A12 Protein and the V Domain of RAGE Using Tranilast. PLoS ONE 2016, 11. [Google Scholar] [CrossRef]
- Zech, S.G.; Olejniczak, E.; Hajduk, P.; Mack, J.; McDermott, A.E. Characterization of Protein−Ligand Interactions by High-Resolution Solid-State NMR Spectroscopy. J. Am. Chem. Soc. 2004, 126, 13948–13953. [Google Scholar] [CrossRef]
- Williamson, M.P. Using chemical shift perturbation to characterise ligand binding. Prog. Nucl. Magn. Reson. Spectrosc. 2013, 73, 1–16. [Google Scholar] [CrossRef]
- Jang, R.; Gao, X.; Li, M. Combining automated peak tracking in SAR by NMR with structure-based backbone assignment from 15N-NOESY. BMC Bioinform. 2012, 13, S4. [Google Scholar] [CrossRef] [PubMed] [Green Version]
- Rahman, A.U.; Choudhary, M.I. Atia-tul-Wahab Chapter 6—Nuclear Overhauser Effect. In Solving Problems with NMR Spectroscopy; Rahman, A., Choudhary, M.I., Wahab, A., Eds.; Academic Press: London, UK, 2016; pp. 227–264. ISBN 978-0-12-411589-7. [Google Scholar]
- Kumar, A.; Christy Rani Grace, R. Nuclear Overhauser Effect. In Encyclopedia of Spectroscopy and Spectrometry; Lindon, J.C., Ed.; Academic Press: Oxford, UK, 1999; pp. 1643–1653. ISBN 978-0-12-226680-5. [Google Scholar]
- Jones, C.R.; Butts, C.P.; Harvey, J.N. Accuracy in determining interproton distances using Nuclear Overhauser Effect data from a flexible molecule. Beilstein, J. Org. Chem. 2011, 7, 145–150. [Google Scholar] [CrossRef] [PubMed]
- Günther, H. Chapter 10—More 1D and 2D NMR Experiments: The Nuclear Overhauser Effect—Polarization Transfer–Spin Lock Experiments–3D NMR. In NMR Spectroscopy: Basic Principles, Concepts and Applications in Chemistry; Wiley-VCH: Weinheim, Germany, 2013; pp. 341–376. ISBN 978-3-527-67477-0. [Google Scholar]
- Venkitakrishnan, R.P.; Benard, O.; Max, M.; Markley, J.L.; Assadi-Porter, F.M. Use of NMR Saturation Transfer Difference Spectroscopy to Study Ligand Binding to Membrane Proteins. In Membrane Protein Structure and Dynamics: Methods and Protocols; Methods in Molecular Biology; Vaidehi, N., Klein-Seetharaman, J., Eds.; Humana Press: New York, NY, USA, 2012; pp. 47–63. ISBN 978-1-62703-023-6. [Google Scholar]
- Dalvit, C.; Fogliatto, G.; Stewart, A.; Veronesi, M.; Stockman, B. WaterLOGSY as a method for primary NMR screening: Practical aspects and range of applicability. J. Biomol. NMR 2001, 21, 349–359. [Google Scholar] [CrossRef] [PubMed]
- Mayer, M.; Meyer, B. Characterization of Ligand Binding by Saturation Transfer Difference NMR Spectroscopy. Angew. Chem. Int. Ed. 1999, 38, 1784–1788. [Google Scholar] [CrossRef]
- Klein, J.; Meinecke, R.; Mayer, M.; Meyer, B. Detecting Binding Affinity to Immobilized Receptor Proteins in Compound Libraries by HR-MAS STD NMR. J. Am. Chem. Soc. 1999, 121, 5336–5337. [Google Scholar] [CrossRef]
- Ludwig, C.; Guenther, U.L. Ligand based NMR methods for drug discovery. Front. Biosci. Landmark Ed. 2009, 14, 4565–4574. [Google Scholar] [CrossRef] [Green Version]
- Benie, A.J.; Moser, R.; Bäuml, E.; Blaas, D.; Peters, T. Virus-Ligand Interactions: Identification and Characterization of Ligand Binding by NMR Spectroscopy. J. Am. Chem. Soc. 2003, 125, 14–15. [Google Scholar] [CrossRef]
- Peters, T.; Meyer, B. Method for Detecting Biologically Active Compounds from Compound Libraries; APExBIO: Houston, TX, USA, 2001. [Google Scholar]
- Keller, R.M.; Wüthrich, K. Evolutionary change of the heme C electronic structure: Ferricytochrome c-551 from Pseudomonas aeruginosa and horse heart ferricytochrome c. Biochem. Biophys. Res. Commun. 1978, 83, 1132–1139. [Google Scholar] [CrossRef]
- Cayley, P.J.; Albrand, J.P.; Feeney, J.; Roberts, G.C.K.; Piper, E.A.; Burgen, A.S.V. Nuclear magnetic resonance studies of the binding of trimethoprim to dihydrofolate reductase. Biochemistry 1979, 18, 3886–3895. [Google Scholar] [CrossRef]
- Vogtherr, M.; Peters, T. Application of NMR Based Binding Assays to Identify Key Hydroxy Groups for Intermolecular Recognition. J. Am. Chem. Soc. 2000, 122, 6093–6099. [Google Scholar] [CrossRef]
- Lane, A.N.; Kelly, G.; Ramos, A.; Frenkiel, T.A. Determining binding sites in protein–nucleic acid complexes by cross-saturation. J. Biomol. NMR 2001, 21, 127–139. [Google Scholar] [CrossRef] [PubMed]
- Mayer, M.; Meyer, B. Group Epitope Mapping by Saturation Transfer Difference NMR To Identify Segments of a Ligand in Direct Contact with a Protein Receptor. J. Am. Chem. Soc. 2001, 123, 6108–6117. [Google Scholar] [CrossRef] [PubMed]
- Artico, M.; Corelli, F.; Massa, S.; Mai, A.; Tramontano, E. Synthetic Derivatives of Pyrrole and Pyrrolidine Suitable for the Therapy of Infections Caused by Rhinoviruses; ACS Publications: Washington, DC, USA, 1994. [Google Scholar]
- Ahmed, S.M.; Hall, A.J.; Robinson, A.E.; Verhoef, L.; Premkumar, P.; Parashar, U.D.; Koopmans, M.; Lopman, B.A. Global prevalence of norovirus in cases of gastroenteritis: A systematic review and meta-analysis. Lancet Infect. Dis. 2014, 14, 725–730. [Google Scholar] [CrossRef] [Green Version]
- Lee, B.Y.; McGlone, S.M.; Bailey, R.R.; Wettstein, Z.S.; Umscheid, C.A.; Muder, R.R. Economic Impact of Outbreaks of Norovirus Infection in Hospitals. Infect. Control Hosp. Epidemiol. 2011, 32, 191–193. [Google Scholar] [CrossRef]
- Tan, M.; Jiang, X. Norovirus–host interaction: Implications for disease control and prevention. Expert Rev. Mol. Med. 2007, 9, 1–22. [Google Scholar] [CrossRef]
- Prasad, B.V.V.; Hardy, M.E.; Dokland, T.; Bella, J.; Rossmann, M.G.; Estes, M.K. X-ray Crystallographic Structure of the Norwalk Virus Capsid. Science 1999, 286, 287–290. [Google Scholar] [CrossRef] [Green Version]
- Chen, R.; Neill, J.D.; Estes, M.K.; Prasad, B.V.V. X-ray structure of a native calicivirus: Structural insights into antigenic diversity and host specificity. Proc. Natl. Acad. Sci. USA 2006, 103, 8048–8053. [Google Scholar] [CrossRef] [Green Version]
- Cao, S.; Lou, Z.; Tan, M.; Chen, Y.; Liu, Y.; Zhang, Z.; Zhang, X.C.; Jiang, X.; Li, X.; Rao, Z. Structural Basis for the Recognition of Blood Group Trisaccharides by Norovirus. J. Virol. 2007, 81, 5949–5957. [Google Scholar] [CrossRef] [Green Version]
- Fiege, B.; Leuthold, M.; Parra, F.; Dalton, K.P.; Meloncelli, P.J.; Lowary, T.L.; Peters, T. Epitope mapping of histo blood group antigens bound to norovirus VLPs using STD NMR experiments reveals fine details of molecular recognition. Glycoconj. J. 2017, 34, 679–689. [Google Scholar] [CrossRef]
- Meloncelli, P.J.; West, L.J.; Lowary, T.L. Synthesis and NMR studies on the ABO histo-blood group antigens: Synthesis of type III and IV structures and NMR characterization of type I–VI antigens. Carbohydr. Res. 2011, 346, 1406–1426. [Google Scholar] [CrossRef]
- Rademacher, C.; Krishna, N.R.; Palcic, M.; Parra, F.; Peters, T. NMR Experiments Reveal the Molecular Basis of Receptor Recognition by a Calicivirus. J. Am. Chem. Soc. 2008, 130, 3669–3675. [Google Scholar] [CrossRef] [PubMed]
- Balaram, P.; Bothner-By, A.A.; Dadok, J. Negative nuclear Overhuaser effects as probes of macromolecular structure. J. Am. Chem. Soc. 1972, 94, 4015–4017. [Google Scholar] [CrossRef] [PubMed]
- Henrichsen, D.; Ernst, B.; Magnani, J.L.; Wang, W.-T.; Meyer, B.; Peters, T. Bioaffinity NMR Spectroscopy: Identification of an E-Selectin Antagonist in a Substance Mixture by Transfer NOE. Angew. Chem. Int. Ed. 1999, 38, 98–102. [Google Scholar] [CrossRef]
- Sánchez-Pedregal, V.M.; Reese, M.; Meiler, J.; Blommers, M.J.J.; Griesinger, C.; Carlomagno, T. The Inpharma Method: Protein-Mediated Interligand NOEs for Pharmacophore Mapping. Angew. Chem. Int. Ed. 2005, 44, 4172–4175. [Google Scholar] [CrossRef] [PubMed]
- Cohen, Y.; Avram, L.; Frish, L. Diffusion NMR Spectroscopy in Supramolecular and Combinatorial Chemistry: An Old Parameter—New Insights. Angew. Chem. Int. Ed. 2005, 44, 520–554. [Google Scholar] [CrossRef] [PubMed]
- Metcalfe, G.; Speetjens, M.F.M.; Lester, D.R.; Clercx, H.J.H. Beyond Passive: Chaotic Transport in Stirred Fluids. In Advances in Applied Mechanics; van der Giessen, E., Aref, H., Eds.; Academic Press: San Diego, CA, USA, 2012; Volume 45, pp. 109–188. ISBN 978-0-12-380876-9. [Google Scholar]
- Molnar, C.; Gair, J. 3.5 Passive Transport. In Concepts of Biology-1st Canadian ed.; BCcampus: Houston, TE, USA, 2019; pp. 92–98. ISBN 978-1-989623-99-2. [Google Scholar]
- Chhabra, R.P.; Richardson, J.F. Chapter 7—Momentum, heat and mass transfer in boundary layers. In Non-Newtonian Flow and Applied Rheology, 2nd ed.; Chhabra, R.P., Richardson, J.F., Eds.; Butterworth-Heinemann: Oxford, UK, 2008; pp. 343–375. ISBN 978-0-7506-8532-0. [Google Scholar]
- Nicolay, K.; Braun, K.P.J.; De Graaf, R.A.; Dijkhuizen, R.M.; Kruiskamp, M.J. Diffusion NMR spectroscopy. NMR Biomed. 2001, 14, 94–111. [Google Scholar] [CrossRef] [PubMed]
- Claridge, T.D.W. Chapter 10-Diffusion NMR Spectroscopy. In High-Resolution NMR Techniques in Organic Chemistry, 3rd ed.; Claridge, T.D.W., Ed.; Elsevier: Amsterdam, The Netherlands, 2016; pp. 381–419. ISBN 978-0-08-099986-9. [Google Scholar]
- Crank, J. The diffusion equation. In The Mathematics of Diffusion; Oxford University Press: Oxford, UK, 1975; pp. 1–10. ISBN 0-19-853411-6. [Google Scholar]
- Cussler, E.L. Models for Diffusion. In Diffusion: Mass Transfer in Fluid Systems, 3rd ed.; Cambridge University Press: Cambridge, UK, 2009; pp. 1–10. ISBN 978-0-521-87121-1. [Google Scholar]
- Stejskal, E.O.; Tanner, J.E. Spin Diffusion Measurements: Spin Echoes in the Presence of a Time-Dependent Field Gradient. J. Chem. Phys. 1965, 42, 288–292. [Google Scholar] [CrossRef] [Green Version]
- Kerssebaum, R.; Salnikov, G. DOSY and Diffusion by NMR; Bruker BioSpin GmbH: Rheinstetten, Germany, 2006; Volume 1. [Google Scholar]
- Sinnaeve, D. The Stejskal–Tanner equation generalized for any gradient shape—An overview of most pulse sequences measuring free diffusion. Concepts Magn. Reson. Part A 2012, 40A, 39–65. [Google Scholar] [CrossRef]
- Johnson, C.S. Diffusion ordered nuclear magnetic resonance spectroscopy: Principles and applications. Prog. Nucl. Magn. Reson. Spectrosc. 1999, 34, 203–256. [Google Scholar] [CrossRef]
- Lucas, L.H.; Larive, C.K. Measuring ligand-protein binding using NMR diffusion experiments. Concepts Magn. Reson. Part A 2004, 20A, 24–41. [Google Scholar] [CrossRef]
- Gilard, V.; Trefi, S.; Balayssac, S.; Delsuc, M.-A.; Gostan, T.; Malet-Martino, M.; Martino, R.; Prigent, Y.; Taulelle, F. Chapter 6—DOSY NMR for Drug Analysis. In NMR Spectroscopy in Pharmaceutical Analysis; Holzgrabe, U., Wawer, I., Diehl, B., Eds.; Elsevier: Amsterdam, The Netherlands, 2008; pp. 269–289. ISBN 978-0-444-53173-5. [Google Scholar]
- Valette, J.; Chaumeil, M.; Guillermier, M.; Bloch, G.; Hantraye, P.; Lebon, V. Diffusion-weighted NMR spectroscopy allows probing of 13C labeling of glutamate inside distinct metabolic compartments in the brain. Magn. Reson. Med. 2008, 60, 306–311. [Google Scholar] [CrossRef] [PubMed]
- Dumez, J.-N. Spatial encoding and spatial selection methods in high-resolution NMR spectroscopy. Prog. Nucl. Magn. Reson. Spectrosc. 2018, 109, 101–134. [Google Scholar] [CrossRef] [PubMed]
- Guduff, L.; Kuprov, I.; van Heijenoort, C.; Dumez, J.-N. Spatially encoded 2D and 3D diffusion-ordered NMR spectroscopy. Chem. Commun. 2017, 53, 701–704. [Google Scholar] [CrossRef] [Green Version]
- Ruddigkeit, L.; van Deursen, R.; Blum, L.C.; Reymond, J.-L. Enumeration of 166 Billion Organic Small Molecules in the Chemical Universe Database GDB-17. J. Chem. Inf. Model. 2012, 52, 2864–2875. [Google Scholar] [CrossRef] [PubMed]
- Reymond, J.-L.; Awale, M. Exploring Chemical Space for Drug Discovery Using the Chemical Universe Database. ACS Chem. Neurosci. 2012, 3, 649–657. [Google Scholar] [CrossRef] [PubMed] [Green Version]
- Xu, C.; Wan, Y.; Chen, D.; Gao, C.; Yin, H.; Fetherston, D.; Kupce, E.; Lopez, G.; Ameduri, B.; Twum, E.B.; et al. 19F DOSY diffusion-NMR spectroscopy of fluoropolymers. Magn. Reson. Chem. 2017, 55, 472–484. [Google Scholar] [CrossRef]
- Pagès, G.; Gilard, V.; Martino, R.; Malet-Martino, M. Pulsed-field gradient nuclear magnetic resonance measurements (PFG NMR) for diffusion ordered spectroscopy (DOSY) mapping. Analyst 2017, 142, 3771–3796. [Google Scholar] [CrossRef]
- Nishimura, N.; Yoza, K.; Kobayashi, K. Guest-Encapsulation Properties of a Self-Assembled Capsule by Dynamic Boronic Ester Bonds. J. Am. Chem. Soc. 2010, 132, 777–790. [Google Scholar] [CrossRef]
- Mathias, E.V.; Aponte, J.; Kornfield, J.A.; Ba, Y. Properties of small molecular drug loading and diffusion in a fluorinated PEG hydrogel studied by 1H molecular diffusion NMR and 19F spin diffusion NMR. Colloid Polym. Sci. 2010, 288, 1655–1663. [Google Scholar] [CrossRef] [Green Version]
- Kramer, M.; Kleinpeter, E. STD-DOSY: A new NMR method to analyze multi-component enzyme/substrate systems. J. Magn. Reson. 2010, 202, 245–249. [Google Scholar] [CrossRef]
- Tanoli, S.; Tanoli, N.; Usmani, S.; Zaheer-Ul-Haq; Ferreira, A. The exploration of interaction studies of smaller size, mostly ignored yet intrinsically inestimable molecules towards BSA; An example of STD and DOSY NMR. Open Chem. 2014, 12, 332–340. [Google Scholar] [CrossRef]
- Lionta, E.; Spyrou, G.; Vassilatis, D.K.; Cournia, Z. Structure-Based Virtual Screening for Drug Discovery: Principles, Applications and Recent Advances. Curr. Top. Med. Chem. 2014, 14, 1923–1938. [Google Scholar] [CrossRef] [PubMed]
- Danchin, A.; Médigue, C.; Gascuel, O.; Soldano, H.; Hénaut, A. From data banks to data bases. Res. Microbiol. 1991, 142, 913–916. [Google Scholar] [CrossRef] [Green Version]
- Ekins, S.; Mestres, J.; Testa, B. In silico pharmacology for drug discovery: Methods for virtual ligand screening and profiling. Br. J. Pharmacol. 2007, 152, 9–20. [Google Scholar] [CrossRef] [Green Version]
- Lin, X.; Li, X.; Lin, X. A Review on Applications of Computational Methods in Drug Screening and Design. Molecules 2020, 25, 1375. [Google Scholar] [CrossRef] [PubMed] [Green Version]
- Johnson, D.K.; Karanicolas, J. Ultra-High-Throughput Structure-Based Virtual Screening for Small-Molecule Inhibitors of Protein–Protein Interactions. J. Chem. Inf. Model. 2016, 56, 399–411. [Google Scholar] [CrossRef] [PubMed] [Green Version]
- Plouffe, D.; Brinker, A.; McNamara, C.; Henson, K.; Kato, N.; Kuhen, K.; Nagle, A.; Andreson, P.; Zhou, Y.; Gray, N.S.; et al. In silico activity profiling reveals the mechanism of action of antimalarials discovered in a high-throughput screen. Proc. Natl. Acad. Sci. USA 2008, 105, 9059–9064. [Google Scholar] [CrossRef] [Green Version]
- Chiddarwar, R.K.; Rohrer, S.G.; Wolf, A.; Tresch, S.; Wollenhaupt, S.; Bender, A. In silico target prediction for elucidating the mode of action of herbicides including prospective validation. J. Mol. Graph. Model. 2017, 71, 70–79. [Google Scholar] [CrossRef] [Green Version]
- Zoete, V.; Grosdidier, A.; Michielin, O. Docking, virtual high throughput screening and in silico fragment-based drug design. J. Cell. Mol. Med. 2009, 13, 238–248. [Google Scholar] [CrossRef] [Green Version]
- Murgueitio, M.S.; Bermudez, M.; Mortier, J.; Wolber, G. In silico virtual screening approaches for anti-viral drug discovery. Drug Discov. Today Technol. 2012, 9, e219–e225. [Google Scholar] [CrossRef]
- Kumar, V.; Krishna, S.; Siddiqi, M.I. Virtual screening strategies: Recent advances in the identification and design of anti-cancer agents. Methods 2015, 71, 64–70. [Google Scholar] [CrossRef]
- Banegas-Luna, A.-J.; Cerón-Carrasco, J.P.; Pérez-Sánchez, H. A review of ligand-based virtual screening web tools and screening algorithms in large molecular databases in the age of big data. Future Med. Chem. 2018, 10, 2641–2658. [Google Scholar] [CrossRef] [PubMed]
- Subramaniam, S.; Mehrotra, M.; Gupta, D. Virtual high throughput screening (vHTS)—A perspective. Bioinformation 2008, 3, 14–17. [Google Scholar] [CrossRef] [PubMed] [Green Version]
- Stark, J.L.; Powers, R. Application of NMR and Molecular Docking in Structure-Based Drug Discovery. In NMR of Proteins and Small Biomolecules; Topics in Current Chemistry; Zhu, G., Ed.; Springer: Berlin, Germany, 2012; pp. 1–34. ISBN 978-3-642-28917-0. [Google Scholar]
- Fan, H.; Irwin, J.J.; Sali, A. Virtual Ligand Screening Against Comparative Protein Structure Models. Methods Mol. Biol. Clifton NJ 2012, 819, 105–126. [Google Scholar] [CrossRef] [Green Version]
- Ciulli, A. Biophysical Screening for the Discovery of Small-Molecule Ligands. Methods Mol. Biol. Clifton NJ 2013, 1008, 357–388. [Google Scholar] [CrossRef] [Green Version]
- Amaning, K.; Lowinski, M.; Vallee, F.; Steier, V.; Marcireau, C.; Ugolini, A.; Delorme, C.; Foucalt, F.; McCort, G.; Derimay, N.; et al. The use of virtual screening and differential scanning fluorimetry for the rapid identification of fragments active against MEK1. Bioorg. Med. Chem. Lett. 2013, 23, 3620–3626. [Google Scholar] [CrossRef]
- Tanrikulu, Y.; Krüger, B.; Proschak, E. The holistic integration of virtual screening in drug discovery. Drug Discov. Today 2013, 18, 358–364. [Google Scholar] [CrossRef] [PubMed]
- Xu, H. Retrospect and prospect of virtual screening in drug discovery. Curr. Top. Med. Chem. 2002, 2, 1305–1320. [Google Scholar] [CrossRef] [Green Version]
- Kitchen, D.B.; Decornez, H.; Furr, J.R.; Bajorath, J. Docking and scoring in virtual screening for drug discovery: Methods and applications. Nat. Rev. Drug Discov. 2004, 3, 935–949. [Google Scholar] [CrossRef]
- Rudisser, S.; Jahnke, W. NMR and in silico Screening. Comb. Chem. High Throughput Screen. 2002, 5, 591–603. [Google Scholar] [CrossRef]
- Morelli, X.; Rigby, A.C. Acceleration of the Drug Discovery Process: A Combinatorial Approach Using NMR Spectroscopy and Virtual Screening. Curr. Comput. Aided Drug Des. 2007, 3, 33–49. [Google Scholar] [CrossRef] [Green Version]
- Chen, D.; Ranganathan, A.; IJzerman, A.P.; Siegal, G.; Carlsson, J. Complementarity between in Silico and Biophysical Screening Approaches in Fragment-Based Lead Discovery against the A2A Adenosine Receptor. J. Chem. Inf. Model. 2013, 53, 2701–2714. [Google Scholar] [CrossRef] [PubMed]
- Cieślak, M.; Komoszyński, M.; Wojtczak, A. Adenosine A2A receptors in Parkinson’s disease treatment. Purinergic Signal. 2008, 4, 305–312. [Google Scholar] [CrossRef] [PubMed] [Green Version]
- Di Lello, P.; Pastor, R.; Murray, J.M.; Blake, R.A.; Cohen, F.; Crawford, T.D.; Drobnick, J.; Drummond, J.; Kategaya, L.; Kleinheinz, T.; et al. Discovery of Small-Molecule Inhibitors of Ubiquitin Specific Protease 7 (USP7) Using Integrated NMR and in Silico Techniques. J. Med. Chem. 2017, 60, 10056–10070. [Google Scholar] [CrossRef] [PubMed]
- Sheng, Y.; Saridakis, V.; Sarkari, F.; Duan, S.; Wu, T.; Arrowsmith, C.H.; Frappier, L. Molecular recognition of p53 and MDM2 by USP7/HAUSP. Nat. Struct. Mol. Biol. 2006, 13, 285–291. [Google Scholar] [CrossRef] [PubMed]
- Baurin, N.; Aboul-Ela, F.; Barril, X.; Davis, B.; Drysdale, M.; Dymock, B.; Finch, H.; Fromont, C.; Richardson, C.; Simmonite, H.; et al. Design and Characterization of Libraries of Molecular Fragments for Use in NMR Screening against Protein Targets. J. Chem. Inf. Comput. Sci. 2004, 44, 2157–2166. [Google Scholar] [CrossRef]
- Potamitis, C.; Zervou, M.; Katsiaras, V.; Zoumpoulakis, P.; Durdagi, S.; Papadopoulos, M.G.; Hayes, J.M.; Grdadolnik, S.G.; Kyrikou, I.; Argyropoulos, D.; et al. Antihypertensive Drug Valsartan in Solution and at the AT1 Receptor: Conformational Analysis, Dynamic NMR Spectroscopy, in Silico Docking, and Molecular Dynamics Simulations. J. Chem. Inf. Model. 2009, 49, 726–739. [Google Scholar] [CrossRef]
- Bertini, I.; Fragai, M.; Giachetti, A.; Luchinat, C.; Maletta, M.; Parigi, G.; Yeo, K.J. Combining in Silico Tools and NMR Data to Validate Protein−Ligand Structural Models: Application to Matrix Metalloproteinases. J. Med. Chem. 2005, 48, 7544–7559. [Google Scholar] [CrossRef]
- Li, G.-B.; Abboud, M.I.; Brem, J.; Someya, H.; Lohans, C.T.; Yang, S.-Y.; Spencer, J.; Wareham, D.W.; McDonough, M.A.; Schofield, C.J. NMR-filtered virtual screening leads to non-metal chelating metallo-β-lactamase inhibitors. Chem. Sci. 2017, 8, 928–937. [Google Scholar] [CrossRef] [Green Version]
- Palacios, A.R.; Rossi, M.-A.; Mahler, G.S.; Vila, A.J. Metallo-β-Lactamase Inhibitors Inspired on Snapshots from the Catalytic Mechanism. Biomolecules 2020, 10, 854. [Google Scholar] [CrossRef]
- Shan, J.; Zhang, X.; Bao, J.; Cassell, R.; Zheng, J.J. Synthesis of Potent Dishevelled PDZ Domain Inhibitors Guided by Virtual Screening and NMR Studies. Chem. Biol. Drug Des. 2012, 79, 376–383. [Google Scholar] [CrossRef] [PubMed]
- Softley, C.A.; Bostock, M.J.; Popowicz, G.M.; Sattler, M. Paramagnetic NMR in drug discovery. J. Biomol. NMR 2020, 74, 287–309. [Google Scholar] [CrossRef] [PubMed]
- Cetiner, E.C.; Schwalbe, H. Chapter 9: Paramagnetic NMR in Drug Discovery. In Paramagnetism in Experimental Biomolecular NMR.; The Royal Society of Chemistry: London, UK, 2018; pp. 258–282. [Google Scholar]
- Pell, A.J.; Pintacuda, G.; Grey, C.P. Paramagnetic NMR in solution and the solid state. Prog. Nucl. Magn. Reson. Spectrosc. 2019, 111, 1–271. [Google Scholar] [CrossRef] [PubMed]
- Prudencio, M.; Impagliazzo, A.; Ubbink, M.; Rohovec, J.; Peters, J. CLaNP-An artificial paramagnetic centre to study proteins by NMR. J. Inorg. Biochem. 2003, 1, 213. [Google Scholar] [CrossRef]
- Sugiki, T.; Furuita, K.; Fujiwara, T.; Kojima, C. Current NMR Techniques for Structure-Based Drug Discovery. Molecules 2018, 23, 148. [Google Scholar] [CrossRef] [Green Version]
- Gottstein, D.; Reckel, S.; Dötsch, V.; Güntert, P. Requirements on Paramagnetic Relaxation Enhancement Data for Membrane Protein Structure Determination by NMR. Structure 2012, 20, 1019–1027. [Google Scholar] [CrossRef] [Green Version]
- Ubbink, M.; Perrakis, A.; Ravera, E.; Carlon, A.; Fragai, M.; Parigi, G.; Luchinat, C. Paramagnetic NMR as a new tool in structural biology. Emerg. Top. Life Sci. 2018, 2, 19–28. [Google Scholar] [CrossRef]
- Iwahara, J.; Anderson, D.E.; Murphy, E.C.; Clore, G.M. EDTA-Derivatized Deoxythymidine as a Tool for Rapid Determination of Protein Binding Polarity to DNA by Intermolecular Paramagnetic Relaxation Enhancement. J. Am. Chem. Soc. 2003, 125, 6634–6635. [Google Scholar] [CrossRef]
- Hurley, L.H.; Boyd, F.L. DNA as a target for drug action. Trends Pharmacol. Sci. 1988, 9, 402–407. [Google Scholar] [CrossRef]
- Brasuń, J.; Cebrat, M.; Jaremko, Ł.; Jaremko, M.; Ilc, G.; Gładysz, O.; Zhukov, I. The structural effects of the Cys-S-S-Cys bridge exchange by the His-Cu(II)-His motif studied on natural peptides—A promising tool for natural compounds-based design. Dalton Trans. 2009, 4853–4857. [Google Scholar] [CrossRef]
- Schaduangrat, N.; Lampa, S.; Simeon, S.; Gleeson, M.P.; Spjuth, O.; Nantasenamat, C. Towards reproducible computational drug discovery. J. Cheminformatics 2020, 12, 9. [Google Scholar] [CrossRef] [Green Version]
- Huang, S.; Umemoto, R.; Tamura, Y.; Kofuku, Y.; Uyeda, T.Q.P.; Nishida, N.; Shimada, I. Utilization of paramagnetic relaxation enhancements for structural analysis of actin-binding proteins in complex with actin. Sci. Rep. 2016, 6, 33690. [Google Scholar] [CrossRef] [PubMed] [Green Version]
- Huang, Y.; Wang, X.; Lv, G.; Razavi, A.M.; Huysmans, G.H.M.; Weinstein, H.; Bracken, C.; Eliezer, D.; Boudker, O. Monitoring Dynamics of Large Membrane Proteins by 19F Paramagnetic Longitudinal Relaxation: Domain Movement in a Glutamate Transporter Homolog. bioRxiv 2019, 832121. [Google Scholar] [CrossRef]
- Renault, M.; Cukkemane, A.; Baldus, M. Solid-State NMR Spectroscopy on Complex Biomolecules. Angew. Chem. Int. Ed. 2010, 49, 8346–8357. [Google Scholar] [CrossRef] [PubMed]
- Middleton, D.A. Solid-state NMR spectroscopy as a tool for drug design: From membrane-embedded targets to amyloid fibrils. Biochem. Soc. Trans. 2007, 35, 985–990. [Google Scholar] [CrossRef] [PubMed]
- Vogt, F.G.; Clawson, J.S.; Strohmeier, M.; Pham, T.N.; Watson, S.A.; Edwards, A.J. New Approaches to the Characterization of Drug Candidates by Solid-State NMR. In Pharmaceutical Sciences Encyclopedia; American Cancer Society: Atlanta, GA, USA, 2011; pp. 1–77. ISBN 978-0-470-57122-4. [Google Scholar]
- Pranitha, D.; Parthiban, N.; Dinakaran, S.; Ghosh, S.; Banji, D. Saikiran Solid state nuclear magnetic resonance spectroscopy-A review. Asian J. Pharm. Clin. Res. 2011, 4, 9–14. [Google Scholar]
- Berendt, R.T.; Sperger, D.M.; Munson, E.J.; Isbester, P.K. Solid-state NMR spectroscopy in pharmaceutical research and analysis. TrAC Trends Anal. Chem. 2006, 25, 977–984. [Google Scholar] [CrossRef]
- Bugay, D.E. Solid-State Nuclear Magnetic Resonance Spectroscopy: Theory and Pharmaceutical Applications. Pharm. Res. 1993, 10, 317–327. [Google Scholar] [CrossRef]
- Ashbrook, S.E.; Griffin, J.M.; Johnston, K.E. Recent Advances in Solid-State Nuclear Magnetic Resonance Spectroscopy. Annu. Rev. Anal. Chem. 2018, 11, 485–508. [Google Scholar] [CrossRef] [Green Version]
- Watts, A. Solid-state NMR in drug design and discovery for membrane-embedded targets. Nat. Rev. Drug Discov. 2005, 4, 555–568. [Google Scholar] [CrossRef]
- Callari, M.; De Souza, P.L.; Rawal, A.; Stenzel, M.H. The Effect of Drug Loading on Micelle Properties: Solid-State NMR as a Tool to Gain Structural Insight. Angew. Chem. Int. Ed. 2017, 56, 8441–8445. [Google Scholar] [CrossRef] [PubMed] [Green Version]
- Lee, M.; Wang, T.; Makhlynets, O.V.; Wu, Y.; Polizzi, N.F.; Wu, H.; Gosavi, P.M.; Stöhr, J.; Korendovych, I.V.; DeGrado, W.F.; et al. Zinc-binding structure of a catalytic amyloid from solid-state NMR. Proc. Natl. Acad. Sci. USA 2017, 114, 6191–6196. [Google Scholar] [CrossRef] [PubMed] [Green Version]
- Poulson, B.G.; Szczepski, K.; Izabela Lachowicz, J.; Jaremko, L.; Emwas, A.-H.; Jaremko, M. Aggregation of biologically important peptides and proteins: Inhibition or acceleration depending on protein and metal ion concentrations. RSC Adv. 2020, 10, 215–227. [Google Scholar] [CrossRef] [Green Version]
- Hughes, J.P.; Rees, S.; Kalindjian, S.B.; Philpott, K.L. Principles of early drug discovery. Br. J. Pharmacol. 2011, 162, 1239–1249. [Google Scholar] [CrossRef] [Green Version]
- Keserű, G.M.; Makara, G.M. Hit discovery and hit-to-lead approaches. Drug Discov. Today 2006, 11, 741–748. [Google Scholar] [CrossRef]
- Hevener, K.E.; Pesavento, R.; Ren, J.; Lee, H.; Ratia, K.; Johnson, M.E. Chapter Twelve—Hit-to-Lead: Hit Validation and Assessment. In Methods in Enzymology; Modern Approaches in Drug Discovery; Lesburg, C.A., Ed.; Academic Press: Cambridge, MA, USA, 2018; Volume 610, pp. 265–309. [Google Scholar]
- Genick, C.C.; Wright, S.K. Biophysics: For HTS hit validation, chemical lead optimization, and beyond. Expert Opin. Drug Discov. 2017, 12, 897–907. [Google Scholar] [CrossRef]
- Sillerud, L.O.; Larson, R.S. Advances in Nuclear Magnetic Resonance for Drug Discovery. In Bioinformatics and Drug Discovery; Methods in Molecular Biology; Larson, R.S., Ed.; Humana Press: New York, NY, USA, 2012; pp. 195–266. ISBN 978-1-61779-965-5. [Google Scholar]
- Sharma, R.; Florea, M.; Nau, W.M.; Swaminathan, K. Validation of Drug-Like Inhibitors against Mycobacterium Tuberculosis L-Aspartate α-Decarboxylase Using Nuclear Magnetic Resonance (1H-NMR). PLoS ONE 2012, 7, e45947. [Google Scholar] [CrossRef]
- Fouad, W.M.; Rathinasabapathi, B. Expression of bacterial L-aspartate-alpha-decarboxylase in tobacco increases beta-alanine and pantothenate levels and improves thermotolerance. Plant Mol. Biol. 2006, 60, 495–505. [Google Scholar] [CrossRef]
- Zega, A. NMR Methods for Identification of False Positives in Biochemical Screens. J. Med. Chem. 2017, 60, 9437–9447. [Google Scholar] [CrossRef]
- Huth, J.R.; Mendoza, R.; Olejniczak, E.T.; Johnson, R.W.; Cothron, D.A.; Liu, Y.; Lerner, C.G.; Chen, J.; Hajduk, P.J. ALARM NMR: A Rapid and Robust Experimental Method to Detect Reactive False Positives in Biochemical Screens. J. Am. Chem. Soc. 2005, 127, 217–224. [Google Scholar] [CrossRef]
- Dahlin, J.L.; Cuellar, M.; Singh, G.; Nelson, K.M.; Strasser, J.M.; Rappe, T.; Xia, Y.; Veglia, G.; Walters, M.A. ALARM NMR for HTS Triage and Chemical Probe Validation. Curr. Protoc. Chem. Biol. 2018, 10, 91–117. [Google Scholar] [CrossRef] [PubMed]
- Dahlin, J.L.; Nelson, K.M.; Strasser, J.M.; Barsyte-Lovejoy, D.; Szewczyk, M.M.; Organ, S.; Cuellar, M.; Singh, G.; Shrimp, J.H.; Nguyen, N.; et al. Assay interference and off-target liabilities of reported histone acetyltransferase inhibitors. Nat. Commun. 2017, 8, 1527. [Google Scholar] [CrossRef] [PubMed] [Green Version]
- Nagatoishi, S.; Yamaguchi, S.; Katoh, E.; Kajita, K.; Yokotagawa, T.; Kanai, S.; Furuya, T.; Tsumoto, K. A combination of 19F NMR and surface plasmon resonance for site-specific hit selection and validation of fragment molecules that bind to the ATP-binding site of a kinase. Bioorg. Med. Chem. 2018, 26, 1929–1938. [Google Scholar] [CrossRef] [PubMed]
- Fry, D.C.; Wartchow, C.; Graves, B.; Janson, C.; Lukacs, C.; Kammlott, U.; Belunis, C.; Palme, S.; Klein, C.; Vu, B. Deconstruction of a Nutlin: Dissecting the Binding Determinants of a Potent Protein–Protein Interaction Inhibitor. ACS Med. Chem. Lett. 2013, 4, 660–665. [Google Scholar] [CrossRef] [Green Version]
- Goudreau, N.; Coulombe, R.; Faucher, A.-M.; Grand-Maître, C.; Lacoste, J.-E.; Lemke, C.T.; Malenfant, E.; Bousquet, Y.; Fader, L.; Simoneau, B.; et al. Monitoring Binding of HIV-1 Capsid Assembly Inhibitors Using 19F Ligand-and 15N Protein-Based NMR and X-ray Crystallography: Early Hit Validation of a Benzodiazepine Series. Chem. Med. Chem. 2013, 8, 405–414. [Google Scholar] [CrossRef]
- Dias, D.M.; Van Molle, I.; Baud, M.G.J.; Galdeano, C.; Geraldes, C.F.G.C.; Ciulli, A. Is NMR Fragment Screening Fine-Tuned to Assess Druggability of Protein–Protein Interactions? ACS Med. Chem. Lett. 2014, 5, 23–28. [Google Scholar] [CrossRef]
- Arjmand, F.; Sharma, G.C.; Sayeed, F.; Muddassir, M.; Tabassum, S. De novo design of chiral organotin cancer drug candidates: Validation of enantiopreferential binding to molecular target DNA and 5′-GMP by UV–visible, fluorescence, 1H and 31P NMR. J. Photochem. Photobiol. B 2011, 105, 167–174. [Google Scholar] [CrossRef]
- Chène, P. Inhibiting the p53–MDM2 interaction: An important target for cancer therapy. Nat. Rev. Cancer 2003, 3, 102–109. [Google Scholar] [CrossRef]
- Hai, J.; Sakashita, S.; Allo, G.; Ludkovski, O.; Ng, C.; Shepherd, F.A.; Tsao, M.-S. Inhibiting MDM2-p53 Interaction Suppresses Tumor Growth in Patient-Derived Non–Small Cell Lung Cancer Xenograft Models. J. Thorac. Oncol. 2015, 10, 1172–1180. [Google Scholar] [CrossRef] [Green Version]
- Zhang, Q.; Zeng, S.X.; Lu, H. Targeting p53-MDM2-MDMX Loop for Cancer Therapy. In Mutant p53 and MDM2 in Cancer; Subcellular Biochemistry; Deb, S.P., Deb, S., Eds.; Springer: Dordrecht, The Netherlands, 2014; pp. 281–319. ISBN 978-94-017-9211-0. [Google Scholar]
- Tovar, C.; Graves, B.; Packman, K.; Filipovic, Z.; Xia, B.H.M.; Tardell, C.; Garrido, R.; Lee, E.; Kolinsky, K.; To, K.-H.; et al. MDM2 Small-Molecule Antagonist RG7112 Activates p53 Signaling and Regresses Human Tumors in Preclinical Cancer Models. Cancer Res. 2013, 73, 2587–2597. [Google Scholar] [CrossRef] [Green Version]
- Scott, D.E.; Bayly, A.R.; Abell, C.; Skidmore, J. Small molecules, big targets: Drug discovery faces the protein–protein interaction challenge. Nat. Rev. Drug Discov. 2016, 15, 533–550. [Google Scholar] [CrossRef] [PubMed] [Green Version]
- Goncearenco, A.; Li, M.; Simonetti, F.L.; Shoemaker, B.A.; Panchenko, A.R. Exploring Protein-Protein Interactions as Drug Targets for Anti-cancer Therapy with in Silico Workflows. In Proteomics for Drug Discovery: Methods and Protocols; Methods in Molecular Biology; Lazar, I.M., Kontoyianni, M., Lazar, A.C., Eds.; Humana Press: New York, NY, USA, 2017; pp. 221–236. ISBN 978-1-4939-7201-2. [Google Scholar]
- Fry, D.C. Targeting Protein-Protein Interactions for Drug Discovery. In Protein-Protein Interactions: Methods and Applications; Methods in Molecular Biology; Meyerkord, C.L., Fu, H., Eds.; Humana Press: New York, NY, USA, 2015; pp. 93–106. ISBN 978-1-4939-2425-7. [Google Scholar]
- Mabonga, L.; Kappo, A.P. Protein-protein interaction modulators: Advances, successes and remaining challenges. Biophys. Rev. 2019, 11, 559–581. [Google Scholar] [CrossRef] [PubMed]
- Cuenda, A.; Rouse, J.; Doza, Y.N.; Meier, R.; Cohen, P.; Gallagher, T.F.; Young, P.R.; Lee, J.C. SB 203580 is a specific inhibitor of a MAP kinase homologue which is stimulated by cellular stresses and interleukin-1. FEBS Lett. 1995, 364, 229–233. [Google Scholar] [CrossRef] [PubMed] [Green Version]
- Kumar, S.; McDonnell, P.C.; Gum, R.J.; Hand, A.T.; Lee, J.C.; Young, P.R. Novel Homologues of CSBP/p38 MAP Kinase: Activation, Substrate Specificity and Sensitivity to Inhibition by Pyridinyl Imidazoles. Biochem. Biophys. Res. Commun. 1997, 235, 533–538. [Google Scholar] [CrossRef]
- Mizukoshi, Y.; Abe, A.; Takizawa, T.; Hanzawa, H.; Fukunishi, Y.; Shimada, I.; Takahashi, H. An Accurate Pharmacophore Mapping Method by NMR Spectroscopy. Angew. Chem. Int. Ed. 2012, 51, 1362–1365. [Google Scholar] [CrossRef]
- Fukunishi, Y.; Mizukoshi, Y.; Takeuchi, K.; Shimada, I.; Takahashi, H.; Nakamura, H. Protein–ligand docking guided by ligand pharmacophore-mapping experiment by NMR. J. Mol. Graph. Model. 2011, 31, 20–27. [Google Scholar] [CrossRef]
- Li, D.; DeRose, E.F.; London, R.E. The inter-ligand Overhauser effect: A powerful new NMR approach for mapping structural relationships of macromolecular ligands. J. Biomol. NMR 1999, 15, 71–76. [Google Scholar] [CrossRef]
- Becattini, B.; Pellecchia, M. SAR by ILOEs: An NMR-Based Approach to Reverse Chemical Genetics. Chem. Eur. J. 2006, 12, 2658–2662. [Google Scholar] [CrossRef]
- Becattini, B.; Sareth, S.; Zhai, D.; Crowell, K.J.; Leone, M.; Reed, J.C.; Pellecchia, M. Targeting Apoptosis via Chemical Design: Inhibition of Bid-Induced Cell Death by Small Organic Molecules. Chem. Biol. 2004, 11, 1107–1117. [Google Scholar] [CrossRef] [Green Version]
- Lucas, L.H.; Price, K.E.; Larive, C.K. Epitope Mapping and Competitive Binding of HSA Drug Site II Ligands by NMR Diffusion Measurements. J. Am. Chem. Soc. 2004, 126, 14258–14266. [Google Scholar] [CrossRef]
- Hajduk, P.J.; Mack, J.C.; Olejniczak, E.T.; Park, C.; Dandliker, P.J.; Beutel, B.A. SOS-NMR: A Saturation Transfer NMR-Based Method for Determining the Structures of Protein−Ligand Complexes. J. Am. Chem. Soc. 2004, 126, 2390–2398. [Google Scholar] [CrossRef]
- Schieborr, U.; Vogtherr, M.; Elshorst, B.; Betz, M.; Grimme, S.; Pescatore, B.; Langer, T.; Saxena, K.; Schwalbe, H. How Much NMR Data Is Required to Determine a Protein–Ligand Complex Structure? Chem. Bio. Chem. 2005, 6, 1891–1898. [Google Scholar] [CrossRef] [PubMed]
- Chen, W.-N.; Kuppan, K.V.; Lee, M.D.; Jaudzems, K.; Huber, T.; Otting, G. O-tert-Butyltyrosine, an NMR Tag for High-Molecular-Weight Systems and Measurements of Submicromolar Ligand Binding Affinities. J. Am. Chem. Soc. 2015, 137, 4581–4586. [Google Scholar] [CrossRef] [Green Version]
- Chen, W.-N.; Nitsche, C.; Pilla, K.B.; Graham, B.; Huber, T.; Klein, C.D.; Otting, G. Sensitive NMR Approach for Determining the Binding Mode of Tightly Binding Ligand Molecules to Protein Targets. J. Am. Chem. Soc. 2016, 138, 4539–4546. [Google Scholar] [CrossRef] [PubMed] [Green Version]
- Ludwig, C.; Michiels, P.J.A.; Wu, X.; Kavanagh, K.L.; Pilka, E.; Jansson, A.; Oppermann, U.; Günther, U.L. SALMON: Solvent Accessibility, Ligand binding, and Mapping of ligand Orientation by NMR Spectroscopy. J. Med. Chem. 2008, 51, 1–3. [Google Scholar] [CrossRef] [PubMed]
- Geist, L.; Mayer, M.; Cockcroft, X.-L.; Wolkerstorfer, B.; Kessler, D.; Engelhardt, H.; McConnell, D.B.; Konrat, R. Direct NMR Probing of Hydration Shells of Protein Ligand Interfaces and Its Application to Drug Design. J. Med. Chem. 2017, 60, 8708–8715. [Google Scholar] [CrossRef] [PubMed]
- Orts, J.; Riek, R. Protein—Ligand structure determination with the NMR molecular replacement tool, NMR2. J. Biomol. NMR 2020. [Google Scholar] [CrossRef] [PubMed]
- Orts, J.; Wälti, M.A.; Marsh, M.; Vera, L.; Gossert, A.D.; Güntert, P.; Riek, R. NMR-Based Determination of the 3D Structure of the Ligand–Protein Interaction Site without Protein Resonance Assignment. J. Am. Chem. Soc. 2016, 138, 4393–4400. [Google Scholar] [CrossRef]
- Wälti, M.A.; Orts, J. The NMR2 Method to Determine Rapidly the Structure of the Binding Pocket of a Protein–Ligand Complex with High Accuracy. Magnetochemistry 2018, 4, 12. [Google Scholar] [CrossRef] [Green Version]
- Torres, F.; Ghosh, D.; Strotz, D.; Chi, C.N.; Davis, B.; Orts, J. Protein–fragment complex structures derived by NMR molecular replacement. RSC Med. Chem. 2020, 11, 591–596. [Google Scholar] [CrossRef]
- Yu, Z.; Li, P.; Merz, K.M. Using Ligand-Induced Protein Chemical Shift Perturbations To Determine Protein–Ligand Structures. Biochemistry 2017, 56, 2349–2362. [Google Scholar] [CrossRef] [PubMed]
- Krzeminski, M.; Loth, K.; Boelens, R.; Bonvin, A.M. SAMPLEX: Automatic mapping of perturbed and unperturbed regions of proteins and complexes. BMC Bioinform. 2010, 11, 51. [Google Scholar] [CrossRef] [PubMed] [Green Version]
- Siegal, G.; Selenko, P. Cells, drugs and NMR. J. Magn. Reson. 2019, 306, 202–212. [Google Scholar] [CrossRef] [PubMed]
- Kang, C. Applications of In-Cell NMR in Structural Biology and Drug Discovery. Int. J. Mol. Sci. 2019, 20, 139. [Google Scholar] [CrossRef] [Green Version]
- Li, C.; Wang, G.-F.; Wang, Y.; Creager-Allen, R.; Lutz, E.A.; Scronce, H.; Slade, K.M.; Ruf, R.A.S.; Mehl, R.A.; Pielak, G.J. Protein 19F NMR in Escherichia coli. J. Am. Chem. Soc. 2010, 132, 321–327. [Google Scholar] [CrossRef] [Green Version]
- Pan, B.-B.; Yang, F.; Ye, Y.; Wu, Q.; Li, C.; Huber, T.; Su, X.-C. 3D structure determination of a protein in living cells using paramagnetic NMR spectroscopy. Chem. Commun. 2016, 52, 10237–10240. [Google Scholar] [CrossRef] [Green Version]
- Bertrand, K.; Reverdatto, S.; Burz, D.S.; Zitomer, R.; Shekhtman, A. Structure of Proteins in Eukaryotic Compartments. J. Am. Chem. Soc. 2012, 134, 12798–12806. [Google Scholar] [CrossRef] [Green Version]
- Mercatelli, E.; Barbieri, L.; Luchinat, E.; Banci, L. Direct structural evidence of protein redox regulation obtained by in-cell NMR. Biochim. Biophys. Acta BBA Mol. Cell Res. 2016, 1863, 198–204. [Google Scholar] [CrossRef]
- Ohno, A.; Inomata, K.; Tochio, H.; Shirakawa, M. In-Cell NMR Spectroscopy in Protein Chemistry and Drug Discovery. Curr. Top. Med. Chem. 2011, 11, 68–73. [Google Scholar] [CrossRef]
- Hamatsu, J.; O’Donovan, D.; Tanaka, T.; Shirai, T.; Hourai, Y.; Mikawa, T.; Ikeya, T.; Mishima, M.; Boucher, W.; Smith, B.O.; et al. High-Resolution Heteronuclear Multidimensional NMR of Proteins in Living Insect Cells Using a Baculovirus Protein Expression System. J. Am. Chem. Soc. 2013, 135, 1688–1691. [Google Scholar] [CrossRef]
- Verardi, R.; Traaseth, N.J.; Masterson, L.R.; Vostrikov, V.V.; Veglia, G. Isotope Labeling for Solution and Solid-State NMR Spectroscopy of Membrane Proteins. In Isotope Labeling in Biomolecular NMR; Advances in Experimental Medicine and Biology; Atreya, H.S., Ed.; Springer: Dordrecht, The Netherlands, 2012; pp. 35–62. ISBN 978-94-007-4954-2. [Google Scholar]
- Kang, C. 19F-NMR in Target-based Drug Discovery. Curr. Med. Chem. 2019, 26, 4964–4983. [Google Scholar] [CrossRef] [PubMed]
- Norton, R.S.; Leung, E.W.W.; Chandrashekaran, I.R.; MacRaild, C.A. Applications of 19F-NMR in Fragment-Based Drug Discovery. Molecules 2016, 21, 860. [Google Scholar] [CrossRef] [PubMed]
- Serber, Z.; Straub, W.; Corsini, L.; Nomura, A.M.; Shimba, N.; Craik, C.S.; Ortiz de Montellano, P.; Dötsch, V. Methyl Groups as Probes for Proteins and Complexes in In-Cell NMR Experiments. J. Am. Chem. Soc. 2004, 126, 7119–7125. [Google Scholar] [CrossRef] [PubMed]
- Iwahara, J.; Zandarashvili, L.; Kemme, C.A.; Esadze, A. NMR-based investigations into target DNA search processes of proteins. Methods 2018, 148, 57–66. [Google Scholar] [CrossRef]
- Lu, K.; Miyazaki, Y.; Summers, M.F. Isotope labeling strategies for NMR studies of RNA. J. Biomol. NMR 2009, 46, 113. [Google Scholar] [CrossRef] [Green Version]
- Yamaoki, Y.; Kiyoishi, A.; Miyake, M.; Kano, F.; Murata, M.; Nagata, T.; Katahira, M. The first successful observation of in-cell NMR signals of DNA and RNA in living human cells. Phys. Chem. Chem. Phys. 2018, 20, 2982–2985. [Google Scholar] [CrossRef]
- Salgado, G.; Cazenave, C.; Kerkour, A.; Mergny, J.-L. G-quadruplex DNA and ligand interaction in living cells using NMR spectroscopy. Chem. Sci. 2015, 6, 3314–3320. [Google Scholar] [CrossRef]
- Dose, A.; Liokatis, S.; Theillet, F.-X.; Selenko, P.; Schwarzer, D. NMR Profiling of Histone Deacetylase and Acetyl-transferase Activities in Real Time. ACS Chem. Biol. 2011, 6, 419–424. [Google Scholar] [CrossRef]
- Thongwichian, R.; Kosten, J.; Benary, U.; Rose, H.M.; Stuiver, M.; Theillet, F.-X.; Dose, A.; Koch, B.; Yokoyama, H.; Schwarzer, D.; et al. A Multiplexed NMR-Reporter Approach to Measure Cellular Kinase and Phosphatase Activities in Real-Time. J. Am. Chem. Soc. 2015, 137, 6468–6471. [Google Scholar] [CrossRef]
- Doura, T.; Hata, R.; Nonaka, H.; Sugihara, F.; Yoshioka, Y.; Sando, S. An adhesive 19F MRI chemical probe allows signal off-to-on-type molecular sensing in a biological environment. Chem. Commun. 2013, 49, 11421–11423. [Google Scholar] [CrossRef]
- Dokland, T. Scaffolding proteins and their role in viral assembly. Cell. Mol. Life Sci. CMLS 1999, 56, 580–603. [Google Scholar] [CrossRef] [PubMed]
- Fane, B.A.; Prevelige, P.E. Mechanism of Scaffolding-Assisted Viral Assembly. In Advances in Protein Chemistry; Virus Structure; Academic Press: San Diego, CA, USA, 2003; Volume 64, pp. 259–299. [Google Scholar]
- Sun, Y.; Parker, M.H.; Weigele, P.; Casjens, S.; Prevelige Jr, P.E.; Krishna, N.R. Structure of the coat protein-binding domain of the scaffolding protein from a double-stranded DNA virus11Edited by M. Summers. J. Mol. Biol. 2000, 297, 1195–1202. [Google Scholar] [CrossRef] [PubMed] [Green Version]
- Xu, J.; Wang, D.; Gui, M.; Xiang, Y. Structural assembly of the tailed bacteriophage ϕ29. Nat. Commun. 2019, 10, 1–16. [Google Scholar] [CrossRef] [Green Version]
- Whitehead, R.D.; Teschke, C.M.; Alexandrescu, A.T. NMR Mapping of Disordered Segments from a Viral Scaffolding Protein Enclosed in a 23 MDa Procapsid. Biophys. J. 2019, 117, 1387–1392. [Google Scholar] [CrossRef]
- Croke, R.L.; Sallum, C.O.; Watson, E.; Watt, E.D.; Alexandrescu, A.T. Hydrogen exchange of monomeric α-synuclein shows unfolded structure persists at physiological temperature and is independent of molecular crowding in Escherichia coli. Protein Sci. 2008, 17, 1434–1445. [Google Scholar] [CrossRef] [PubMed] [Green Version]
- Serber, Z.; Selenko, P.; Hänsel, R.; Reckel, S.; Löhr, F.; Ferrell, J.E.; Wagner, G.; Dötsch, V. Investigating macromolecules inside cultured and injected cells by in-cell NMR spectroscopy. Nat. Protoc. 2006, 1, 2701–2709. [Google Scholar] [CrossRef]
- Theillet, F.-X.; Binolfi, A.; Frembgen-Kesner, T.; Hingorani, K.; Sarkar, M.; Kyne, C.; Li, C.; Crowley, P.B.; Gierasch, L.; Pielak, G.J.; et al. Physicochemical Properties of Cells and Their Effects on Intrinsically Disordered Proteins (IDPs). Chem. Rev. 2014, 114, 6661–6714. [Google Scholar] [CrossRef] [PubMed]
- Marshall, D.D.; Powers, R. Beyond the paradigm: Combining mass spectrometry and nuclear magnetic resonance for metabolomics. Prog. Nucl. Magn. Reson. Spectrosc. 2017, 100, 1–16. [Google Scholar] [CrossRef] [Green Version]
- Emwas, A.-H.M.; Al-Talla, Z.A.; Kharbatia, N.M. Sample Collection and Preparation of Biofluids and Extracts for Gas Chromatography–Mass Spectrometry. In Metabonomics: Methods and Protocols; Methods in Molecular Biology; Bjerrum, J.T., Ed.; Humana Press: New York, NY, USA, 2015; Volume 1277, pp. 75–90. ISBN 978-1-4939-2377-9. [Google Scholar]
- Emwas, A.-H.M.; Al-Talla, Z.A.; Yang, Y.; Kharbatia, N.M. Gas Chromatography–Mass Spectrometry of Biofluids and Extracts. In Metabonomics: Methods and Protocols; Methods in Molecular Biology; Bjerrum, J.T., Ed.; Humana Press: New York, NY, USA, 2015; Volume 1277, pp. 91–112. ISBN 978-1-4939-2377-9. [Google Scholar]
- Gebregiworgis, T.; Powers, R. Application of NMR Metabolomics to Search for Human Disease Biomarkers. Comb. Chem. High Throughput Screen. 2012, 15, 595–610. [Google Scholar] [CrossRef]
- Tiziani, S.; Emwas, A.-H.; Lodi, A.; Ludwig, C.; Bunce, C.M.; Viant, M.R.; Günther, U.L. Optimized metabolite extraction from blood serum for 1H nuclear magnetic resonance spectroscopy. Anal. Biochem. 2008, 377, 16–23. [Google Scholar] [CrossRef]
- Krishnan, V.V. Molecular Thermodynamics Using Nuclear Magnetic Resonance (NMR) Spectroscopy. Inventions 2019, 4, 13. [Google Scholar] [CrossRef] [PubMed] [Green Version]
- Matzkanin, G.A. A Review of Nondestructive Characterization of Composites Using NMR. In Proceedings of the Nondestructive Characterization of Materials, Berlin, Germany, 24–28 July 2002; Höller, P., Hauk, V., Dobmann, G., Ruud, C.O., Green, R.E., Eds.; Springer: Berlin, Germany, 1989; pp. 655–669. [Google Scholar]
- Rockwood, A.L.; Kushnir, M.M.; Clarke, N.J. Chapter 2-Mass Spectrometry. In Principles and Applications of Clinical Mass Spectrometry; Rifai, N., Horvath, A.R., Wittwer, C.T., Eds.; Elsevier: Amsterdam, The Netherlands, 2018; pp. 33–65. ISBN 978-0-12-816063-3. [Google Scholar]
- Raji, M.; Amad, M.; Emwas, A.-H. Dehydrodimerization of pterostilbene during electrospray ionization mass spectrometry. Rapid Commun. Mass Spectrom. RCM 2013, 27, 1260–1266. [Google Scholar] [CrossRef] [PubMed]
- Keun, H.C.; Beckonert, O.; Griffin, J.L.; Richter, C.; Moskau, D.; Lindon, J.C.; Nicholson, J.K. Cryogenic Probe 13C NMR Spectroscopy of Urine for Metabonomic Studies. Anal. Chem. 2002, 74, 4588–4593. [Google Scholar] [CrossRef] [PubMed]
- Schanda, P.; Kupče, Ē.; Brutscher, B. SOFAST-HMQC Experiments for Recording Two-dimensional Deteronuclear Correlation Spectra of Proteins within a Few Seconds. J. Biomol. NMR 2005, 33, 199–211. [Google Scholar] [CrossRef]
- Ghosh, S.; Sengupta, A.; Chandra, K. SOFAST-HMQC—An efficient tool for metabolomics. Anal. Bioanal. Chem. 2017, 409, 6731–6738. [Google Scholar] [CrossRef]
- Giraudeau, P.; Frydman, L. Ultrafast 2D NMR: An Emerging Tool in Analytical Spectroscopy. Annu. Rev. Anal. Chem. 2014, 7, 129–161. [Google Scholar] [CrossRef] [Green Version]
- Guennec, A.L.; Giraudeau, P.; Caldarelli, S. Evaluation of Fast 2D NMR for Metabolomics. Anal. Chem. 2014, 86, 5946–5954. [Google Scholar] [CrossRef]
- Júnior, L.H.K.Q.; Queiroz, D.P.K.; Dhooghe, L.; Ferreira, A.G.; Giraudeau, P. Real-time separation of natural products by ultrafast 2D NMR coupled to on-line HPLC. Analyst 2012, 137, 2357–2361. [Google Scholar] [CrossRef]
- Shrot, Y.; Frydman, L. Compressed sensing and the reconstruction of ultrafast 2D NMR data: Principles and biomolecular applications. J. Magn. Reson. 2011, 209, 352–358. [Google Scholar] [CrossRef] [Green Version]
- Ludwig, C.; Marin-Montesinos, I.; Saunders, M.G.; Emwas, A.-H.; Pikramenou, Z.; Hammond, S.P.; Günther, U.L. Application of ex situ dynamic nuclear polarization in studying small molecules. Phys. Chem. Chem. Phys. 2010, 12, 5868–5871. [Google Scholar] [CrossRef]
- Lilly Thankamony, A.S.; Wittmann, J.J.; Kaushik, M.; Corzilius, B. Dynamic nuclear polarization for sensitivity enhancement in modern solid-state NMR. Prog. Nucl. Magn. Reson. Spectrosc. 2017, 102–103, 120–195. [Google Scholar] [CrossRef] [PubMed]
- Emwas, A.-H.; Saunders, M.; Ludwig, C.; Günther, U.L. Determinants for Optimal Enhancement in Ex Situ DNP Experiments. Appl. Magn. Reson. 2008, 3–4, 483–494. [Google Scholar] [CrossRef]
- Kovtunov, K.V.; Pokochueva, E.V.; Salnikov, O.G.; Cousin, S.F.; Kurzbach, D.; Vuichoud, B.; Jannin, S.; Chekmenev, E.Y.; Goodson, B.M.; Barskiy, D.A.; et al. Hyperpolarized NMR Spectroscopy: D-DNP, PHIP, and SABRE Techniques. Chem. Asian J. 2018, 13, 1857–1871. [Google Scholar] [CrossRef] [PubMed] [Green Version]
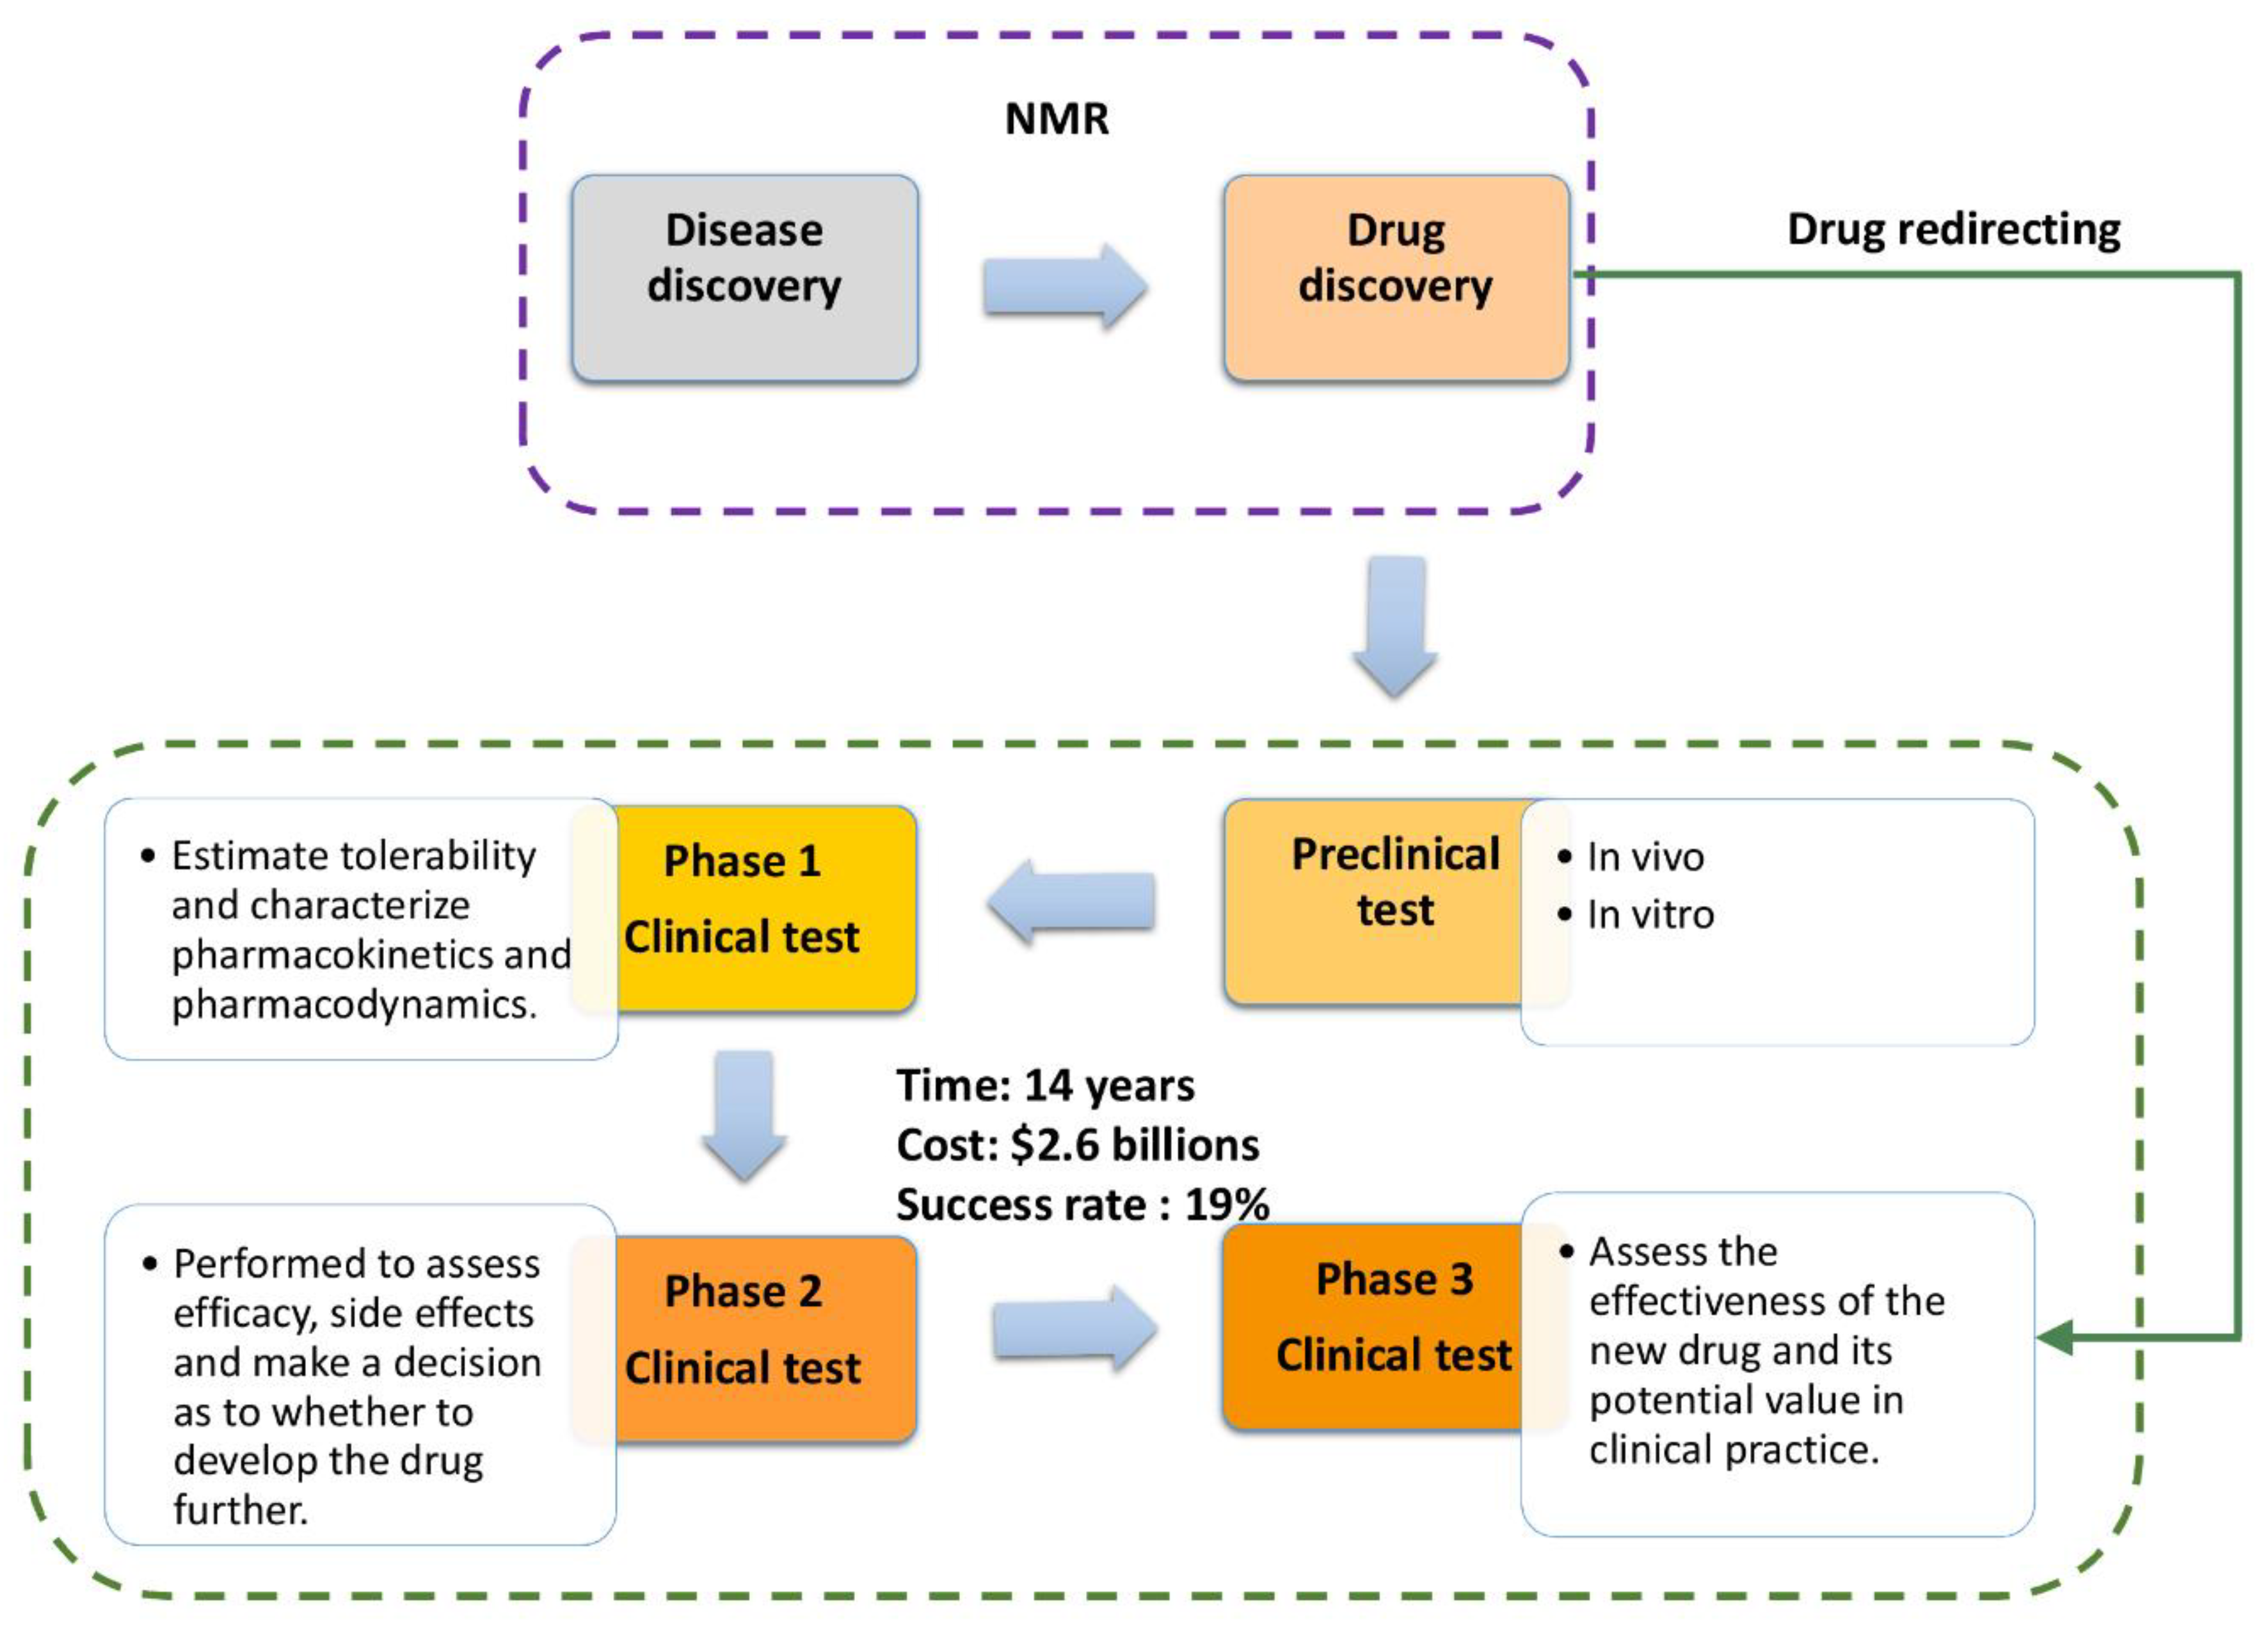
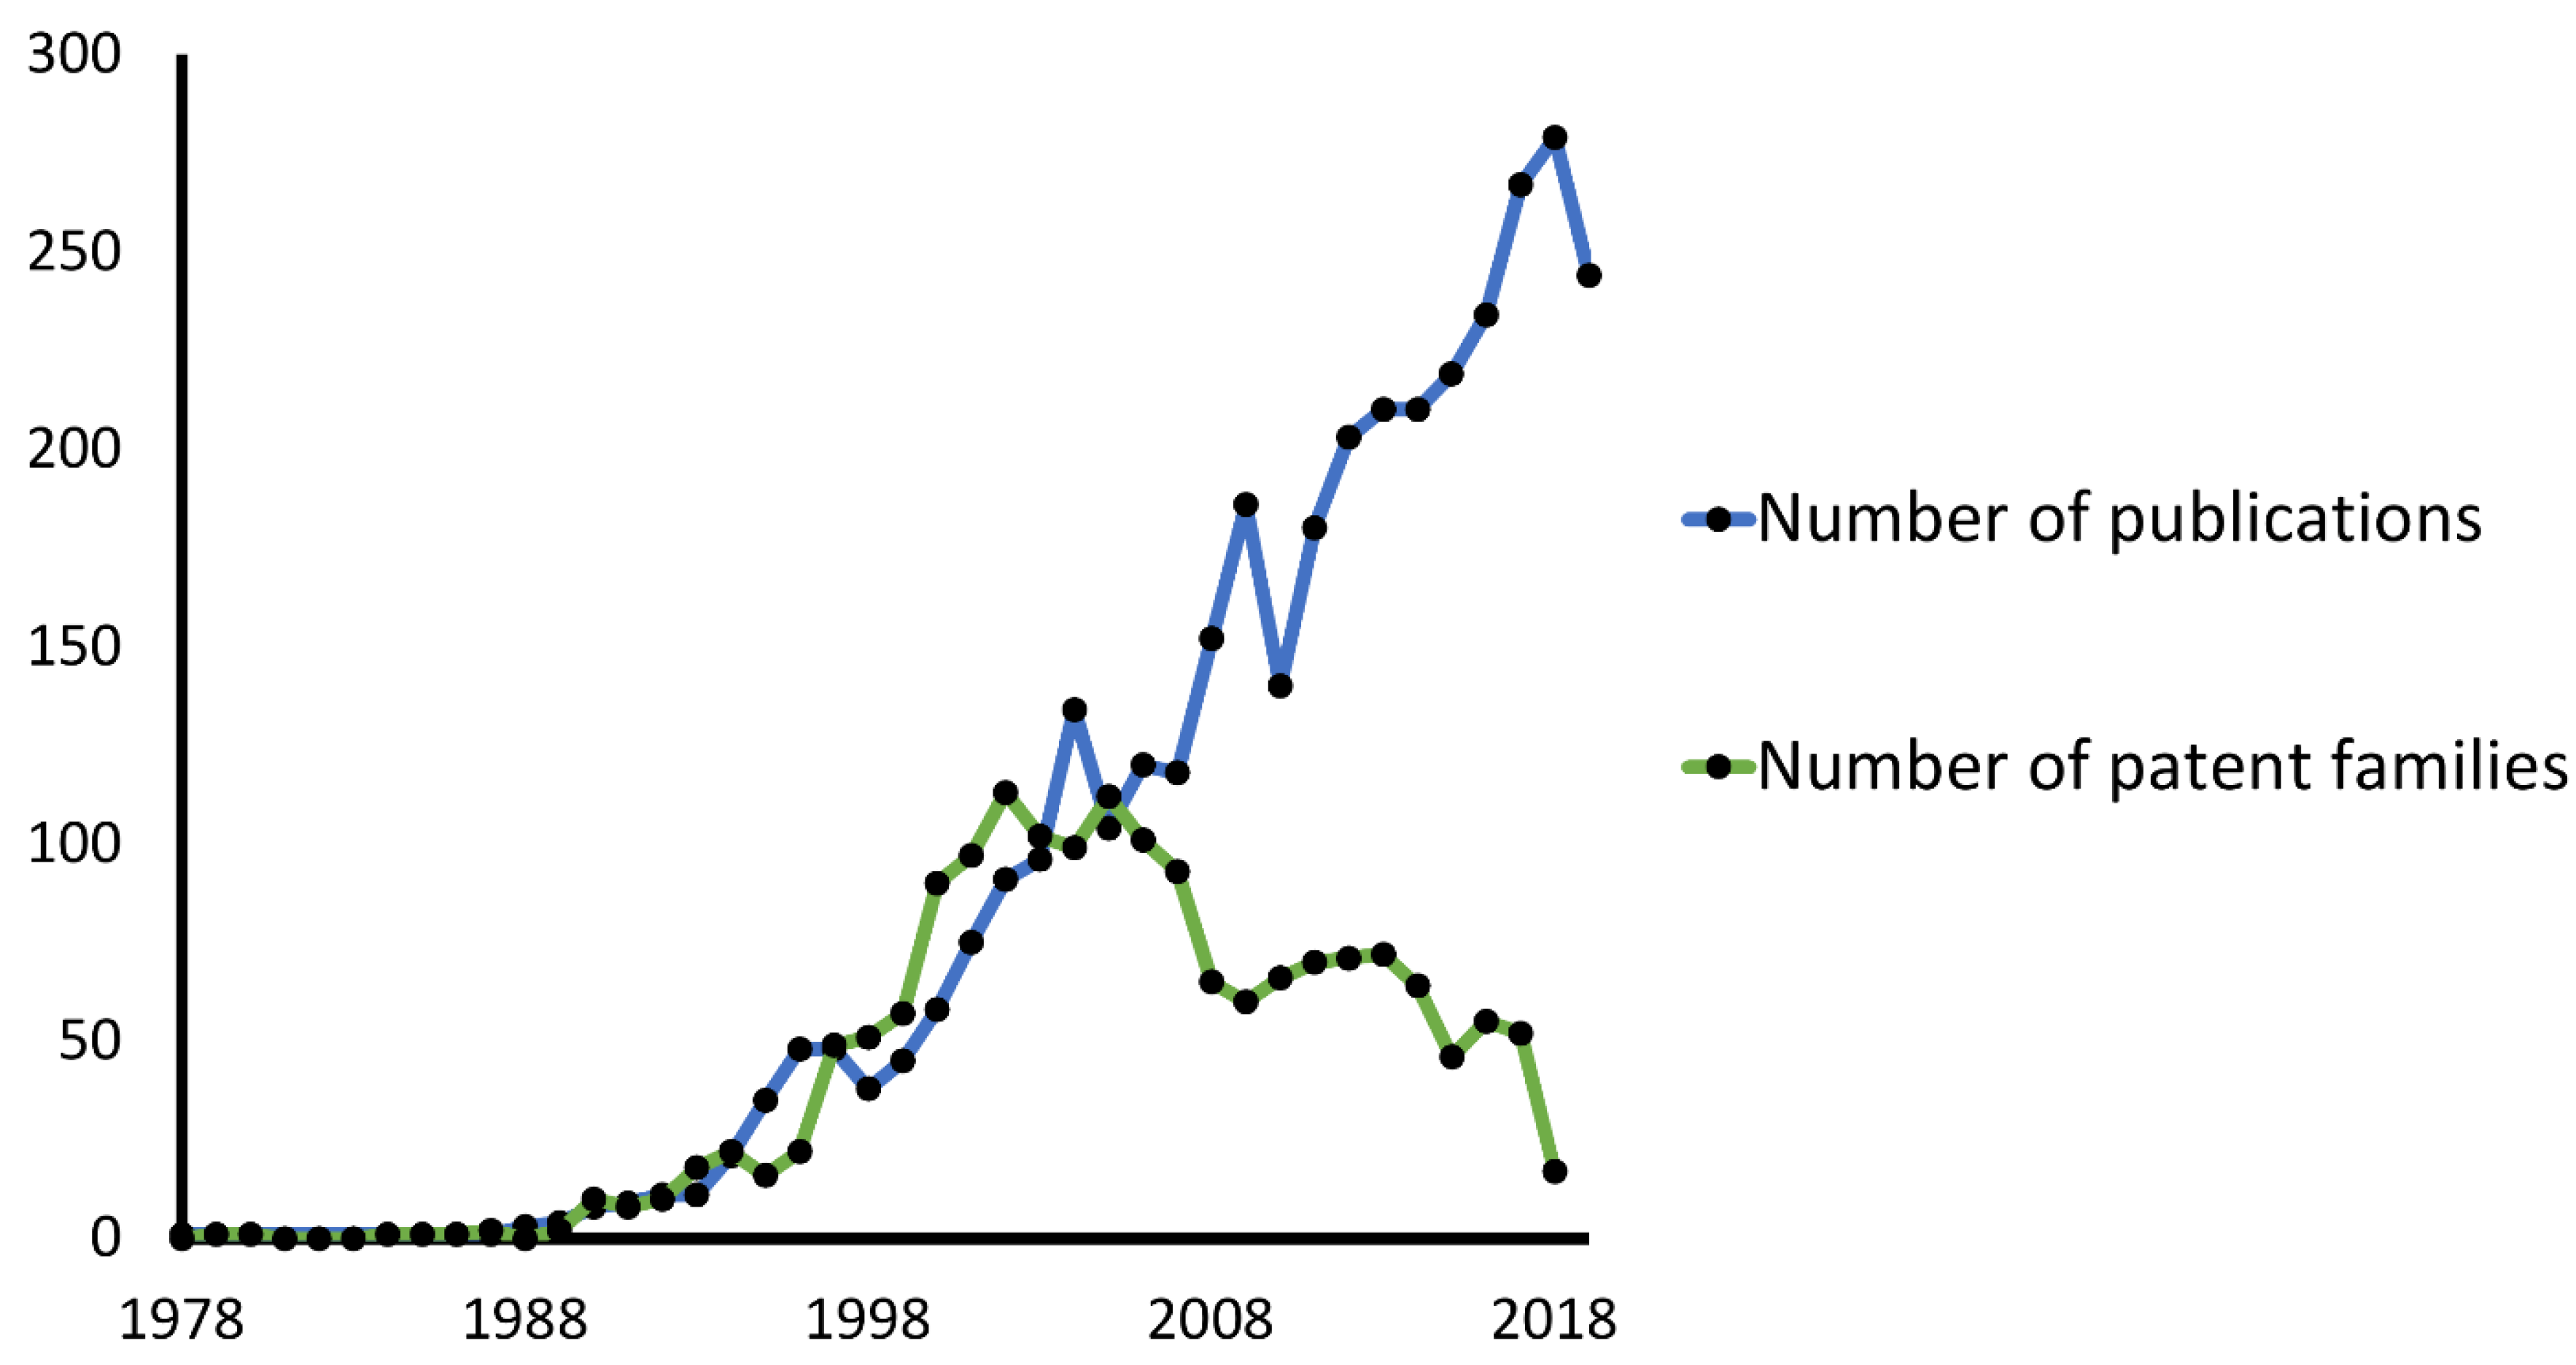

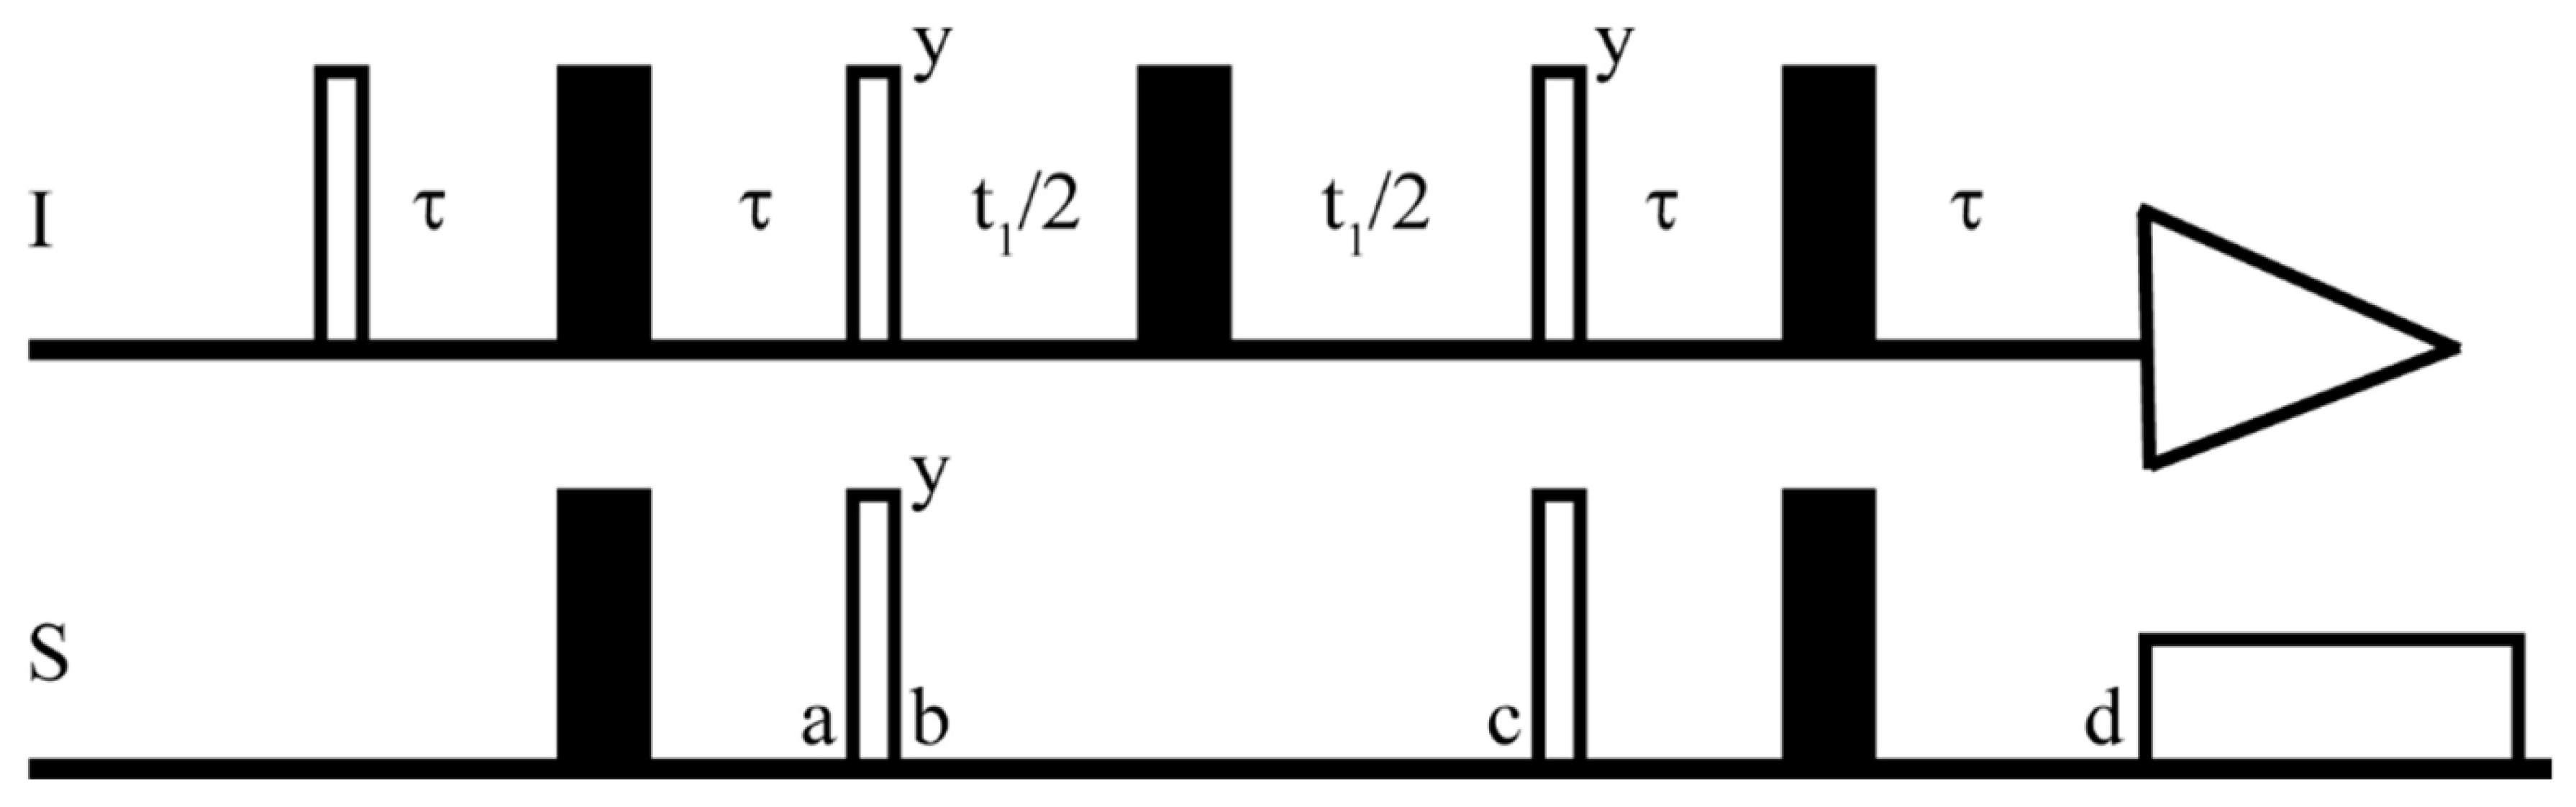
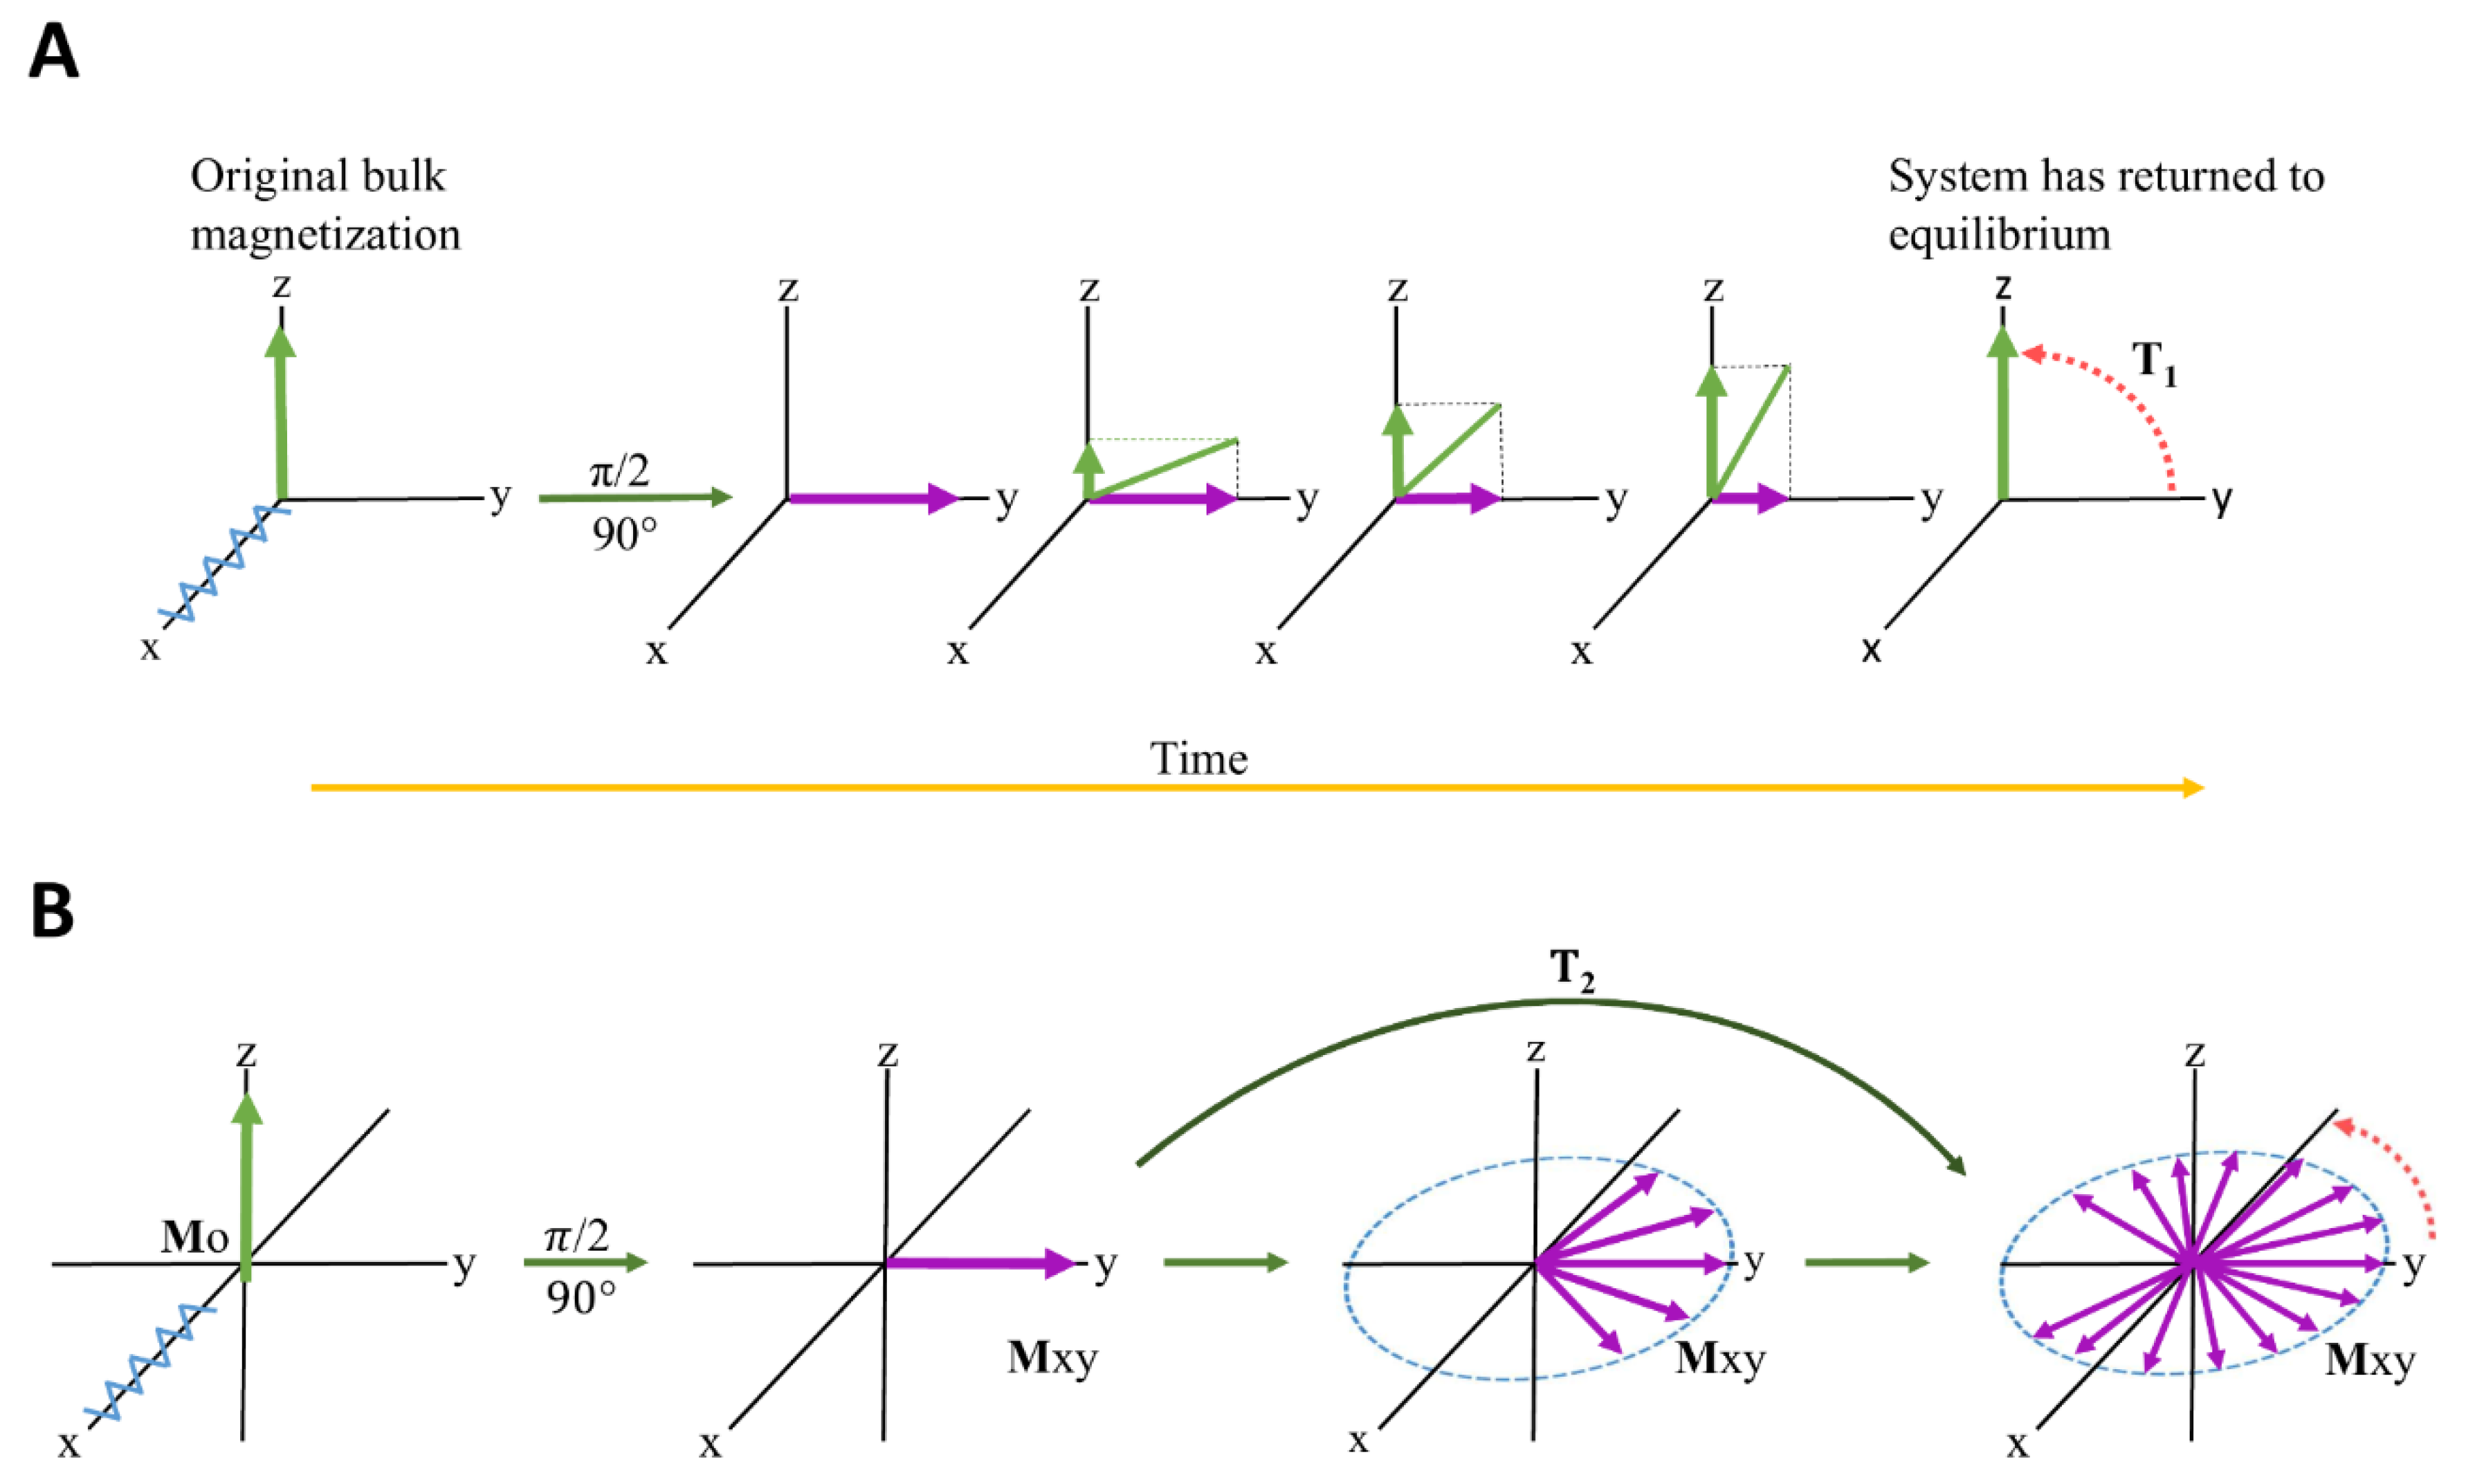
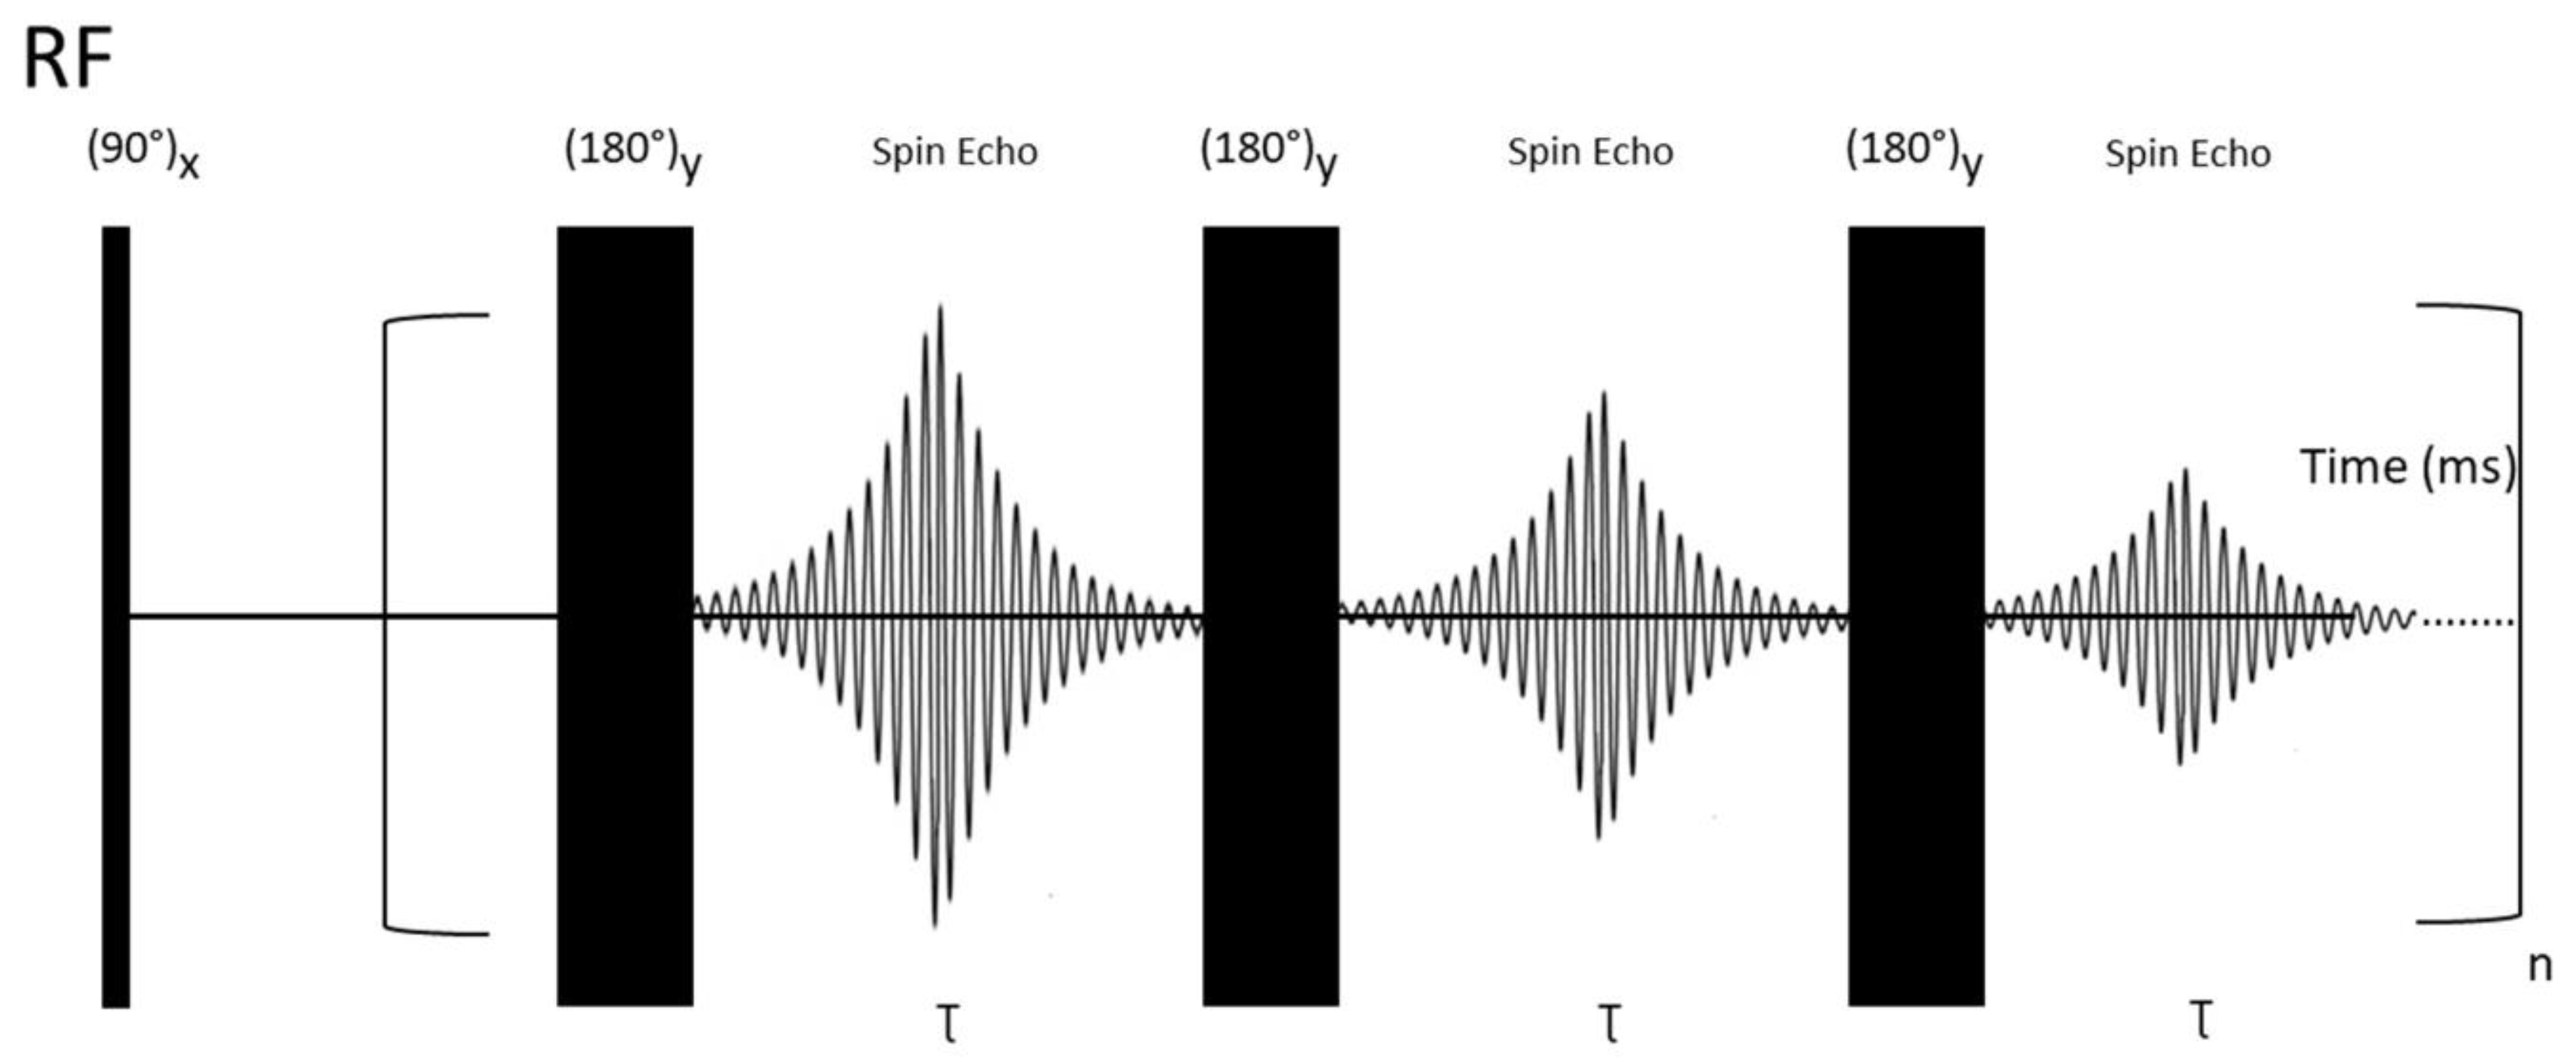
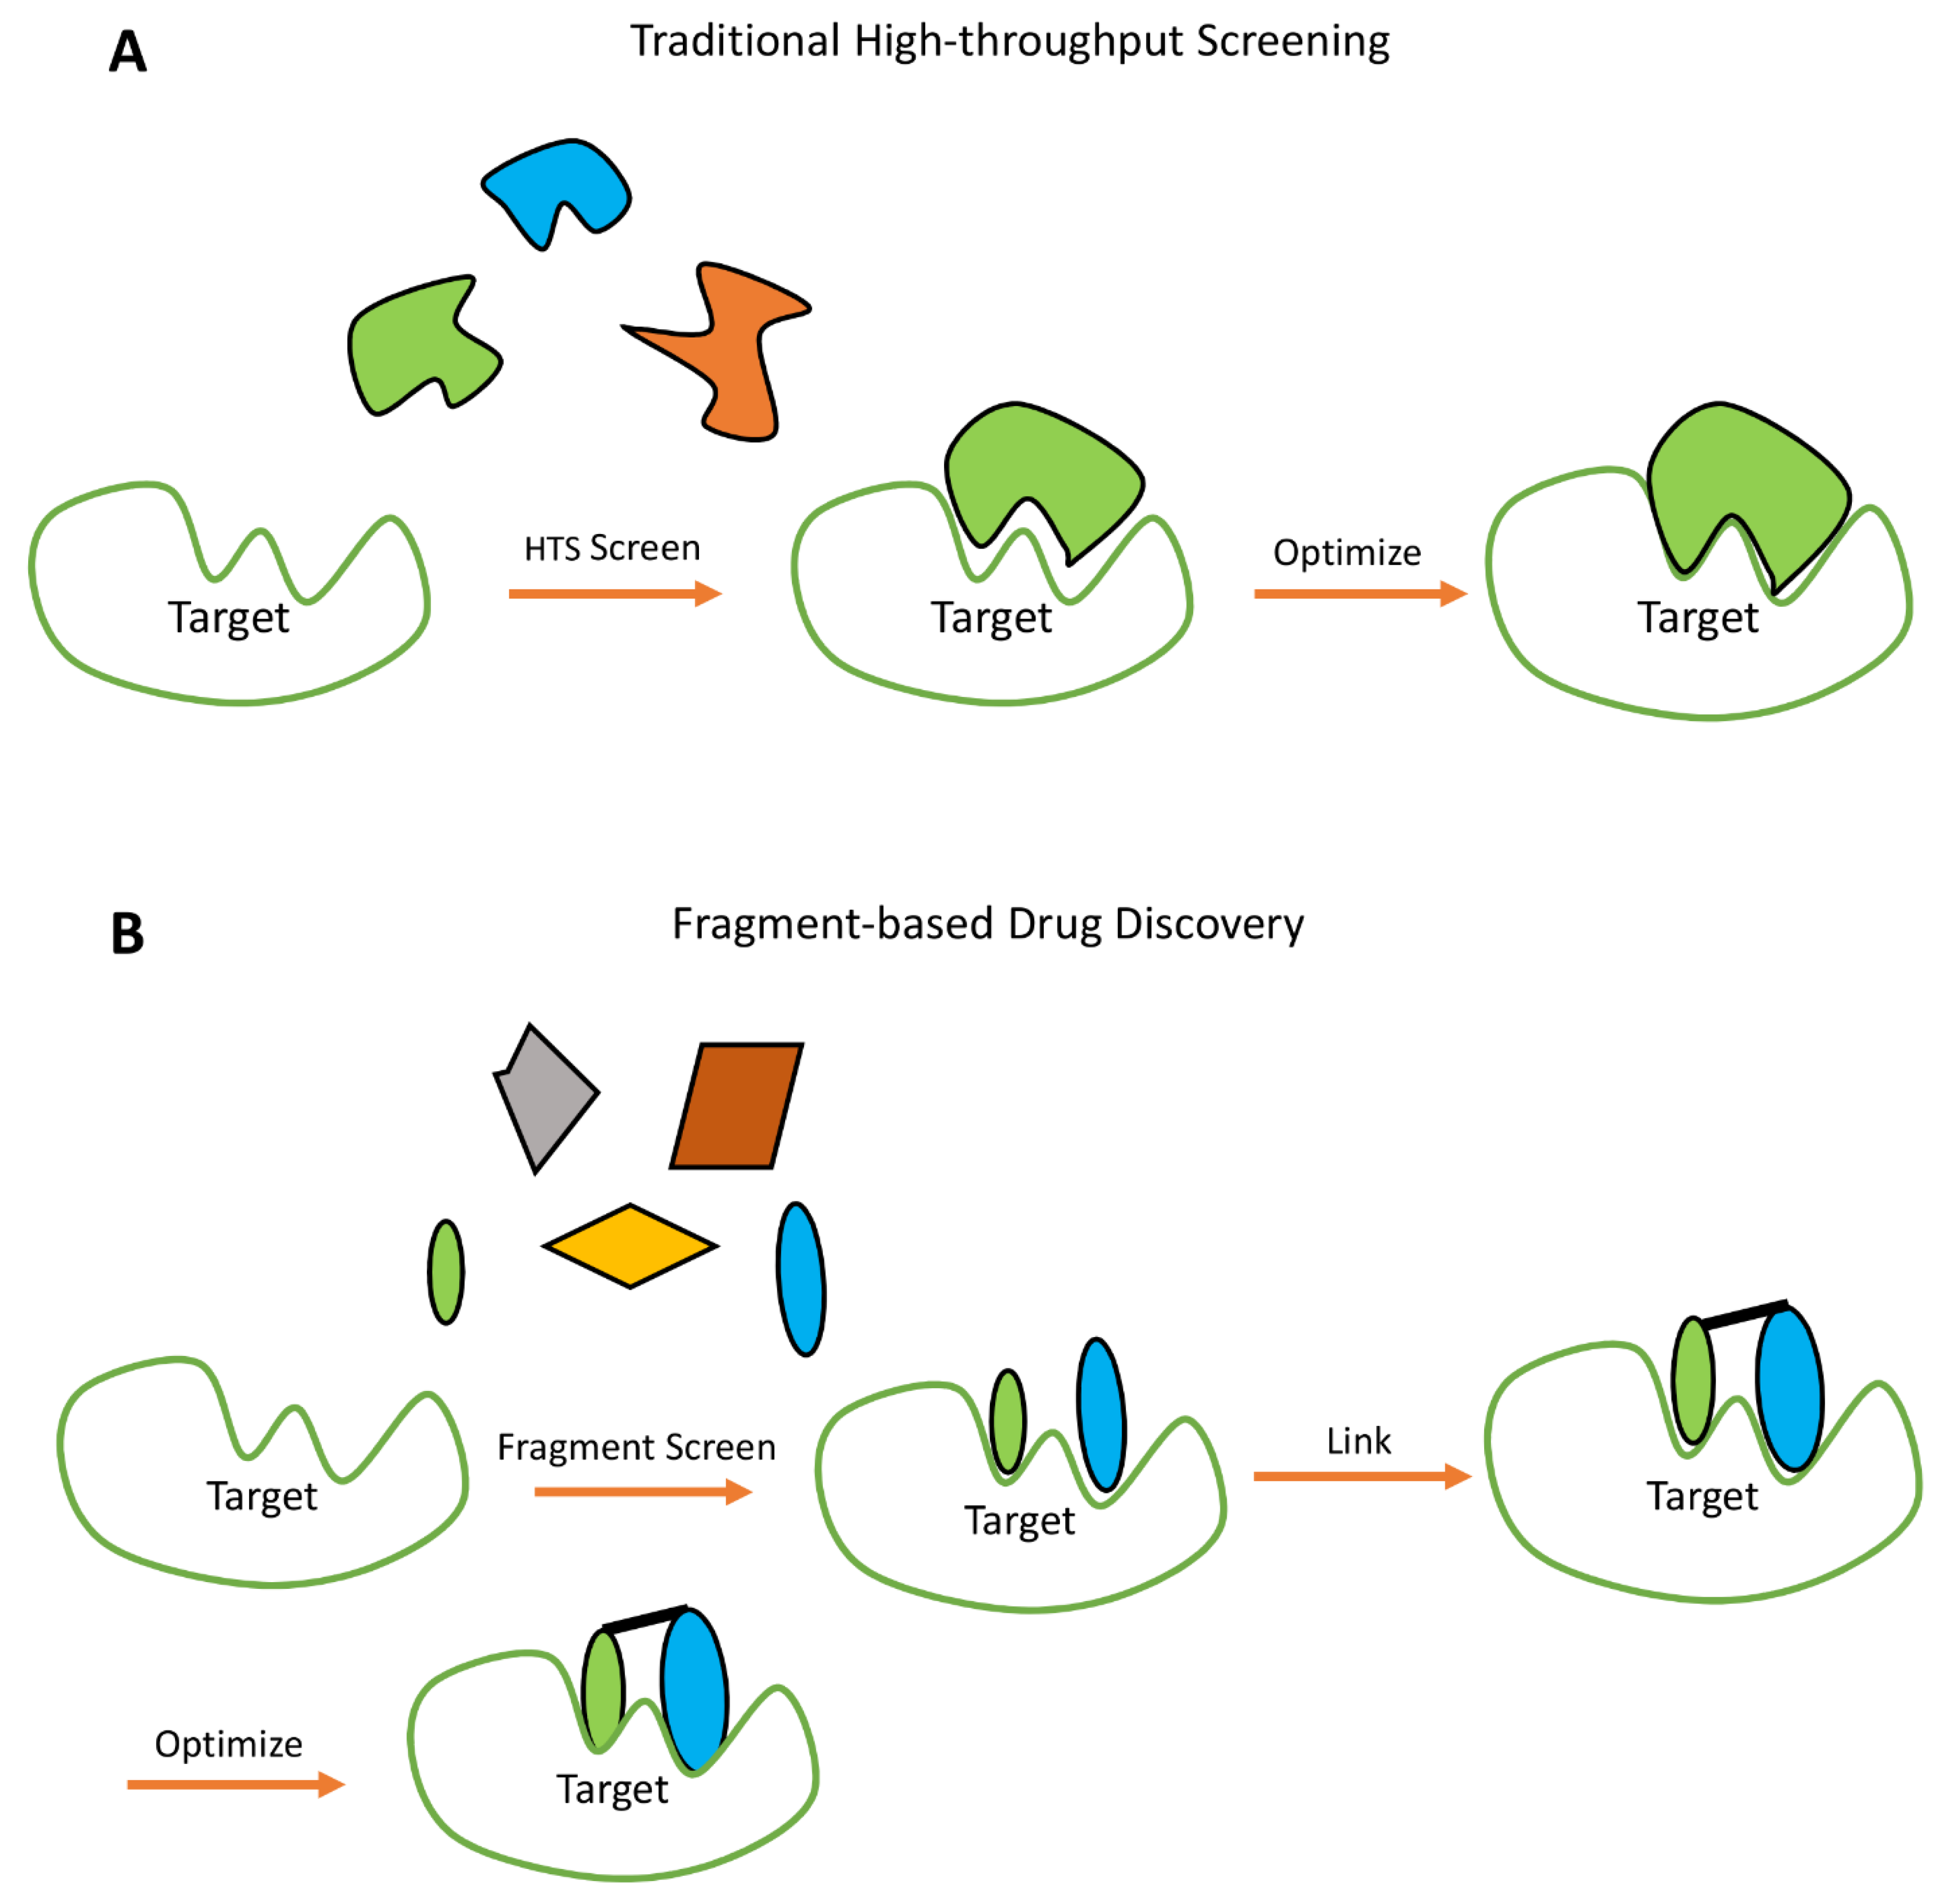
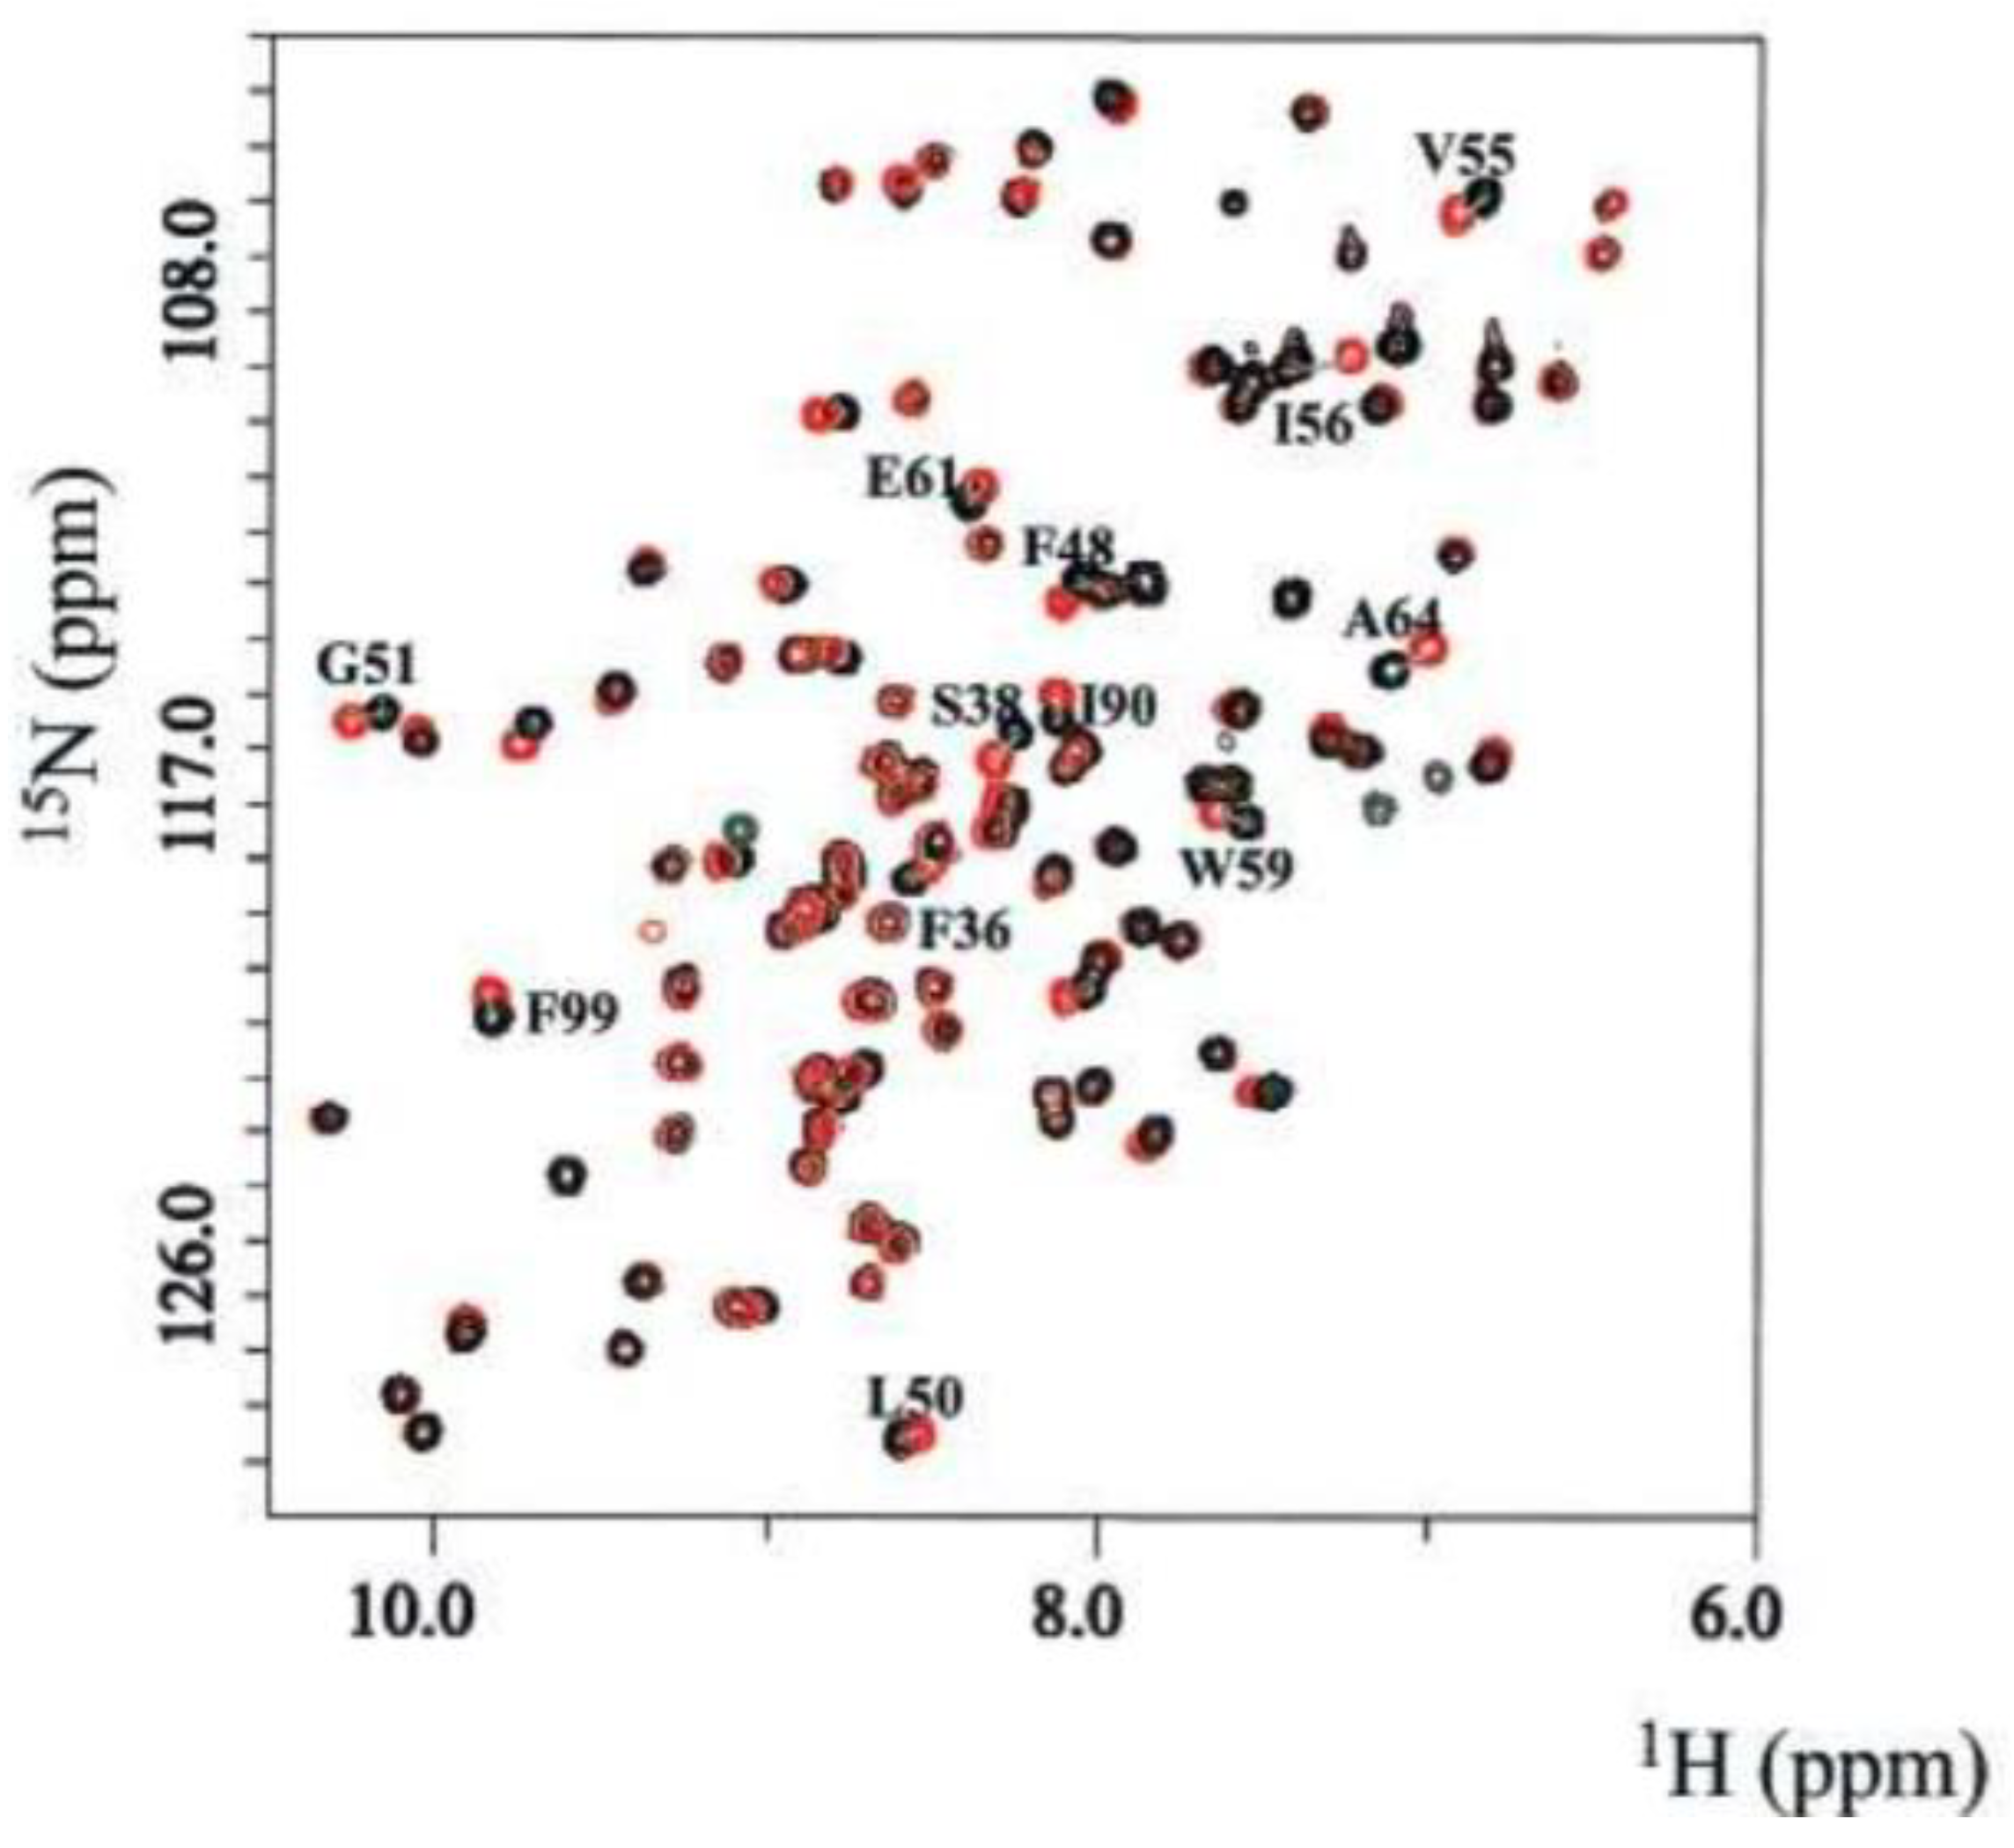
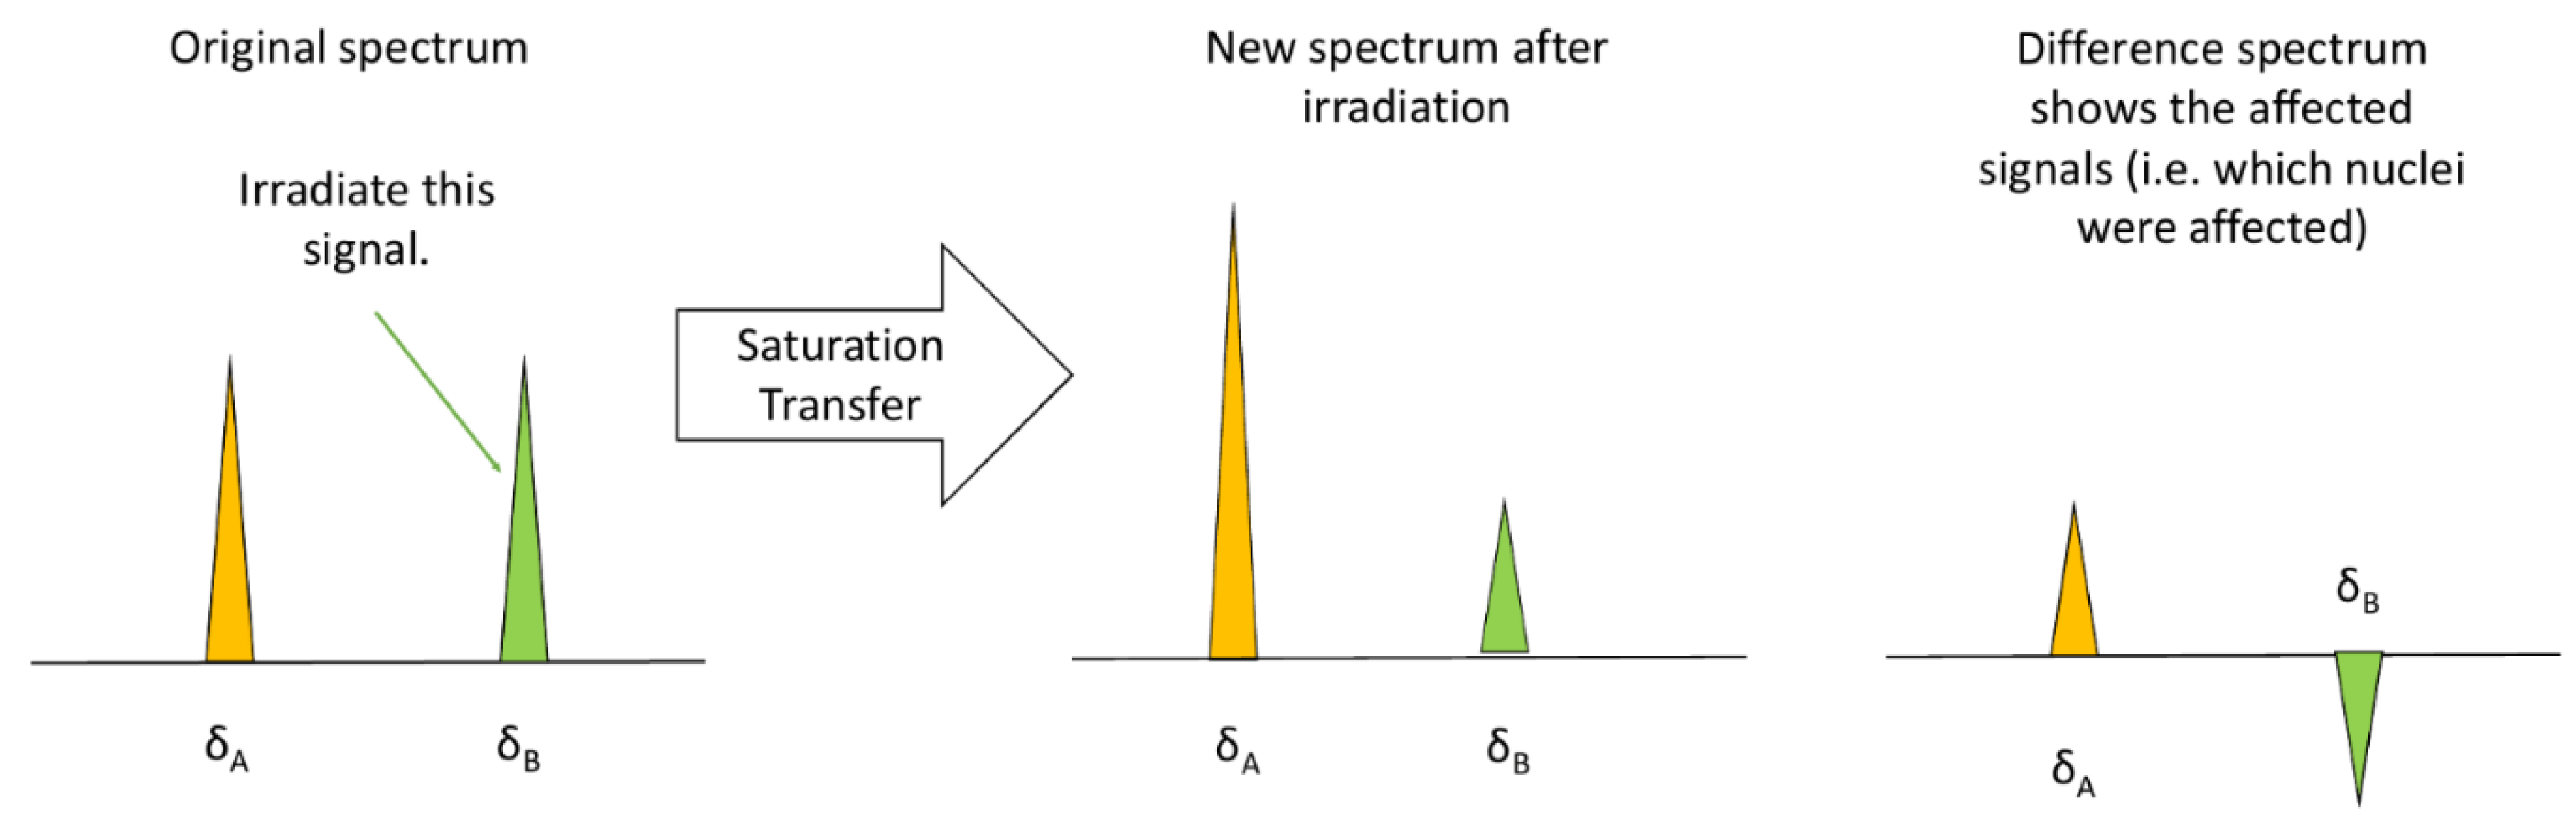


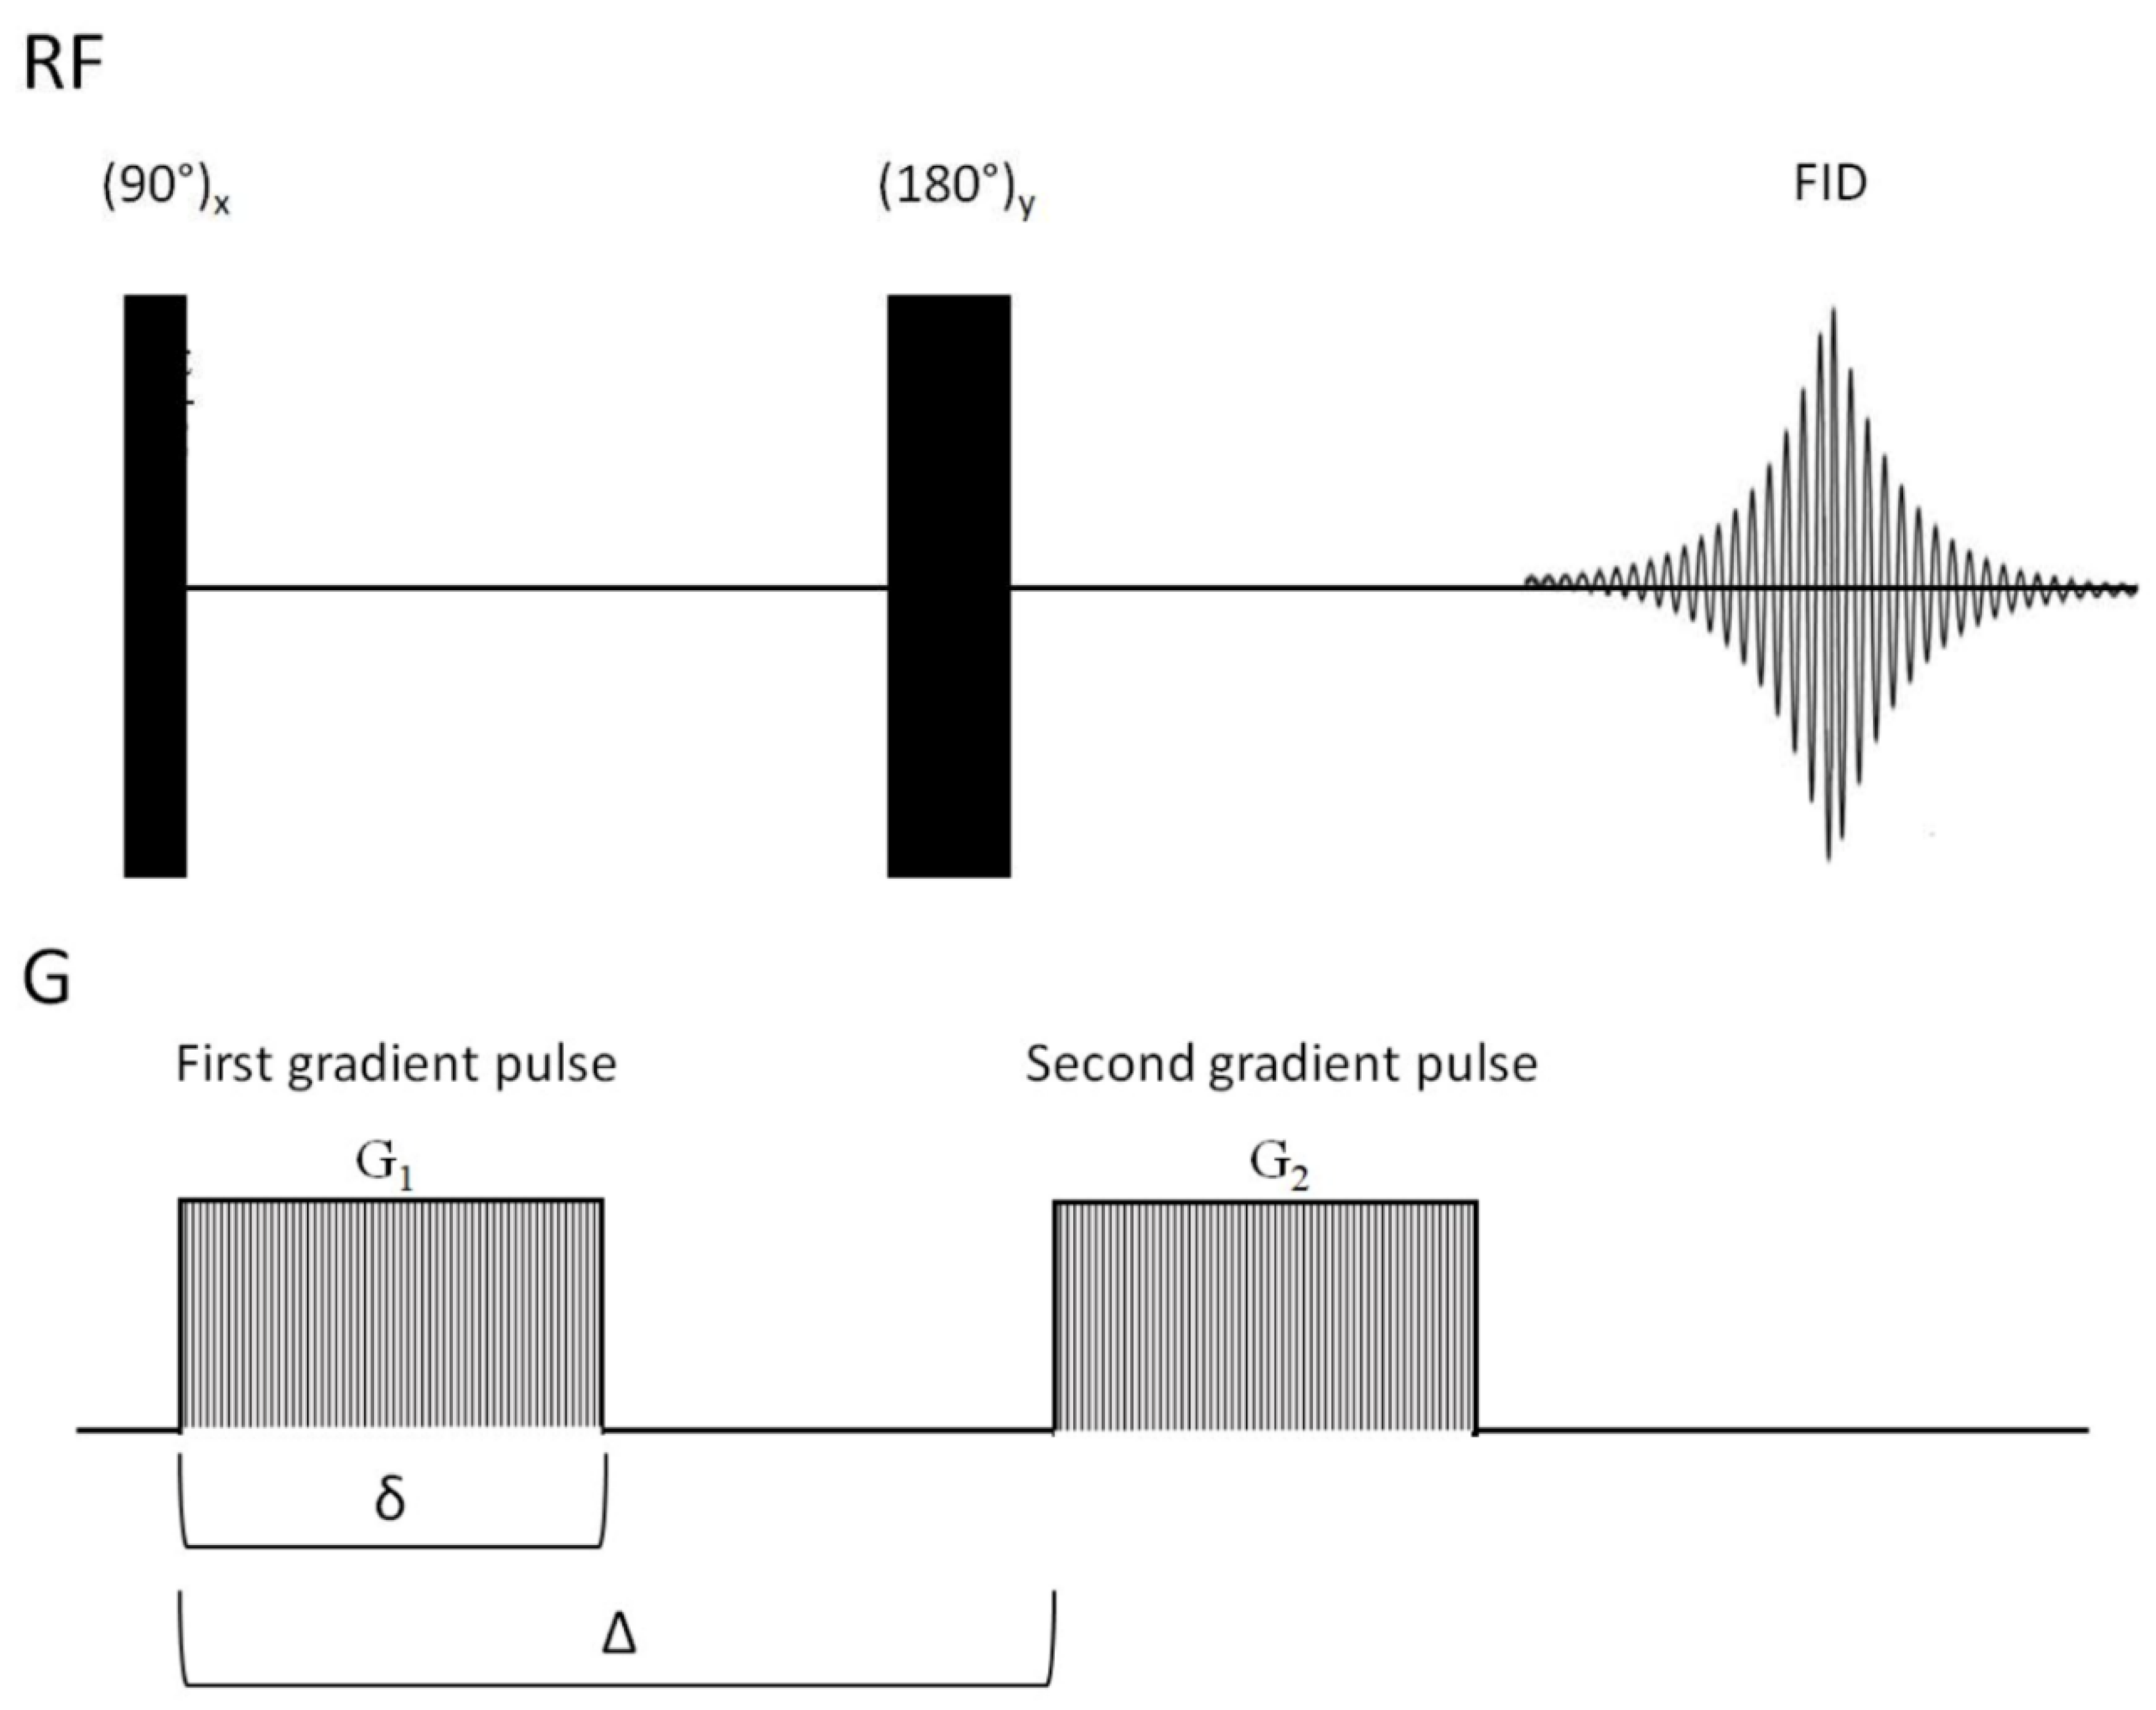
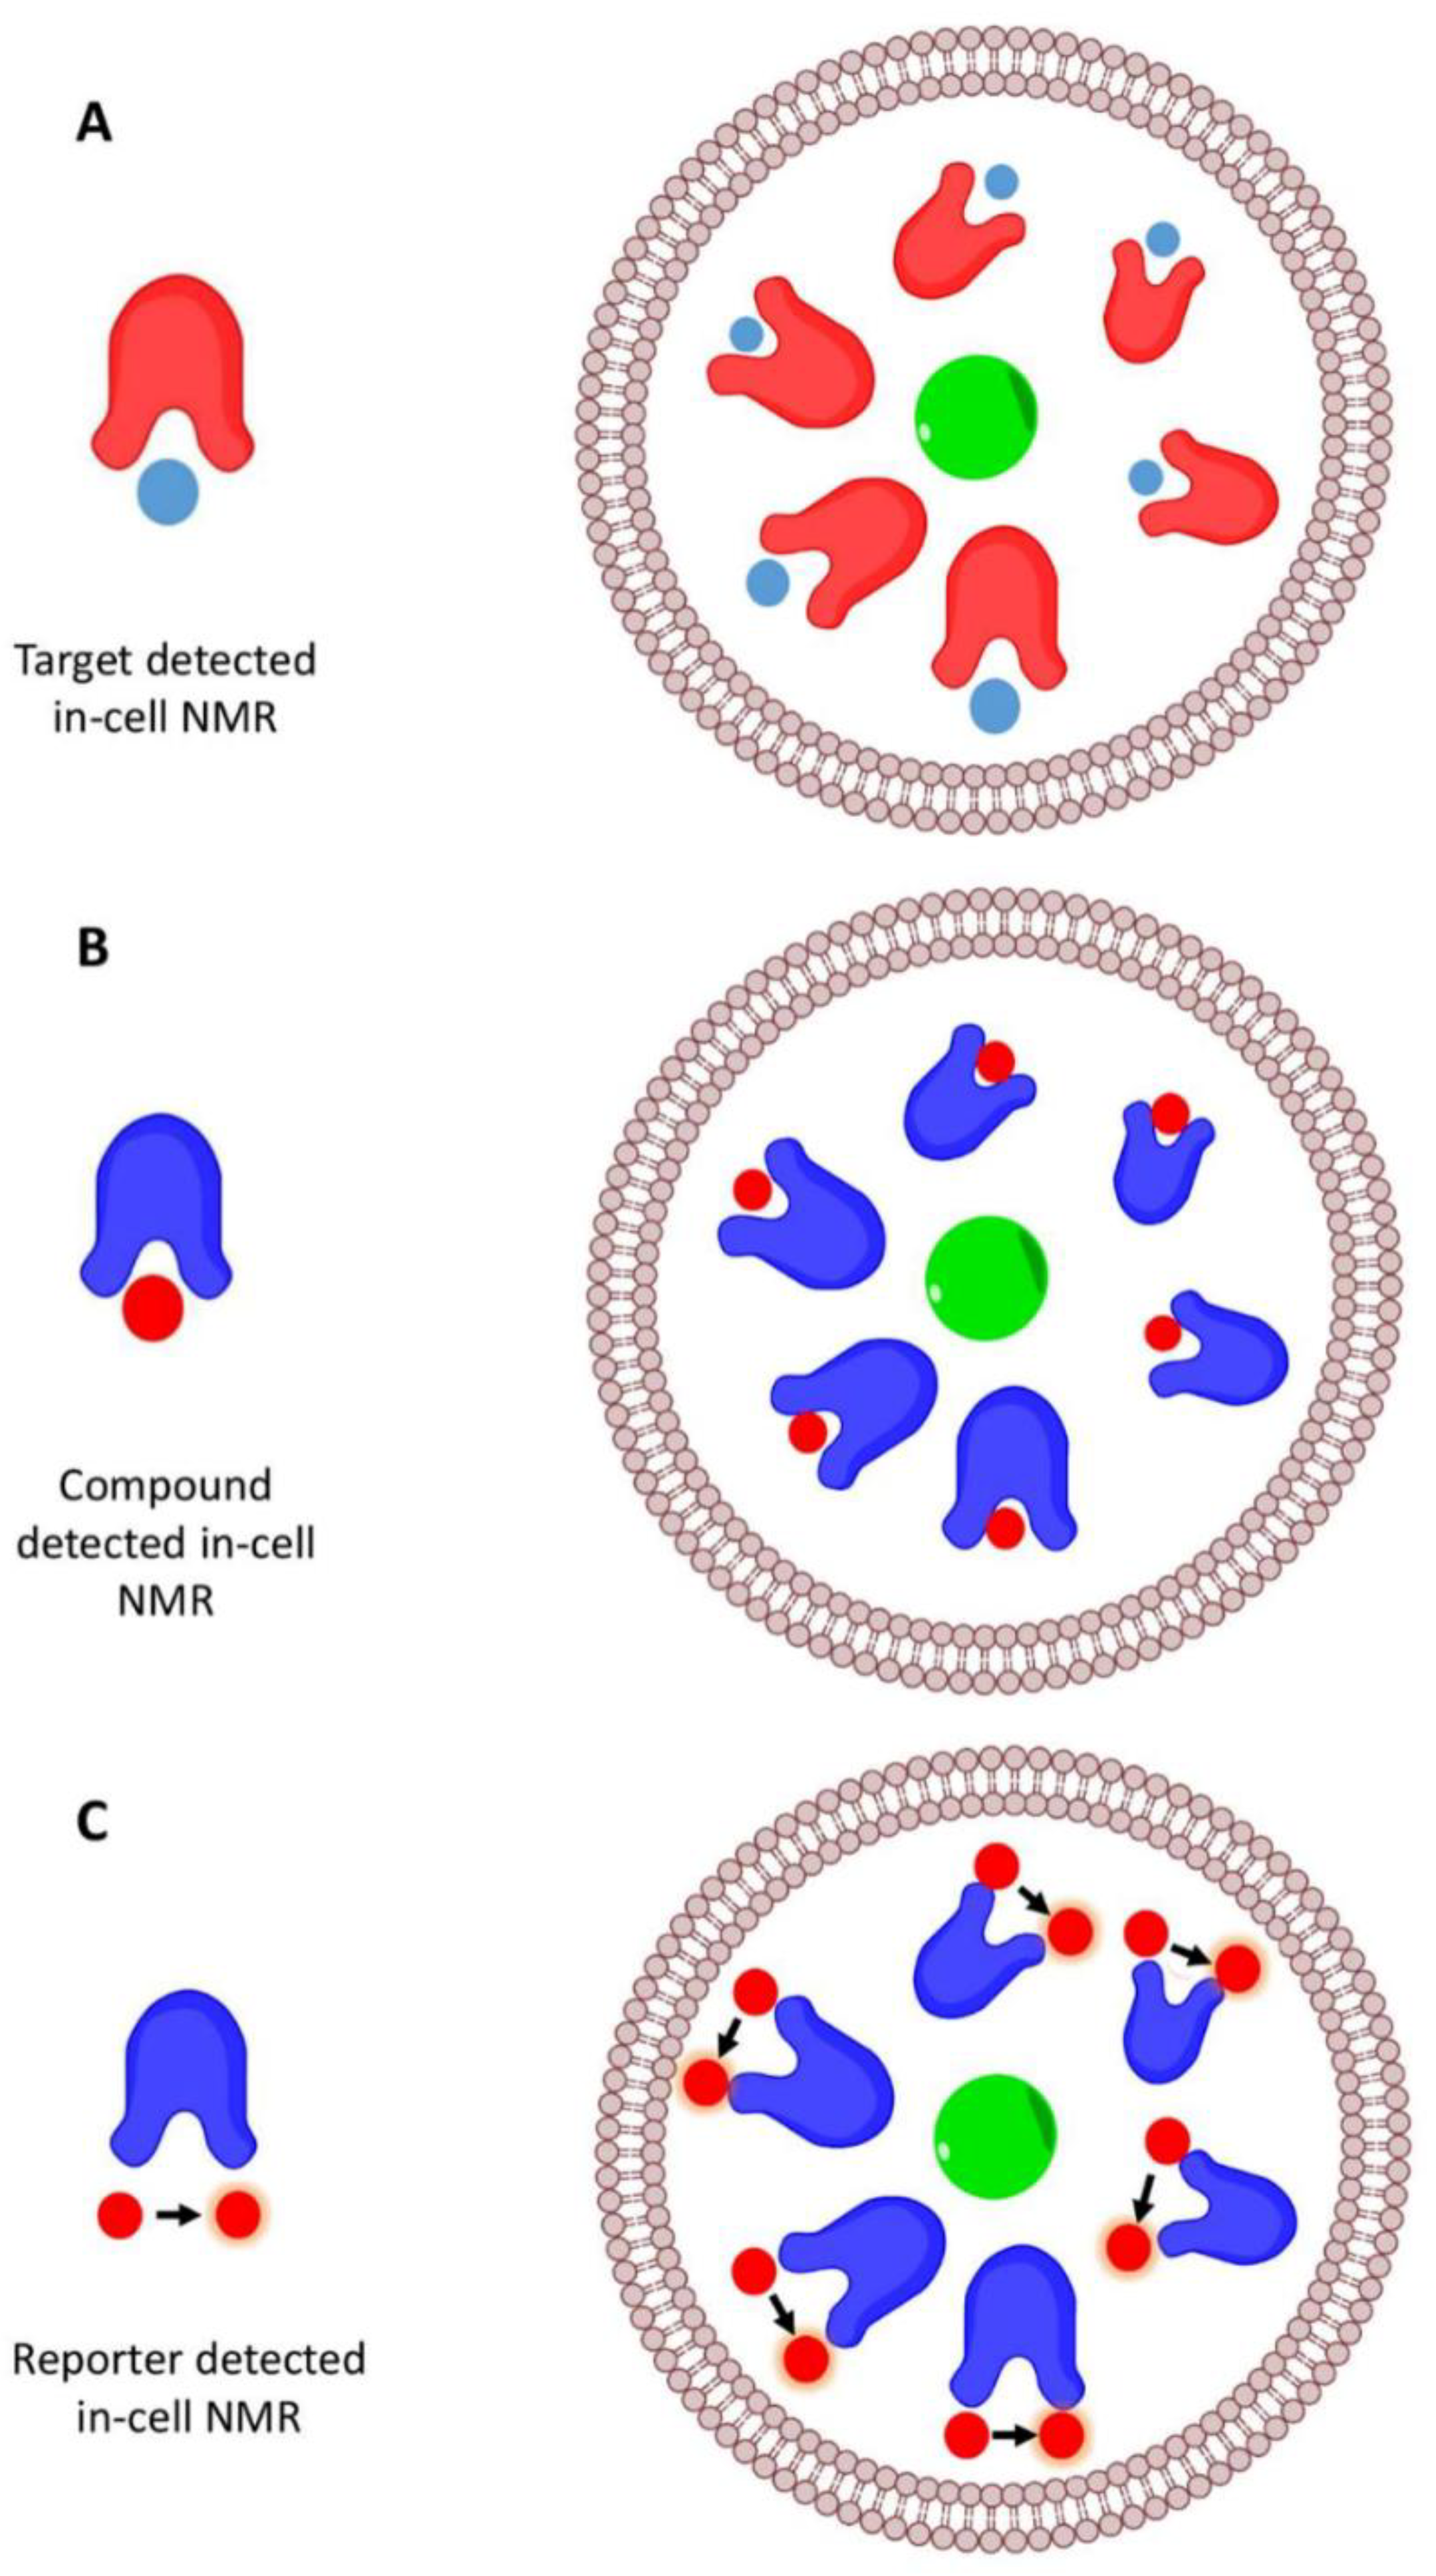
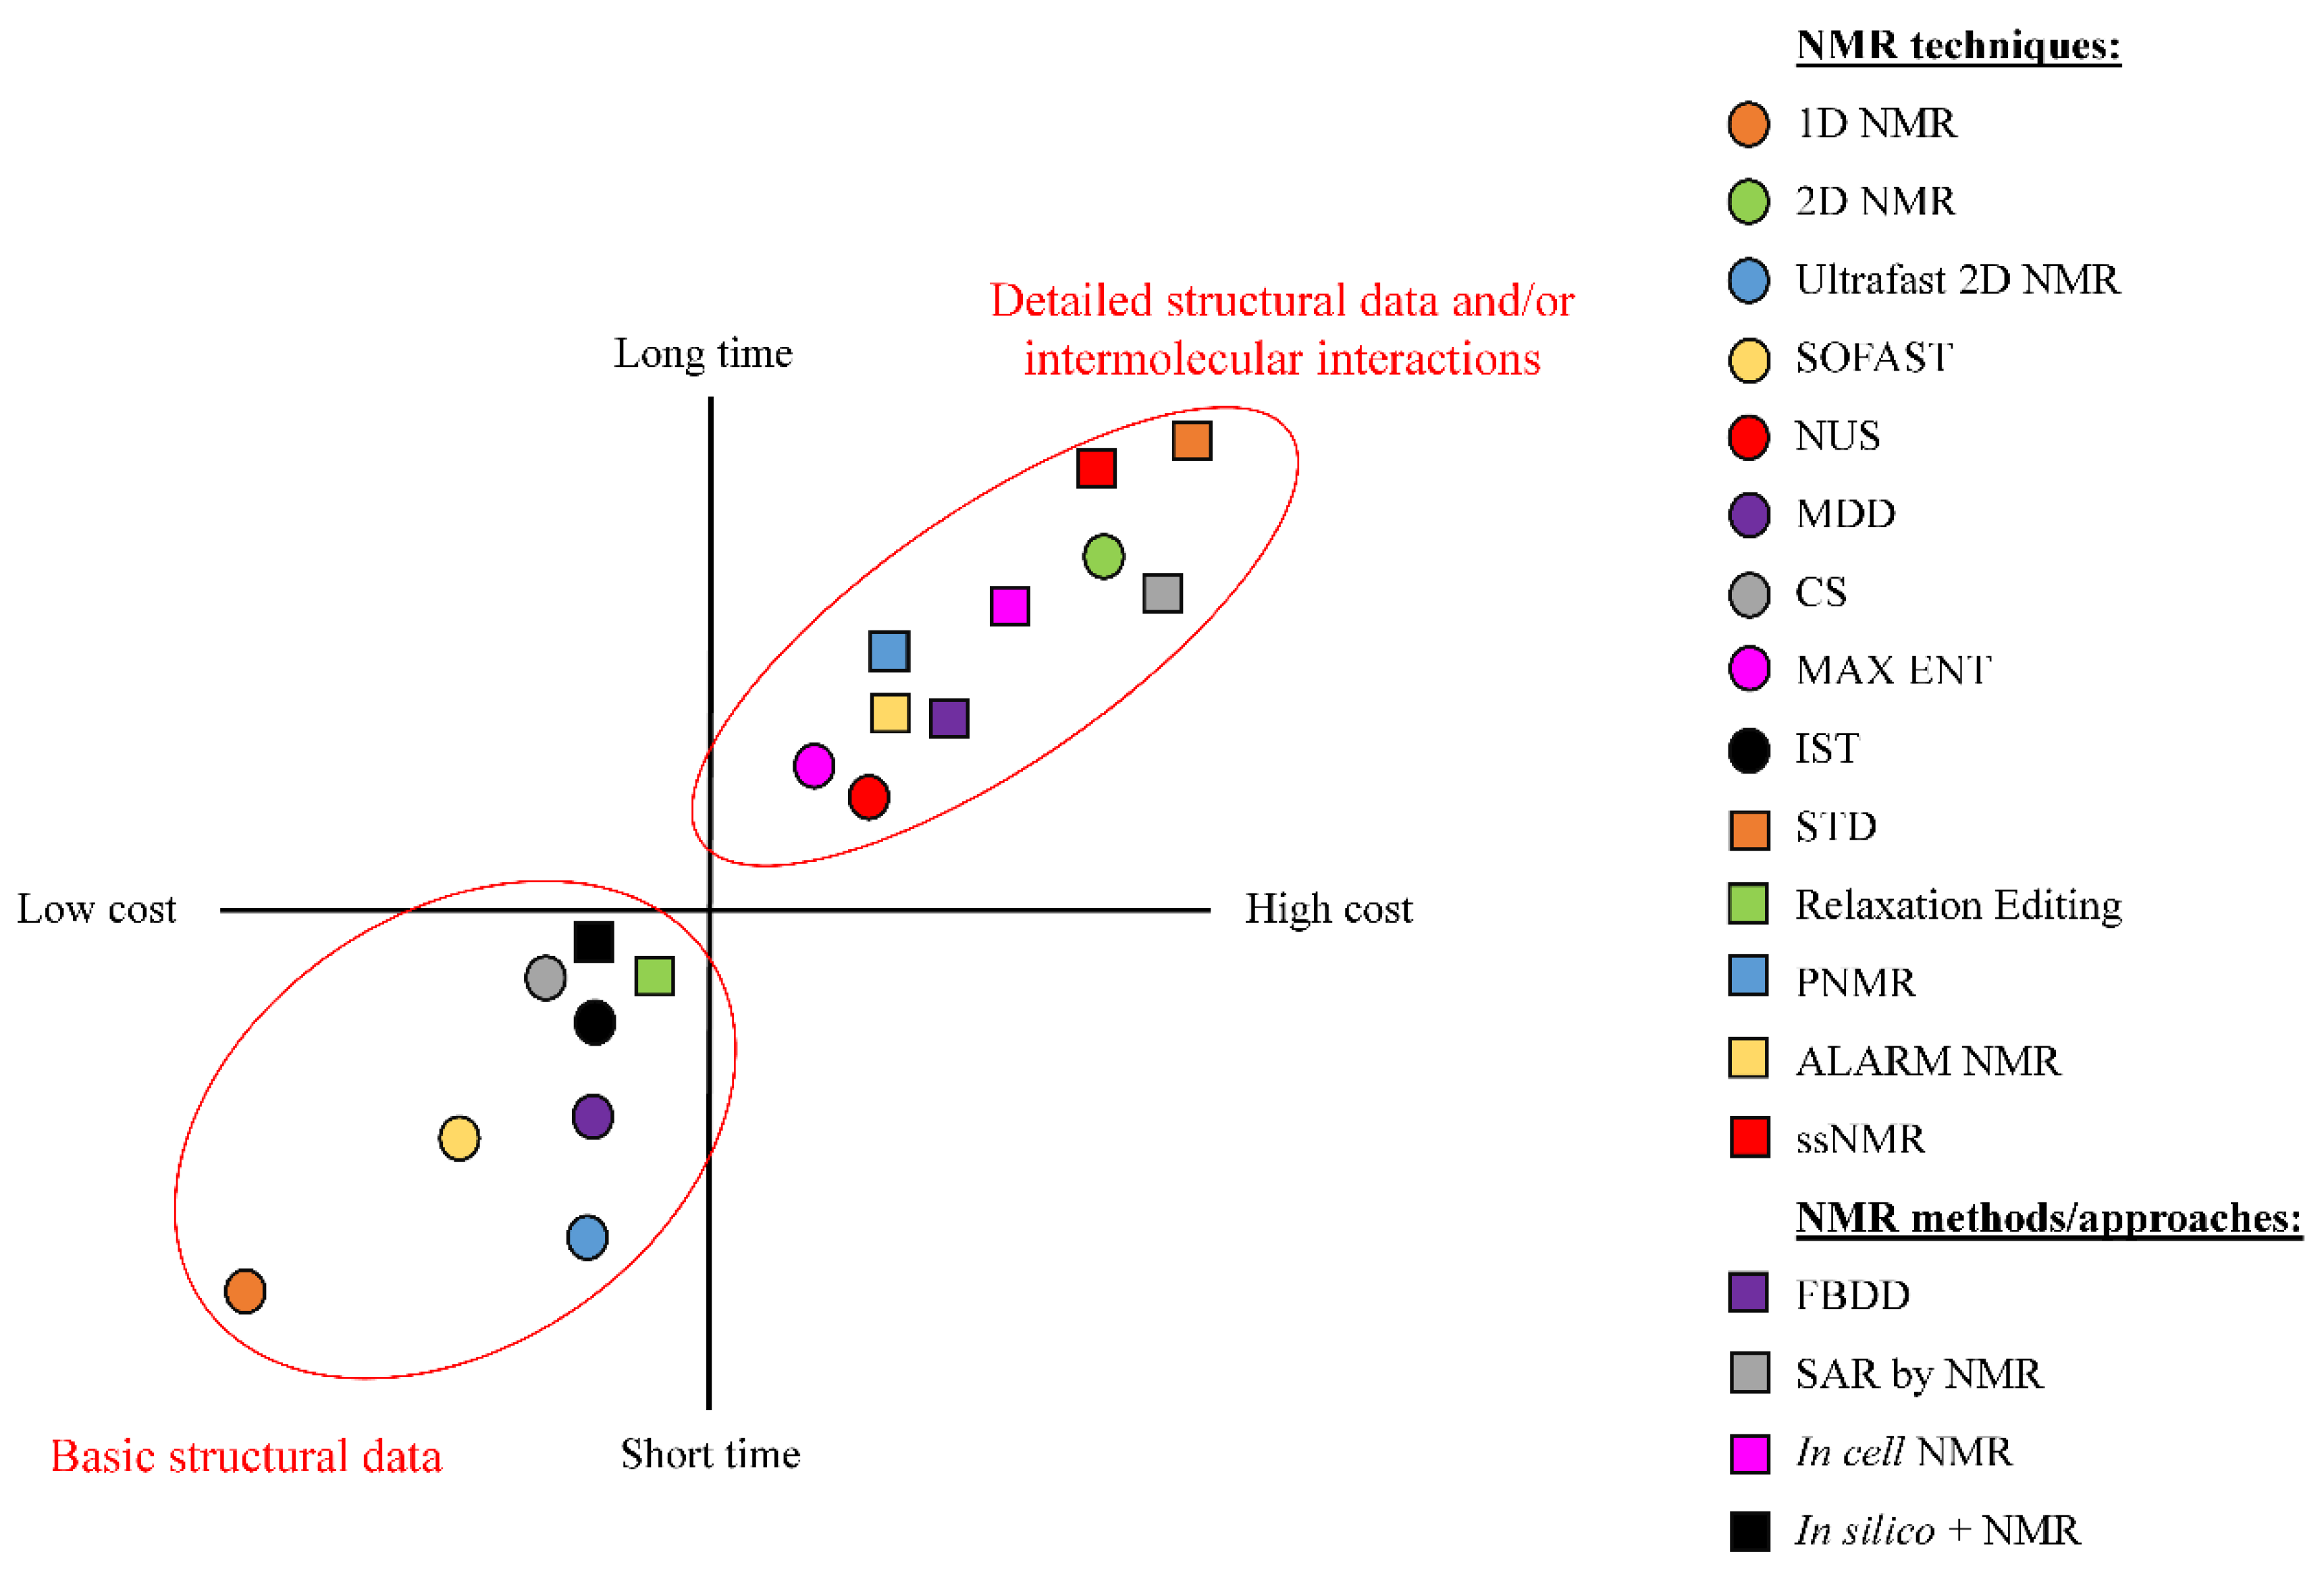

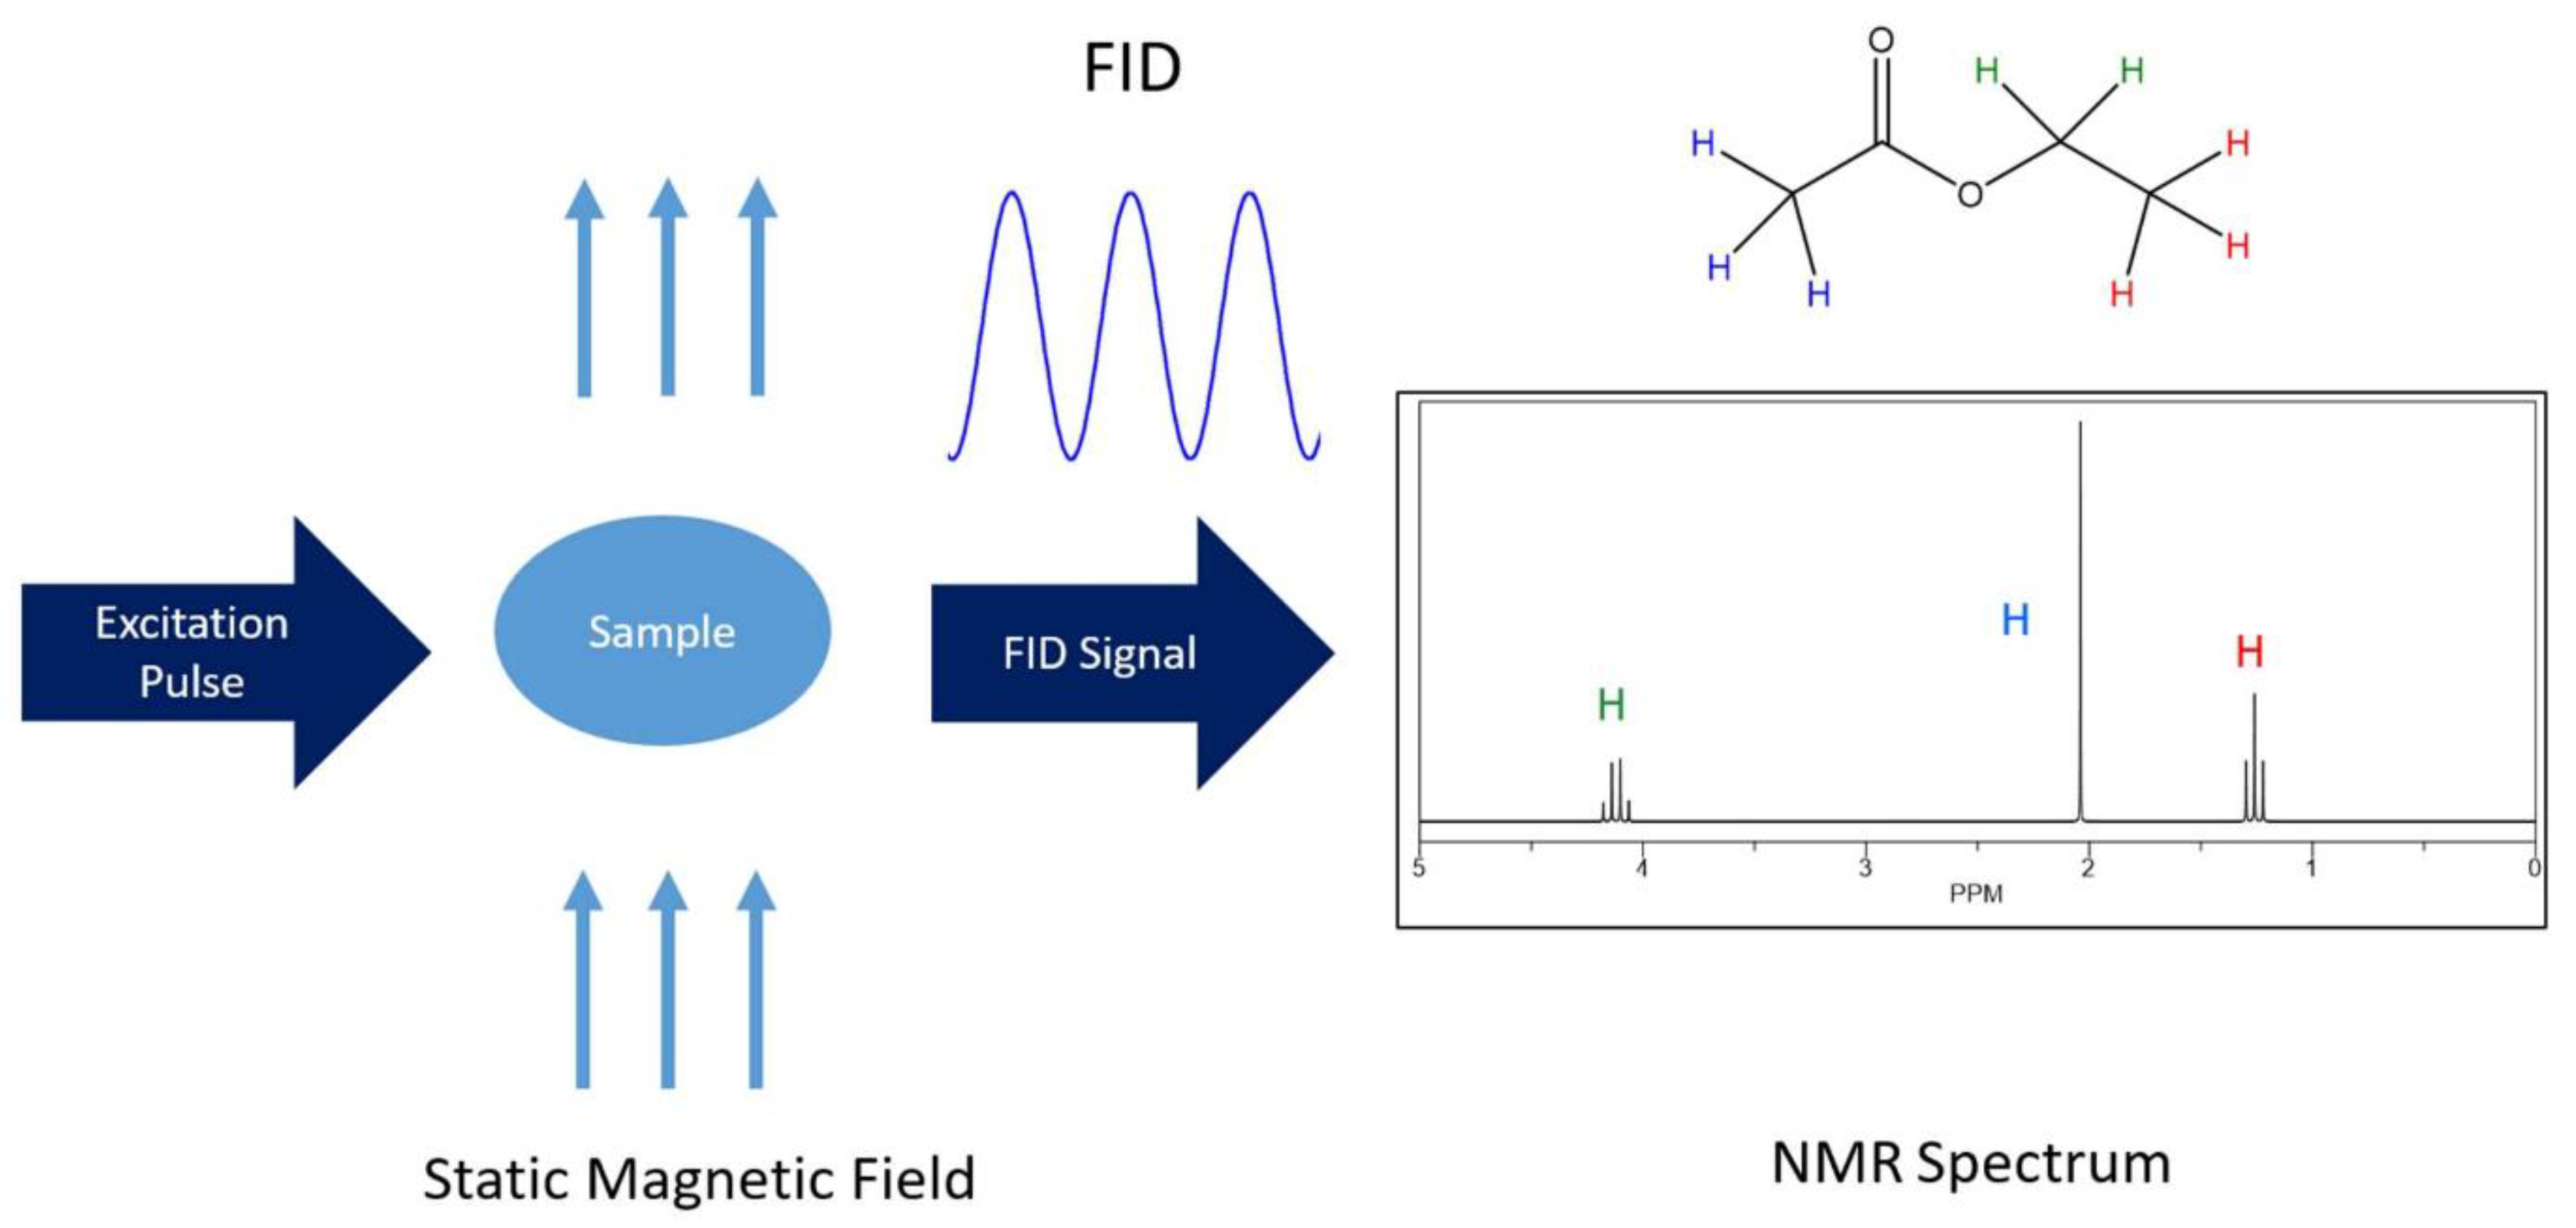
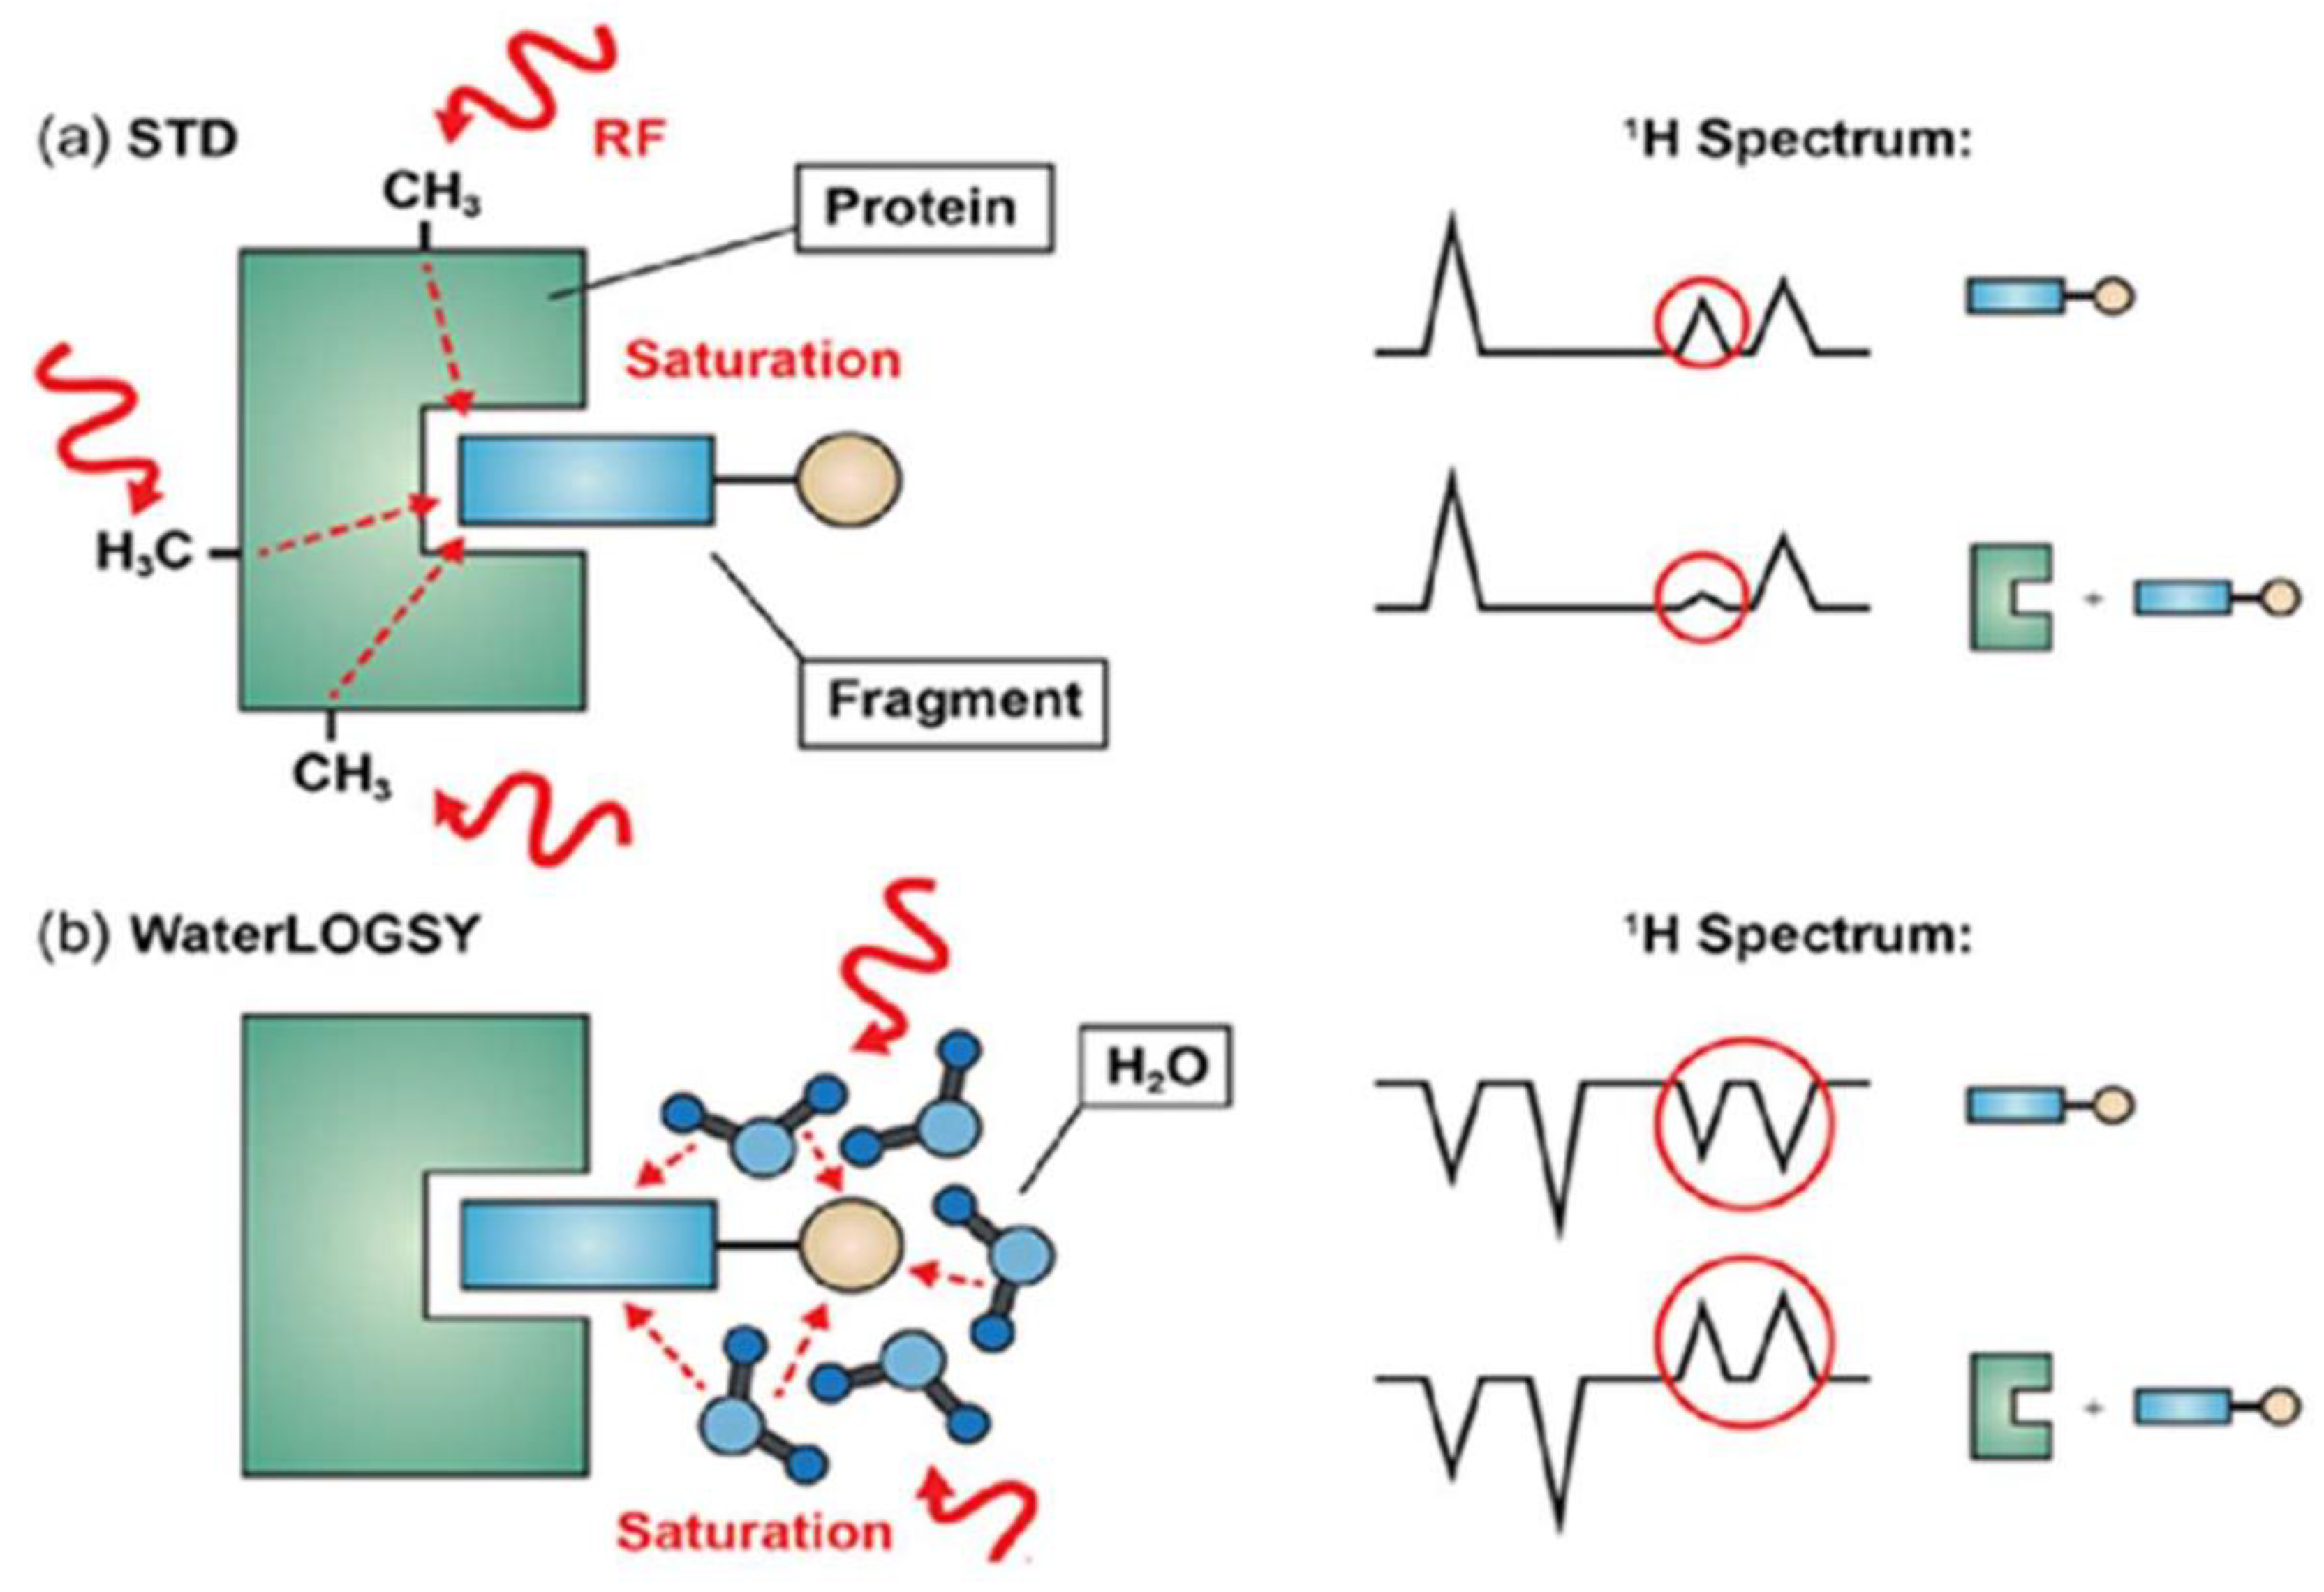
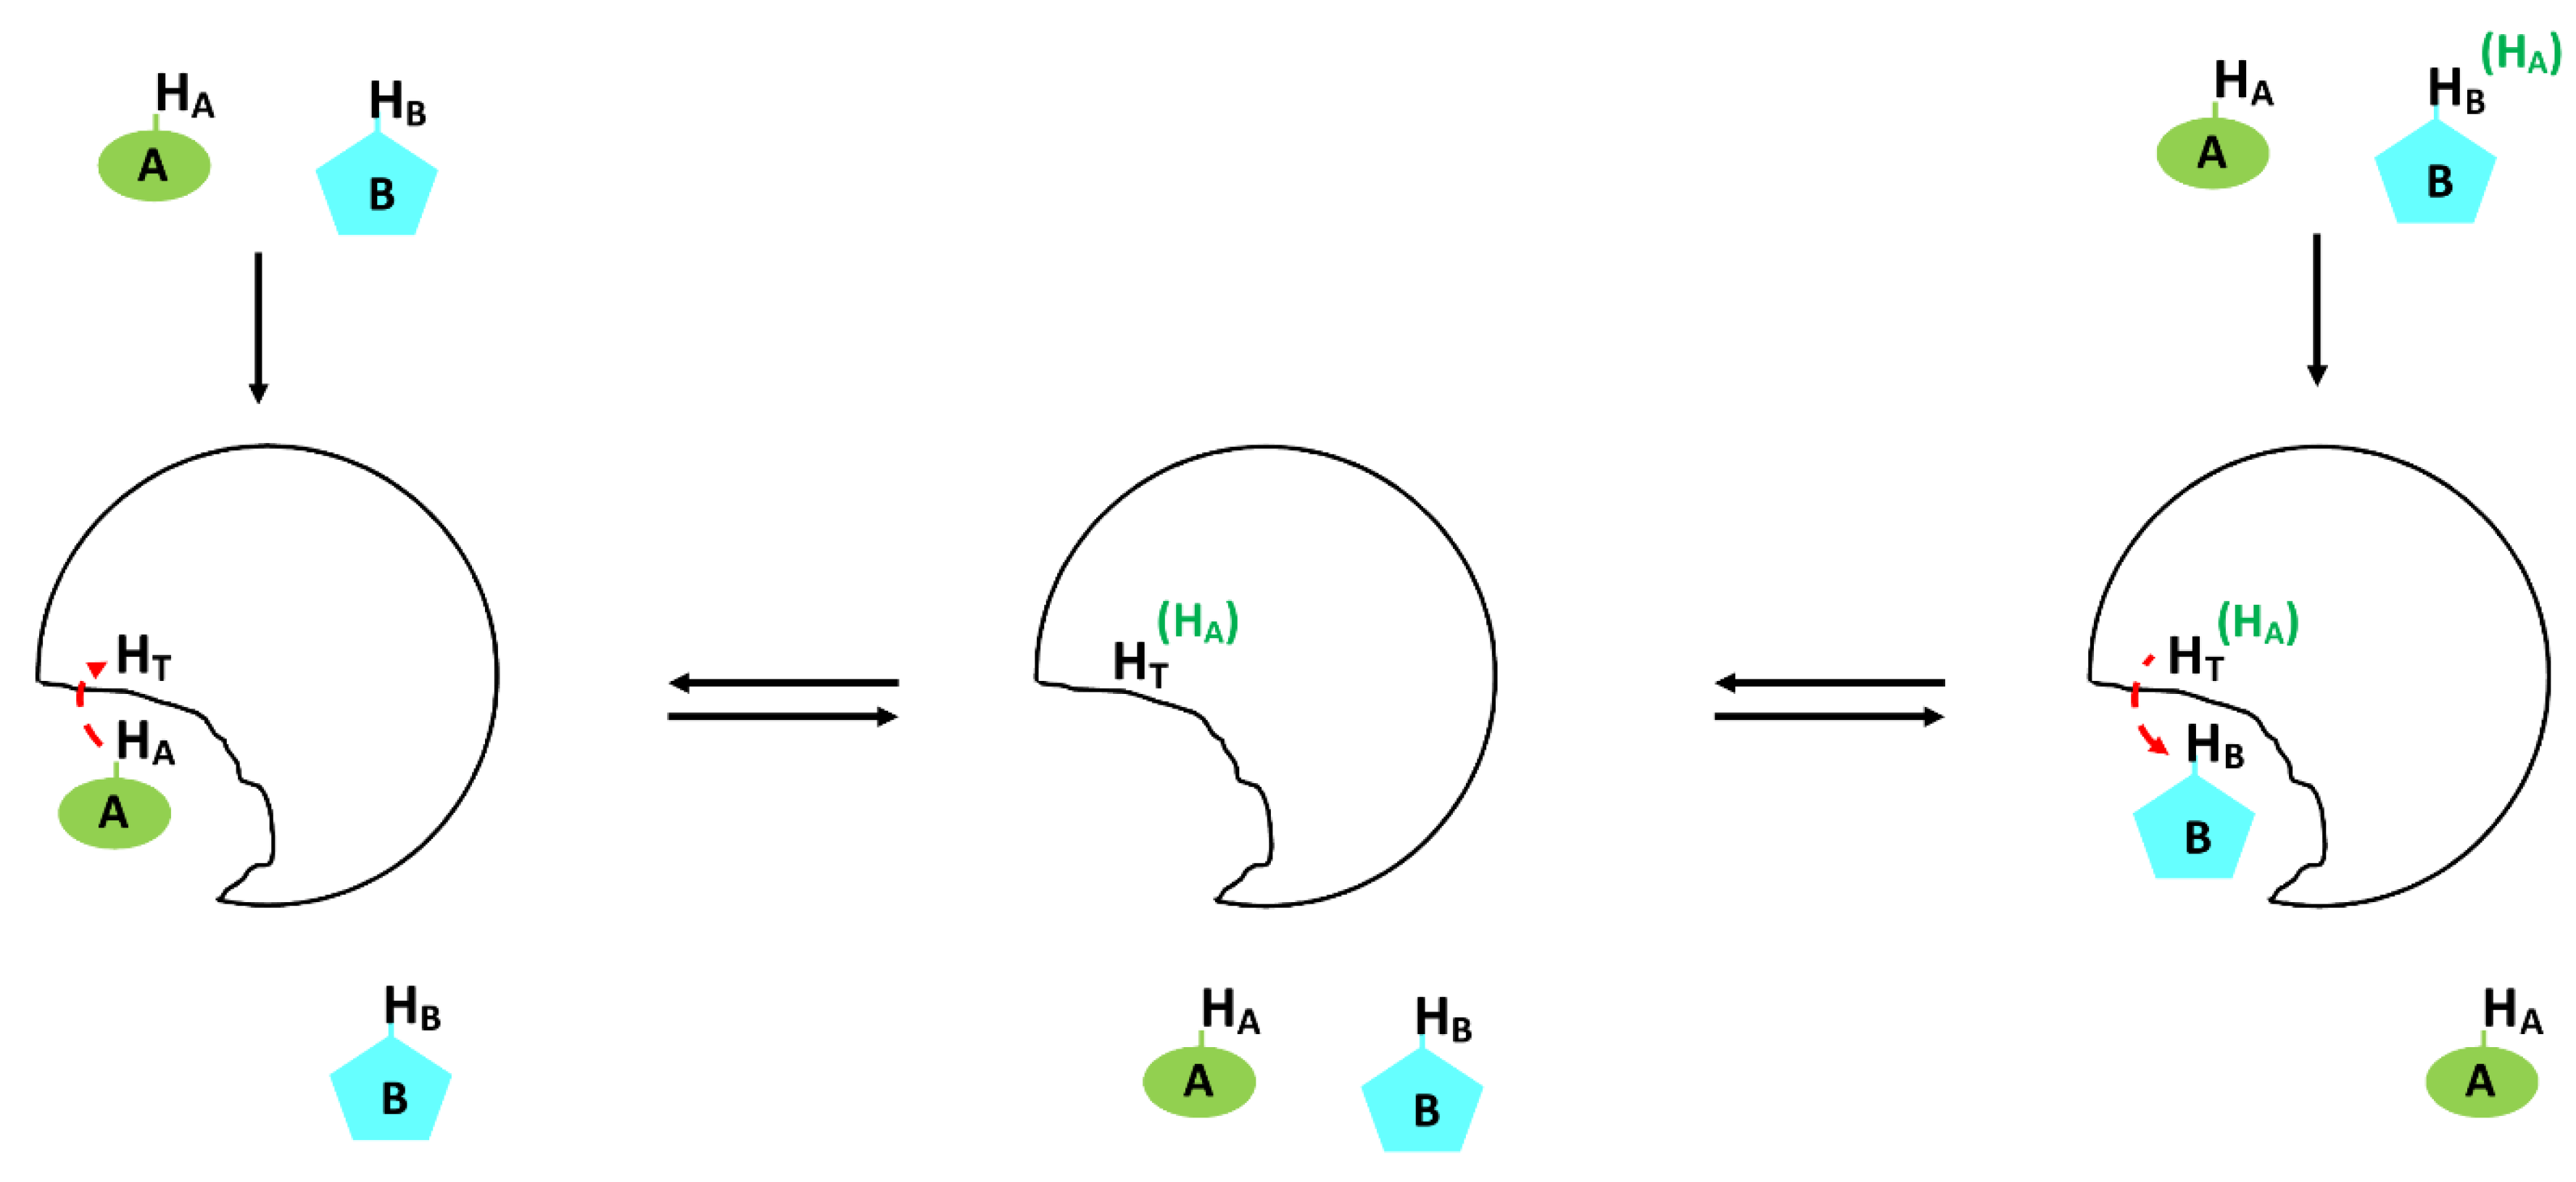
| Tested Substance | Evaluated Effect | NMR Experiments Used in the Study | Ref. |
|---|---|---|---|
| Isoniazid (INH) | INH induces oxidative stress, disturbs energy metabolism, and causes disorders in neurotransmission and neuromodulation processes in Sprague Dawley rats. | 1H-NMR CPMG 1H,1H-TOCSY 1H,13C-HSQC | [178] |
| Naproxen | Naproxen induces a disturbance in energy and choline metabolism, and promotes catabolism of tryptophan in Sprague Dawley rats. | 1H-NOESYPRESAT-1D | [179] |
| Cisplatin (CP) | Identification of six serum (alanine, betaine, glucose, glutamine, lactate, and leucine) and eight urinary (alanine, acetate, citrate, glucose, glycine, guanidinoacetate, hippurate, and lactate) metabolites that can be used as biomarkers for cisplatin nephrotoxicity. | 1H-NMR | [180] |
| Shell of Herpetospermum caudigerum Wall (SHCW) | A high dosage of SHCW causes the disturbance of energy and amino acid metabolism and induces oxidative stress in Sprague-Dawley rats. | 1H-NMR CPMG 1H,13C-HSQC 1H,13C-TOCSY | [86] |
| Ampicillin, Maculatin 1.1 | Both antibiotics cause destabilization of membrane integrity and increase breakdown of nucleic acids in E. coli. | 1H-31P CP | [94] |
| Emodin | Emodin can affect the immune response and interrupt energy metabolism (citric acid cycle) along with glutathione synthesis, which can lead to oxidative stress. | 1H-NMR CPMG 1H,1H-COSY 1H,13C-HMBC 1H,13C-HSQC | [65] |
| “RenqingMangjue” pill (RMP) | RMP can disturb the citric acid cycle in cells, and decreases levels of glutamate, glutamine and BCAAs in the plasma of Wistar rats. | 1H-NMR CPMG 1H,1H-COSY 1H,13C-HSQC 1H-13C HMBC | [66] |
| Ptac2S | Ptac2S limits cancer cell (Skov-3) proliferation by reducing the efficiency of the citric acid cycle and induces changes in cell membranes in a shorter period of time (6h) compared to cisplatin (24h). Additionally, Ptac2S may inhibit lactate dehydrogenase. | 1H-NMR CPMG 1H,1H-COSY 1H,13C-HSQC 1H,13C-HMBC | [145] |
| Gemcitabine-carboplatin (GC) | Identification of two biomarkers (formate and acetate) that can predict a positive response in MBC (metastatic breast cancer) patients treated with GC chemotherapy. | 1H-NMR CPMG 1H JRES 1H,1H-COSY 1H,1H-TOCSY 1H,13C-HSQC 1H,13C-HMBC | [137] |
| Doxorubicin (DOX)/dexrazoxane (DEX) | DOX decreases ATP production and induces oxidative stress in H9C2 cells. DEX counteracts those changes, having a cardioprotective effect on H9C2 cell lines. | 1H-NOESYPRESAT-1D | [67] |
| Curcumin | Curcumin shows antihyperlipidemic effects on C57BL/6Slac mice by partially restoring metabolic defects induced by a high-fat diet. Affected metabolic pathways include the citric acid cycle, glycolysis and gluconeogenesis, ketogenesis of BCAA, synthesis of ketone bodies and cholesterol, and choline and fatty acid metabolism. | 1H-NOESYPRESAT-1D 1H-1H TOCSY 1H,13C-HSQC | [136] |
| Formosanin C (FC) | Formosanin C shows the ability to inhibit synthesis and methylation of DNA as well as reducing the activity of the citric acid cycle and energy metabolism in the mitochondria of HepG2 cells. | 1H-NMR | [181] |
| Melamine | Melamine disrupts metabolism of glucose, nitrogen, and protein in the liver of Wistar rat. | 1H-NMR CPMG | [182] |
| Aristolochic acid (AA) | Aristolochic acid causes renal lesions and a disorder in tubular reabsorption in Wistar rats. | 1H-NMR | [68] |
| Rituximab | Evaluating response outcome for patients with rheumatoid arthritis, treated with rituximab. Identification of metabolites changes between responders and non-responders such as succinate, taurine, lactate, pyruvate and aspartate. | 1H-NMR | [183] |
| Levetiracetam, Lamotrigine, Topiramate | No distinction between metabolite profiles of serum from patients treated with levetiracetam, lamotrigine and topiramate. Could not evaluate response of initial treatment of epilepsy. | 1H-NOESYPRESAT-1D | [184] |
| Hexacationic Ruthenium Metallaprism | Metallaprism mainly affects lipid metabolism in A2780 (human ovarian cancer) and HEK-293 (human embryonic kidney) cells, and increases GSH levels in all cell lines. In A2780cisR (cisplatin resistant A2780) cells, lipid biogenesis and glycosylation are affected by treatment with metallaprism. | HR-MAS: a)1D -1H NOESY -1H CPMG b)2D -1H,1H-TOCSY -1H J-resolved | [138] |
| Centella asiatica extract | Extract from Centella asiatica promotes glycolysis, boosts the citric acid cycle and decreases gluconeogenesis and lipid metabolism in T2DM Sprague–Dawley rats. | 1H-NMR CPMG | [185] |
| VR24, VR27 (1,3,4-thiadiazoles) | VR24 and VR27 improve glycerol metabolism, decrease betaine levels, and normalize the altered level of myoinositol in serum of DMH-induced CRC (colorectal cancer) Wistar rats. | 1H-NMR CPMG | [186] |
| Xiaoyaosan | Xiaoyaosan regulates energy metabolism, can play an important role in the regulation of the nervous system, and might restore the balance in gut microbiota of depressed patients. | 1H-NMR CPMG 1H,1H-COSY 1H,13C-HMQC | [187] |
| Sini decoction (SND) | SND may restore balance in myocardial energy metabolism, and regulate the citric acid cycle and amino acid metabolism. Identification of 10 biomarkers showing potential efficiency of SND administration in Sprague-Dawley rats. | 1H-NMR | [188] |
| Fu Fang Jin Jing Oral Liquid (FJJOL) with Herba Rhodiol | FJJOL regulates energy metabolism of brain tissue, can affect the function of neurons abundant in GABA and glycine receptors, and may help to maintain the membrane integrity of the cells in Kunming-strain mice exposed to hypobaric hypoxia. | 1H-NOESYPRESAT-1D 1H,1H-gCOSY 1H,1H-TOCSY | [87] |
| Acyclovir, Pyrazinamide, Isoniazid, Sulfamethoxazole | Evaluating the efficacy (determined by the concentration of a drug able to reach the therapeutic site) of four drugs in cerebrospinal fluid of tuberculous meningitis patients. | 1H-NOESYPRESAT-1D 1H,1H-COSY | [189] |
| Genipin | Genipin can recover energy metabolism to normal levels, and regulate methylamine and amino acid metabolisms of diabetic Sprague Dawley rats. | 1H-NOESY-1D | [190] |
| Adriamycin (ADR) | Identification of seven biomarkers: trimethylamine oxide (TMAO), taurine, trimethylamine (TMA), hippurate, trigonelline, citrate and 2-oxoglutarate that can predict tumor’s (gastric adenocarcinoma) response to ADR treatment in BALB/c-nu/nu mice. | 1H-NOESYPRESAT-1D | [191] |
| Danggui/European Danggui | Comparison between Danggui and European Danggui showed that Danggui has a different chemical composition and provides a better enriching effect on blood than European Danggui. Identification of 18 metabolites affected by Danggui treatment. | 1H-NMR CPMG 1H-NOESYPRESAT-1D 1H,1H-COSY 1H,13C-HSQC | [88] |
| Erythromycin | Erythromycin decreases citric acid cycle activity, enhances fatty acid oxidation, causes dysfunction in amino acid metabolism, and creates oxidative stress in livers of Wistar rats. | 1H-NMR CPMG 1H-NMR BPPLED | [192] |
| Fuzi/Gancao | Fuzi causes a shift in energy metabolism (from aerobic respiration to anaerobic), induces membrane toxicity, and disrupts the balance of gut microbiota of Wistar rats. Administrating Fuzi with Gancao diminishes the toxic effects of Fuzi. | 1H-NOESY-1D | [193] |
| Kijitsu, Tohi, Chimpi, Kippi, Seihi | 1H-NMR spectra enabled the identification of three compounds (naringin, sucrose, and β-glucose), and 13C-NMR enabled the identification of eight compounds (naringin, neohesperidin, ɑ- and β-glucose, sucrose, limonene, narirutin, and synephrine). | 1H-NMR 13C-NMR | [112] |
| Drug (Company) | Target | Original Fragment(s) * | Advanced Molecule and Progress in Clinical Trials | Techniques Used |
|---|---|---|---|---|
| Vemurafenib (Plexxikon) [224,226] | BRAF-V600E | 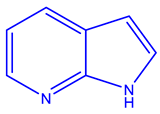 | 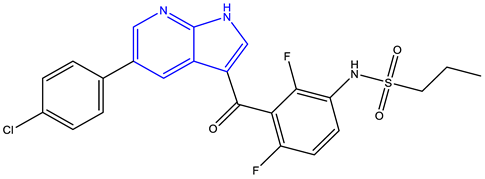 Approved | high-concentration biochemical fragment screening, X-ray crystallography |
| Venetoclax (AbbVie, Genetech) [227,228,229,230] | BCL-2 | 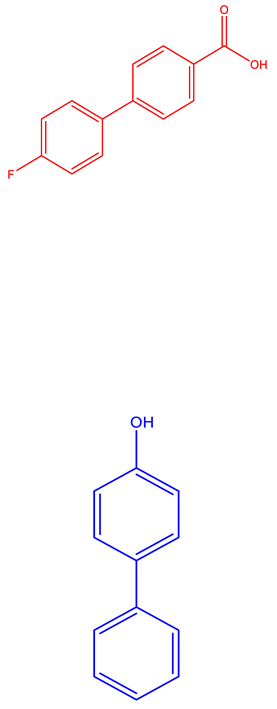 | 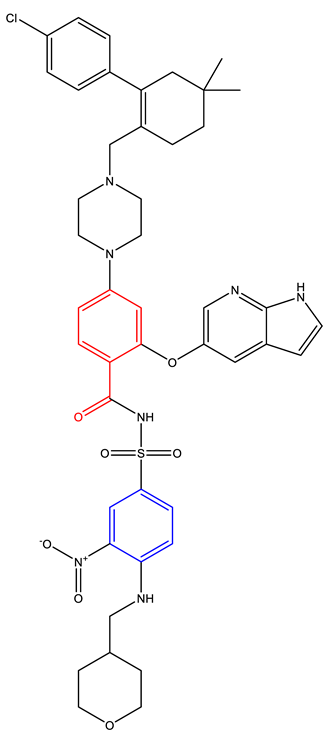 Approved | NMR, X-ray crystallography |
| Ribociclib (Novartis Europharm Limited) [231] | CDK4 and 6 | Information Not Available | 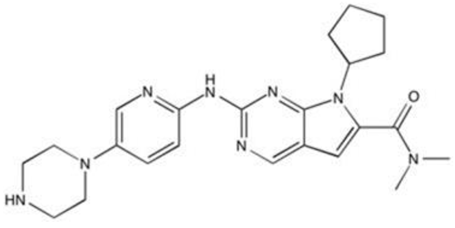 Approved | Information not Available |
| PLX3397 (Plexxikon) [232,233,234] | FMS, KIT, and FLT3-ITD |  | 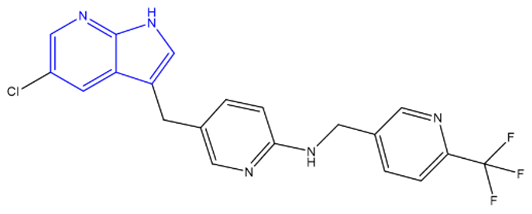 Phase 3 | X-ray crystallography, Structure Confirmed by NMR, MS, and HPLC |
| Verubecestat (Merck) [235,236] | BACE1 | 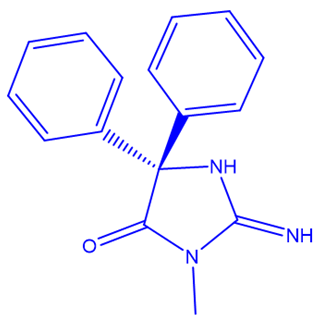 | 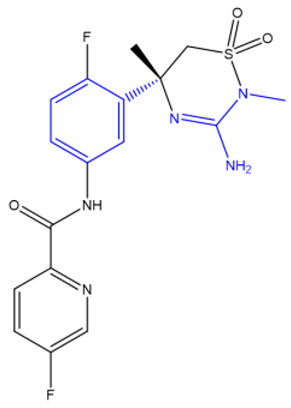 Phase 3 | NMR, X-ray crystallography, inhibition of cathepsin D |
| Onalespib (Astex) [237,238] | HSP90 | 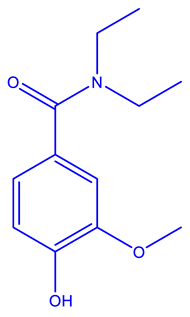 | 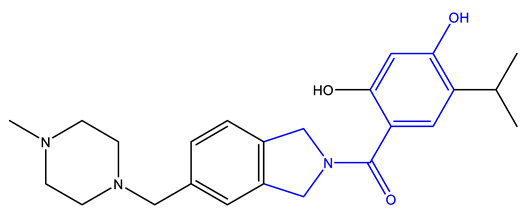 Phase 2 | X-ray crystallography, isothermal titration calorimetry, NMR |
| AZD5099 [239,240] | Topoisomerase II | 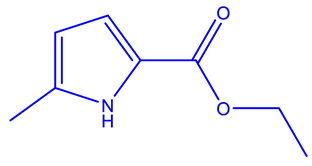 | 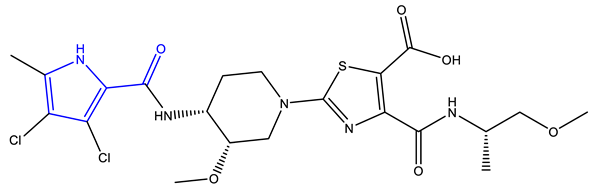 Phase 1 | NMR, Surface Plasmon Resonance, isothermal calorimetry, X-ray cystallography |
| AT7519 [241,242,243,244] | CDK 1, 2, 4, and 5 |  | 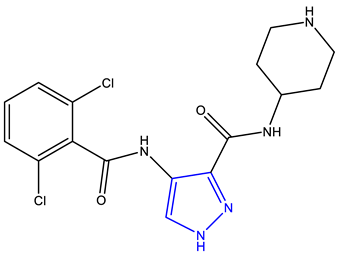 Phase 2 | NMR, MS, X-ray crystallography |
| NMR Technique | Advantages | Disadvantages |
|---|---|---|
| 1D-NMR | Ability to identify simple chemical compounds. High quality resolution and sensitivity for many 1D experiments. Less time consuming compared to 2D NMR. | Compared to 2D NMR less details can be obtained for more complex molecules. For nuclei other than 1H and 19F, relative sensitivity is fairly low—requires extra labeling to obtain better spectra. |
| 2D NMR | Ability to identify complex molecules and observe different interactions between the nuclei, e.g., correlations between all spins in one spin system using TOCSY experiment. | Requires long times to obtain a proper spectra (up to days). |
| Ultrafast 2D NMR | Greatly reduces time to obtain 2D spectra. | Reduced sensitivity. |
| SOFAST | Significantly reduces acquisition time of HMQC. | Relatively low resolution |
| NUS | Lowers the time of measurement while keeping the same level of resolution. | Requires use of reconstruction algorithms since missing data points can lead to artifacts in spectra. |
| MDD | Multidimensional data are “broken” to one dimensional, which are easier to analyze. Ability to resolve overlapping resonances. | Data must be (approximately) symmetrical (Lorentzian shape) to obtain good spectra. |
| CS | Good reconstruction of weaker peaks. | Large computational costs, low performance on noisy data. |
| MAX ENT | Significant reduction in acquisition time. | Nominally Lorentzian peak shapes may be distorted, and peak intensities may be altered. |
| IST | Greatly reduced time to obtain NMR spectra. | Requires a grid of uniformly sampled data points. |
| FBDD | Often makes stronger binding ligands from weakly binding fragments. Less time and resource intensive. | Can be used only for small fragments of compound of interest. |
| SAR | Direct observation of target binding to ligand. Several types of NMR experiments are possible. | Inability to distinguish binding modes, difficult to gage the “true” binding site of ligand to protein. |
| STD | Only requires a small amount of sample. Highly reproducible. Allows direct observations of ligand binding. | Only works for ligands with low binding affinity (fast chemical exchange). Inability to distinguish binding modes. |
| In cell NMR | In vivo studies are possible, can focus on specific cell parts. | Special labeling techniques may be required. Spectra may be more challenging to interpret. |
| In silico + NMR | Can model protein drug interactions, helps speed up and reduce cost of drug delivery | Protein models need to be validated through experimental approach. |
| PNMR | Can observe proteins interacting with metal ions, long observation distance (10-25 angstroms) between paramagnetic left and nearby atoms. | Paramagnetic left required in the system. |
| ALARM NMR | Elimination of false positives from HTS methods | It requires synthesis of human La antigen protein. |
| ssNMR | Enables the characterization of a chemical compound in a solid-state form such as a tablet/pill. Provides insight into the physical properties of a compound. | Significant broadening of the spectral lineshapes due to anisotropic spin interactions. |
| Relaxation editing | Noticeable difference in spectra of binding and non-binding ligands. | Sets the lower limit of time for which experiments can be performed. |
© 2020 by the authors. Licensee MDPI, Basel, Switzerland. This article is an open access article distributed under the terms and conditions of the Creative Commons Attribution (CC BY) license (http://creativecommons.org/licenses/by/4.0/).
Share and Cite
Emwas, A.-H.; Szczepski, K.; Poulson, B.G.; Chandra, K.; McKay, R.T.; Dhahri, M.; Alahmari, F.; Jaremko, L.; Lachowicz, J.I.; Jaremko, M. NMR as a “Gold Standard” Method in Drug Design and Discovery. Molecules 2020, 25, 4597. https://doi.org/10.3390/molecules25204597
Emwas A-H, Szczepski K, Poulson BG, Chandra K, McKay RT, Dhahri M, Alahmari F, Jaremko L, Lachowicz JI, Jaremko M. NMR as a “Gold Standard” Method in Drug Design and Discovery. Molecules. 2020; 25(20):4597. https://doi.org/10.3390/molecules25204597
Chicago/Turabian StyleEmwas, Abdul-Hamid, Kacper Szczepski, Benjamin Gabriel Poulson, Kousik Chandra, Ryan T. McKay, Manel Dhahri, Fatimah Alahmari, Lukasz Jaremko, Joanna Izabela Lachowicz, and Mariusz Jaremko. 2020. "NMR as a “Gold Standard” Method in Drug Design and Discovery" Molecules 25, no. 20: 4597. https://doi.org/10.3390/molecules25204597