
Drug Administration Routes Impact the Metabolism of a Synthetic Cannabinoid in the Zebrafish Larvae Model


Abstract
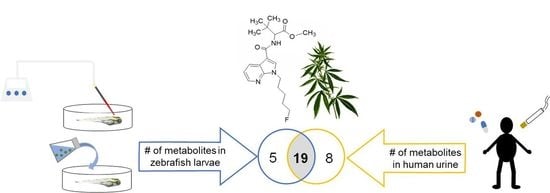
1. Introduction
2. Results and Discussion
2.1. Zebrafish Larvae Metabolite Spectra of 7′N-5F-ADB Differ Depending on the Route of Administration
2.2. The Spatial Distribution of 7′N-5F-ADB in ZF Larva Is Visualized by MALDI-MSI
2.3. Comparison of Metabolite Identification in the In Vitro HepaRG Model and from ZF Larvae
3. Materials and Methods
3.1. Chemicals and Other Materials
3.2. Zebrafish Maintenance and Embryo Collection
3.3. Drug Treatment of ZF Larvae via Aquatic Exposure
3.4. Drug Treatment of ZF Larvae via Microinjection into Different Compartments
3.5. ZF Sample Preparation and Metabolite Analysis by LC-HRMS/MS
3.6. In Vitro Metabolism Analyses Using HepaRG Cells
3.7. MSI Analysis of ZF Larva by MALDI-FT-ICR
4. Summary and Conclusions
Supplementary Materials
Author Contributions
Funding
Acknowledgments
Conflicts of Interest
References
- Zhang, Q.; Ji, C.; Yan, L.; Lu, M.; Lu, C.; Zhao, M. The identification of the metabolites of chlorothalonil in zebrafish (Danio rerio) and their embryo toxicity and endocrine effects at environmentally relevant levels. Environ. Pollut. 2016, 218, 8–15. [Google Scholar] [CrossRef]
- Kithcart, A.; MacRae, C.A. Using Zebrafish for High-Throughput Screening of Novel Cardiovascular Drugs. JACC Basic Transl. Sci. 2017, 2, 1–12. [Google Scholar] [CrossRef]
- Brugman, S. The zebrafish as a model to study intestinal inflammation. Dev. Comp. Immunol. 2016, 64, 82–92. [Google Scholar] [CrossRef] [PubMed]
- Shams, S.; Rihel, J.; Ortiz, J.G.; Gerlai, R. The zebrafish as a promising tool for modeling human brain disorders: A review based upon an IBNS Symposium. Neurosci. Biobehav. Rev. 2018, 85, 176–190. [Google Scholar] [CrossRef] [PubMed]
- Kamel, M.; Ninov, N. Catching new targets in metabolic disease with a zebrafish. Curr. Opin. Pharmacol. 2017, 37, 41–50. [Google Scholar] [CrossRef] [PubMed]
- Howe, K.; Clark, M.D.; Torroja, C.F.; Torrance, J.; Berthelot, C.; Muffato, M.; Collins, J.E.; Humphray, S.; McLaren, K.; Matthews, L.; et al. The zebrafish reference genome sequence and its relationship to the human genome. Nature 2013, 496, 498–503. [Google Scholar] [CrossRef] [PubMed]
- Goldstone, J.V.; McArthur, A.G.; Kubota, A.; Zanette, J.; Parente, T.; Jönsson, M.E.; Nelson, D.R.; Stegeman, J.J. Identification and developmental expression of the full complement of Cytochrome P450 genes in Zebrafish. BMC Genom. 2010, 11, 643. [Google Scholar] [CrossRef]
- van Wijk, R.C.; Krekels, E.H.J.; Hankemeier, T.; Spaink, H.P.; van der Graaf, P.H. Systems pharmacology of hepatic metabolism in zebrafish larvae. Drug Discov. Today Dis. Models 2016, 22, 27–34. [Google Scholar] [CrossRef]
- Wu, J.-Q.; Fan, R.-Y.; Zhang, S.-R.; Li, C.-Y.; Shen, L.-Z.; Wei, P.; He, Z.-H.; He, M.-F. A systematical comparison of anti-angiogenesis and anti-cancer efficacy of ramucirumab, apatinib, regorafenib and cabozantinib in zebrafish model. Life Sci. 2020, 247, 117402. [Google Scholar] [CrossRef]
- Meijer, A.H. Protection and pathology in TB: Learning from the zebrafish model. Semin. Immunopathol. 2016, 38, 261–273. [Google Scholar] [CrossRef]
- Gomes, M.C.; Mostowy, S. The Case for Modeling Human Infection in Zebrafish. Trends Microbiol. 2020, 28, 10–18. [Google Scholar] [CrossRef] [PubMed]
- Willis, A.R.; Moore, C.; Mazon-Moya, M.; Krokowski, S.; Lambert, C.; Till, R.; Mostowy, S.; Sockett, R.E. Injections of Predatory Bacteria Work Alongside Host Immune Cells to Treat Shigella Infection in Zebrafish Larvae. Curr. Biol. 2016, 26, 3343–3351. [Google Scholar] [CrossRef] [PubMed]
- Clatworthy, A.E.; Lee, J.S.-W.; Leibman, M.; Kostun, Z.; Davidson, A.J.; Hung, D.T. Pseudomonas aeruginosa infection of zebrafish involves both host and pathogen determinants. Infect. Immun. 2009, 77, 1293–1303. [Google Scholar] [CrossRef] [PubMed]
- McVicker, G.; Prajsnar, T.K.; Williams, A.; Wagner, N.L.; Boots, M.; Renshaw, S.A.; Foster, S.J. Clonal expansion during Staphylococcus aureus infection dynamics reveals the effect of antibiotic intervention. PLoS Pathog. 2014, 10, e1003959. [Google Scholar] [CrossRef] [PubMed]
- Papan, C.; Chen, L. Metabolic Fingerprinting Reveals Developmental Regulation of Metabolites during Early Zebrafish Embryogenesis. OMICS 2009, 13, 397–405. [Google Scholar] [CrossRef] [PubMed]
- Chng, H.T.; Ho, H.K.; Yap, C.W.; Lam, S.H.; Chan, E.C.Y. An investigation of the bioactivation potential and metabolism profile of Zebrafish versus human. J. Biomol. Screen. 2012, 17, 974–986. [Google Scholar] [CrossRef]
- Jones, H.S.; Trollope, H.T.; Hutchinson, T.H.; Panter, G.H.; Chipman, J.K. Metabolism of ibuprofen in zebrafish larvae. Xenobiotica 2012, 42, 1069–1075. [Google Scholar] [CrossRef]
- Torraca, V.; Mostowy, S. Zebrafish Infection: From Pathogenesis to Cell Biology. Trends Cell Biol. 2018, 28, 143–156. [Google Scholar] [CrossRef]
- Zhao, Y.; Sun, H.; Sha, X.; Gu, L.; Zhan, Z.; Li, W.J. A Review of Automated Microinjection of Zebrafish Embryos. Micromachines 2018, 10, 7. [Google Scholar] [CrossRef]
- Meijer, A.H.; Spaink, H.P. Host-Pathogen Interactions Made Transparent with the Zebrafish Model. Curr. Drug Targets 2011, 12, 1000–1017. [Google Scholar] [CrossRef]
- Schubert, S.; Keddig, N.; Hanel, R.; Kammann, U. Microinjection into zebrafish embryos (Danio rerio)—A useful tool in aquatic toxicity testing? Environ. Sci. Eur. 2014, 26, 1. [Google Scholar] [CrossRef]
- Michiels, E.D.G.; Vergauwen, L.; Lai, F.Y.; Town, R.M.; Covaci, A.; van Nuijs, A.L.N.; van Cruchten, S.J.; Knapen, D. Advancing the Zebrafish embryo test for endocrine disruptor screening using micro-injection: Ethinyl estradiol as a case study. Environ. Toxicol. Chem. 2019, 38, 533–547. [Google Scholar] [CrossRef] [PubMed]
- Kim, S.-M.; Yoo, J.-A.; Baek, J.-M.; Cho, K.-H. Diethyl phthalate exposure is associated with embryonic toxicity, fatty liver changes, and hypolipidemia via impairment of lipoprotein functions. Toxicol. In Vitro 2015, 30, 383–393. [Google Scholar] [CrossRef] [PubMed]
- Richter, L.H.J.; Herrmann, J.; Andreas, A.; Park, Y.M.; Wagmann, L.; Flockerzi, V.; Müller, R.; Meyer, M.R. Tools for studying the metabolism of new psychoactive substances for toxicological screening purposes—A comparative study using pooled human liver S9, HepaRG cells, and zebrafish larvae. Toxicol. Lett. 2019, 305, 73–80. [Google Scholar] [CrossRef] [PubMed]
- De Souza Anselmo, C.; Sardela, V.F.; de Sousa, V.P.; Pereira, H.M.G. Zebrafish (Danio rerio): A valuable tool for predicting the metabolism of xenobiotics in humans? Comp. Biochem. Physiol. C. Toxicol. Pharmacol. 2018, 212, 34–46. [Google Scholar] [CrossRef]
- MacRae, C.A.; Peterson, R.T. Zebrafish as tools for drug discovery. Nat. Rev. Drug Discov. 2015, 14, 721–731. [Google Scholar] [CrossRef]
- Richter, L.H.J.; Maurer, H.H.; Meyer, M.R. Metabolic fate of the new synthetic cannabinoid 7′N-5F-ADB in rat, human, and pooled human S9 studied by means of hyphenated high-resolution mass spectrometry. Drug Test. Anal. 2019, 11, 305–317. [Google Scholar] [CrossRef]
- UNODC. Understanding the synthetic drug market: The NPS factor. Glob. SMART Update 2018, 19, 11. [Google Scholar]
- UNODC. Special Segment Synthetic cannabinoids: Key facts about the largest and most dynamic group of NPS. Glob. SMART Update 2015, 13, 11. [Google Scholar]
- Europäische Kommission; Europol. EU Drug Markets Report. In-Depth Analysis: 2016; Publications Office of the European Union: Luxembourg, 2016; ISBN 9789291688432. [Google Scholar]
- Hasegawa, K.; Wurita, A.; Minakata, K.; Gonmori, K.; Yamagishi, I.; Nozawa, H.; Watanabe, K.; Suzuki, O. Identification and quantitation of 5-fluoro-ADB, one of the most dangerous synthetic cannabinoids, in the stomach contents and solid tissues of a human cadaver and in some herbal products. Forensic Toxicol. 2015, 33, 112–121. [Google Scholar] [CrossRef]
- Buchberger, A.R.; DeLaney, K.; Johnson, J.; Li, L. Mass Spectrometry Imaging: A Review of Emerging Advancements and Future Insights. Anal. Chem. 2018, 90, 240–265. [Google Scholar] [CrossRef] [PubMed]
- Kirla, K.T.; Groh, K.J.; Steuer, A.E.; Poetzsch, M.; Banote, R.K.; Stadnicka-Michalak, J.; Eggen, R.I.L.; Schirmer, K.; Kraemer, T. From the Cover: Zebrafish Larvae Are Insensitive to Stimulation by Cocaine: Importance of Exposure Route and Toxicokinetics. Toxicol. Sci. 2016, 154, 183–193. [Google Scholar] [CrossRef] [PubMed]
- Dilillo, M.; Ait-Belkacem, R.; Esteve, C.; Pellegrini, D.; Nicolardi, S.; Costa, M.; Vannini, E.; Graaf, E.L.D.; Caleo, M.; McDonnell, L.A. Ultra-High Mass Resolution MALDI Imaging Mass Spectrometry of Proteins and Metabolites in a Mouse Model of Glioblastoma. Sci. Rep. 2017, 7, 603. [Google Scholar] [CrossRef] [PubMed]
- Kimmel, C.B.; Ballard, W.W.; Kimmel, S.R.; Ullmann, B.; Schilling, T.F. Stages of embryonic development of the zebrafish. Dev. Dyn. 1995, 203, 253–310. [Google Scholar] [CrossRef]
- Sevior, D.K.; Pelkonen, O.; Ahokas, J.T. Hepatocytes: The powerhouse of biotransformation. Int. J. Biochem. Cell Biol. 2012, 44, 257–261. [Google Scholar] [CrossRef]
- Andersson, T.B.; Kanebratt, K.P.; Kenna, J.G. The HepaRG cell line: A unique in vitro tool for understanding drug metabolism and toxicology in human. Expert Opin. Drug Metab. Toxicol. 2012, 8, 909–920. [Google Scholar] [CrossRef]
- Westerfield, M. The Zebrafish Book. A Guide for the Laboratory Use of Zebrafish (Danio rerio), 4th ed.; Universituy of Oregon Press: Eugene, OH, USA, 2000. [Google Scholar]
- Rosen, J.N.; Sweeney, M.F.; Mably, J.D. Microinjection of zebrafish embryos to analyze gene function. J. Vis. Exp. 2009. [Google Scholar] [CrossRef]
- Sive, H.L.; Grainger, R.M.; Harland, R.M. Calibration of the injection volume for microinjection of Xenopus oocytes and embryos. Cold Spring Harb. Protoc. 2010, 2010, pdb.prot5537. [Google Scholar] [CrossRef]
Sample Availability: The compound 7′N-5F-ADB is available through commercial sources. |


| Compound | Human Screening Data [27] | Zebrafish Larvae, Published Data [24] | Zebrafish Larvae, Data from This Study | HepaRG In Vitro Model | |||||
|---|---|---|---|---|---|---|---|---|---|
| Plasma | Urine | Aquatic Exposure | Microinjection | ||||||
| Yolk Sac | Caudal Vein | Heart Ventricle | Hindbrain | ||||||
| Parent compound | 7′N-5F-ADB | +++ | + | +++ | ++ | ++ | ++ | ++ | +++ |
| Phase I | M1 | + | + | + | + | + | + | ||
| M2 | + | + | + | ||||||
| M3 | + | + | + | + | + | ||||
| M4 | + | + | + | + | + | + | |||
| M5 | ++ | +++ | ++ | + | + | + | ++ | ||
| M6 | + | + | + | + | + | + | |||
| M7 | + | + | + | + | + | ||||
| M8 | + | + nq | + nq | + nq | |||||
| M9 | + nq | + nq | + nq | ||||||
| M10 | + | + | + | + | + | + | |||
| M11 | + | ++ | + | + nq | + | + | |||
| M12 | + | + | + | + nq | + | + | |||
| M13 | + | + | +++ | +++ | +++ | +++ | + | ||
| M14 | + | ||||||||
| M15 | + | + | + | + | + | ||||
| M16 | + | + | + | + | + | + | |||
| M17 | + | + | + | + | + | + | |||
| M18 | + | ||||||||
| M19 | + | ||||||||
| M20 a | |||||||||
| M21 | + | + | + | + | + | ||||
| M22 | + | ||||||||
| M23 | + c | + b | + b | + b | |||||
| M24 | + c | ||||||||
| M25 | + c | ||||||||
| M26 | |||||||||
| Total number of Phase I metabolites | 4 | 17 | 14 | 1 | 17 | 17 | 17 | 15 | |
| Phase II | M27 | + | + | + | + | + | |||
| M28 | + | + | + nq | + | |||||
| M29 | + | + | + | + | + | ||||
| M30 | + | + | + | + | + | + | |||
| M31 | + | + | + | + | + | ||||
| M32 | + | ||||||||
| M33 | + | ||||||||
| M34 | + | + | + | + | |||||
| M35 | + c | +c | + b | + b | + b | + b | |||
| M36 | + c | +c | |||||||
| Total number of Phase II metabolites | - | 10 | 4 | - | 7 | 6 | 7 | 5 | |
| Total number of detected Phase I/II metabolites | 4 | 27 | 18 | 1 | 24 | 23 | 24 | 20 | |
| Human Screening Data [27] | Zebrafish Larvae, Published Data [24] | Zebrafish Larvae, Data from this Study | HepaRG In Vitro Model | |||||
|---|---|---|---|---|---|---|---|---|
| Plasma | Urine | Aquatic Exposure † | Microinjection †† | |||||
| Yolk Sac | Caudal Vein | Heart Ventricle | Hindbrain | |||||
| most abundant peak | P | M5 | P | M13 | M13 | P | M13 | P |
| second most abundant peak | M5 | M11 | M5 | P | P | M5 | P | M5 |
| third most abundant peak | M16 | M30 | M13 | -* | M5 | M13 | M5 | M4 |
| Aquatic Exposure | Microinjection † | ||||
|---|---|---|---|---|---|
| 1-Day Exposure (from 4 dpf to 5 dpf) | 3-Day Exposure (from 2 dpf to 5 dpf) | Caudal Vein | Heart Ventricle | Hindbrain | |
| most abundant peak | P | P | M23/M24/ M25/M26 | M23/M24/ M25/M26 | M23/M24/ M25/M26 |
| second most abundant peak | M13 * | M13 | M16/M17 | M18/M19/M20 | M16/M17 |
| third most abundant peak | M5 * | M5 | M18/M19/M20 | M16/M17 | M18/M19/M20 |
© 2020 by the authors. Licensee MDPI, Basel, Switzerland. This article is an open access article distributed under the terms and conditions of the Creative Commons Attribution (CC BY) license (http://creativecommons.org/licenses/by/4.0/).
Share and Cite
Park, Y.M.; Meyer, M.R.; Müller, R.; Herrmann, J. Drug Administration Routes Impact the Metabolism of a Synthetic Cannabinoid in the Zebrafish Larvae Model. Molecules 2020, 25, 4474. https://doi.org/10.3390/molecules25194474
Park YM, Meyer MR, Müller R, Herrmann J. Drug Administration Routes Impact the Metabolism of a Synthetic Cannabinoid in the Zebrafish Larvae Model. Molecules. 2020; 25(19):4474. https://doi.org/10.3390/molecules25194474
Chicago/Turabian StylePark, Yu Mi, Markus R. Meyer, Rolf Müller, and Jennifer Herrmann. 2020. "Drug Administration Routes Impact the Metabolism of a Synthetic Cannabinoid in the Zebrafish Larvae Model" Molecules 25, no. 19: 4474. https://doi.org/10.3390/molecules25194474
APA StylePark, Y. M., Meyer, M. R., Müller, R., & Herrmann, J. (2020). Drug Administration Routes Impact the Metabolism of a Synthetic Cannabinoid in the Zebrafish Larvae Model. Molecules, 25(19), 4474. https://doi.org/10.3390/molecules25194474