
Photocatalytic Decolorization and Biocidal Applications of Nonmetal Doped TiO2: Isotherm, Kinetic Modeling and In Silico Molecular Docking Studies

 ,
,  ,
, 
 , , , ,
  and
and
Abstract
1. Introduction
2. Results and Discussion
2.1. Photocatalyst Characterization
2.1.1. Thermal Stability and Suitable Temperature Selection
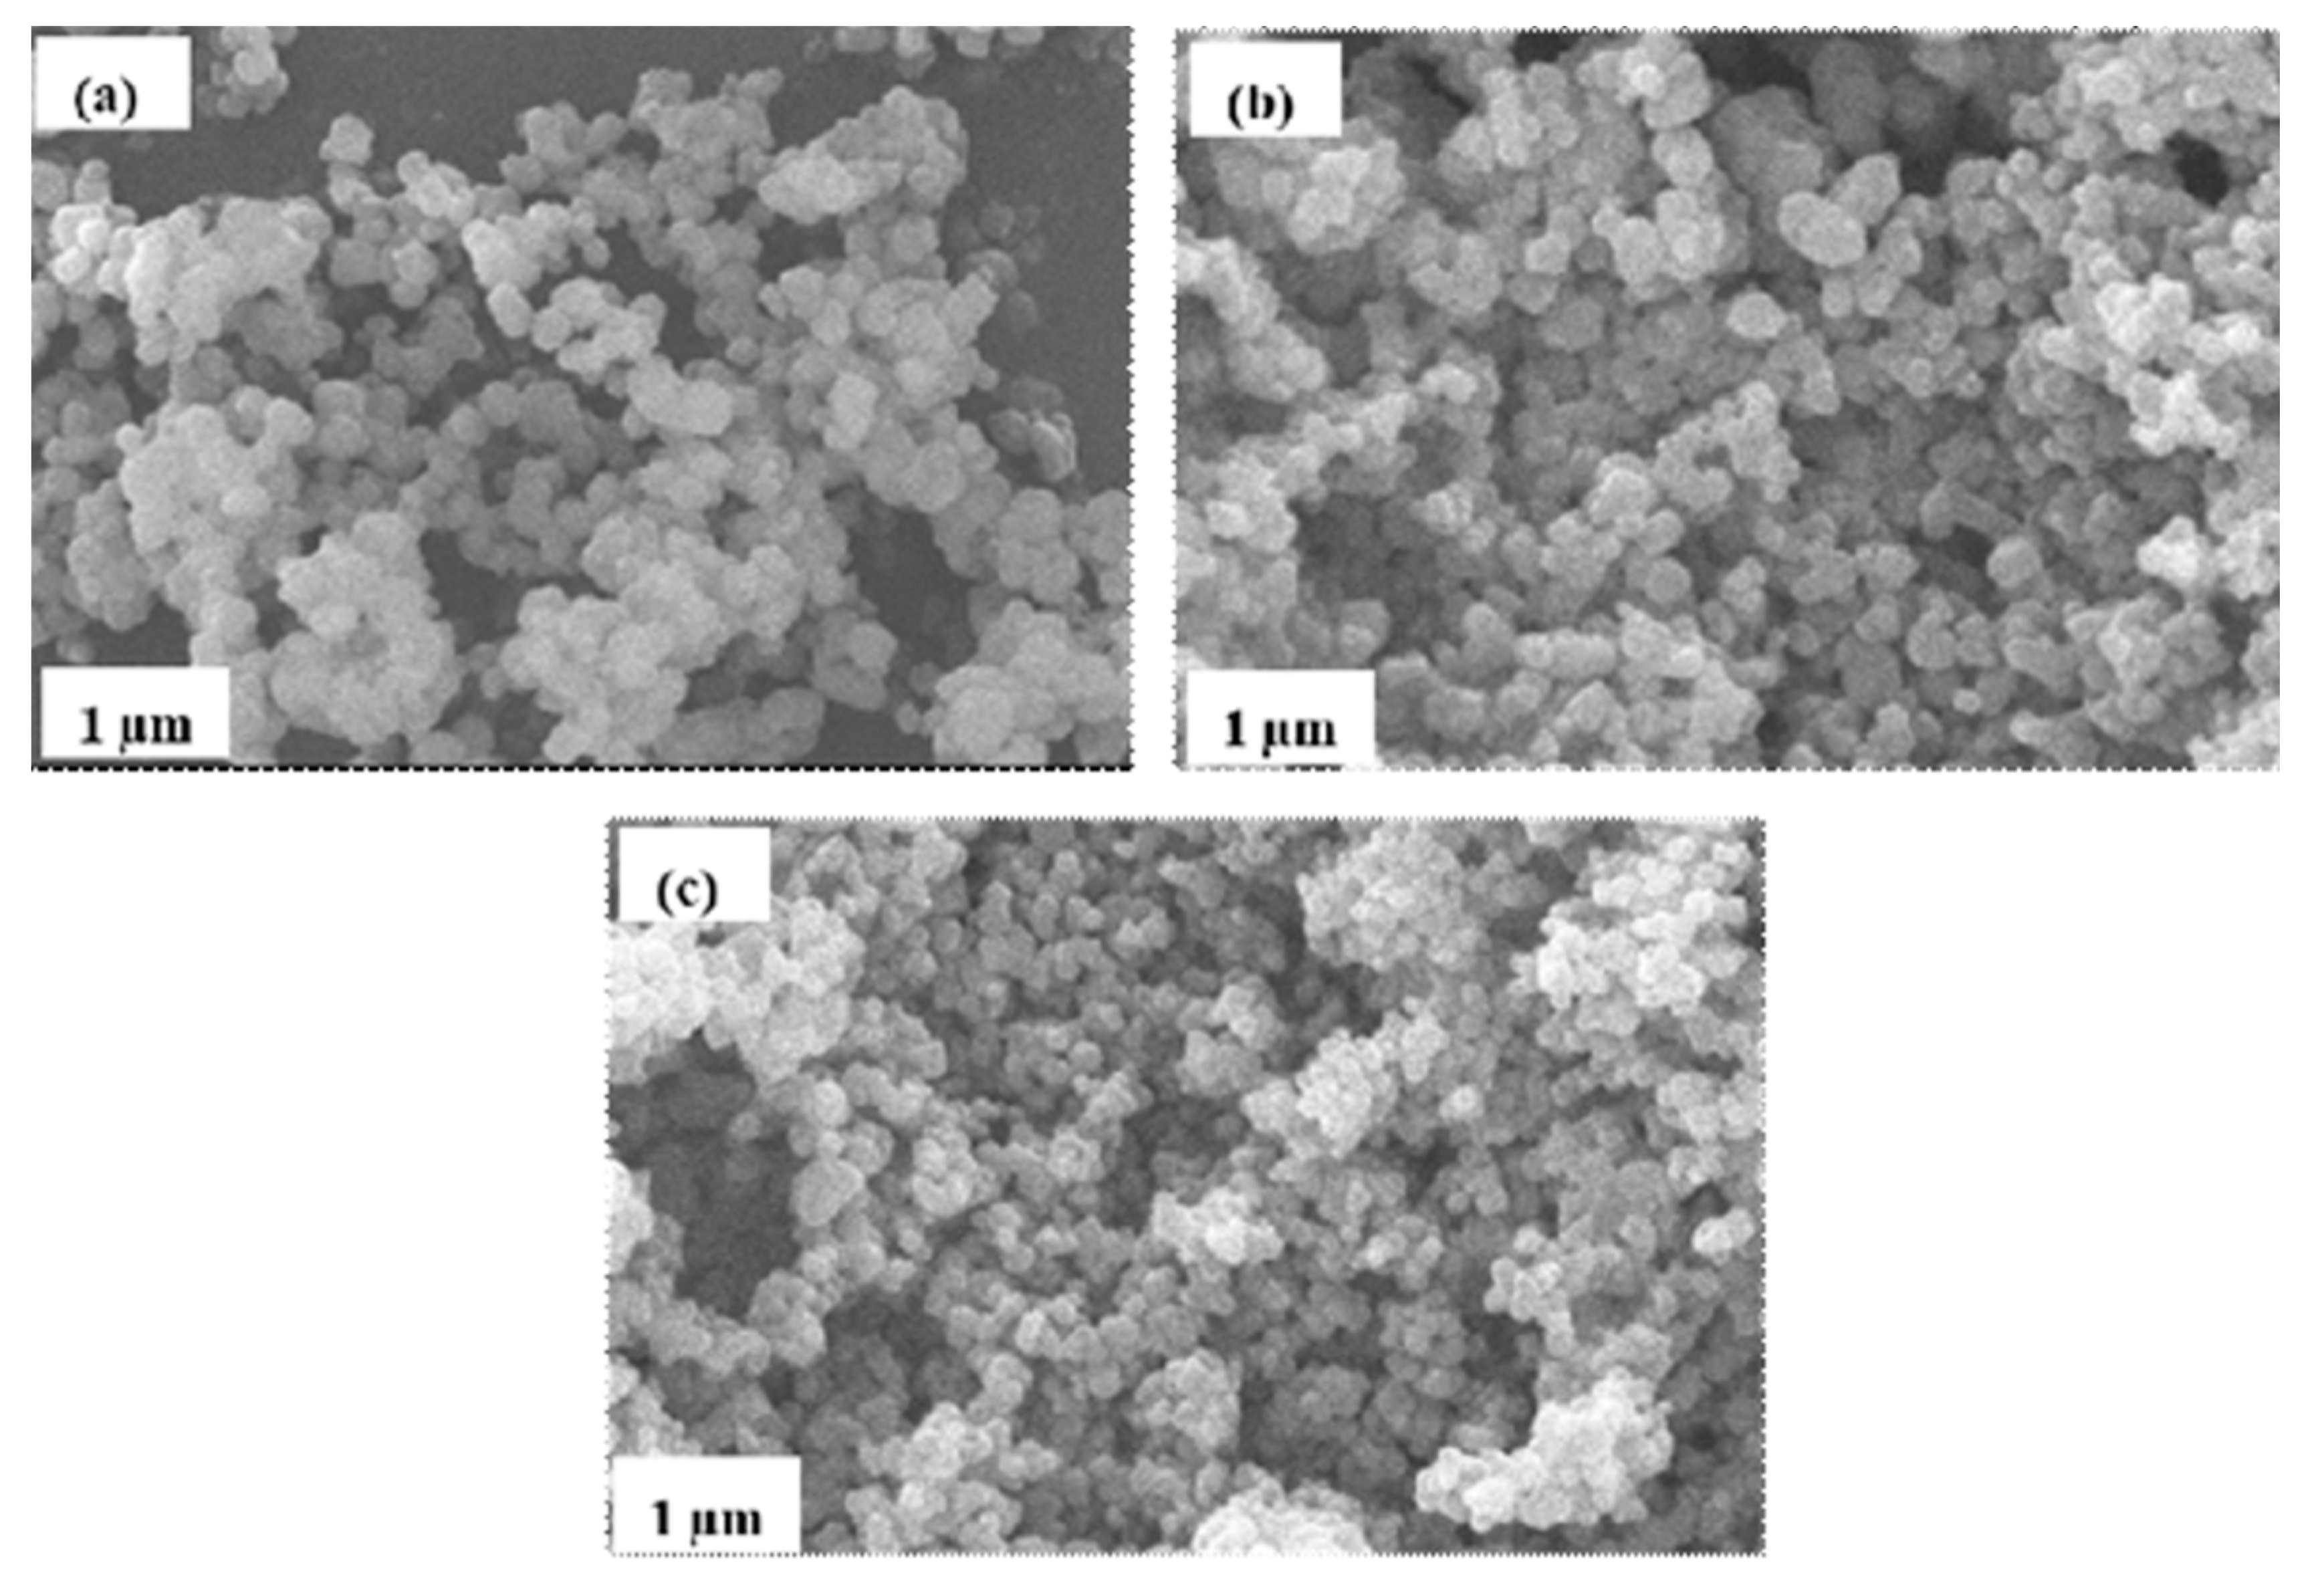
2.1.2. Surface Morphology
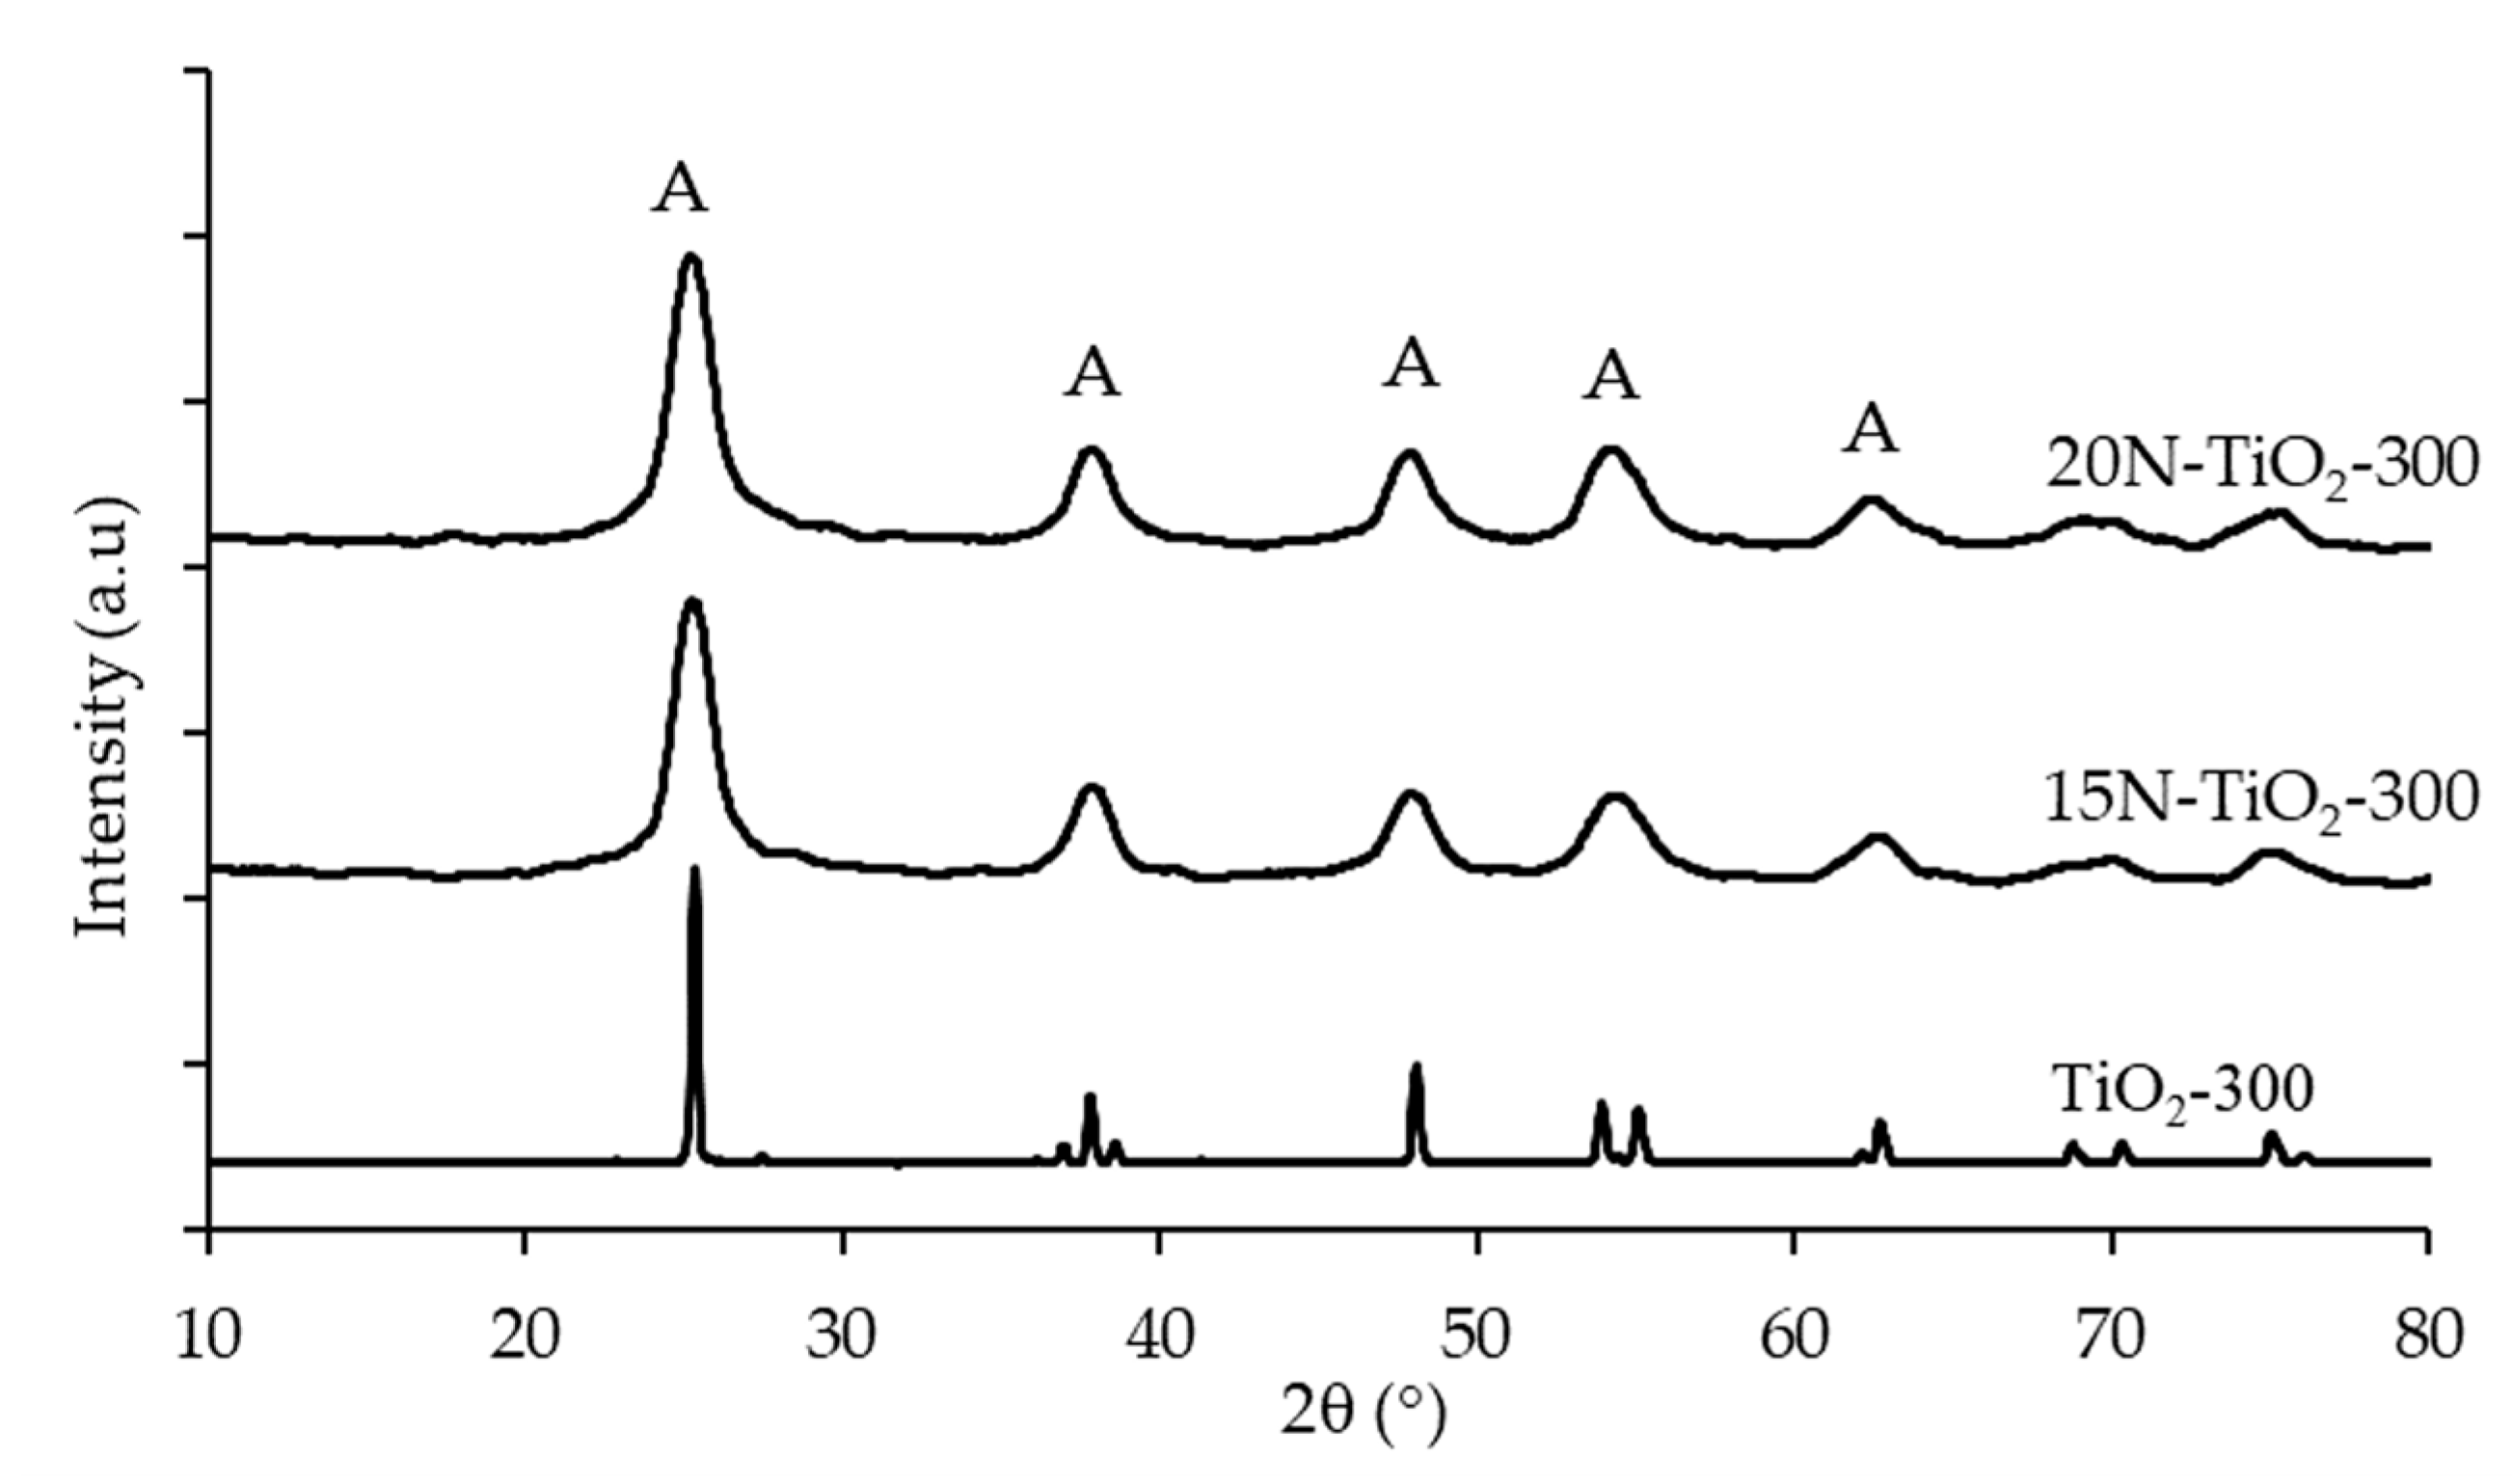
2.1.3. Phase Identification and Crystal Size
2.1.4. Functional Group Analysis
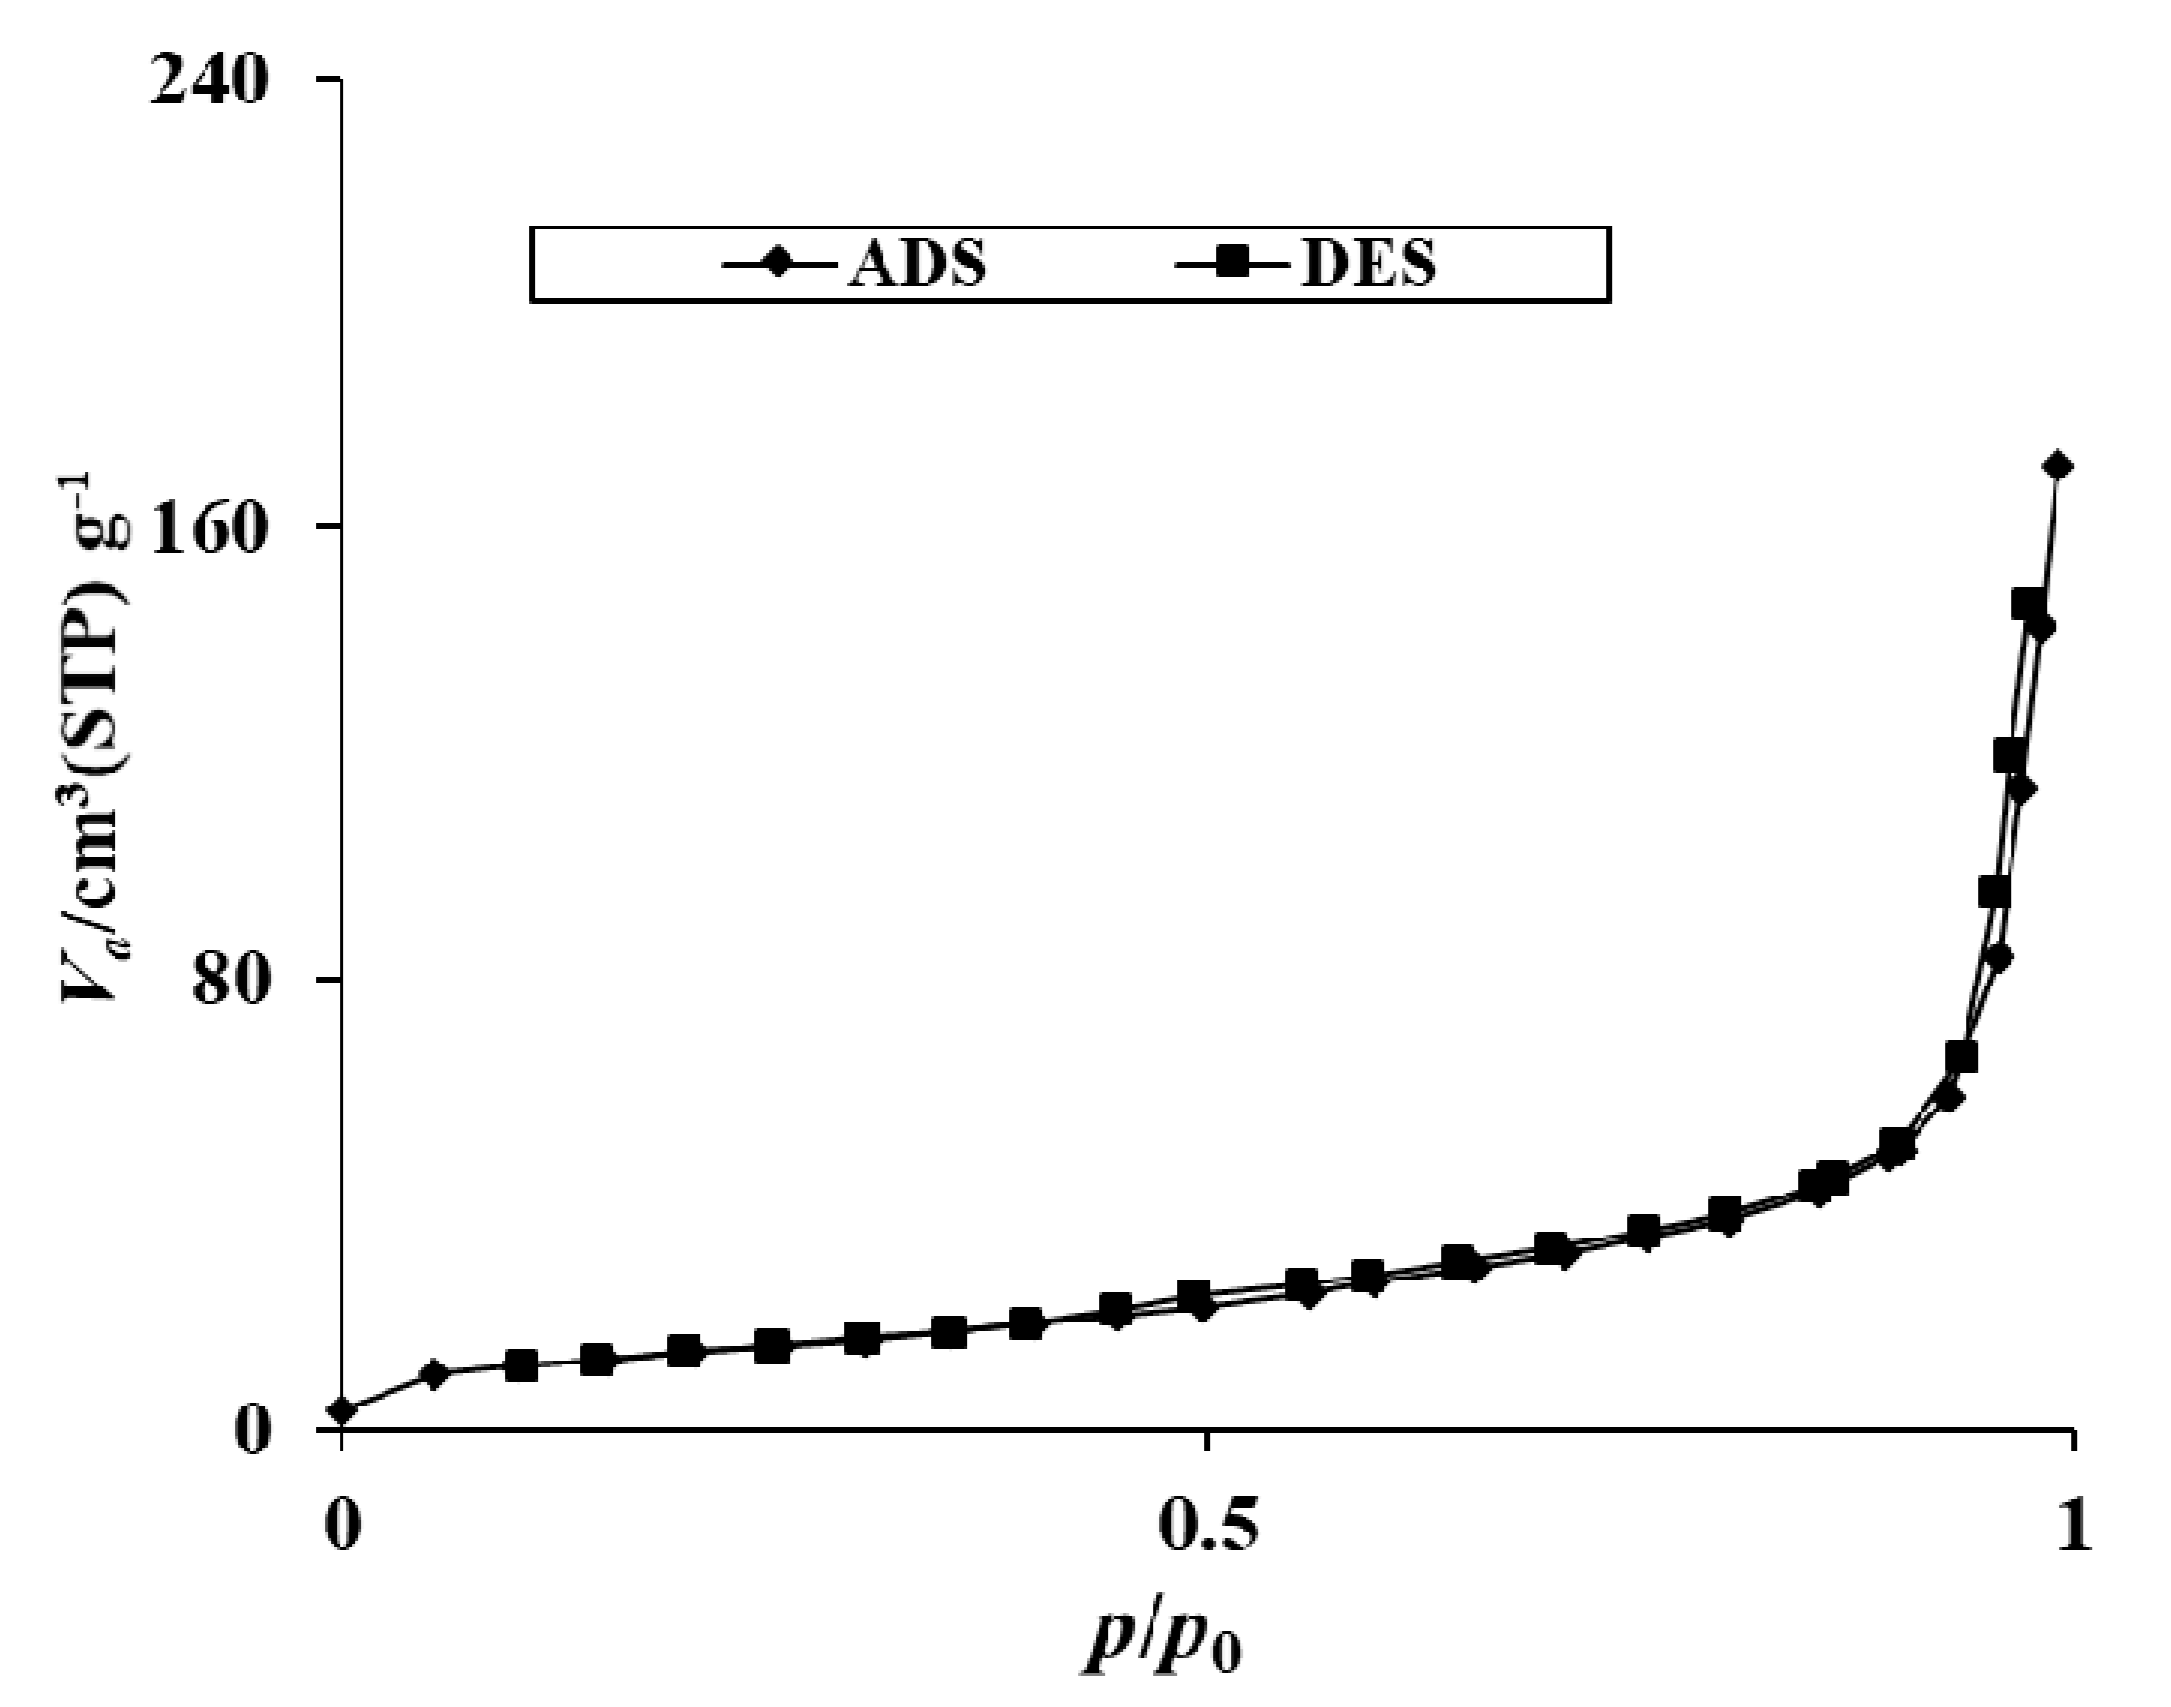
2.1.5. BET Surface Area Analysis
2.1.6. DRS Bandgap Analysis
2.2. Photodecolorization Studies
2.2.1. Screening Studies for Calcination Temperature and Nitrogen Loading
2.2.2. Adsorption of RB5 in Dark Condition
2.3. Effect of Different Reaction Parameters
2.3.1. Effect of Photocatalyst Dose
2.3.2. Effect of pH
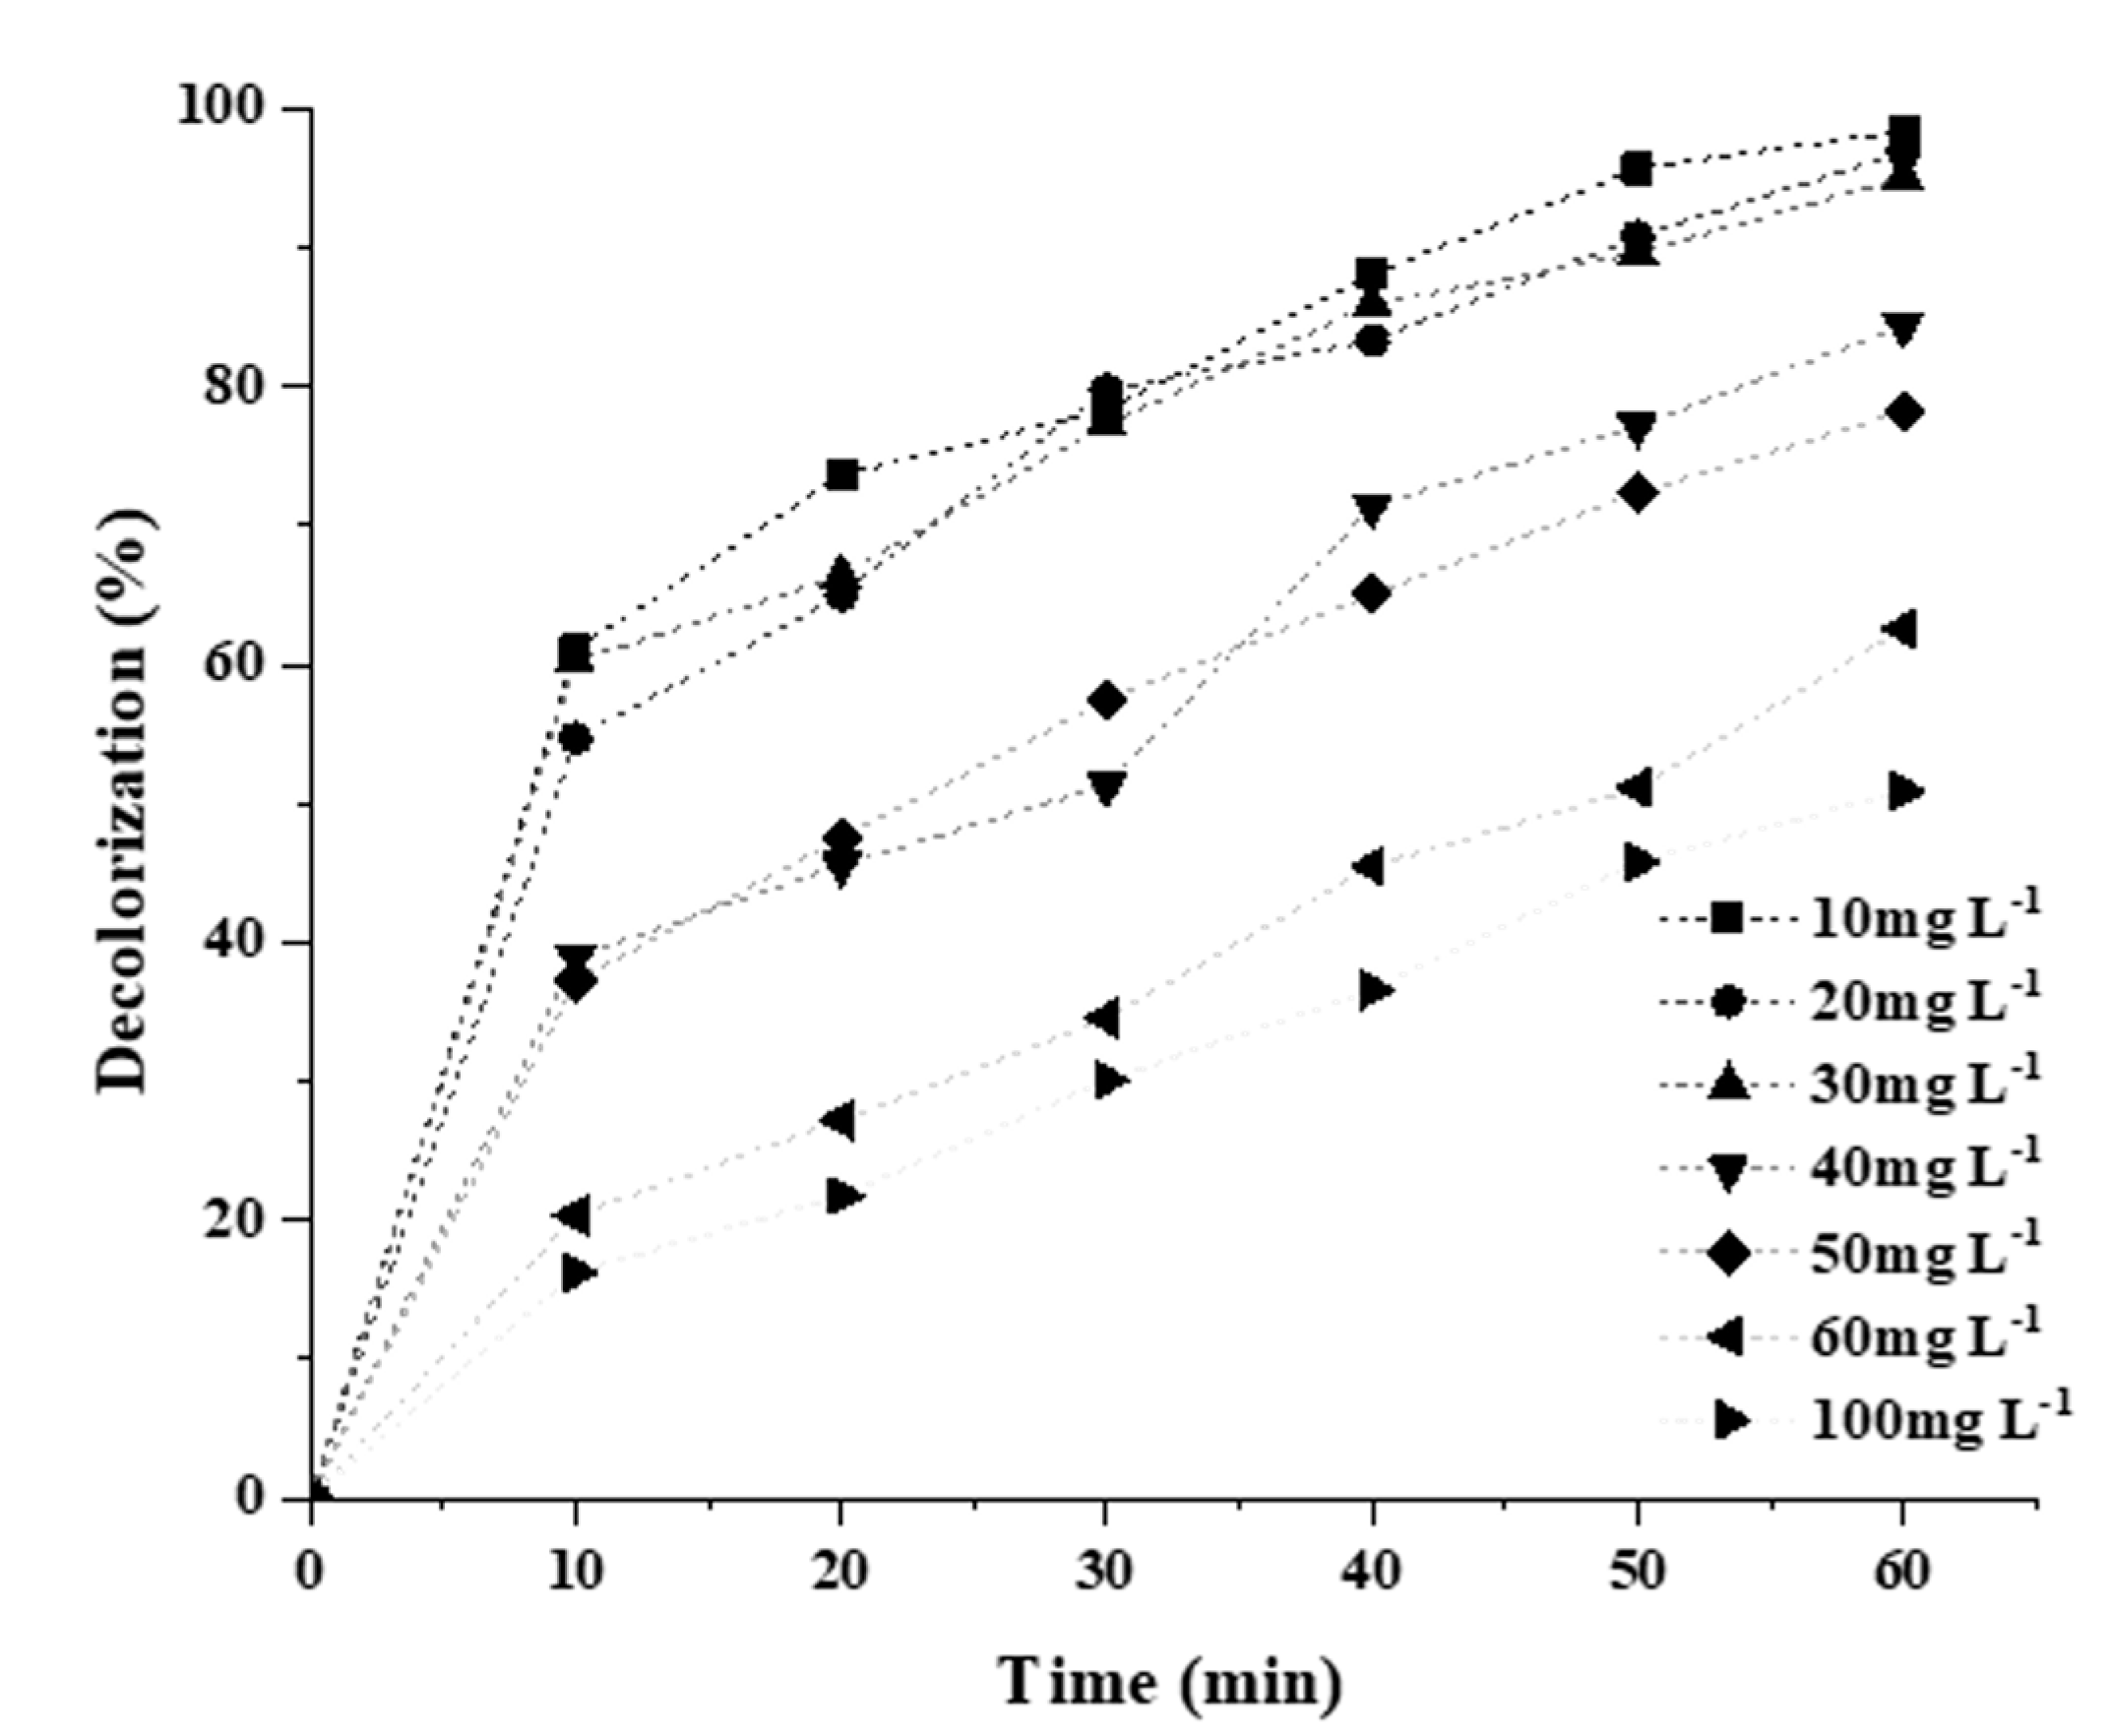
2.3.3. Effect of Initial Dye Concentration
2.4. Photostability of RB5 Azo Dye
2.5. Heterogeneous Photocatalytic Kinetic Studies
2.6. Photocatalytic Degradation Mechanism of RB5 Dye
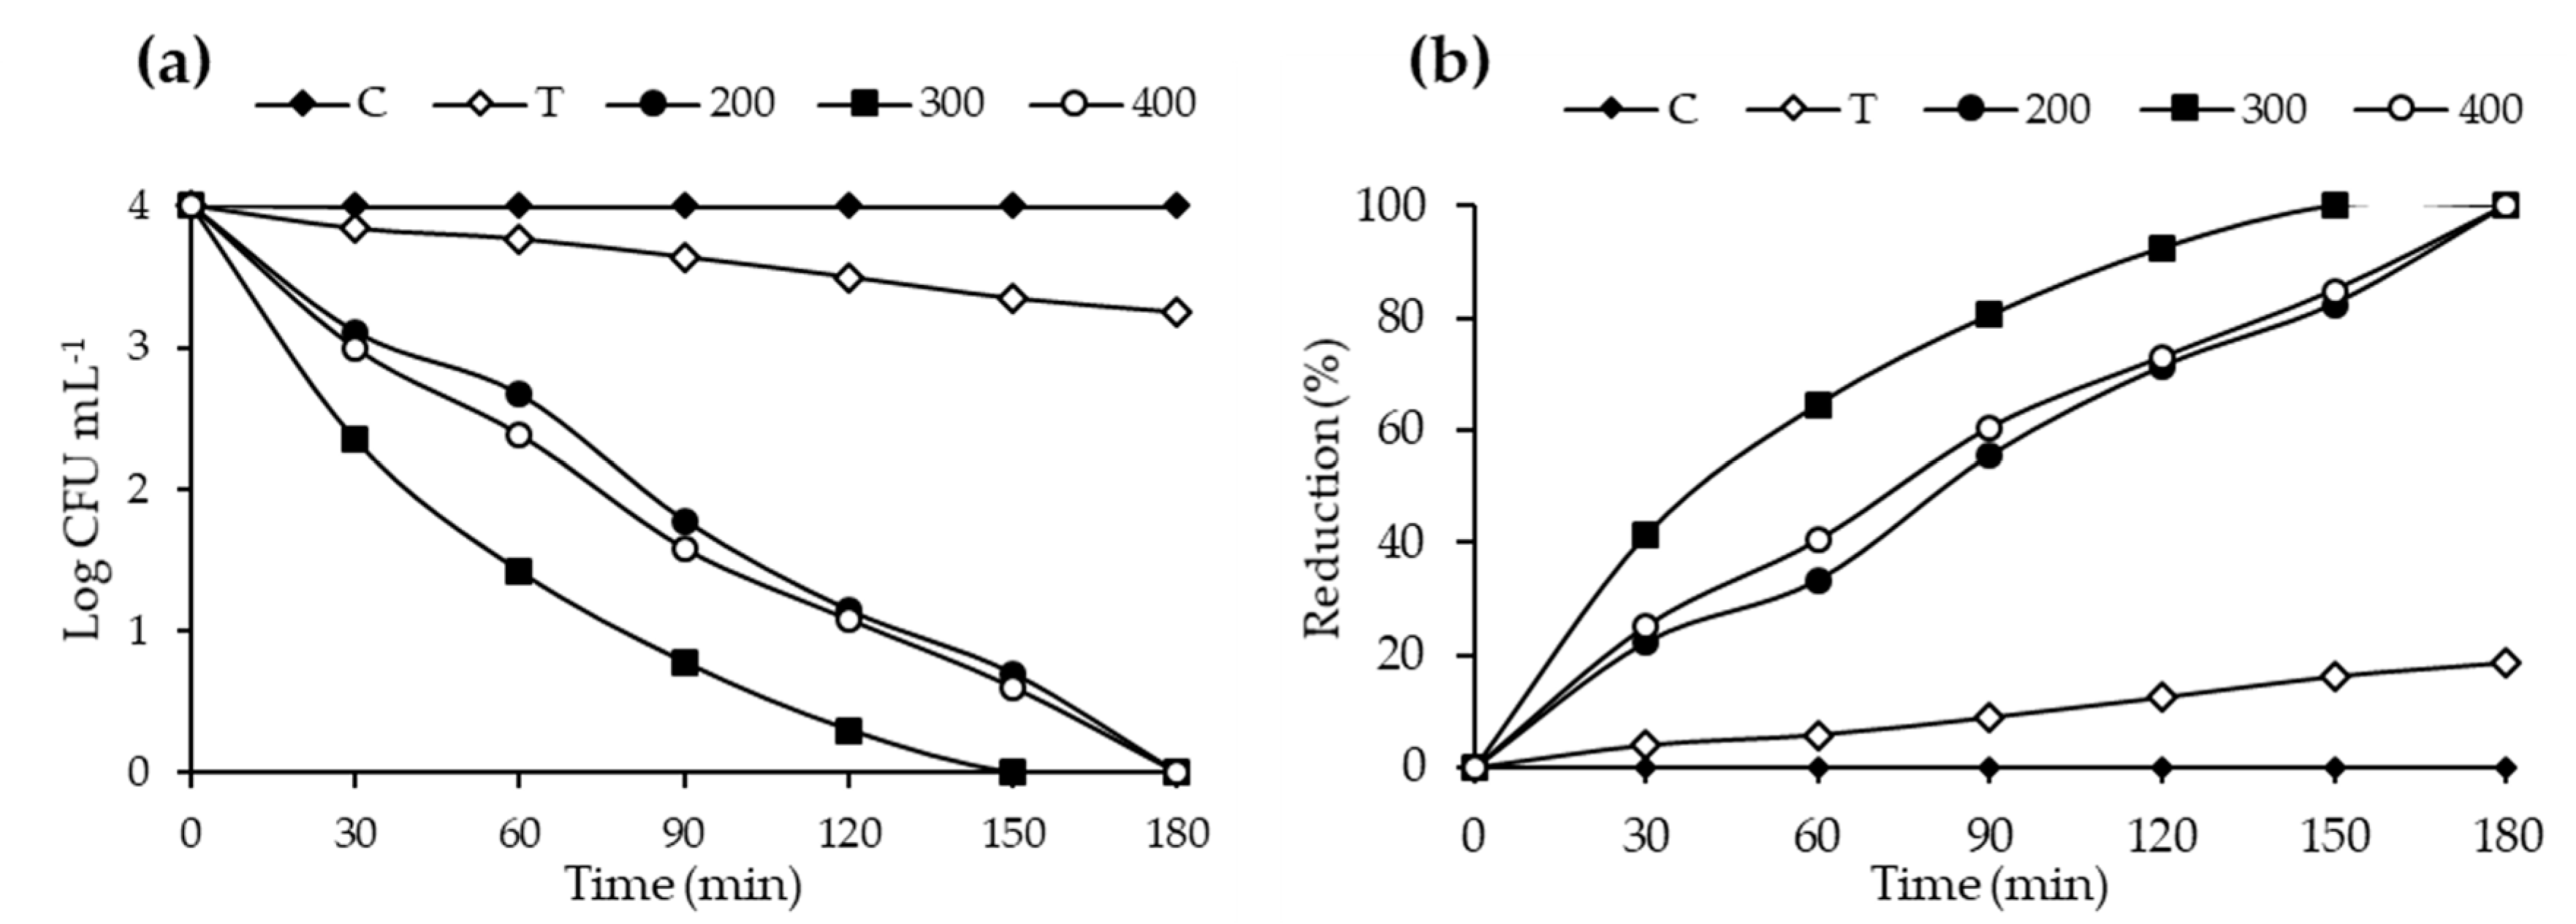
2.7. Photocatalytic Disinfection Performance Evaluation
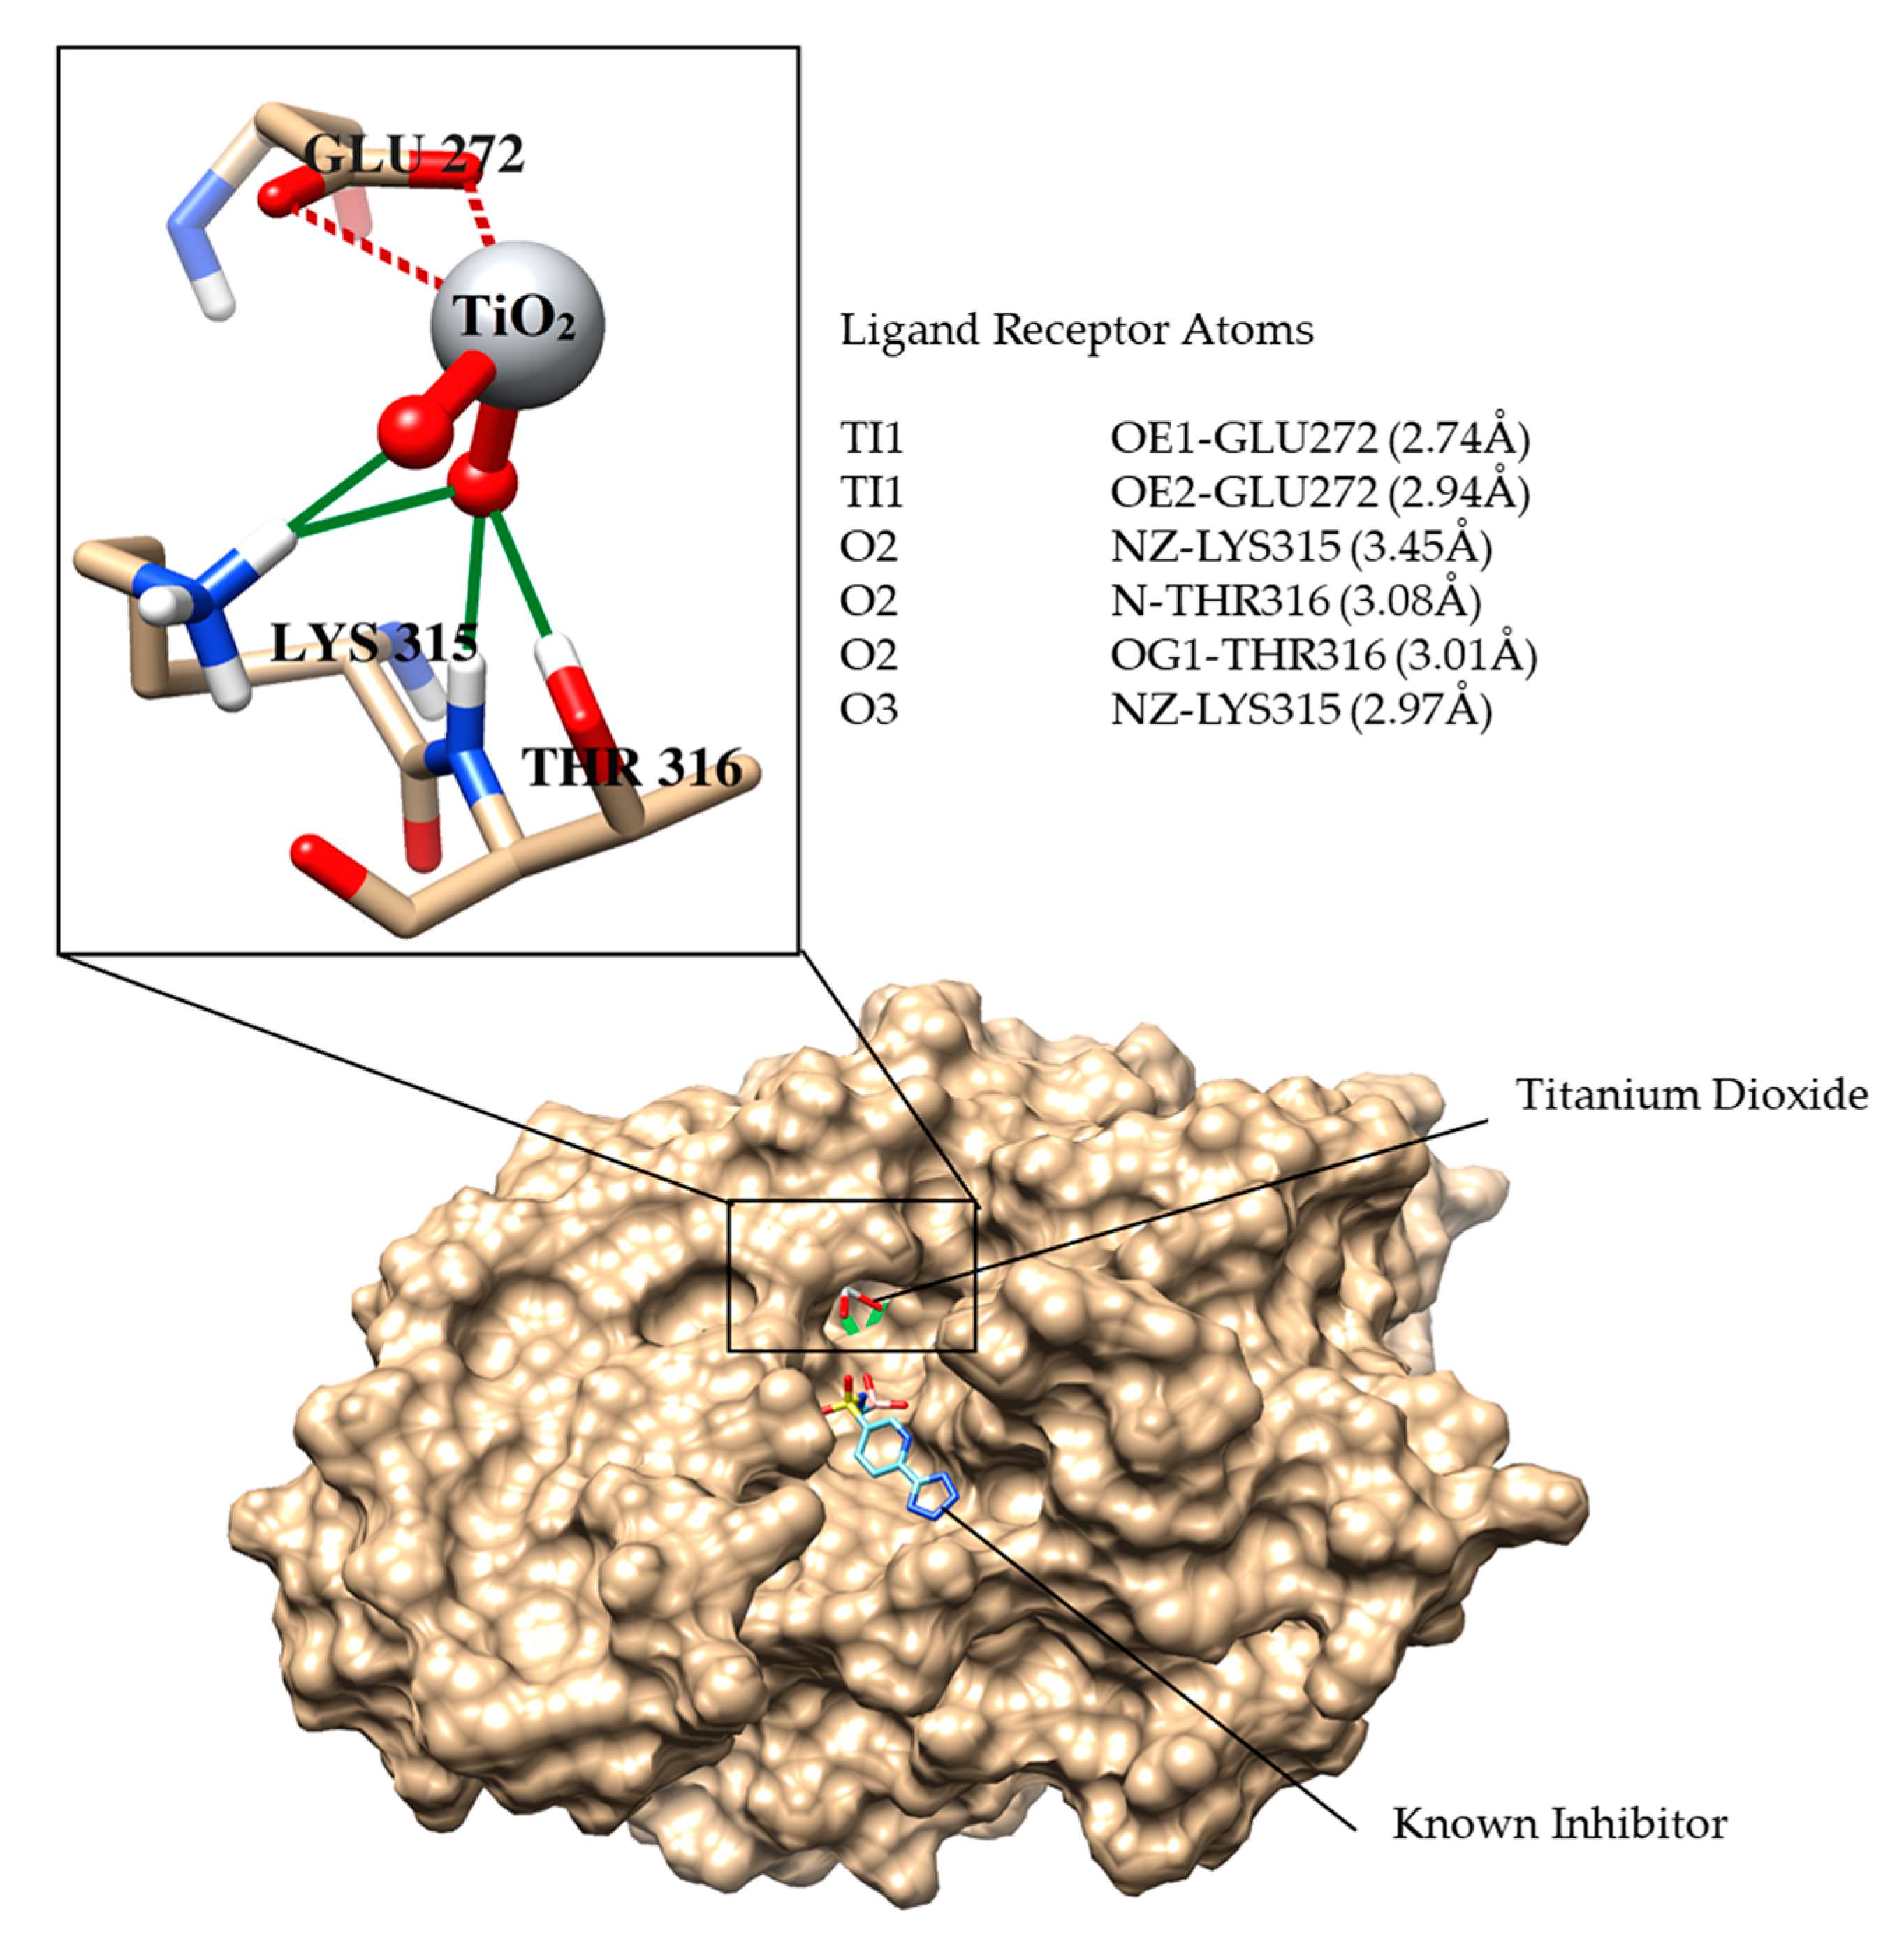
Molecular Docking Studies
3. Material and Methods
3.1. Materials
3.2. Photocatalysts Synthesis
3.3. Photocatalyst Characterization
3.4. Photocatalytic Decolorization Studies
3.5. Effect of Different Reaction Parameters
3.6. Adsorption and Kinetic Study
3.7. Photocatalytic Kinetics
3.8. Photocatalytic Disinfection Performance Evaluation
Molecular Docking
4. Conclusions
Supplementary Materials
Author Contributions
Funding
Conflicts of Interest
References
- Lafi, R.; Gzara, L.; Lajimi, R.H.; Hafiane, A. Treatment of textile wastewater by a hybrid ultrafiltration/electrodialysis process. Chem. Eng. Process. Process Intensif. 2018, 132, 105–113. [Google Scholar] [CrossRef]
- Li, X.; Zhuang, Z.; Li, W.; Pan, H. Photocatalytic reduction of CO2 over noble metal-loaded and nitrogen-doped mesoporous TiO2. Appl. Catal. A Gen. 2012, 429–430, 31–38. [Google Scholar] [CrossRef]
- Natarajan, S.; Bajaj, H.C.; Tayade, R.J. Recent advances based on the synergetic effect of adsorption for removal of dyes from waste water using photocatalytic process. J. Environ. Sci. 2018, 65, 201–222. [Google Scholar] [CrossRef]
- Selvaraj, A.; Parimiladevi, R.; Rajesh, K. Synthesis of Nitrogen Doped Titanium Dioxide (TiO2) and its Photocatalytic Performance for the Degradation of Indigo Carmine Dye. J. Environ. Nanotechnol. 2013, 2, 35–41. [Google Scholar]
- Sathish, M.; Viswanathan, B.; Viswanath, R.P.; Gopinath, C.S. Synthesis, Characterization, Electronic Structure, and Photocatalytic Activity of Nitrogen-Doped TiO2 Nanocatalyst. Chem. Mater. 2005, 17, 6349–6353. [Google Scholar] [CrossRef]
- Fujishima, A.; Honda, K. Electrochemical photolysis of water at a semiconductor electrode. Nature 1972, 238, 37–38. [Google Scholar] [CrossRef]
- Verdier, T.; Coutand, M.; Bertron, A.; Roques, C. Antibacterial activity of TiO2 photocatalyst alone or in coatings on E. coli: The influence of methodological aspects. Coatings 2014, 4, 670–686. [Google Scholar] [CrossRef]
- Li, H.; Cui, Q.; Feng, B.; Wang, J.; Lu, X.; Weng, J. Antibacterial activity of TiO2 nanotubes: Influence of crystal phase, morphology and Ag deposition. Appl. Surf. Sci. 2013, 284, 179–183. [Google Scholar] [CrossRef]
- Kikuchi, Y.; Sunada, K.; Iyoda, T.; Hashimoto, K.; Fujishima, A. Photocatalytic bactericidal effect of TiO2 thin films: Dynamic view of the active oxygen species responsible for the effect. J. Photochem. Photobiol. A Chem. 1997, 106, 51–56. [Google Scholar] [CrossRef]
- Nadtochenko, V.; Denisov, N.; Sarkisov, O.; Gumy, D.; Pulgarin, C.; Kiwi, J. Laser kinetic spectroscopy of the interfacial charge transfer between membrane cell walls of E. coli and TiO2. J. Photochem. Photobiol. A Chem. 2006, 181, 401–407. [Google Scholar] [CrossRef]
- Ananpattarachai, J.; Boonto, Y.; Kajitvichyanukul, P. Visible light photocatalytic antibacterial activity of Ni-doped and N-doped TiO2 on Staphylococcus aureus and Escherichia coli bacteria. Environ. Sci. Pollut. Res. 2016, 23, 4111–4119. [Google Scholar] [CrossRef] [PubMed]
- Rommozzi, E.; Zannotti, M.; Giovannetti, R.; D’Amato, C.A.; Ferraro, S.; Minicucci, M.; Gunnella, R.; Di Cicco, A. Reduced graphene oxide/TiO2 nanocomposite: From synthesis to characterization for efficient visible light photocatalytic applications. Catalysts 2018, 8, 598. [Google Scholar] [CrossRef]
- Yang, T.; Peng, J.; Zheng, Y.; He, X.; Hou, Y.; Wu, L.; Fu, X. Enhanced photocatalytic ozonation degradation of organic pollutants by ZnO modified TiO2 nanocomposites. Appl. Catal. B Environ. 2018, 221, 223–234. [Google Scholar] [CrossRef]
- Deligiannakis, Y. Nanomaterials for Environmental Solar Energy Technologies: Applications & Limitations. KONA Powder Part. J. 2018, 35, 14–31. [Google Scholar]
- Rommozzi, E.; Giovannetti, R.; Zannotti, M.; D’Amato, C.; Ferraro, S.; Cespi, M.; Bonacucina, G.; Minicucci, M.; Di Cicco, A. From TiO2 and Graphite to Graphene doped TiO2 for visible light photocatalytic degradation of refractory dye. In Proceedings of the 5th Scientific Day of the School of Science and Technology, Scuola di Scienz e, coledì8 giugno 2016 Palazz o Du, Camerino, Italy, 8 June 2016; Volume 22. [Google Scholar]
- Chen, S.; Wang, Y.; Li, J.; Hu, Z.; Zhao, H.; Xie, W.; Wei, Z. Synthesis of black TiO2 with efficient visible-light photocatalytic activity by ultraviolet light irradiation and low temperature annealing. Mater. Res. Bull. 2018, 98, 280–287. [Google Scholar] [CrossRef]
- Gogate, P.R.; Pandit, A.B. A review of imperative technologies for wastewater treatment I: Oxidation technologies at ambient conditions. Adv. Environ. Res. 2004, 8, 501–551. [Google Scholar] [CrossRef]
- Mrowetz, M.; Balcerski, W.; Colussi, A.J.; Hoffmann, M.R. Oxidative Power of Nitrogen-Doped TiO2 Photocatalysts under Visible Illumination. J. Phys. Chem. B 2004, 108, 17269–17273. [Google Scholar] [CrossRef]
- Pourzad, A.; Sobhi, H.R.; Behbahani, M.; Esrafili, A.; Kalantary, R.R.; Kermani, M. Efficient visible light-induced photocatalytic removal of paraquat using N-doped TiO2 SiO2 Fe3O4 nanocomposite. J. Mol. Liq. 2020, 299, 112167. [Google Scholar] [CrossRef]
- Ksibi, M.; Rossignol, S.; Tatibouët, J.-M.; Trapalis, C. Synthesis and solid characterization of nitrogen and sulfur-doped TiO2 photocatalysts active under near visible light. Mater. Lett. 2008, 62, 4204–4206. [Google Scholar] [CrossRef]
- Zhao, Y.; Qiu, X.; Burda, C. The Effects of Sintering on the Photocatalytic Activity of N-Doped TiO2 Nanoparticles. Chem. Mater. 2008, 20, 2629–2636. [Google Scholar] [CrossRef]
- Sathish, M.; Viswanathan, B.; Viswanath, R. Characterization and photocatalytic activity of N-doped TiO2 prepared by thermal decomposition of Ti–melamine complex. Appl. Catal. B Environ. 2007, 74, 307–312. [Google Scholar] [CrossRef]
- Abdelhaleem, A.; Chu, W.; Liang, X. Diphenamid degradation via sulfite activation under visible LED using Fe (III) impregnated N-doped TiO2 photocatalyst. Appl. Catal. B Environ. 2019, 244, 823–835. [Google Scholar] [CrossRef]
- Piumetti, M.; Freyria, F.S.; Armandi, M.; Geobaldo, F.; Garrone, E.; Bonelli, B. Fe- and V-doped mesoporous titania prepared by direct synthesis: Characterization and role in the oxidation of AO7 by H2O2 in the dark. Catal. Today 2014, 227, 71–79. [Google Scholar] [CrossRef]
- Xing, M.; Wu, Y.; Zhang, J.; Chen, F. Effect of synergy on the visible light activity of B, N and Fe co-doped TiO2 for the degradation of MO. Nanoscale 2010, 2, 1233–1239. [Google Scholar] [CrossRef]
- Riaz, N.; Chong, F.K.; Dutta, B.K.; Man, Z.B.; Khan, M.S.; Nurlaela, E. Photodegradation of Orange II under visible light using Cu-Ni/TiO2: Effect of calcination temperature. Chem. Eng. J. 2012, 185, 108–119. [Google Scholar] [CrossRef]
- Riaz, N.; Chong, F.K.; Man, Z.B.; Khan, M.S.; Dutta, B.K. Photodegradation of orange II under visible light using Cu–Ni/TiO2: Influence of Cu: Ni mass composition, preparation, and calcination temperature. Ind. Eng. Chem. Res. 2013, 52, 4491–4503. [Google Scholar] [CrossRef]
- Li, S.; Ye, G.; Chen, G. Low-Temperature Preparation and Characterization of Nanocrystalline Anatase TiO2. J. Phys. Chem. C 2009, 113, 4031–4037. [Google Scholar] [CrossRef]
- Zheng, Z.; Zhao, J.; Yuan, Y.; Liu, H.; Yang, D.; Sarina, S.; Zhang, H.; Waclawika, E.R.; Zhu, H. Tuning the Surface Structure of Nitrogen--Doped TiO2 Nanofibres—An Effective Method to Enhance Photocatalytic Activities of Visible--Light--Driven Green Synthesis and Degradation. Chem. Eur. J. 2013, 19, 5731–5741. [Google Scholar] [CrossRef]
- Liu, X.; Xiao, L.; Zhang, Y.; Sun, H. Significantly enhanced piezo-photocatalytic capability in BaTiO3 nanowires for degrading organic dye. J. Mater. 2020, 6, 256–262. [Google Scholar] [CrossRef]
- Xiong, L.; Yang, Y.; Mai, J.; Sun, W.; Zhang, C.; Wei, D.; Chen, Q.; Ni, J. Adsorption behavior of methylene blue onto titanate nanotubes. Chem. Eng. J. 2010, 156, 313–320. [Google Scholar] [CrossRef]
- Cheng, X.; Yu, X.; Xing, Z.; Yang, L. Synthesis and characterization of N-doped TiO2 and its enhanced visible-light photocatalytic activity. Arab. J. Chem. 2016, 9, S1706–S1711. [Google Scholar] [CrossRef]
- D’Amato, C.A.; Giovannetti, R.; Zannotti, M.; Rommozzi, E.; Minicucci, M.; Gunnella, R.; Di Cicco, A. Band gap implications on nano-TiO2 surface modification with ascorbic acid for visible light-active polypropylene coated photocatalyst. Nanomaterials 2018, 8, 599. [Google Scholar] [CrossRef]
- López, R.; Gómez, R. Band-gap energy estimation from diffuse reflectance measurements on sol–gel and commercial TiO2: A comparative study. J. Sol-Gel Sci. Technol. 2012, 61, 1–7. [Google Scholar] [CrossRef]
- Riaz, N.; Chong, F.K.; Man, Z.B.; Sarwar, R.; Farooq, U.; Khan, A.; Khan, M.S. Preparation, characterization and application of Cu–Ni/TiO2 in Orange II photodegradation under visible light: Effect of different reaction parameters and optimization. RSC Adv. 2016, 6, 55650–55665. [Google Scholar] [CrossRef]
- Lei, X.F.; Xue, X.X.; Yang, H.; Chen, C.; Li, X.; Niu, M.C.; Gao, X.Y.; Yang, Y.T. Effect of calcination temperature on the structure and visible-light photocatalytic activities of (N, S and C) co-doped TiO2 nano-materials. Appl. Surf. Sci. 2015, 332, 172–180. [Google Scholar] [CrossRef]
- Rajoriya, S.; Bargole, S.; George, S.; Saharan, V.K.; Gogate, P.R.; Pandit, A.B. Synthesis and characterization of samarium and nitrogen doped TiO2 photocatalysts for photo-degradation of 4-acetamidophenol in combination with hydrodynamic and acoustic cavitation. Sep. Purif. Technol. 2019, 209, 254–269. [Google Scholar] [CrossRef]
- Tian, B.; Li, C.; Gu, F.; Jiang, H. Synergetic effects of nitrogen doping and Au loading on enhancing the visible-light photocatalytic activity of nano-TiO2. Catal. Commun. 2009, 10, 925–929. [Google Scholar] [CrossRef]
- Abdullah, M.; Chong, F.K. Preparation and characterization of tungsten-loaded titanium dioxide photocatalyst for enhanced dye degradation. J. Hazard. Mater. 2010, 176, 451–458. [Google Scholar]
- Saepurahman, A.M.; Abdullah, M.; Chong, F. Dual-effects of adsorption and photodegradation of methylene blue by tungsten-loaded titanium dioxide. Chem. Eng. J. 2010, 158, 418–425. [Google Scholar] [CrossRef]
- Fan, J.; Zhao, Z.; Liu, W.; Xue, Y.; Yin, S. Solvothermal synthesis of different phase N–TiO2 and their kinetics, isotherm and thermodynamic studies on the adsorption of methyl orange. J. Colloid Interface Sci. 2016, 470, 229–236. [Google Scholar] [CrossRef]
- Ananpattarachai, J.; Kajitvichyanukul, P. Photocatalytic degradation of p, p′-DDT under UV and visible light using interstitial N-doped TiO2. J. Environ. Sci. Health Part B 2015, 50, 247–260. [Google Scholar] [CrossRef] [PubMed]
- Bakar, S.A.; Ribeiro, C. Nitrogen-doped titanium dioxide: An overview of material design and dimensionality effect over modern applications. J. Photochem. Photobiol. C Photochem. Rev. 2016, 27, 1–29. [Google Scholar] [CrossRef]
- Sing, K.S. Reporting physisorption data for gas/solid systems with special reference to the determination of surface area and porosity (Recommendations 1984). Pure Appl. Chem. 1985, 57, 603–619. [Google Scholar] [CrossRef]
- Sing, K.S.; Williams, R.T. Physisorption hysteresis loops and the characterization of nanoporous materials. Adsorpt. Sci. Technol. 2004, 22, 773–782. [Google Scholar] [CrossRef]
- Chen, Y.; Liu, K. Preparation and characterization of nitrogen-doped TiO2/diatomite integrated photocatalytic pellet for the adsorption-degradation of tetracycline hydrochloride using visible light. Chem. Eng. J. 2016, 302, 682–696. [Google Scholar] [CrossRef]
- Shahrezaei, F.; Mansouri, Y.; Zinatizadeh, A.A.L.; Akhbari, A. Process modeling and kinetic evaluation of petroleum refinery wastewater treatment in a photocatalytic reactor using TiO2 nanoparticles. Powder Technol. 2012, 221, 203–212. [Google Scholar] [CrossRef]
- Khan, M.S.; Kait, C.F.; Mutalib, M.I.A. Photooxidative desulfurization for diesel using Fe/N−TiO2 photocatalyst. In AIP Conference Proceedings, Proceedings of the 3rd International Conference on Fundamental and Applied Sciences, Kuala Lumpur Convention Center, Kuala Lumpur, Malaysia, 3–5 June 2014; American Institute of Physics: College Park, MD, USA, 2014; pp. 10–16. [Google Scholar]
- Tian, H.; Shen, K.; Hu, X.; Qiao, L.; Zheng, W. N, S co-doped graphene quantum dots-graphene-TiO2 nanotubes composite with enhanced photocatalytic activity. J. Alloy. Compd. 2017, 691, 369–377. [Google Scholar] [CrossRef]
- Hasnat, M.A.; Siddiquey, I.A.; Nuruddin, A. Comparative photocatalytic studies of degradation of a cationic and an anionic dye. Dyes Pigment. 2005, 66, 185–188. [Google Scholar] [CrossRef]
- Pirinejad, L.; Maleki, A.; Shahmoradi, B.; Daraei, H.; Yang, J.-K.; Lee, S.-M. Synthesis and application of Fe-N-Cr-TiO2 nanocatalyst for photocatalytic degradation of Acid Black 1 under LED light irradiation. J. Mol. Liq. 2019, 279, 232–240. [Google Scholar] [CrossRef]
- Mahvelati, S.T.; Goharshadi, E. Photostability and visible-light-driven photoactivity enhancement of hierarchical ZnS nanoparticles: The role of embedment of stable defect sites on the catalyst surface with the assistant of ultrasonic waves. Ultrason. Sonochem. 2017, 34, 78–89. [Google Scholar] [CrossRef]
- Liu, P.; Sun, H.; Liu, X.; Sui, H.; Zhang, Y.; Zhou, D.; Guo, Q.; Ruan, Y. Enhanced photocatalytic performance of Bi2Fe4O9/graphene via modifying graphene composite. J. Am. Ceram. Soc. 2017, 100, 3540–3549. [Google Scholar] [CrossRef]
- Matos, J.; Ocares-Riquelme, J.; Poon, P.S.; Montaña, R.; García, X.; Campos, K.; Hernández-Garrido, J.C.; Titirici, M.M. C-doped anatase TiO2: Adsorption kinetics and photocatalytic degradation of methylene blue and phenol, and correlations with DFT estimations. J. Colloid Interface Sci. 2019, 547, 14–29. [Google Scholar] [CrossRef] [PubMed]
- Sun, H.; Liu, Y.; Zhang, Y.; Lv, L.; Zhou, J.; Chen, W. Synthesis of Bi2Fe4O9/reduced graphene oxide composite by one-step hydrothermal method and its high photocatalytic performance. J. Mater. Sci. Mater. Electron. 2014, 25, 4212–4218. [Google Scholar] [CrossRef]
- Jawad, A.H.; Mubarak, N.S.A.; Ishak, M.A.M.; Ismail, K.; Nawawi, W.I. Kinetics of photocatalytic decolourization of cationic dye using porous TiO2 film. J. Taibah Univ. Sci. 2016, 10, 352–362. [Google Scholar] [CrossRef]
- Nguyen, C.H.; Fu, C.-C.; Juang, R.-S. Degradation of methylene blue and methyl orange by palladium-doped TiO2 photocatalysis for water reuse: Efficiency and degradation pathways. J. Clean. Product. 2018, 202, 413–427. [Google Scholar] [CrossRef]
- Milosevic, I.; Jayaprakash, A.; Greenwood, B.; Van Driel, B.; Rtimi, S.; Bowen, P. Synergistic effect of fluorinated and N doped TiO2 nanoparticles leading to different microstructure and enhanced photocatalytic bacterial inactivation. Nanomaterials 2017, 7, 391. [Google Scholar] [CrossRef]
- Hosseini, M.; Abad, S.N.K.; Ilkhechi, N.N.; Mozammel, M.; Eftekhari, N. The role of Sn–Fe co-doping on the atomic structure, phase transformation and antibacterial activity of TiO2 nanoparticles. Mater. Res. Express 2019, 6, 1050c1051. [Google Scholar] [CrossRef]
- Wang, Y.Z.; Wu, Y.S.; Xue, X.X.; Yang, H.; Liu, Z.H. Microstructure and antibacterial activity of ions (Ce, Y, or B)-doped Zn-TiO2: A comparative study. Mater. Technol. 2017, 32, 310–320. [Google Scholar] [CrossRef]
- Talebian, N.; Nilforoushan, M.R.; Zargar, E.B. Enhanced antibacterial performance of hybrid semiconductor nanomaterials: ZnO/SnO2 nanocomposite thin films. Appl. Surf. Sci. 2011, 258, 547–555. [Google Scholar] [CrossRef]
- Iftikhar, A.; Khan, M.S.; Rashid, U.; Mahmood, Q.; Zafar, H.; Bilal, M.; Riaz, N. Influence of metallic species for efficient photocatalytic water disinfection: Bactericidal mechanism of in vitro results using docking simulation. Environ. Sci. Pollut. Res. 2020. [Google Scholar] [CrossRef]
- Sur, V.P.; Kominkova, M.; Buchtova, Z.; Dolezelikova, K.; Zitka, O.; Moulick, A. CdSe QD Biosynthesis in Yeast Using Tryptone-Enriched Media and Their Conjugation with a Peptide Hecate for Bacterial Detection and Killing. Nanomaterials 2019, 9, 1463. [Google Scholar] [CrossRef] [PubMed]
- Grace, J.L.; Huang, J.X.; Cheah, S.-E.; Truong, N.P.; Cooper, M.A.; Li, J.; Davis, T.P.; Quinn, J.F.; Velkov, T.; Whittaker, M.R. Antibacterial low molecular weight cationic polymers: Dissecting the contribution of hydrophobicity, chain length and charge to activity. RSC Adv. 2016, 6, 15469–15477. [Google Scholar] [CrossRef] [PubMed]
- Langford, J.I.; Wilson, A. Scherrer after sixty years: A survey and some new results in the determination of crystallite size. J. Appl. Crystallogr. 1978, 11, 102–113. [Google Scholar] [CrossRef]
- Houas, A.; Lachheb, H.; Ksibi, M.; Elaloui, E.; Guillard, C.; Herrmann, J.-M. Photocatalytic degradation pathway of methylene blue in water. Appl. Catal. B Environ. 2001, 31, 145–157. [Google Scholar] [CrossRef]
- Eidam, O.; Romagnoli, C.; Dalmasso, G.; Barelier, S.; Caselli, E.; Bonnet, R.; Shoichet, B.K.; Prati, F. Fragment-guided design of subnanomolar beta-lactamase inhibitors active in vivo. Proc. Natl. Acad. Sci. USA 2012, 109, 17448–17453. [Google Scholar] [CrossRef]
- Kim, S.W.; Lee, J.S.; Park, S.B.; Lee, A.R.; Jung, J.W.; Chun, J.H.; Lazarte, J.M.S.; Kim, J.; Seo, J.-S.; Kim, J.-H. The Importance of Porins and β-Lactamase in Outer Membrane Vesicles on the Hydrolysis of β-Lactam Antibiotics. Int. J. Mol. Sci. 2020, 21, 2822. [Google Scholar] [CrossRef]
Sample Availability: Samples of the photocatalyst can be resynthesized and made available upon request. |


| Photocatalyst | T Range (°C) | Weight Loss (%) |
|---|---|---|
| 10N–TiO2 | 44–115 | 4.01 |
| 116–799 | 17.85 | |
| 15N–TiO2 | 44–115 | 3.83 |
| 116–799 | 18.93 | |
| 20N–TiO2 | 44–143 | 4.81 |
| 144–799 | 25.72 | |
| 25N–TiO2 | 45–154 | 12.44 |
| 155–799 | 34.36 | |
| 30N–TiO2 | 47–144 | 12.70 |
| 145–799 | 37.47 |
| Photocatalyst | FWHM β (Radian) | Crystallite Size D (nm) |
|---|---|---|
| 15N–TiO2-300 | 0.024 | 6.28 |
| 20N–TiO2-300 | 0.026 | 5.73 |
| TiO2 anatase | 0.003 | 45.11 |
| Sample | Surface Area (m2 g−1) | Total Pore Volume (cm3 g−1) | Average Pore Diameter (nm) |
|---|---|---|---|
| TiO2-300 | 66.31 | 0.113 | 6.85 |
| 5N–TiO2-300 | 71.09 | 0.126 | 7.12 |
| 10N–TiO2-300 | 69.32 | 0.126 | 7.30 |
| 20N–TiO2-300 | 49.54 | 0.264 | 21.3 |
| Photocatalyst (mol %) | Decolorization (%) | ||
|---|---|---|---|
| 200 °C | 300 °C | 400 °C | |
| 0N–TiO2 | 41.07 | 45.90 | 30.65 |
| 5N–TiO2 | 75.90 | 83.15 | 31.32 |
| 10N–TiO2 | 82.18 | 81.70 | 33.41 |
| 15N–TiO2 | 88.94 | 92.00 | 51.92 |
| 20N–TiO2 | 77.84 | 95.06 | 55.30 |
| 25N–TiO2 | 69.47 | 85.88 | 28.26 |
| 30N–TiO2 | 63.83 | 83.15 | 41.62 |
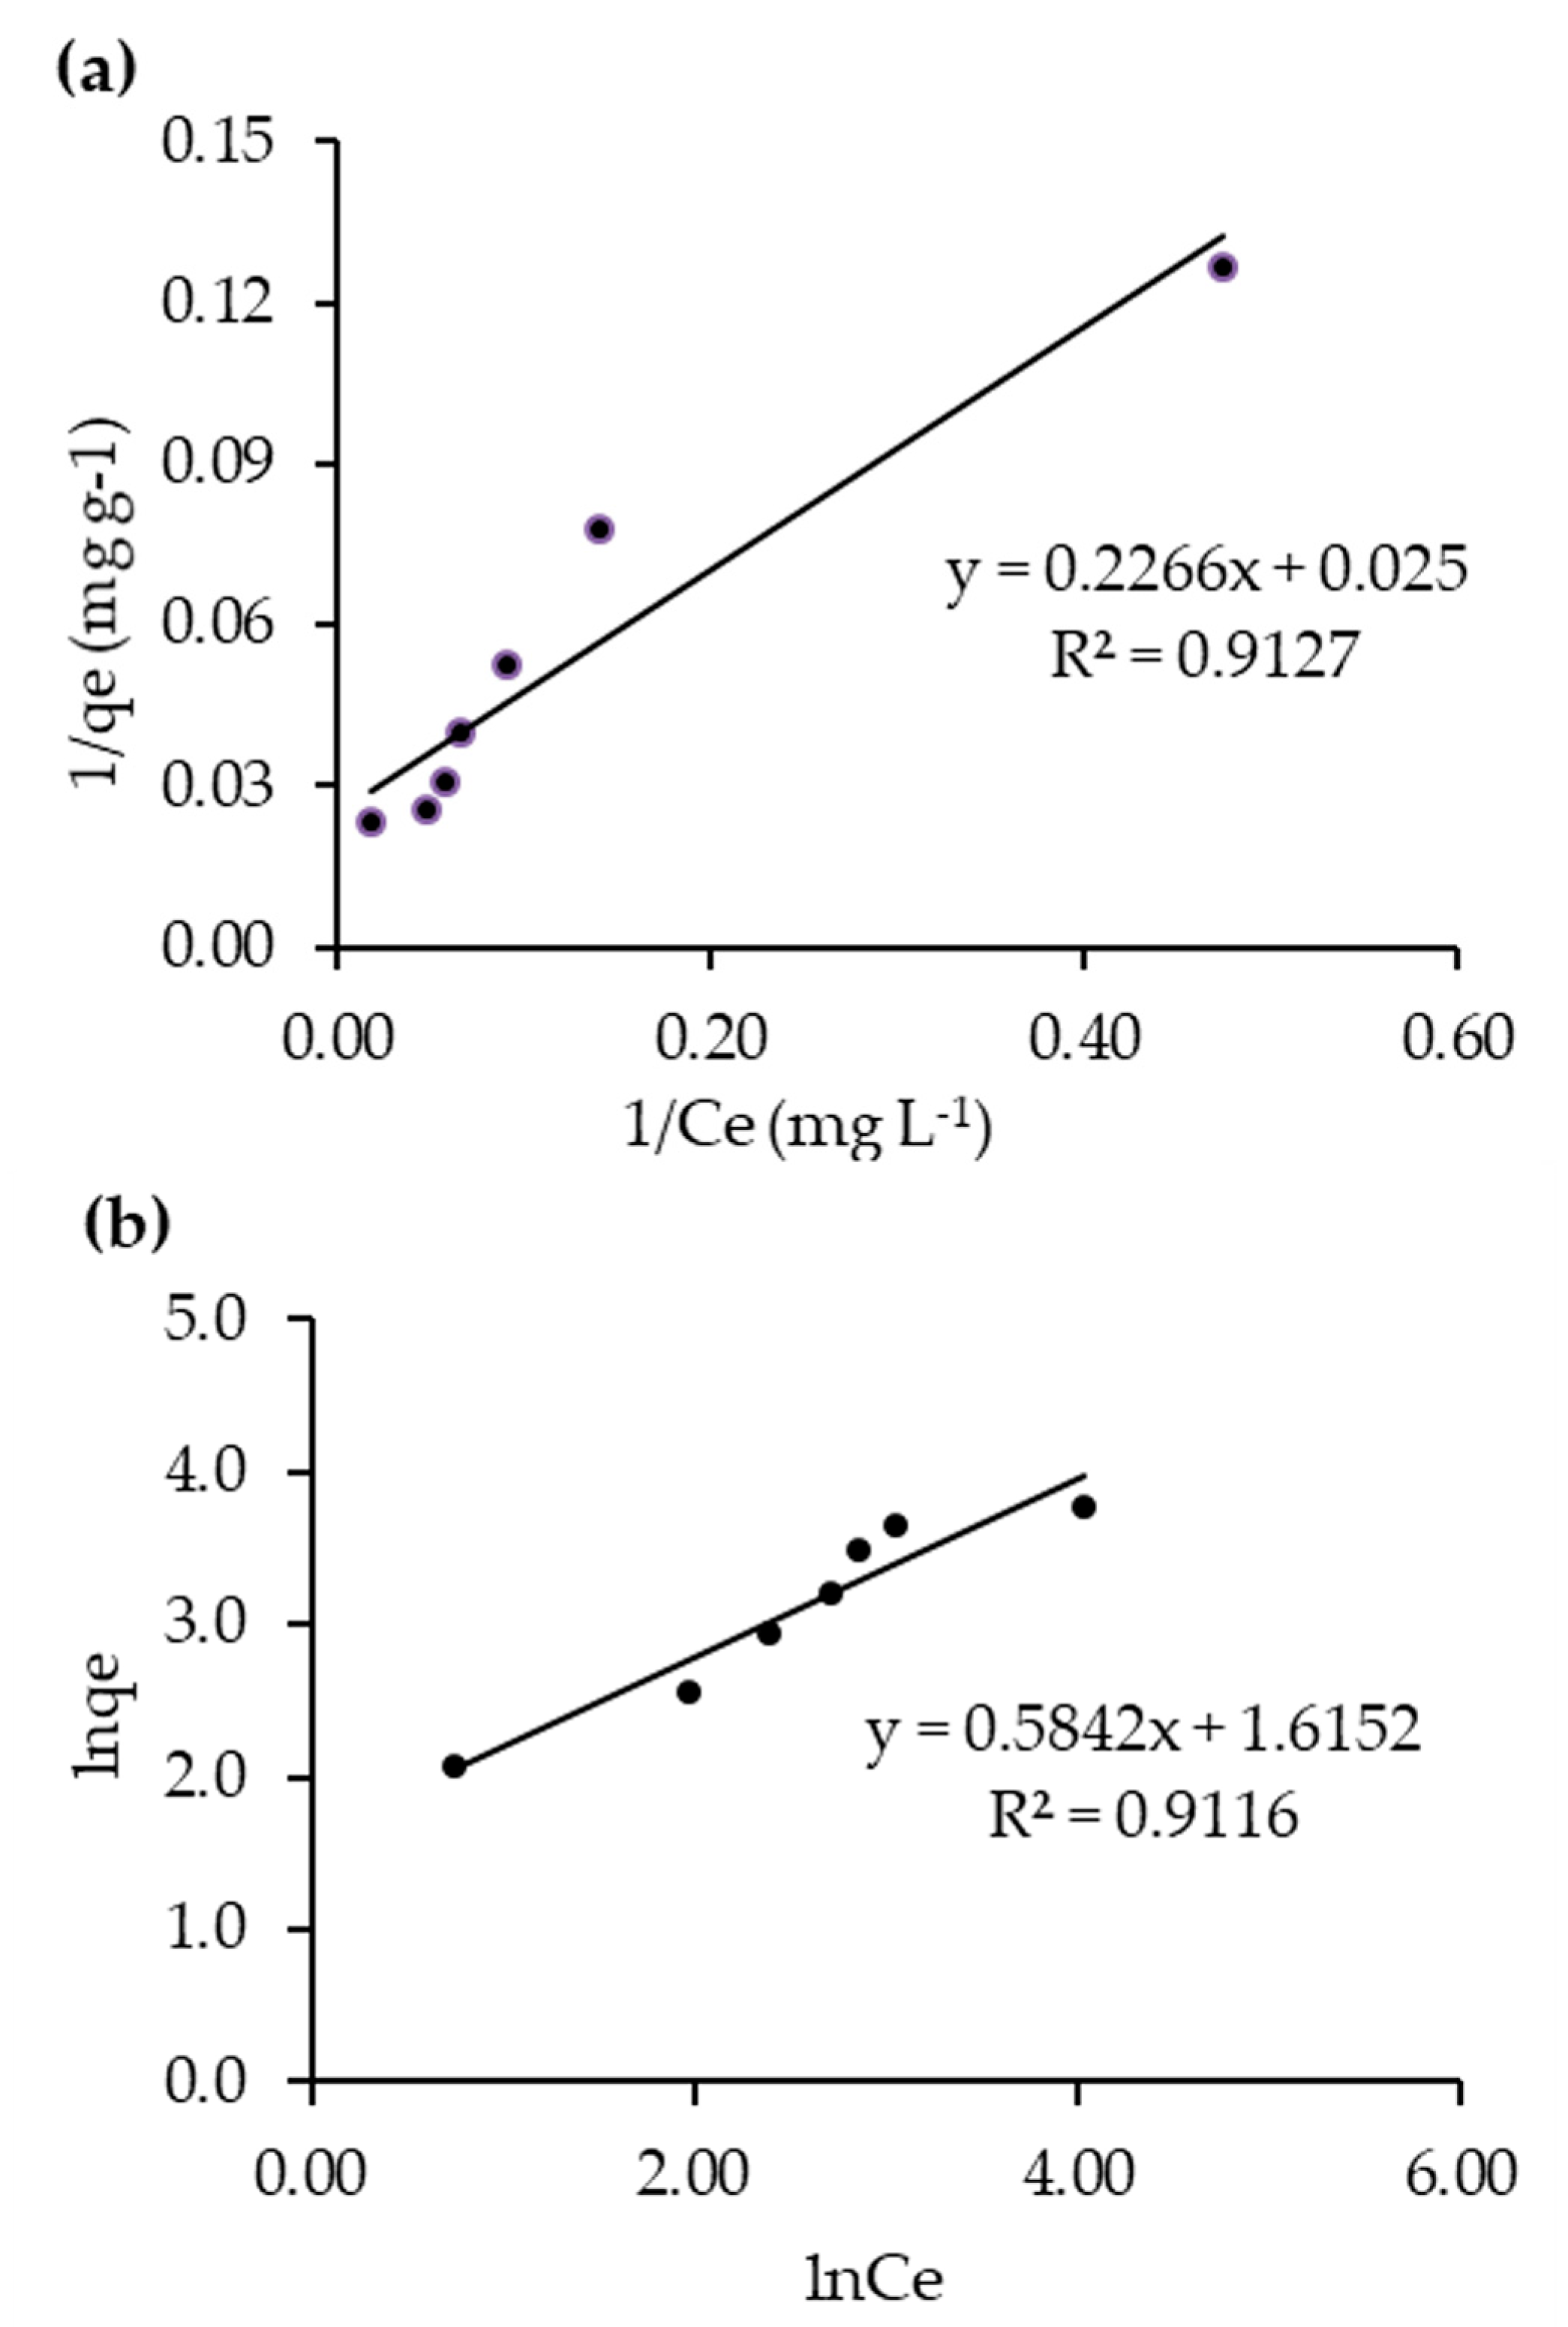
| Isotherms | Plot | Parameters | R2 |
|---|---|---|---|
| Langmuir | 1/qe vs. 1/Ce | qm = 40 mg g−1 | 0.9127 |
| Kads = 0.1103 | |||
| Freundlich | lnqe vs. lnCe | KF = 41.23 mg g−1 | 0.9116 |
| 1/n = 0.58 |
| [RB5]o (mg L−1) | Pseudo First Order | Second-Order | ||
|---|---|---|---|---|
| Kapp (min−1) | R2 | Kapp (min−1) | R2 | |
| 10 | 6.2 × 10⁻² | 0.9556 | 8.22 × 10⁻¹ | 0.6419 |
| 20 | 5.1 × 10⁻² | 0.9577 | 2.04 × 10⁻² | 0.6504 |
| 30 | 4.9 × 10⁻² | 0.9716 | 9.00 × 10⁻³ | 0.7907 |
| 40 | 2.9 × 10⁻² | 0.9705 | 2.10 × 10⁻³ | 0.8928 |
| 50 | 2.3 × 10⁻² | 0.9810 | 1.10 × 10⁻³ | 0.9694 |
| 60 | 1.5 × 10⁻² | 0.9801 | 4.00 × 10⁻⁴ | 0.9357 |
| 100 | 1.1 × 10⁻² | 0.9915 | 2.00 × 10⁻⁴ | 0.9812 |
© 2020 by the authors. Licensee MDPI, Basel, Switzerland. This article is an open access article distributed under the terms and conditions of the Creative Commons Attribution (CC BY) license (http://creativecommons.org/licenses/by/4.0/).
Share and Cite
Khan, M.S.; Shah, J.A.; Arshad, M.; Halim, S.A.; Khan, A.; Shaikh, A.J.; Riaz, N.; Khan, A.J.; Arfan, M.; Shahid, M.; et al. Photocatalytic Decolorization and Biocidal Applications of Nonmetal Doped TiO2: Isotherm, Kinetic Modeling and In Silico Molecular Docking Studies. Molecules 2020, 25, 4468. https://doi.org/10.3390/molecules25194468
Khan MS, Shah JA, Arshad M, Halim SA, Khan A, Shaikh AJ, Riaz N, Khan AJ, Arfan M, Shahid M, et al. Photocatalytic Decolorization and Biocidal Applications of Nonmetal Doped TiO2: Isotherm, Kinetic Modeling and In Silico Molecular Docking Studies. Molecules. 2020; 25(19):4468. https://doi.org/10.3390/molecules25194468
Chicago/Turabian StyleKhan, Muhammad Saqib, Jehanzeb Ali Shah, Muhammad Arshad, Sobia Ahsan Halim, Ajmal Khan, Ahson Jabbar Shaikh, Nadia Riaz, Asim Jahangir Khan, Muhammad Arfan, Muhammad Shahid, and et al. 2020. "Photocatalytic Decolorization and Biocidal Applications of Nonmetal Doped TiO2: Isotherm, Kinetic Modeling and In Silico Molecular Docking Studies" Molecules 25, no. 19: 4468. https://doi.org/10.3390/molecules25194468
APA StyleKhan, M. S., Shah, J. A., Arshad, M., Halim, S. A., Khan, A., Shaikh, A. J., Riaz, N., Khan, A. J., Arfan, M., Shahid, M., Pervez, A., Al-Harrasi, A., & Bilal, M. (2020). Photocatalytic Decolorization and Biocidal Applications of Nonmetal Doped TiO2: Isotherm, Kinetic Modeling and In Silico Molecular Docking Studies. Molecules, 25(19), 4468. https://doi.org/10.3390/molecules25194468