
Microencapsulation of Fluticasone Propionate and Salmeterol Xinafoate in Modified Chitosan Microparticles for Release Optimization

 ,
, 

Abstract
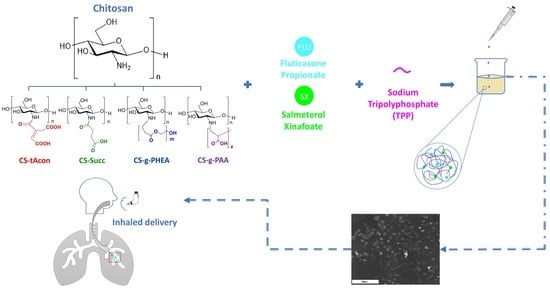
1. Introduction
2. Results and Discussion
2.1. Characterization of Modified-CS Systems
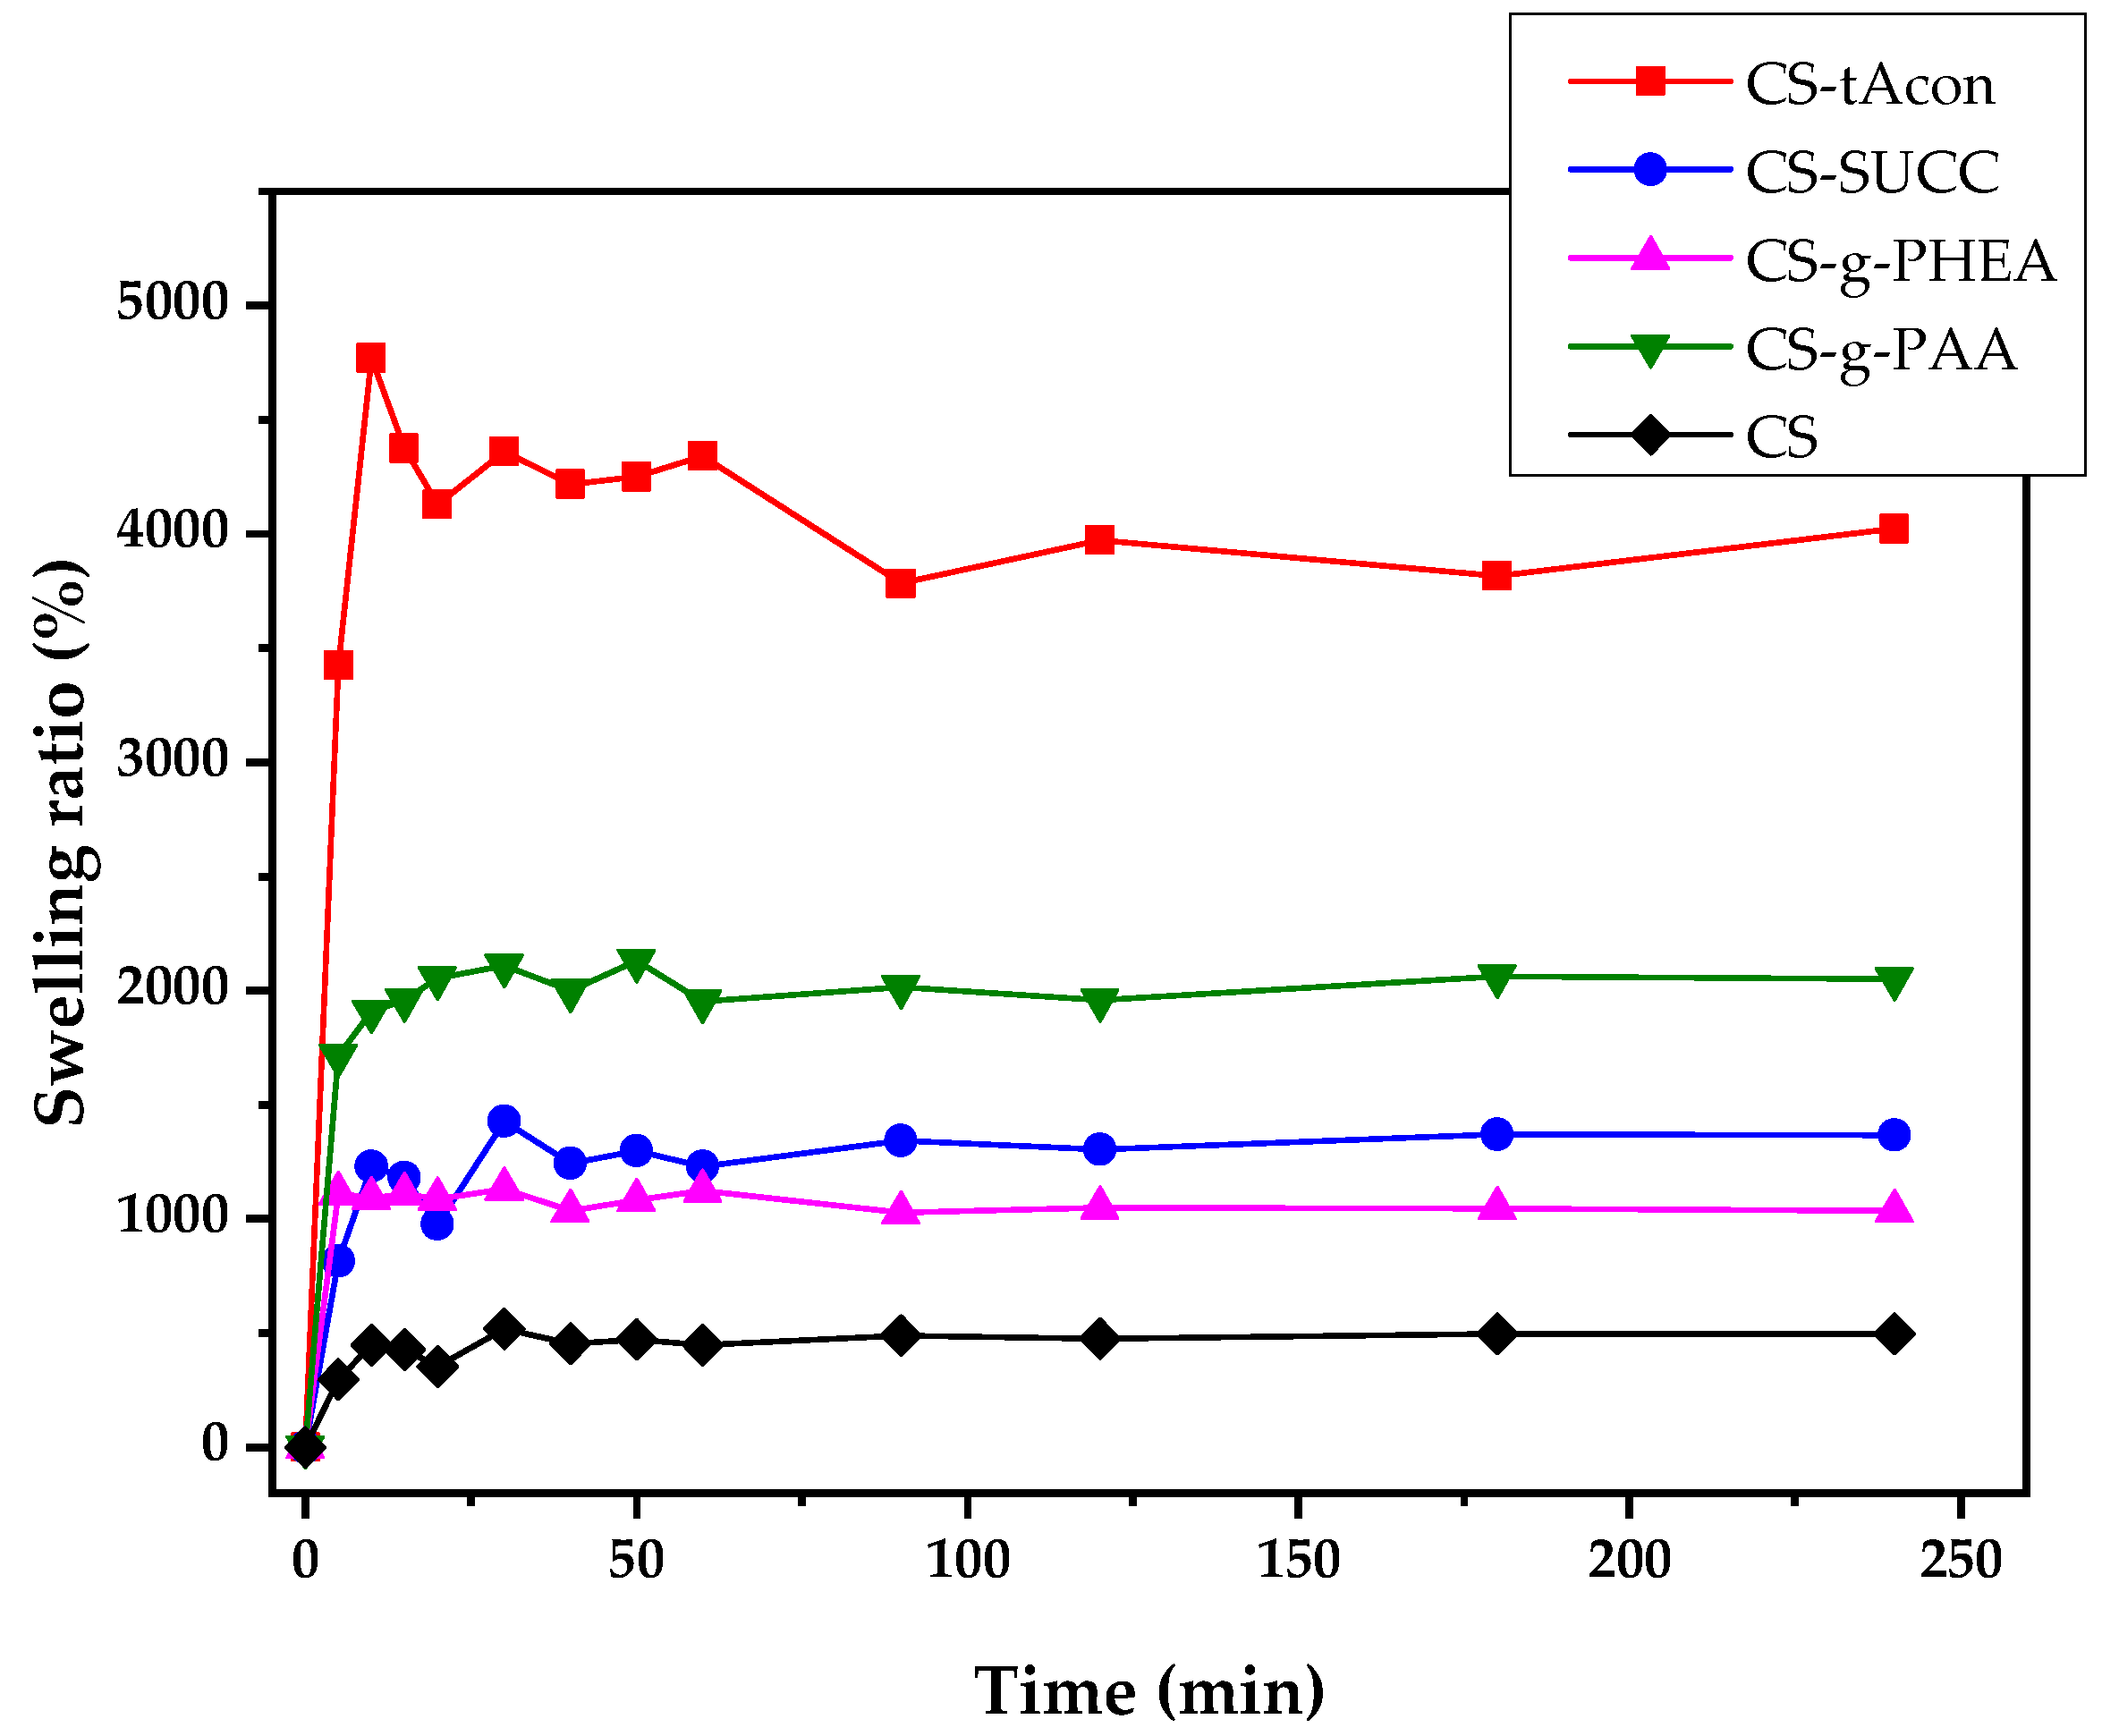
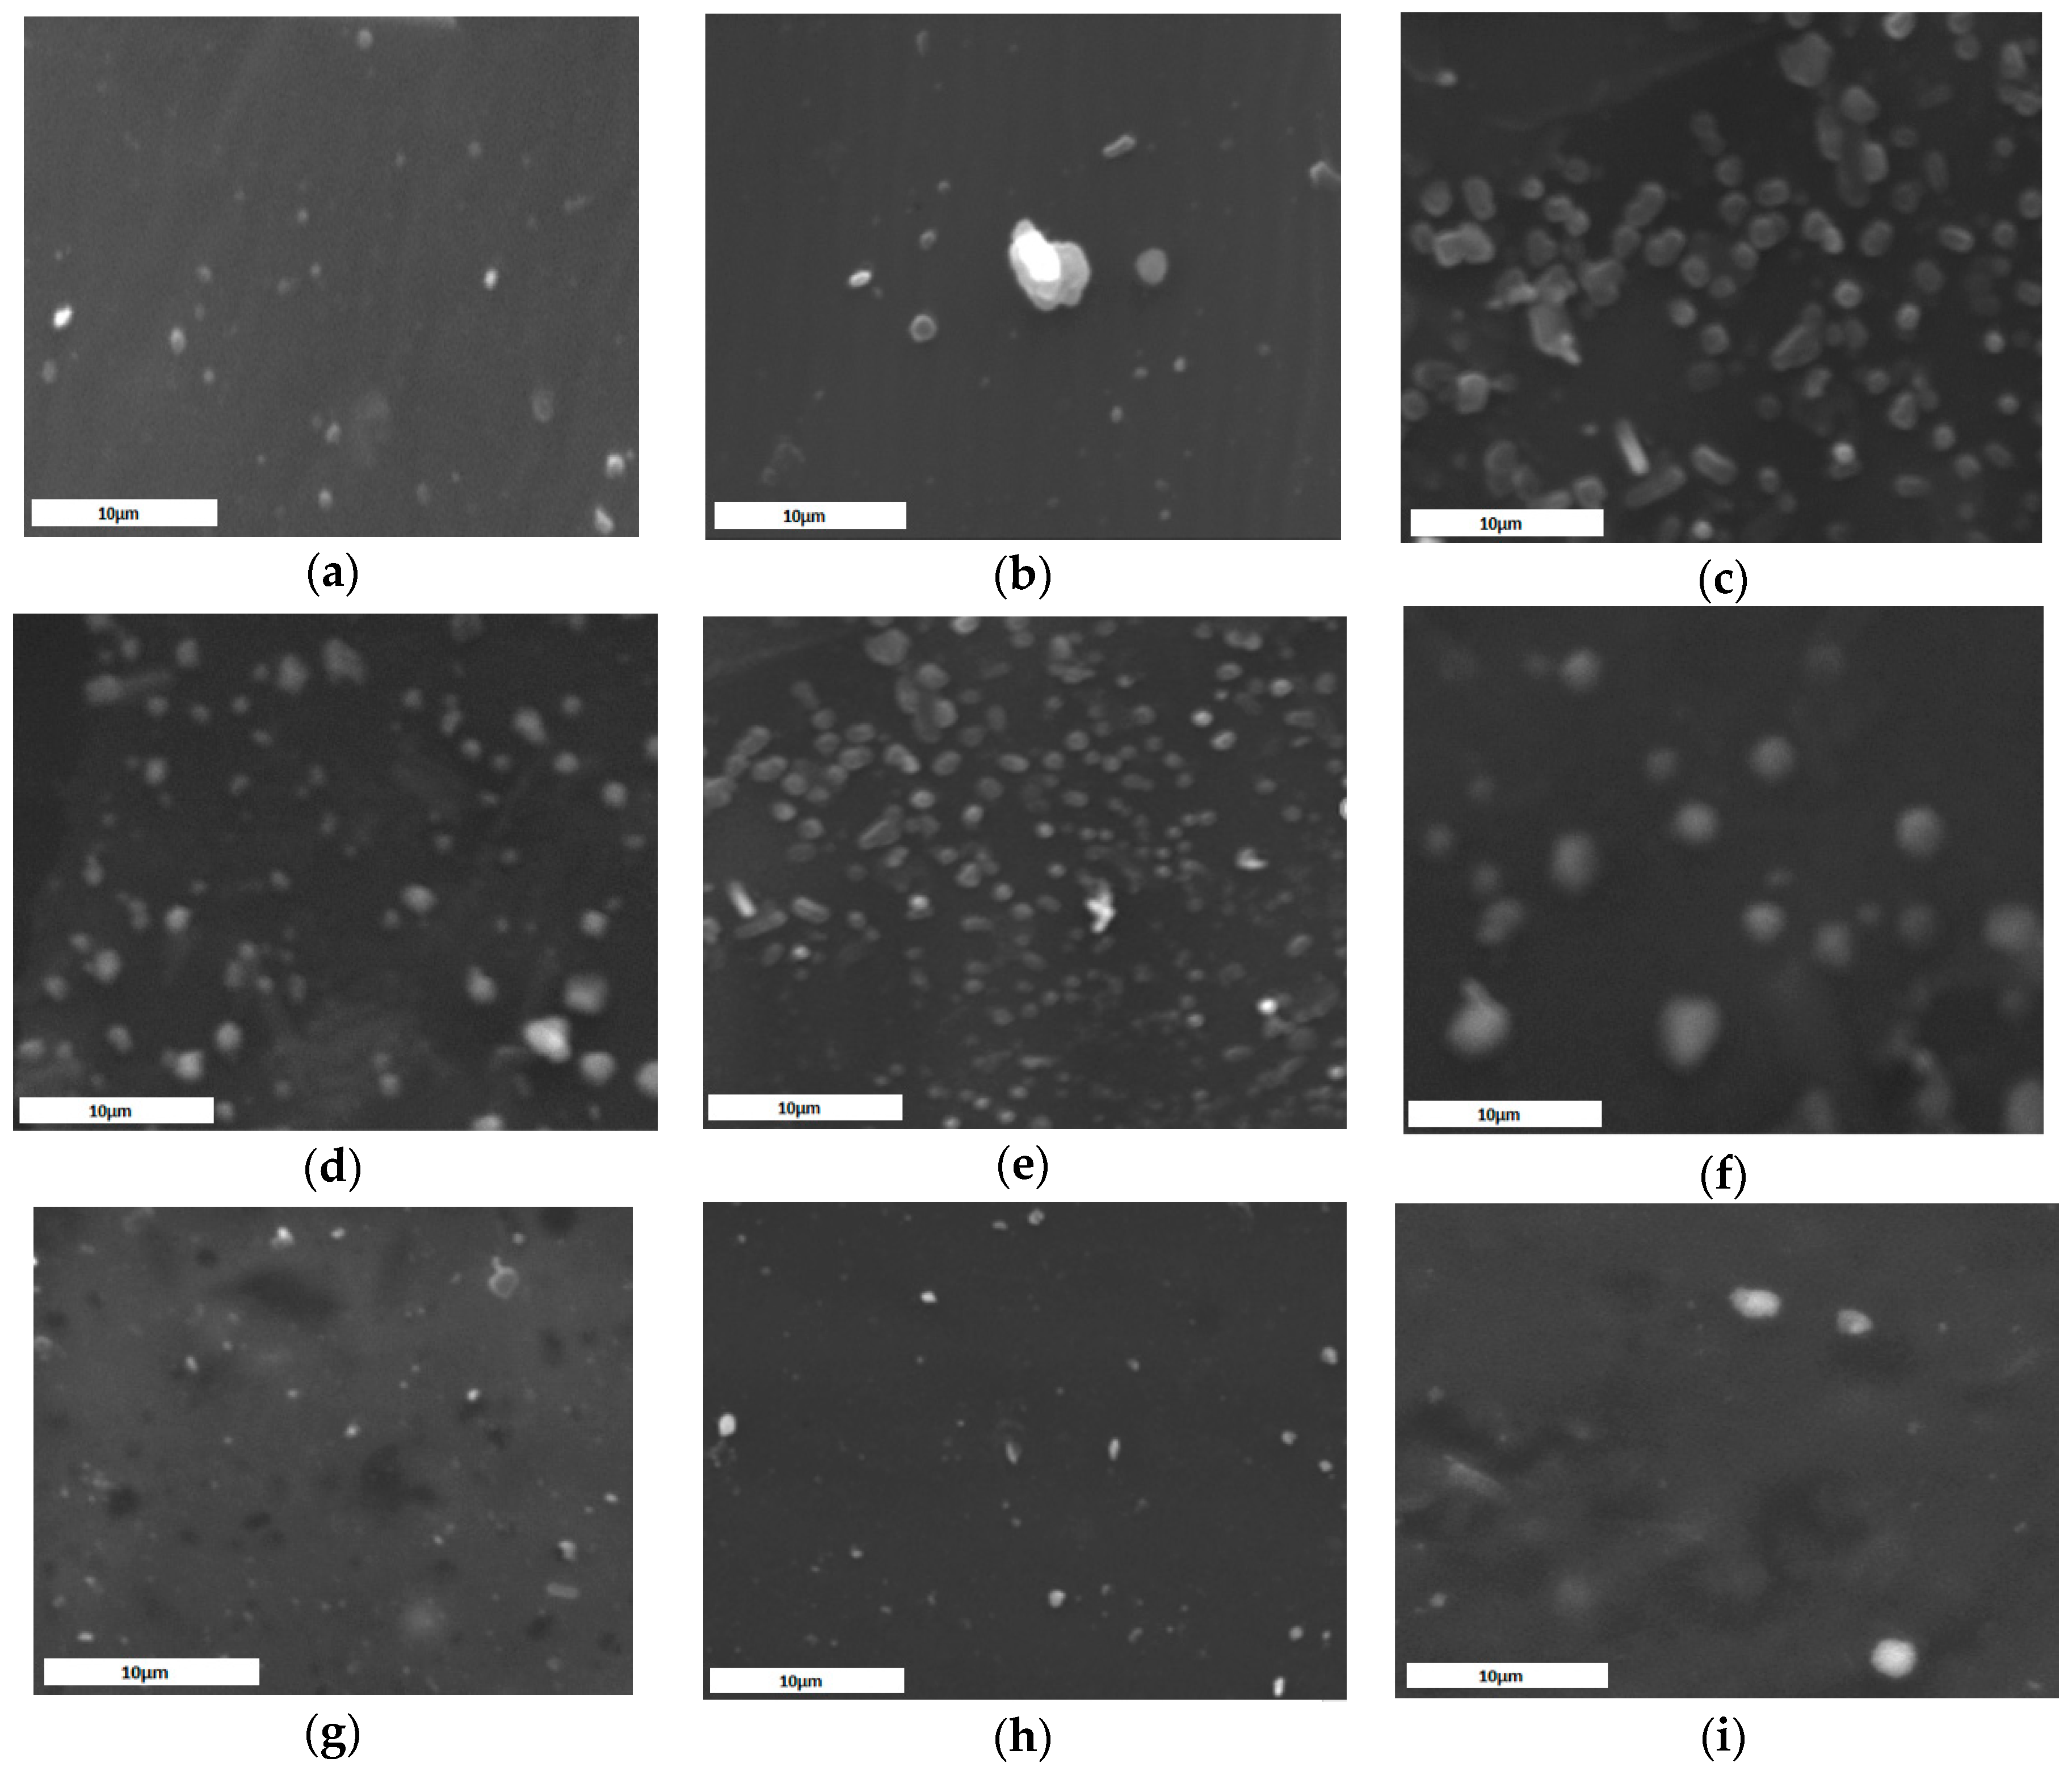
2.2. Characterization of MPs
3. Materials and Methods
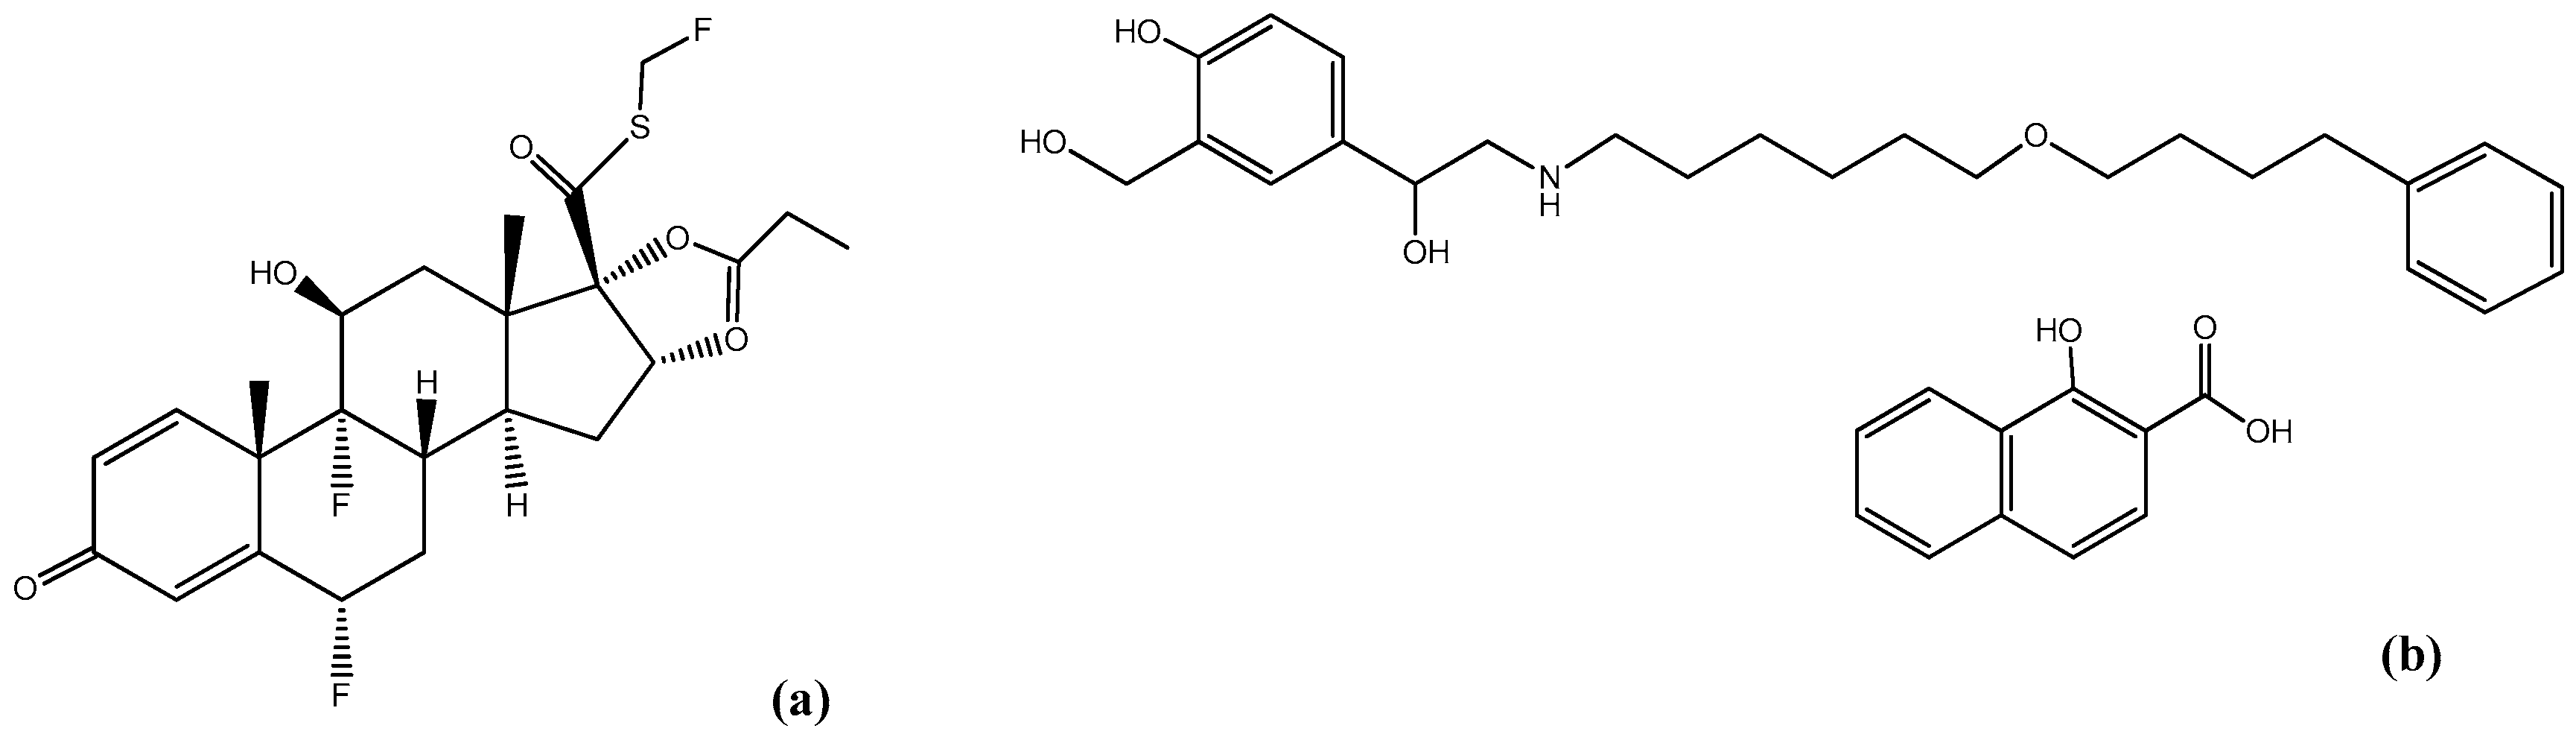
3.1. Materials
3.2. Synthesis of CS Derivatives
3.2.1. Chitosan Modified with Trans-Aconitic Acid (CS-tAcon)
3.2.2. Chitosan Modified with Succinic Anhydride (CS-Succ)
3.2.3. Chitosan Grafted with 2-Hydroxyethyl Acrylate (CS-g-PHEA)
3.2.4. Chitosan Grafted with Acrylic Acid (CS-g-PAA)
3.3. Preparation of MPs via Ionic Gelation
3.4. Characterization of Materials and MPs
3.4.1. Grafting Percentage and Grafting Efficacy
3.4.2. Fourier-Transformed Infrared Spectroscopy (FTIR)
3.4.3. Nuclear Magnetic Resonance (NMR)
3.4.4. Wide-Angle X-ray Scattering (XRD)
3.4.5. Dynamic Light Scattering (DLS)
3.4.6. Differential Scanning Calorimetry (DSC)
3.4.7. Thermogravimetric Analysis (TGA)
3.4.8. Scanning Electron Microscopy (SEM)
3.4.9. Swelling Capacity
3.4.10. High-Pressure Liquid Chromatography (HPLC), Quantitative Analysis and Drug Loading
3.4.11. In Vitro Dissolution Studies
4. Conclusions
Supplementary Materials
Author Contributions
Funding
Conflicts of Interest
References
- Amore, E.; Ferraro, M.; Manca, M.L.; Gjomarkaj, M.; Giammona, G.; Pace, E.; Bondì, M.L. Mucoadhesive solid lipid microparticles for controlled release of a corticosteroid in the chronic obstructive pulmonary disease treatment. Nanomedicine 2017, 12, 2287–2302. [Google Scholar] [CrossRef] [PubMed]
- De Coster, D.A.; Jones, M. Tailoring of corticosteroids in COPD management. Curr. Respir. Care Rep. 2014, 3, 121–132. [Google Scholar] [CrossRef] [PubMed]
- Chung, K.F. Salmeterol/fluticasone combination in the treatment of COPD. Int. J. Chron. Obstruct. Pulmon. Dis. 2006, 1, 235–242. [Google Scholar] [CrossRef] [PubMed]
- Hattab, Y.; Alhassan, S.; Balaan, M.; Lega, M.; Singh, A.C. Chronic obstructive pulmonary disease. Crit. Care Nurs. Q. 2016, 39, 124–130. [Google Scholar] [CrossRef] [PubMed]
- Hogg, J.C. A brief review of chronic obstructive pulmonary disease. Can. Respir. J. 2012, 19, 381–384. [Google Scholar] [CrossRef] [PubMed]
- Rogliani, P.; Calzetta, L.; Coppola, A.; Cavalli, F.; Ora, J.; Puxeddu, E.; Matera, M.G.; Cazzola, M. Optimizing drug delivery in COPD: The role of inhaler devices. Respir. Med. 2017, 124, 6–14. [Google Scholar] [CrossRef]
- Markham, A.; Jarvis, B. Inhaled salmeterol/fluticasone propionate combination: A review of its use in persistent asthma. Drugs 2000, 60, 1207–1233. [Google Scholar] [CrossRef]
- Michael, Y.; Chowdhry, B.Z.; Ashurst, I.C.; Snowden, M.J.; Davies-cutting, C.; Gray, S. The physico-chemical properties of salmeterol and fluticasone propionate in different solvent environments. Int. J. Pharm. 2000, 200, 279–288. [Google Scholar] [CrossRef]
- Coutinho, A.E.; Chapman, K.E. The anti-inflammatory and immunosuppressive effects of glucocorticoids, recent developments and mechanistic insights. Mol. Cell. Endocrinol. 2011, 335, 2–13. [Google Scholar] [CrossRef]
- El-Gendy, N.; Pornputtapitak, W.; Berkland, C. Nanoparticle agglomerates of fluticasone propionate in combination with albuterol sulfate as dry powder aerosols. Eur. J. Pharm. Sci. 2011, 44, 522–533. [Google Scholar] [CrossRef]
- Currie, G.P.; Lipworth, B.J. Inhaled treatment for chronic obstructive pulmonary disease: What’s new and how does it fit? QJM Int. J. Med. 2016, 109, 505–512. [Google Scholar] [CrossRef]
- Ernst, P.; Saad, N.; Suissa, S. Inhaled corticosteroids in COPD: The clinical evidence. Eur. Respir. J. 2015, 45, 525–537. [Google Scholar] [CrossRef] [PubMed]
- Cazzola, M.; Matera, M.G. Bronchodilators: Current and future. Clin. Chest Med. 2014, 35, 191–201. [Google Scholar] [CrossRef] [PubMed]
- Anwar, M.M.; El-Haggar, R.S.; Zaghary, W.A. Salmeterol Xinafoate. In Profiles of Drug Substances, Excipients and Related Methodolog, 1st ed.; Academic Press: Cambridge, MA, USA, 2015; Volume 40, pp. 321–369. [Google Scholar] [CrossRef]
- Markham, A.; Jarvis, B. Inhaled Salmeterol/Fluticasone Propionate Combination. Drugs 2000, 60, 1207–1233. [Google Scholar] [CrossRef] [PubMed]
- Nazir, S.A.; Erbland, M.L. Chronic Obstructive Pulmonary Disease—An Update on Diagnosis and Management Issues in Older Adults. Drugs Aging 2009, 26, 813–831. [Google Scholar] [CrossRef] [PubMed]
- Tong, H.H.Y.; Shekunov, B.Y.; York, P.; Chow, A.H.L. Characterization of two polymorphs of salmeterol xinafoate crystallized from supercritical fluids. Pharm. Res. 2001, 18, 852–858. [Google Scholar] [CrossRef]
- McKeage, K.; Keam, S.J. Salmeterol/Fluticasone Propionate. Drugs 2009, 69, 1799–1828. [Google Scholar] [CrossRef]
- Nelson, H.S.; Chapman, K.R.; Pyke, S.D.; Johnson, M.; Pritchard, J.N. Enhanced synergy between fluticasone propionate and salmeterol inhaled from a single inhaler versus separate inhalers. J. Allergy Clin. Immunol. 2003, 112, 29–36. [Google Scholar] [CrossRef]
- Liang, Z.; Ni, R.; Zhou, J.; Mao, S. Recent advances in controlled pulmonary drug delivery. Drug Discov. Today 2015, 20, 380–389. [Google Scholar] [CrossRef]
- Rytting, E.; Nguyen, J.; Wang, X.; Kissel, T. Biodegradable polymeric nanocarriers for pulmonary drug delivery. Expert Opin. Drug Deliv. 2008, 5, 629–639. [Google Scholar] [CrossRef]
- Islam, N.; Ferro, V. Recent advances in chitosan-based nanoparticulate pulmonary drug delivery. Nanoscale 2016, 8, 14341–14358. [Google Scholar] [CrossRef] [PubMed]
- Murnane, D.; Martin, G.P.; Marriott, C. Dry Powder Formulations for Inhalation of Fluticasone Propionate and Salmeterol Xinafoate Microcrystals. J. Pharm. Sci. 2009, 98, 503–515. [Google Scholar] [CrossRef] [PubMed]
- Westmeier, R.; Steckel, H. Combination Particles Containing Salmeterol Xinafoate and Fluticasone Propionate: Formulation and Aerodynamic Assessment. J. Pharm. Sci. 2008, 97, 2299–2310. [Google Scholar] [CrossRef] [PubMed]
- Kumar, A.; Vimal, A.; Kumar, A. Why Chitosan? From properties to perspective of mucosal drug delivery. Int. J. Biol. Macromol. 2016, 91, 615–622. [Google Scholar] [CrossRef]
- Li, J.; Cai, C.; Li, J.; Li, J.; Li, J.; Sun, T.; Wang, L.; Wu, H.; Yu, G. Chitosan-based nanomaterials for drug delivery. Molecules 2018, 23, 2661. [Google Scholar] [CrossRef]
- Motiei, M.; Kashanian, S.; Lucia, L.A.; Khazaei, M. Intrinsic parameters for the synthesis and tuned properties of amphiphilic chitosan drug delivery nanocarriers. J. Control. Release 2017, 260, 213–225. [Google Scholar] [CrossRef]
- Islam, N.; Dmour, I.; Taha, M.O. Degradability of chitosan micro/nanoparticles for pulmonary drug delivery. Heliyon 2019, 5, e01684. [Google Scholar] [CrossRef]
- Sajid, M.A.; Shahzad, S.A.; Hussain, F.; Skene, W.G.; Khan, Z.A.; Yar, M. Synthetic modifications of chitin and chitosan as multipurpose biopolymers: A review. Synth. Commun. 2018, 48, 1893–1908. [Google Scholar] [CrossRef]
- Alves, N.M.; Mano, J.F. Chitosan derivatives obtained by chemical modifications for biomedical and environmental applications. Int. J. Biol. Macromol. 2008, 43, 401–414. [Google Scholar] [CrossRef]
- Siafaka, P.I.; Titopoulou, A.; Koukaras, E.N.; Kostoglou, M.; Koutris, E.; Karavas, E.; Bikiaris, D.N. Chitosan derivatives as effective nanocarriers for ocular release of timolol drug. Int. J. Pharm. 2015, 495, 249–264. [Google Scholar] [CrossRef]
- Tzereme, A.; Christodoulou, E.; Kyzas, G.Z.; Kostoglou, M.; Bikiaris, D.N.; Lambropoulou, D.A. Chitosan grafted adsorbents for diclofenac pharmaceutical compound removal from single-component aqueous solutions and mixtures. Polymers (Basel) 2019, 11, 497. [Google Scholar] [CrossRef] [PubMed]
- Upadhyaya, L.; Singh, J.; Agarwal, V.; Tewari, R.P. Biomedical applications of carboxymethyl chitosans. Carbohydr. Polym. 2013, 91, 452–466. [Google Scholar] [CrossRef] [PubMed]
- Kato, Y.; Onishi, H.; Machida, Y. N-succinyl-chitosan as a drug carrier: Water-insoluble and water-soluble conjugates. Biomaterials 2004, 25, 907–915. [Google Scholar] [CrossRef]
- Siafaka, P.I.; Zisi, A.P.; Exindari, M.K.; Karantas, I.D.; Bikiaris, D.N. Porous dressings of modified chitosan with poly(2-hydroxyethyl acrylate) for topical wound delivery of levofloxacin. Carbohydr. Polym. 2016, 143, 90–99. [Google Scholar] [CrossRef]
- Quiñones, J.P.; Peniche, H.; Peniche, C. Chitosan based self-assembled nanoparticles in drug delivery. Polymers 2018, 10, 235. [Google Scholar] [CrossRef] [PubMed]
- Trapani, A.; Di Gioia, S.; Ditaranto, N.; Cioffi, N.; Goycoolea, F.M.; Carbone, A.; Garcia-Fuentes, M.; Conese, M.; Alonso, M.J. Systemic heparin delivery by the pulmonary route using chitosan and glycol chitosan nanoparticles. Int. J. Pharm. 2013, 447, 115–123. [Google Scholar] [CrossRef]
- Al-Qadi, S.; Grenha, A.; Carrión-Recio, D.; Seijo, B.; Remuñán-López, C. Microencapsulated chitosan nanoparticles for pulmonary protein delivery: In vivo evaluation of insulin-loaded formulations. J. Control. Release 2012, 157, 383–390. [Google Scholar] [CrossRef]
- Koukaras, E.N.; Papadimitriou, S.A.; Bikiaris, D.N.; Froudakis, G.E. Insight on the formation of chitosan nanoparticles through ionotropic gelation with tripolyphosphate. Mol. Pharm. 2012, 9, 2856–2862. [Google Scholar] [CrossRef]
- Anitha, A.; Rani, V.V.D.; Krishna, R.; Sreeja, V.; Selvamurugan, N.; Nair, S.V.; Tamura, H.; Jayakumar, R. Synthesis, characterization, cytotoxicity and antibacterial studies of chitosan, O-carboxymethyl and N, O-carboxymethyl chitosan nanoparticles. Carbohydr. Polym. 2009, 78, 672–677. [Google Scholar] [CrossRef]
- Dash, M.; Chiellini, F.; Ottenbrite, R.M.; Chiellini, E. Chitosan—A versatile semi-synthetic polymer in biomedical applications. Prog. Polym. Sci. 2011, 36, 981–1014. [Google Scholar] [CrossRef]
- Mourya, V.K.; Inamdar, N.N. Chitosan-modifications and applications: Opportunities galore. React. Funct. Polym. 2008, 68, 1013–1051. [Google Scholar] [CrossRef]
- Kumirska, J.; Czerwicka, M.; Kaczyński, Z.; Bychowska, A.; Brzozowski, K.; Thöming, J.; Stepnowski, P. Application of spectroscopic methods for structural analysis of chitin and chitosan. Mar. Drugs 2010, 8, 1567–1636. [Google Scholar] [CrossRef] [PubMed]
- Michailidou, G.; Christodoulou, E.; Nanaki, S.; Barmpalexis, P.; Karavas, E.; Vergkizi-Nikolakaki, S.; Bikiaris, D.N. Super-hydrophilic and high strength polymeric foam dressings of modified chitosan blends for topical wound delivery of chloramphenicol. Carbohydr. Polym. 2019, 208, 1–13. [Google Scholar] [CrossRef] [PubMed]
- Wei, L.; Chen, Y.; Tan, W.; Li, Q.; Gu, G.; Dong, F.; Guo, Z. Synthesis, Characterization, and Antifungal Activity of Pyridine-Based Triple Quaternized Chitosan Derivatives. Molecules 2018, 23, 2604. [Google Scholar] [CrossRef] [PubMed]
- Kyzas, G.Z.; Bikiaris, D.N.; Seredych, M.; Bandosz, T.J.; Deliyanni, E.A. Removal of dorzolamide from biomedical wastewaters with adsorption onto graphite oxide/poly(acrylic acid) grafted chitosan nanocomposite. Bioresour. Technol. 2014, 152, 399–406. [Google Scholar] [CrossRef]
- Golyshev, A.A.; Moskalenko, Y.E.; Skorik, Y.A. Comparison of the acylation of chitosan with succinic anhydride in aqueous suspension and in solution. Russ. Chem. Bull. 2015, 64, 1168–1171. [Google Scholar] [CrossRef]
- Mun, G.A.; Nurkeeva, Z.S.; Dergunov, S.A.; Nam, I.K.; Maimakov, T.P.; Shaikhutdinov, E.M.; Lee, S.C.; Park, K. Studies on graft copolymerization of 2-hydroxyethyl acrylate onto chitosan. React. Funct. Polym. 2008, 68, 389–395. [Google Scholar] [CrossRef]
- Witono, J.R.; Marsman, J.H.; Noordergraaf, I.W.; Heeres, H.J.; Janssen, L.P.B.M. Improved homopolymer separation to enable the application of 1H NMR and HPLC for the determination of the reaction parameters of the graft copolymerization of acrylic acid onto starch. Carbohydr. Res. 2013, 370, 38–45. [Google Scholar] [CrossRef]
- Kumar, D.; Pandey, J.; Kumar, P. Synthesis and characterization of modified chitosan via microwave route for novel antibacterial application. Int. J. Biol. Macromol. 2018, 107, 1388–1394. [Google Scholar] [CrossRef]
- Corazzari, I.; Nisticò, R.; Turci, F.; Faga, M.G.; Franzoso, F.; Tabasso, S.; Magnacca, G. Advanced physico-chemical characterization of chitosan by means of TGA coupled on-line with FTIR and GCMS: Thermal degradation and water adsorption capacity. Polym. Degrad. Stab. 2015, 112, 1–9. [Google Scholar] [CrossRef]
- Ge, H.; Wang, S. Thermal preparation of chitosan-acrylic acid superabsorbent: Optimization, characteristic and water absorbency. Carbohydr. Polym. 2014, 113, 296–303. [Google Scholar] [CrossRef]
- Metzler, M.; Chylińska, M.; Kaczmarek, H. Preparation and characteristics of nanosilver composite based on chitosan-graft-acrylic acid copolymer. J. Polym. Res. 2015, 22, 1–10. [Google Scholar] [CrossRef]
- Peppas, N.A.; Bures, P.; Leobandung, W.; Ichikawa, H. Hydrogels in pharmaceutical formulations. Eur. J. Pharm. Biopharm. 2000, 50, 27–46. [Google Scholar] [CrossRef]
- Gupta, K.C.; Jabrail, F.H. Glutaraldehyde cross-linked chitosan microspheres for controlled release of centchroman. Carbohydr. Res. 2007, 342, 2244–2252. [Google Scholar] [CrossRef]
- Michailidou, G.; Ainali, N.M.; Xanthopoulou, E.; Nanaki, S.; Kostoglou, M.; Koukaras, E.N.; Bikiaris, D.N. Effect of Poly(vinyl alcohol) on Nanoencapsulation of Budesonide in Chitosan Nanoparticles via Ionic Gelation and Its Improved Bioavailability. Polymers 2020, 12, 1101. [Google Scholar] [CrossRef] [PubMed]
- Lazaridou, M.; Christodoulou, E.; Nerantzaki, M.; Kostoglou, M.; Lambropoulou, D.A.; Katsarou, A.; Pantopoulos, K.; Bikiaris, D.N. Formulation and in-vitro characterization of chitosan-nanoparticles loaded with the iron chelator deferoxamine mesylate (DFO). Pharmaceutics 2020, 12, 238. [Google Scholar] [CrossRef] [PubMed]
- Nanaki, S.; Tseklima, M.; Christodoulou, E.; Triantafyllidis, K.; Kostoglou, M.; Bikiaris, D.N. Thiolated chitosan masked polymeric microspheres with incorporated mesocellular silica foam (MCF) for intranasal delivery of paliperidone. Polymers 2017, 9, 617. [Google Scholar] [CrossRef]
- Gagnadoux, F.; Hureaux, J.; Vecellio, L.; Urban, T.; Le Pape, A.; Valo, I.; Montharu, J.; Leblond, V.; Boisdron-Celle, M.; Lerondel, S.; et al. Aerosolized chemotherapy. J. Aerosol Med. Pulm. Drug Deliv. 2008, 21, 61–70. [Google Scholar] [CrossRef]
- Zhang, L.; Hu, Y. Alphastatin-Loaded Chitosan Nanoparticle Preparation and Its Antiangiogenic Effect on Lung Carcinoma. Int. J. Polym. Sci. 2019, 2019, 2751384. [Google Scholar] [CrossRef]
- Agnihotri, S.A.; Mallikarjuna, N.N.; Aminabhavi, T.M. Recent advances on chitosan-based micro- and nanoparticles in drug delivery. J. Control. Release 2004, 100, 5–28. [Google Scholar] [CrossRef]
- Hu, Y.; Jiang, X.; Ding, Y.; Ge, H.; Yuan, Y.; Yang, C. Synthesis and characterization of Chitosan-poly(acrylic acid) nanoparticles. Biomaterials 2002, 23, 3193–3201. [Google Scholar] [CrossRef]
- Bhattacharjee, S. Review article DLS and zeta potential—What they are and what they are not? J. Control. Release 2016, 235, 337–351. [Google Scholar] [CrossRef] [PubMed]
- Abouelhag, H.A.; Sivakumar, S.M.; Bagul, U.S.; Eltyep, E.M.; Safhi, M.M. Preparation and Physical Characterization of Cisplatin Chitosan Nanoparticles by Zeta Nanosizer “Prime Step for Formulation and Development”. Int. J. Pharm. Sci. Res. 2017, 8, 4245–4249. [Google Scholar] [CrossRef]
- Amore, E.; Manca, M.L.; Ferraro, M.; Valenti, D.; La Parola, V.; Di Vincenzo, S.; Gjomarkaj, M.; Giammona, G.; Bondì, M.L.; Pace, E. Salmeterol Xinafoate (SX) loaded into mucoadhesive solid lipid microparticles for COPD treatment. Int. J. Pharm. 2019, 562, 351–358. [Google Scholar] [CrossRef]
- Craparo, E.F.; Ferraro, M.; Pace, E.; Bondì, M.L.; Giammona, G.; Cavallaro, G. Polyaspartamide-based nanoparticles loaded with fluticasone propionate and the in vitro evaluation towards cigarette smoke effects. Nanomaterials 2017, 7, 222. [Google Scholar] [CrossRef]
- Agarwal, M.; Agarwal, M.K.; Shrivastav, N.; Pandey, S.; Das, R.; Gaur, P. Preparation of Chitosan Nanoparticles and their In-vitro Characterization. Int. J. Life-Sci. Sci. Res. 2018, 4, 1713–1720. [Google Scholar] [CrossRef]
- Jana, S.; Trivedi, M.K.; Tallapragada, R.M.; Jana, S.; Trivedi, M.K.; Tallapragada, R.M.; Branton, A.; Acta, A. Characterization of Physicochemical and Thermal Properties of Chitosan And Sodium Alginate after Biofield Treatment To cite this version: HAL Id: Hal-01450066 Pharmaceutica Characterization of Physicochemical and Thermal Properties of Chitosan and Sodiu. Pharm. Anal 2017, 6. [Google Scholar] [CrossRef]
- Ong, S.G.M.; Ming, L.C.; Lee, K.S.; Yuen, K.H. Influence of the encapsulation efficiency and size of liposome on the oral bioavailability of griseofulvin-loaded liposomes. Pharmaceutics 2016, 8, 25. [Google Scholar] [CrossRef]
- Rahmati, M.R.; Vatanara, A.; Parsian, A.R.; Gilani, K.; Khosravi, K.M.; Darabi, M.; Najafabadi, A.R. Effect of formulation ingredients on the physical characteristics of salmeterol xinafoate microparticles tailored by spray freeze drying. Adv. Powder Technol. 2013, 24, 36–42. [Google Scholar] [CrossRef]
- Kanaze, F.I.; Kokkalou, E.; Niopas, I.; Georgarakis, M.; Stergiou, A.; Bikiaris, D. Dissolution enhancement of flavonoids by solid dispersion in PVP and PEG matrixes: A comparative study. J. Appl. Polym. Sci. 2006, 102, 460–471. [Google Scholar] [CrossRef]
- Papageorgiou, G.Z.; Bikiaris, D.; Kanaze, F.I.; Karavas, E.; Stergiou, A.; Georgarakis, E. Tailoring the release rates of fluconazole using solid dispersions in polymer blends. Drug Dev. Ind. Pharm. 2008, 34, 336–346. [Google Scholar] [CrossRef] [PubMed]
- Karavas, E.; Georgarakis, E.; Sigalas, M.P.; Avgoustakis, K.; Bikiaris, D. Investigation of the release mechanism of a sparingly water-soluble drug from solid dispersions in hydrophilic carriers based on physical state of drug, particle size distribution and drug-polymer interactions. Eur. J. Pharm. Biopharm. 2007, 66, 334–347. [Google Scholar] [CrossRef] [PubMed]
- Sriamornsak, P.; Thirawong, N.; Weerapol, Y.; Nunthanid, J.; Sungthongjeen, S. Swelling and erosion of pectin matrix tablets and their impact on drug release behavior. Eur. J. Pharm. Biopharm. 2007, 67, 211–219. [Google Scholar] [CrossRef] [PubMed]
- Skorik, Y.A.; Kritchenkov, A.S.; Moskalenko, Y.E.; Golyshev, A.A.; Raik, S.V.; Whaley, A.K.; Vasina, L.V.; Sonin, D.L. Synthesis of N-succinyl- and N-glutaryl-chitosan derivatives and their antioxidant, antiplatelet, and anticoagulant activity. Carbohydr. Polym. 2017, 166, 166–172. [Google Scholar] [CrossRef]
- Siafaka, P.I.; Üstündağ Okur, N.; Karavas, E.; Bikiaris, D.N. Surface modified multifunctional and stimuli responsive nanoparticles for drug targeting: Current status and uses. Int. J. Mol. Sci. 2016, 17, 1440. [Google Scholar] [CrossRef]
- Koutroumanis, K.P.; Avgoustakis, K.; Bikiaris, D. Synthesis of cross-linked N-(2-carboxybenzyl)chitosan pH sensitive polyelectrolyte and its use for drug controlled delivery. Carbohydr. Polym. 2010, 82, 181–188. [Google Scholar] [CrossRef]
- Wang, C.C.; Chen, C.C. Anti-bacterial and swelling properties of acrylic acid grafted and collagen/chitosan immobilized polypropylene non-woven fabrics. J. Appl. Polym. Sci. 2005, 98, 391–400. [Google Scholar] [CrossRef]
- Jetzer, M.W.; Schneider, M.; Morrical, B.D.; Imanidis, G. Investigations on the Mechanism of Magnesium Stearate to Modify Aerosol Performance in Dry Powder Inhaled Formulations. J. Pharm. Sci. 2018, 107, 984–998. [Google Scholar] [CrossRef]


| CS/TPP w/w Ratio | Particles Diameter (nm) | ||||
|---|---|---|---|---|---|
| CS | CS-tAcon | CS-Succ | CS-g-PHEA | CS-g-PAA | |
| 2/1 | 292 | 904 | 505 | 272 | 566 |
| 3/1 | 364 | 237 | 276 | 276 | 640 |
| 4/1 | 450 | 423 | 392 | 297 | 550 |
| 5/1 | 427 | 389 | 518 | 381 | 584 |
| 6/1 | 359 | 597 | 503 | 833 | 972 |
| 7/1 | 304 | 957 | 491 | 560 | 829 |
| Sample | Z-Average (d.nm) | Zeta Potential (mV) |
|---|---|---|
| CS-TPP-10% FLU/SX | 1234 | +51.9 |
| CS-TPP-20% FLU/SX | 1247 | +47.8 |
| CS-TPP-30% FLU/SX | 1923 | +45.7 |
| CS-tAcon-TPP-10% FLU/SX | 1210 | +21.0 |
| CS-tAcon-TPP-20% FLU/SX | 1400 | +21.4 |
| CS-tAcon-TPP-30% FLU/SX | 1943 | +21.5 |
| CS-Succ-TPP-10% FLU/SX | 1451 | +38.0 |
| CS-Succ-TPP-20% FLU/SX | 1507 | +38.5 |
| CS-Succ-TPP-30% FLU/SX | 1708 | +38.8 |
| CS-g-PHEA-TPP-10% FLU/SX | 754 | +26.7 |
| CS-g-PHEA-TPP-20% FLU/SX | 1005 | +22.6 |
| CS-g-PHEA-TPP-30% FLU/SX | 2216 | +26.6 |
| CS-g-PAA-TPP-10% FLU/SX | 481 | +34.3 |
| CS-g-PAA-TPP-20% FLU/SX | 438 | +41.6 |
| CS-g-PAA-TPP-30% FLU/SX | 784 | +39.4 |
| Sample | Yield (%) | Drug Loading (%) | EE (%) | |
|---|---|---|---|---|
| Salmeterol Xinafoate | Fluticasone Propionate | |||
| CS-TPP-10% FLU/SX | 30.25 | 2.1 | 4.8 | 38.2 |
| CS-TPP-20% FLU/SX | 40.25 | 4.9 | 11.2 | 20.5 |
| CS-TPP-30% FLU/SX | 38.22 | 6.4 | 14.8 | 19.8 |
| CS-tAcon-TPP-10% FLU/SX | 34.23 | 1.68 | 12.01 | 55.47 |
| CS-tAcon-TPP-20% FLU/SX | 49.87 | 6.09 | 12.71 | 50.15 |
| CS-tAcon-TPP-30% FLU/SX | 50.21 | 7.56 | 11.79 | 47.8 |
| CS-Succ-TPP-10% FLU/SX | 29.12 | 4.77 | 13.44 | 17.1 |
| CS-Succ-TPP-20% FLU/SX | 35.12 | 6.29 | 19.8 | 11.25 |
| CS-Succ-TPP-30% FLU/SX | 42.54 | 5.08 | 25.2 | 11.13 |
| CS-g-PHEA-TPP-10% FLU/SX | 31.29 | 5.45 | 3.04 | 24.4 |
| CS-g-PHEA-TPP-20% FLU/SX | 39.75 | 8.6 | 10.28 | 19.5 |
| CS-g-PHEA-TPP-30% FLU/SX | 48.72 | 10.38 | 15.05 | 18.14 |
| CS-g-PAA-TPP-10% FLU/SX | 30.58 | 5.52 | 5.02 | 17.3 |
| CS-g-PAA-TPP-20% FLU/SX | 30.9 | 9.07 | 11.83 | 12.5 |
| CS-g-PAA-TPP-30% FLU/SX | 31.63 | 11.18 | 14.48 | 12.3 |
© 2020 by the authors. Licensee MDPI, Basel, Switzerland. This article is an open access article distributed under the terms and conditions of the Creative Commons Attribution (CC BY) license (http://creativecommons.org/licenses/by/4.0/).
Share and Cite
Ainali, N.M.; Xanthopoulou, E.; Michailidou, G.; Zamboulis, A.; Bikiaris, D.N. Microencapsulation of Fluticasone Propionate and Salmeterol Xinafoate in Modified Chitosan Microparticles for Release Optimization. Molecules 2020, 25, 3888. https://doi.org/10.3390/molecules25173888
Ainali NM, Xanthopoulou E, Michailidou G, Zamboulis A, Bikiaris DN. Microencapsulation of Fluticasone Propionate and Salmeterol Xinafoate in Modified Chitosan Microparticles for Release Optimization. Molecules. 2020; 25(17):3888. https://doi.org/10.3390/molecules25173888
Chicago/Turabian StyleAinali, Nina Maria, Eleftheria Xanthopoulou, Georgia Michailidou, Alexandra Zamboulis, and Dimitrios N. Bikiaris. 2020. "Microencapsulation of Fluticasone Propionate and Salmeterol Xinafoate in Modified Chitosan Microparticles for Release Optimization" Molecules 25, no. 17: 3888. https://doi.org/10.3390/molecules25173888
APA StyleAinali, N. M., Xanthopoulou, E., Michailidou, G., Zamboulis, A., & Bikiaris, D. N. (2020). Microencapsulation of Fluticasone Propionate and Salmeterol Xinafoate in Modified Chitosan Microparticles for Release Optimization. Molecules, 25(17), 3888. https://doi.org/10.3390/molecules25173888