
A Novel Hybrid Model Based on a Feedforward Neural Network and One Step Secant Algorithm for Prediction of Load-Bearing Capacity of Rectangular Concrete-Filled Steel Tube Columns

 ,
,  , ,
, ,  and
and 
Abstract
1. Introduction
2. Material and Methods
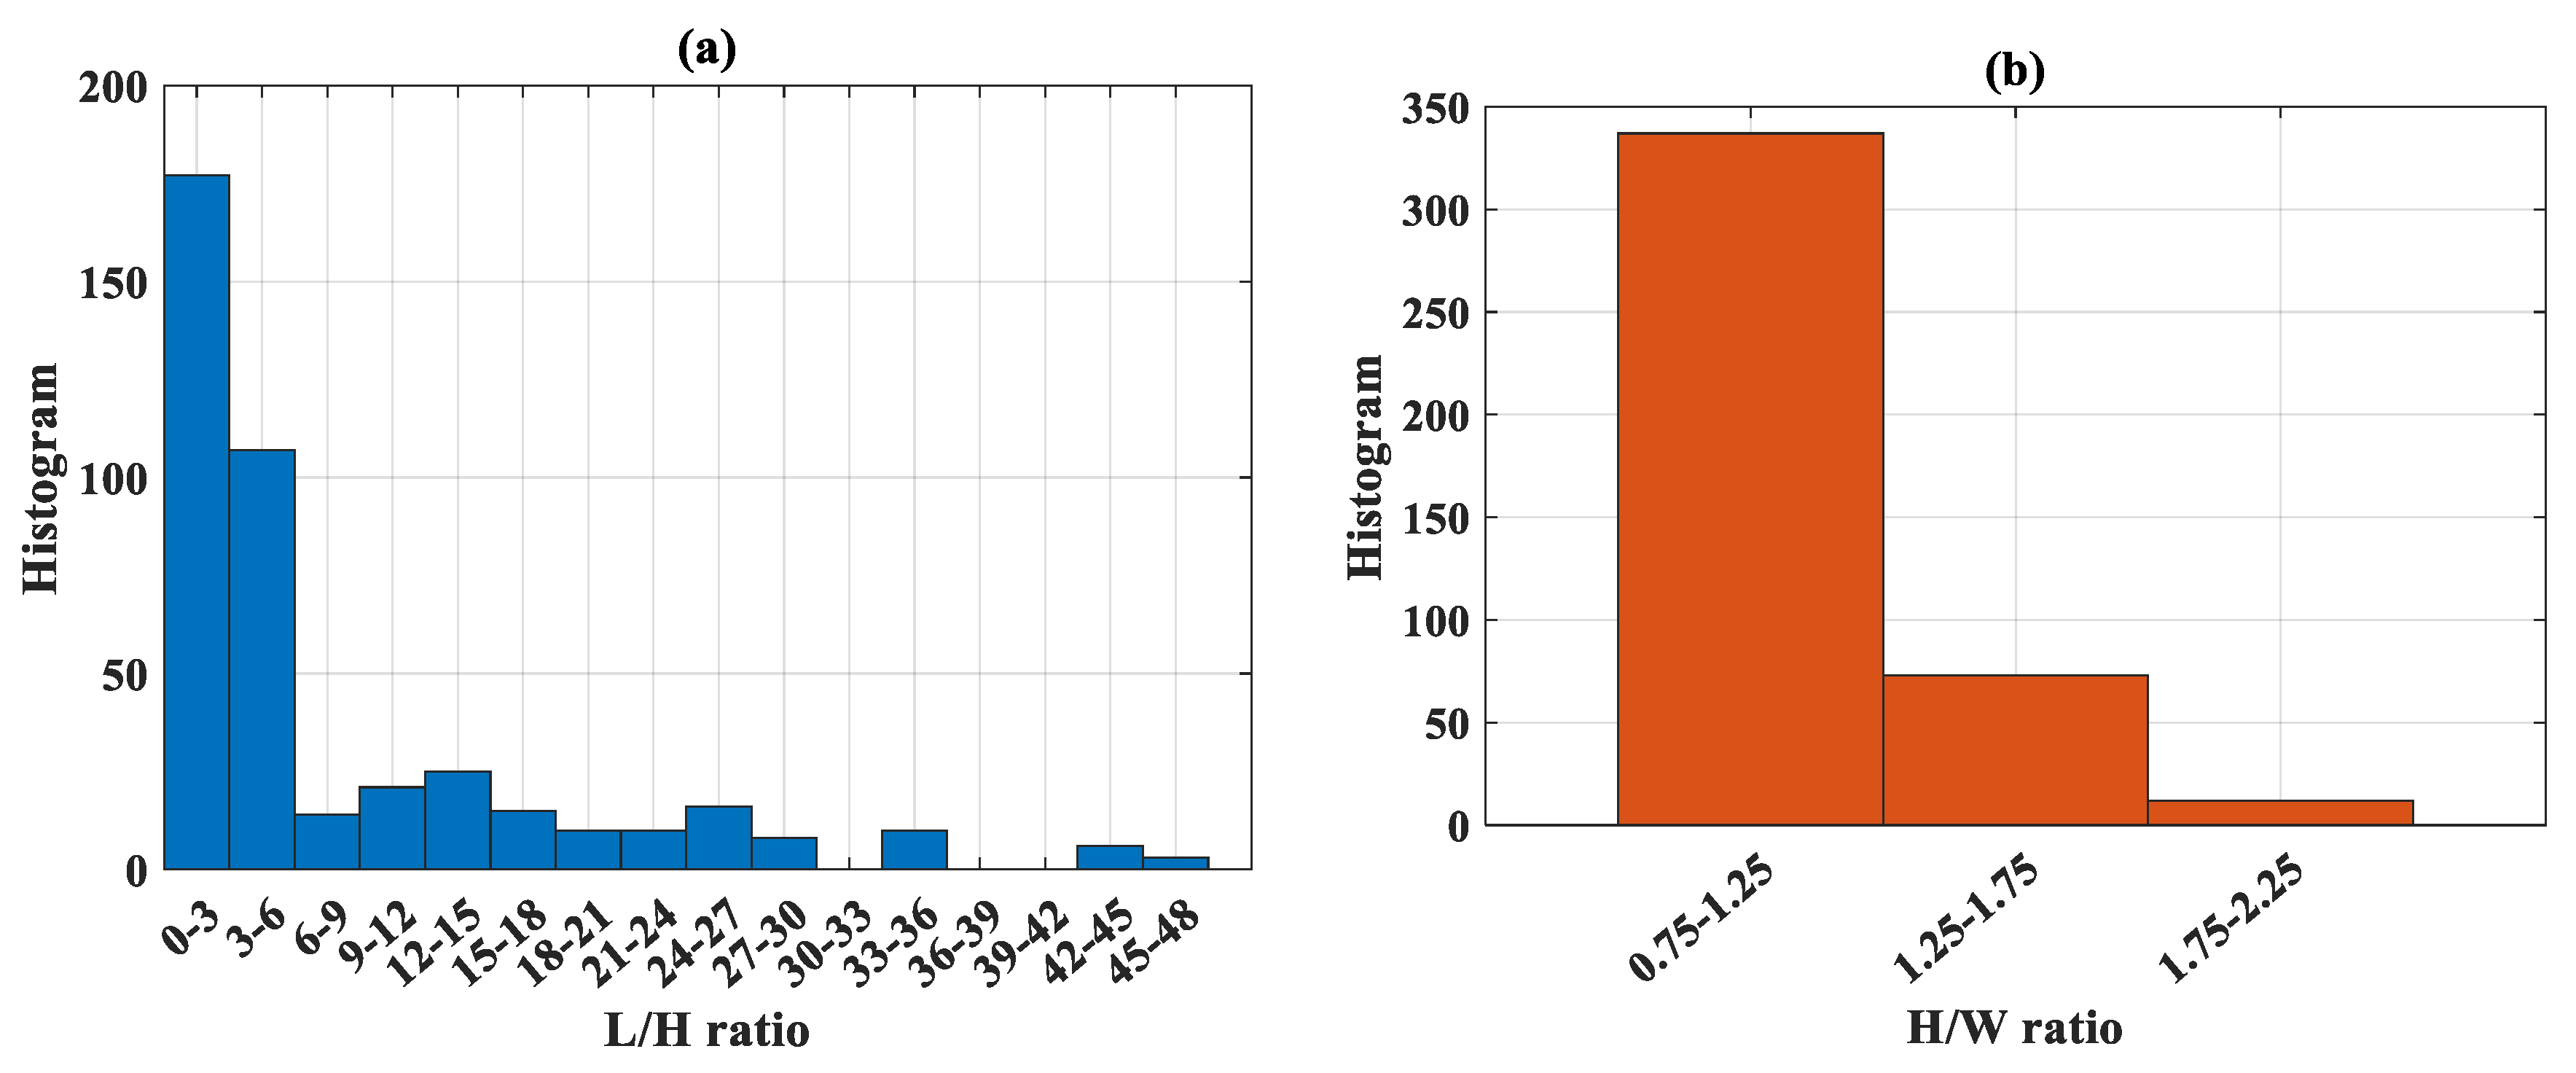
2.1. Database Construction
- Only monotonic uniaxial test was collected;
- The samples were fully loaded (both steel and concrete);
- Steel reinforcement, shear stub and tab stiffeners were not included in the samples.
2.2. Methods Used
2.2.1. Feedforward Neural Network (FNN)
2.2.2. One Step Secant Method (OSS)
Quasi-Newton Method
One Step Secant Algorithm
2.2.3. Prediction Performance Assessment
3. Results
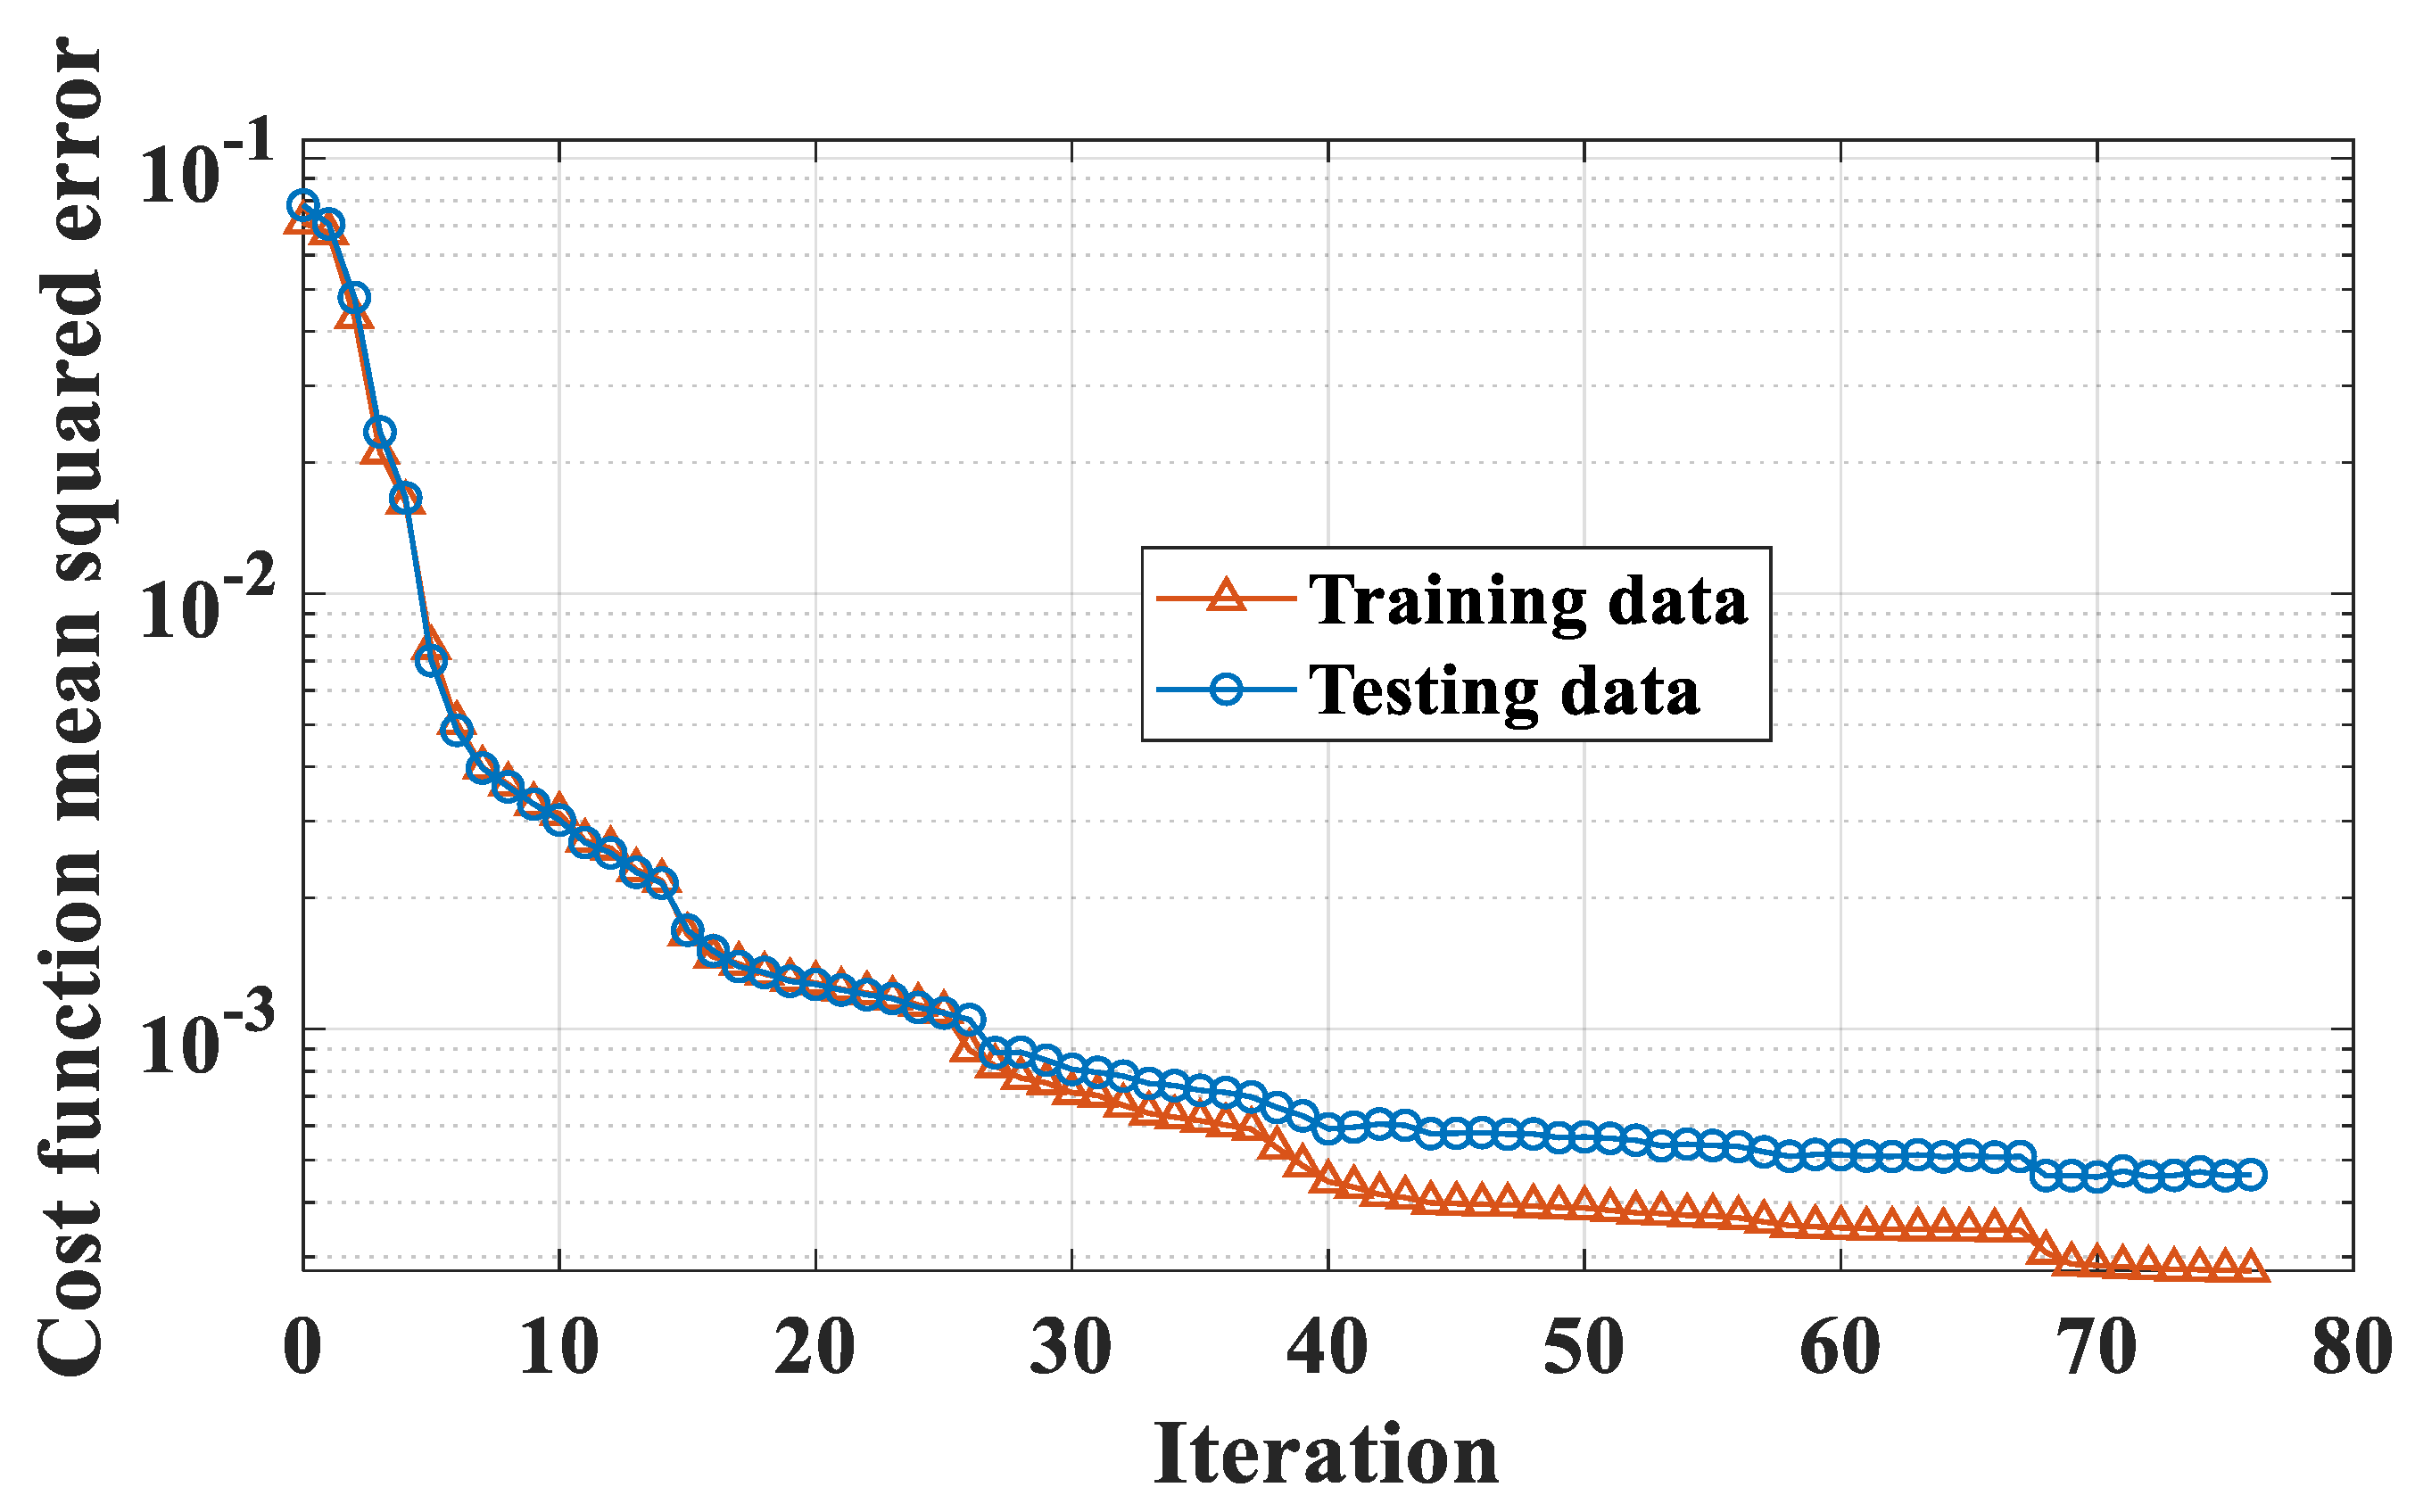
3.1. Optimization of FNN-OSS Model
3.2. Prediction Capability Assessment
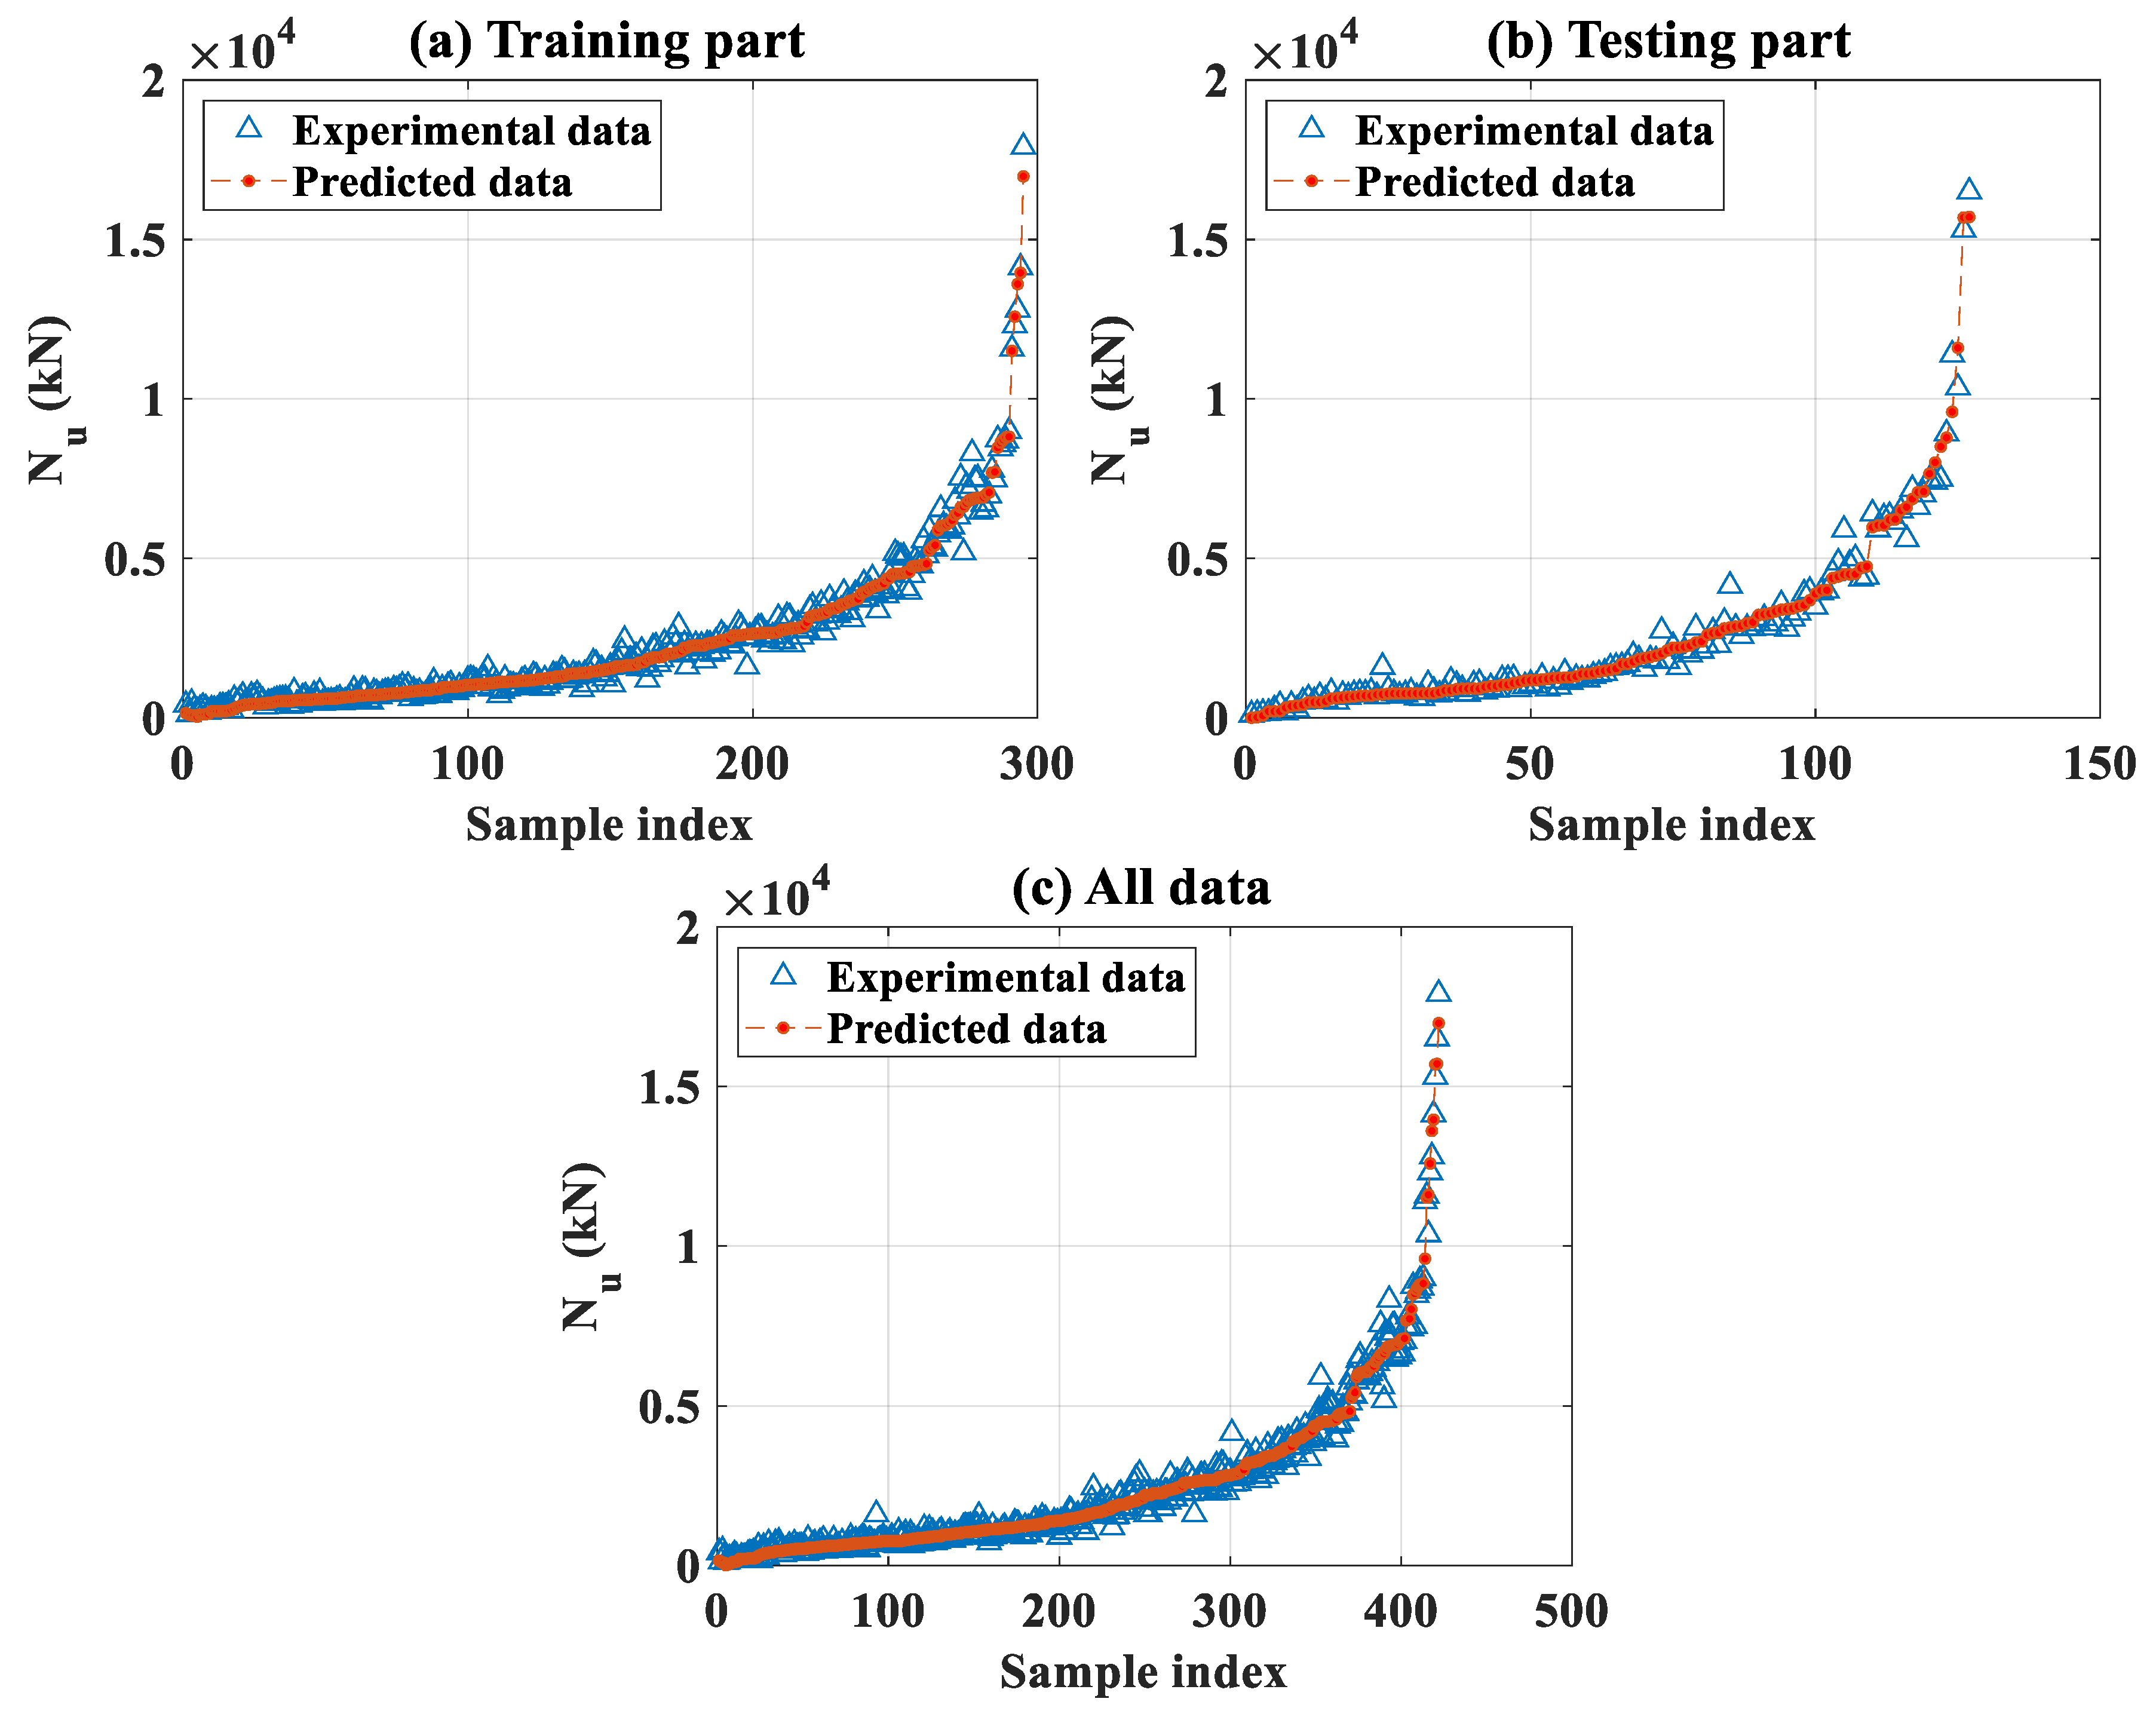
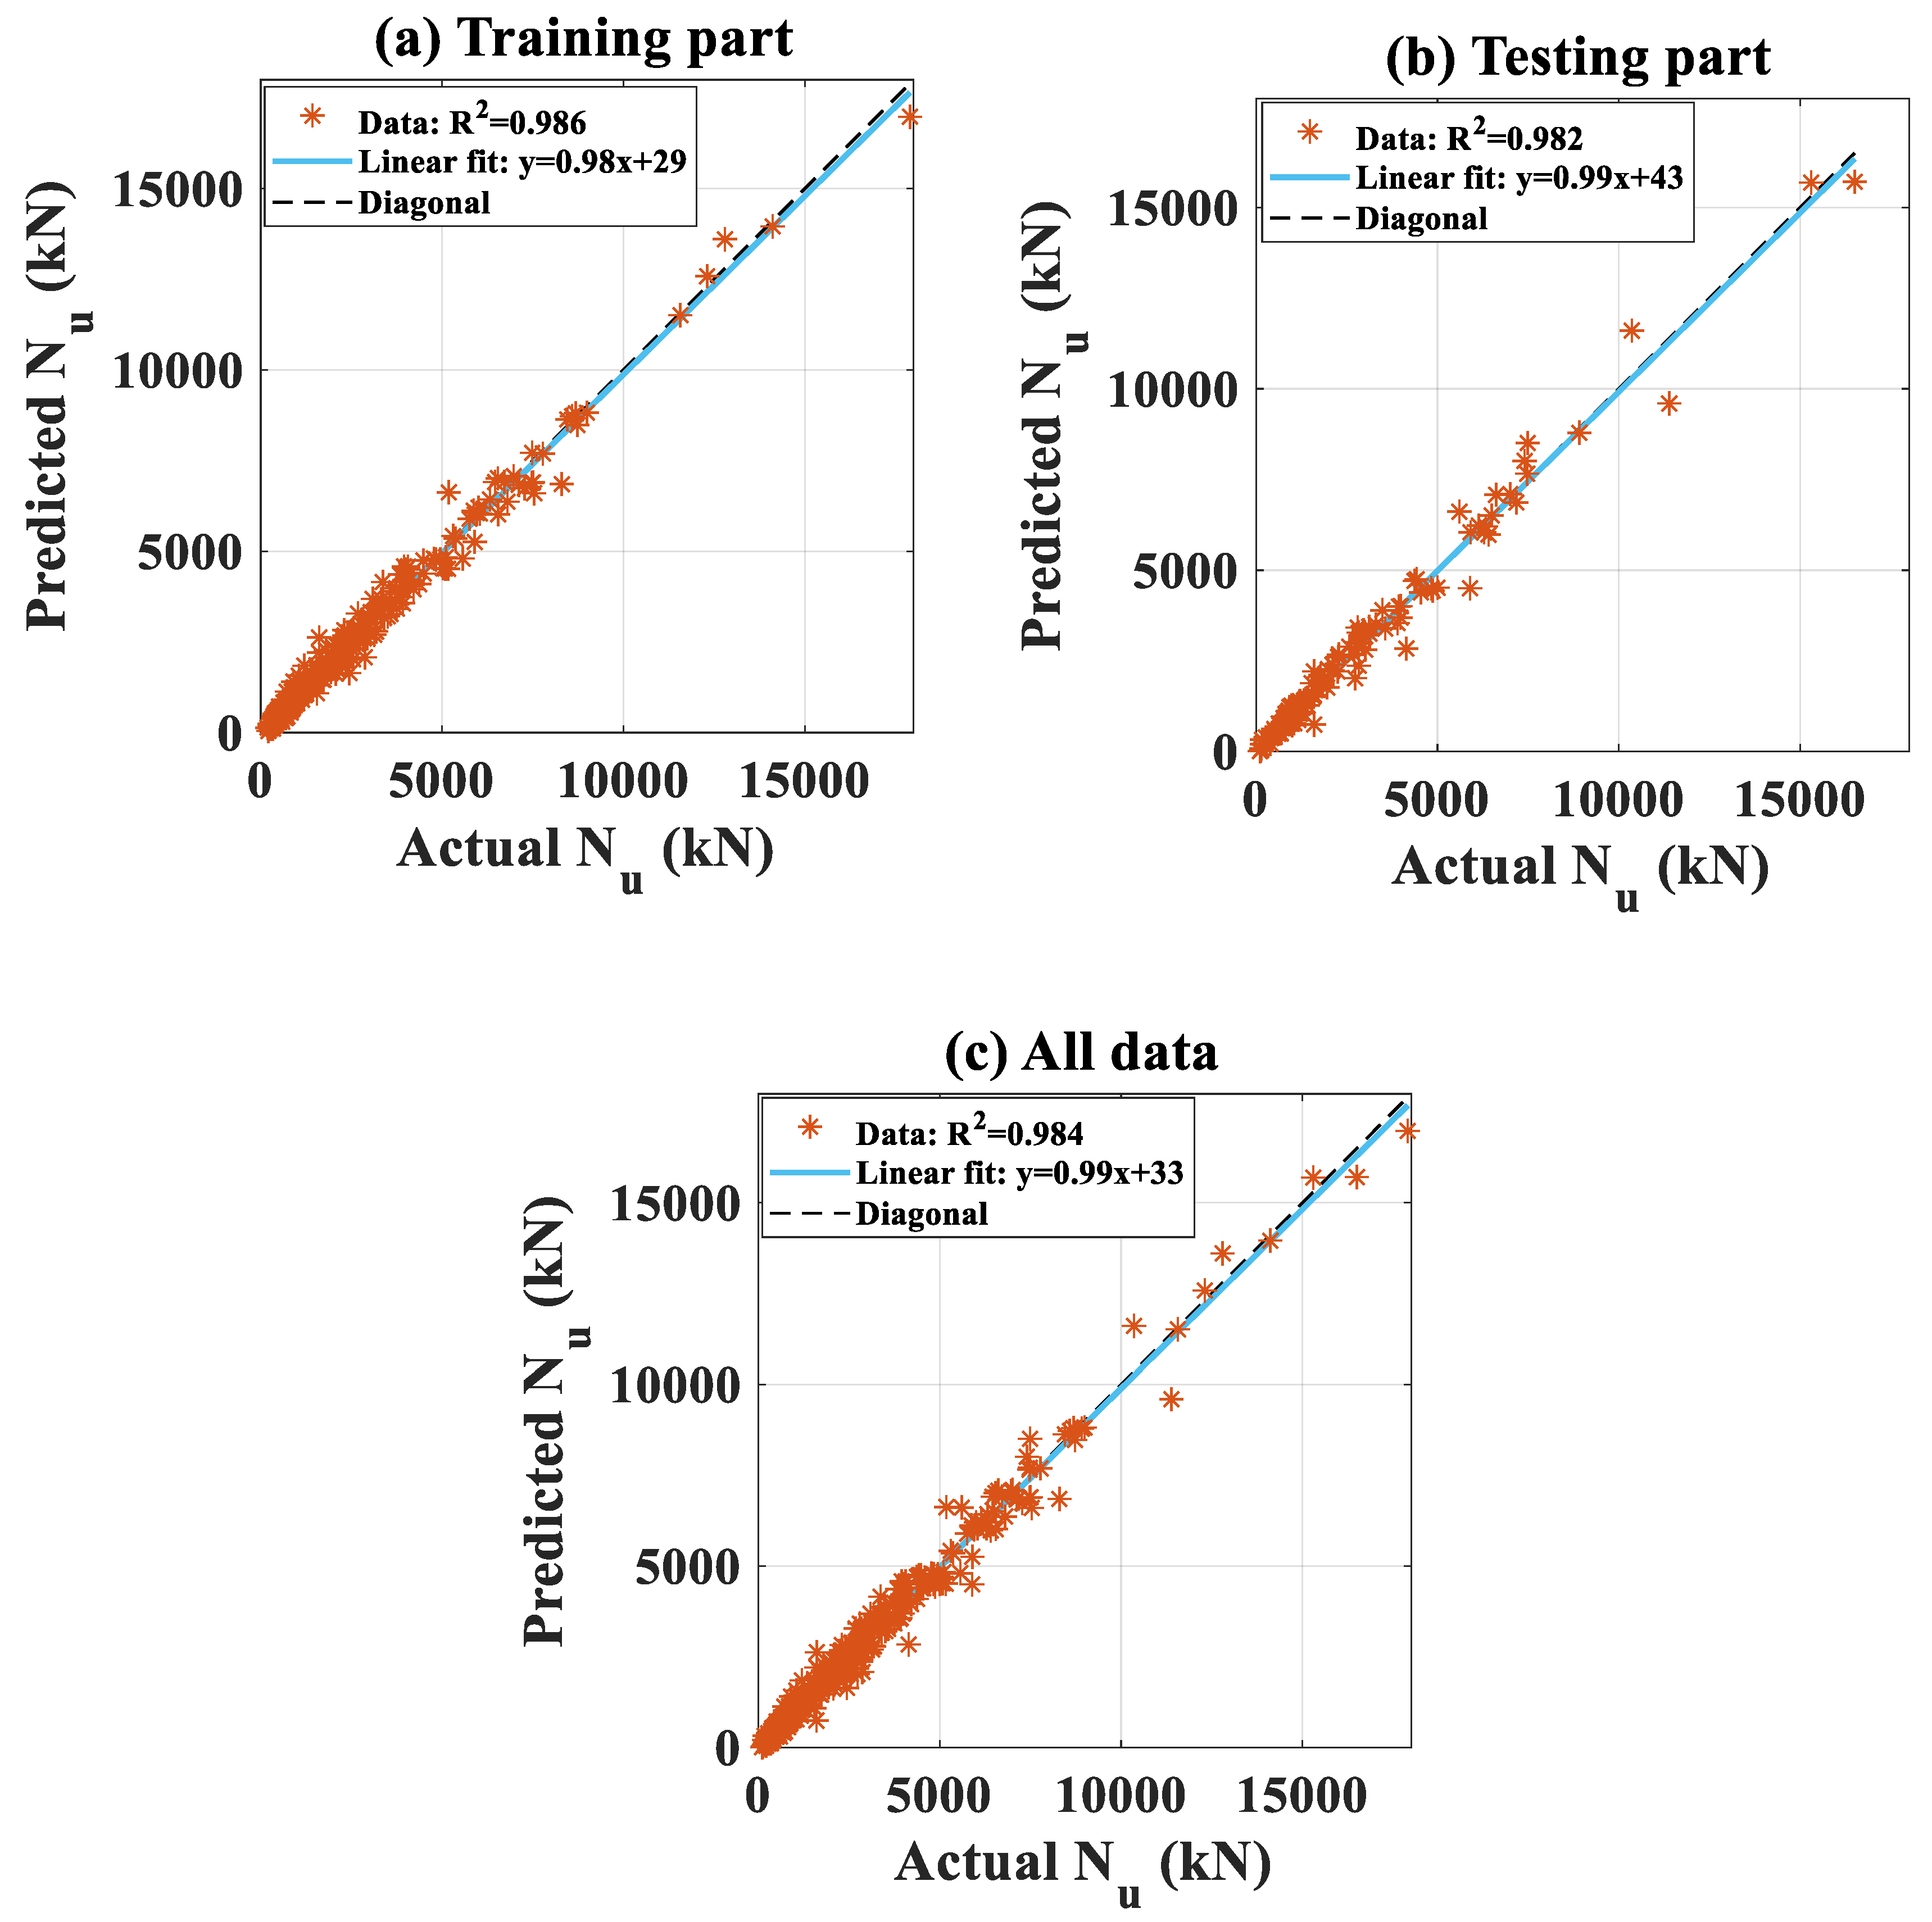
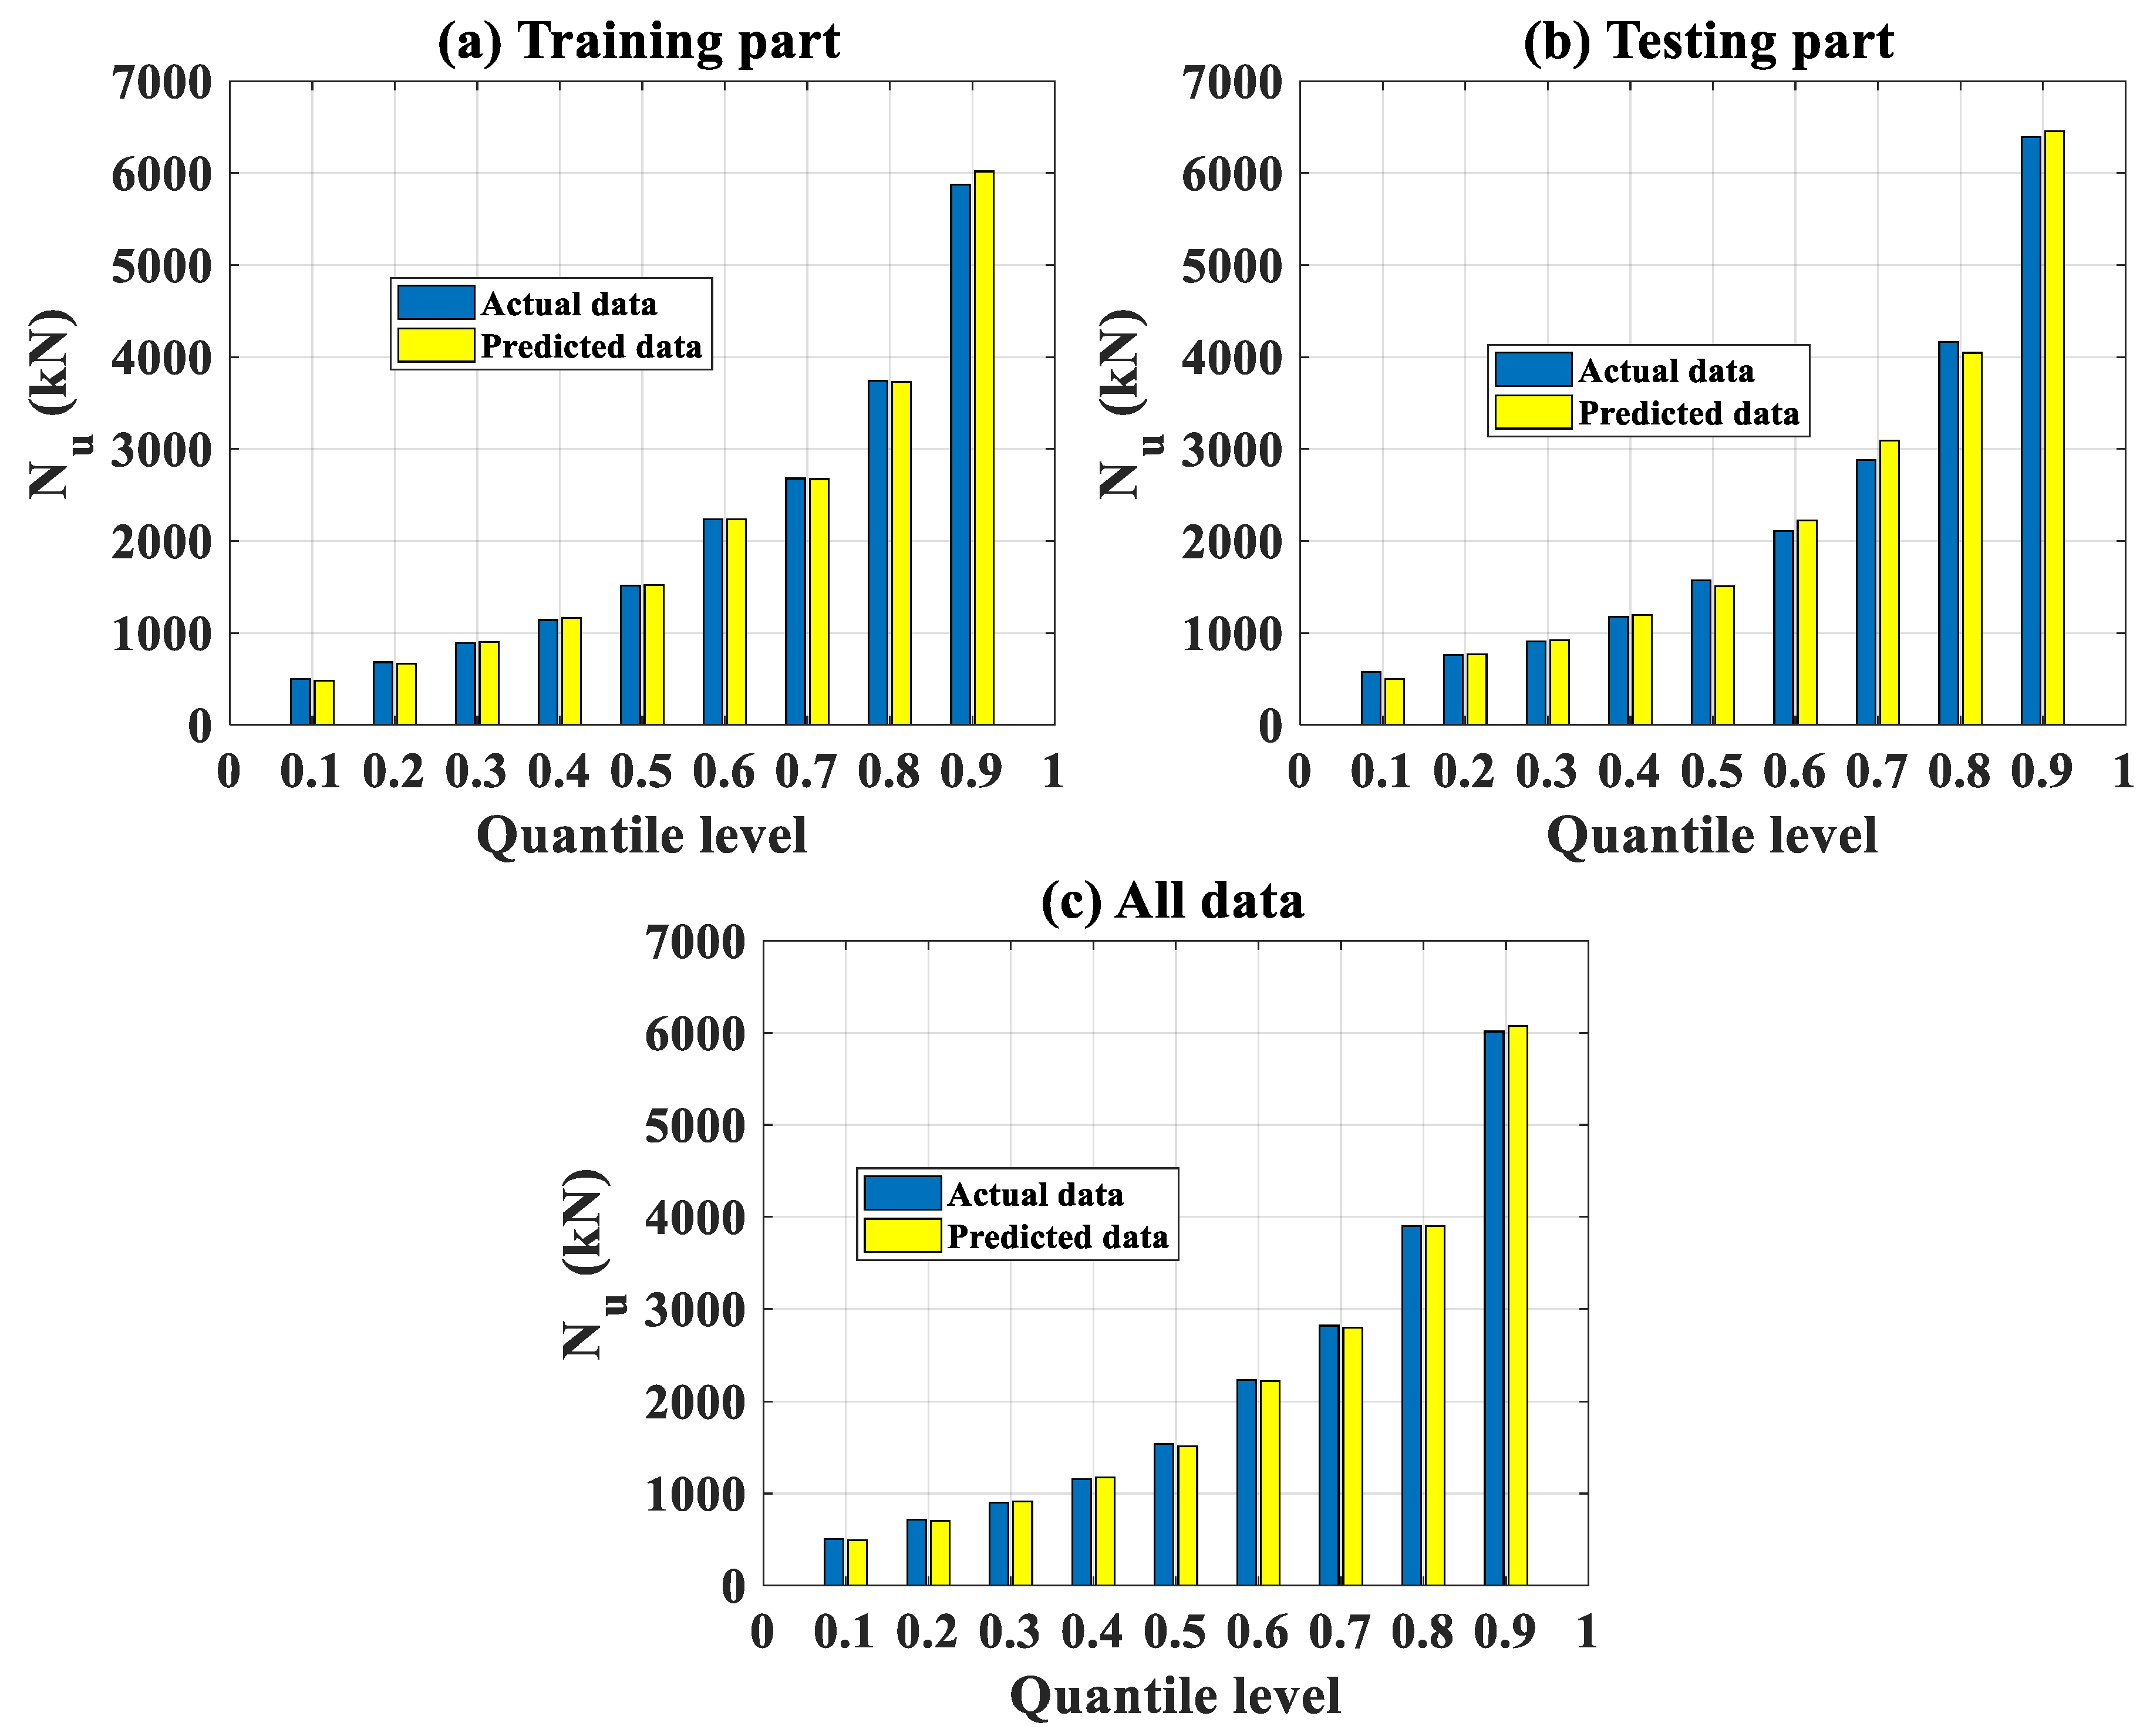
3.2.1. Global Analysis
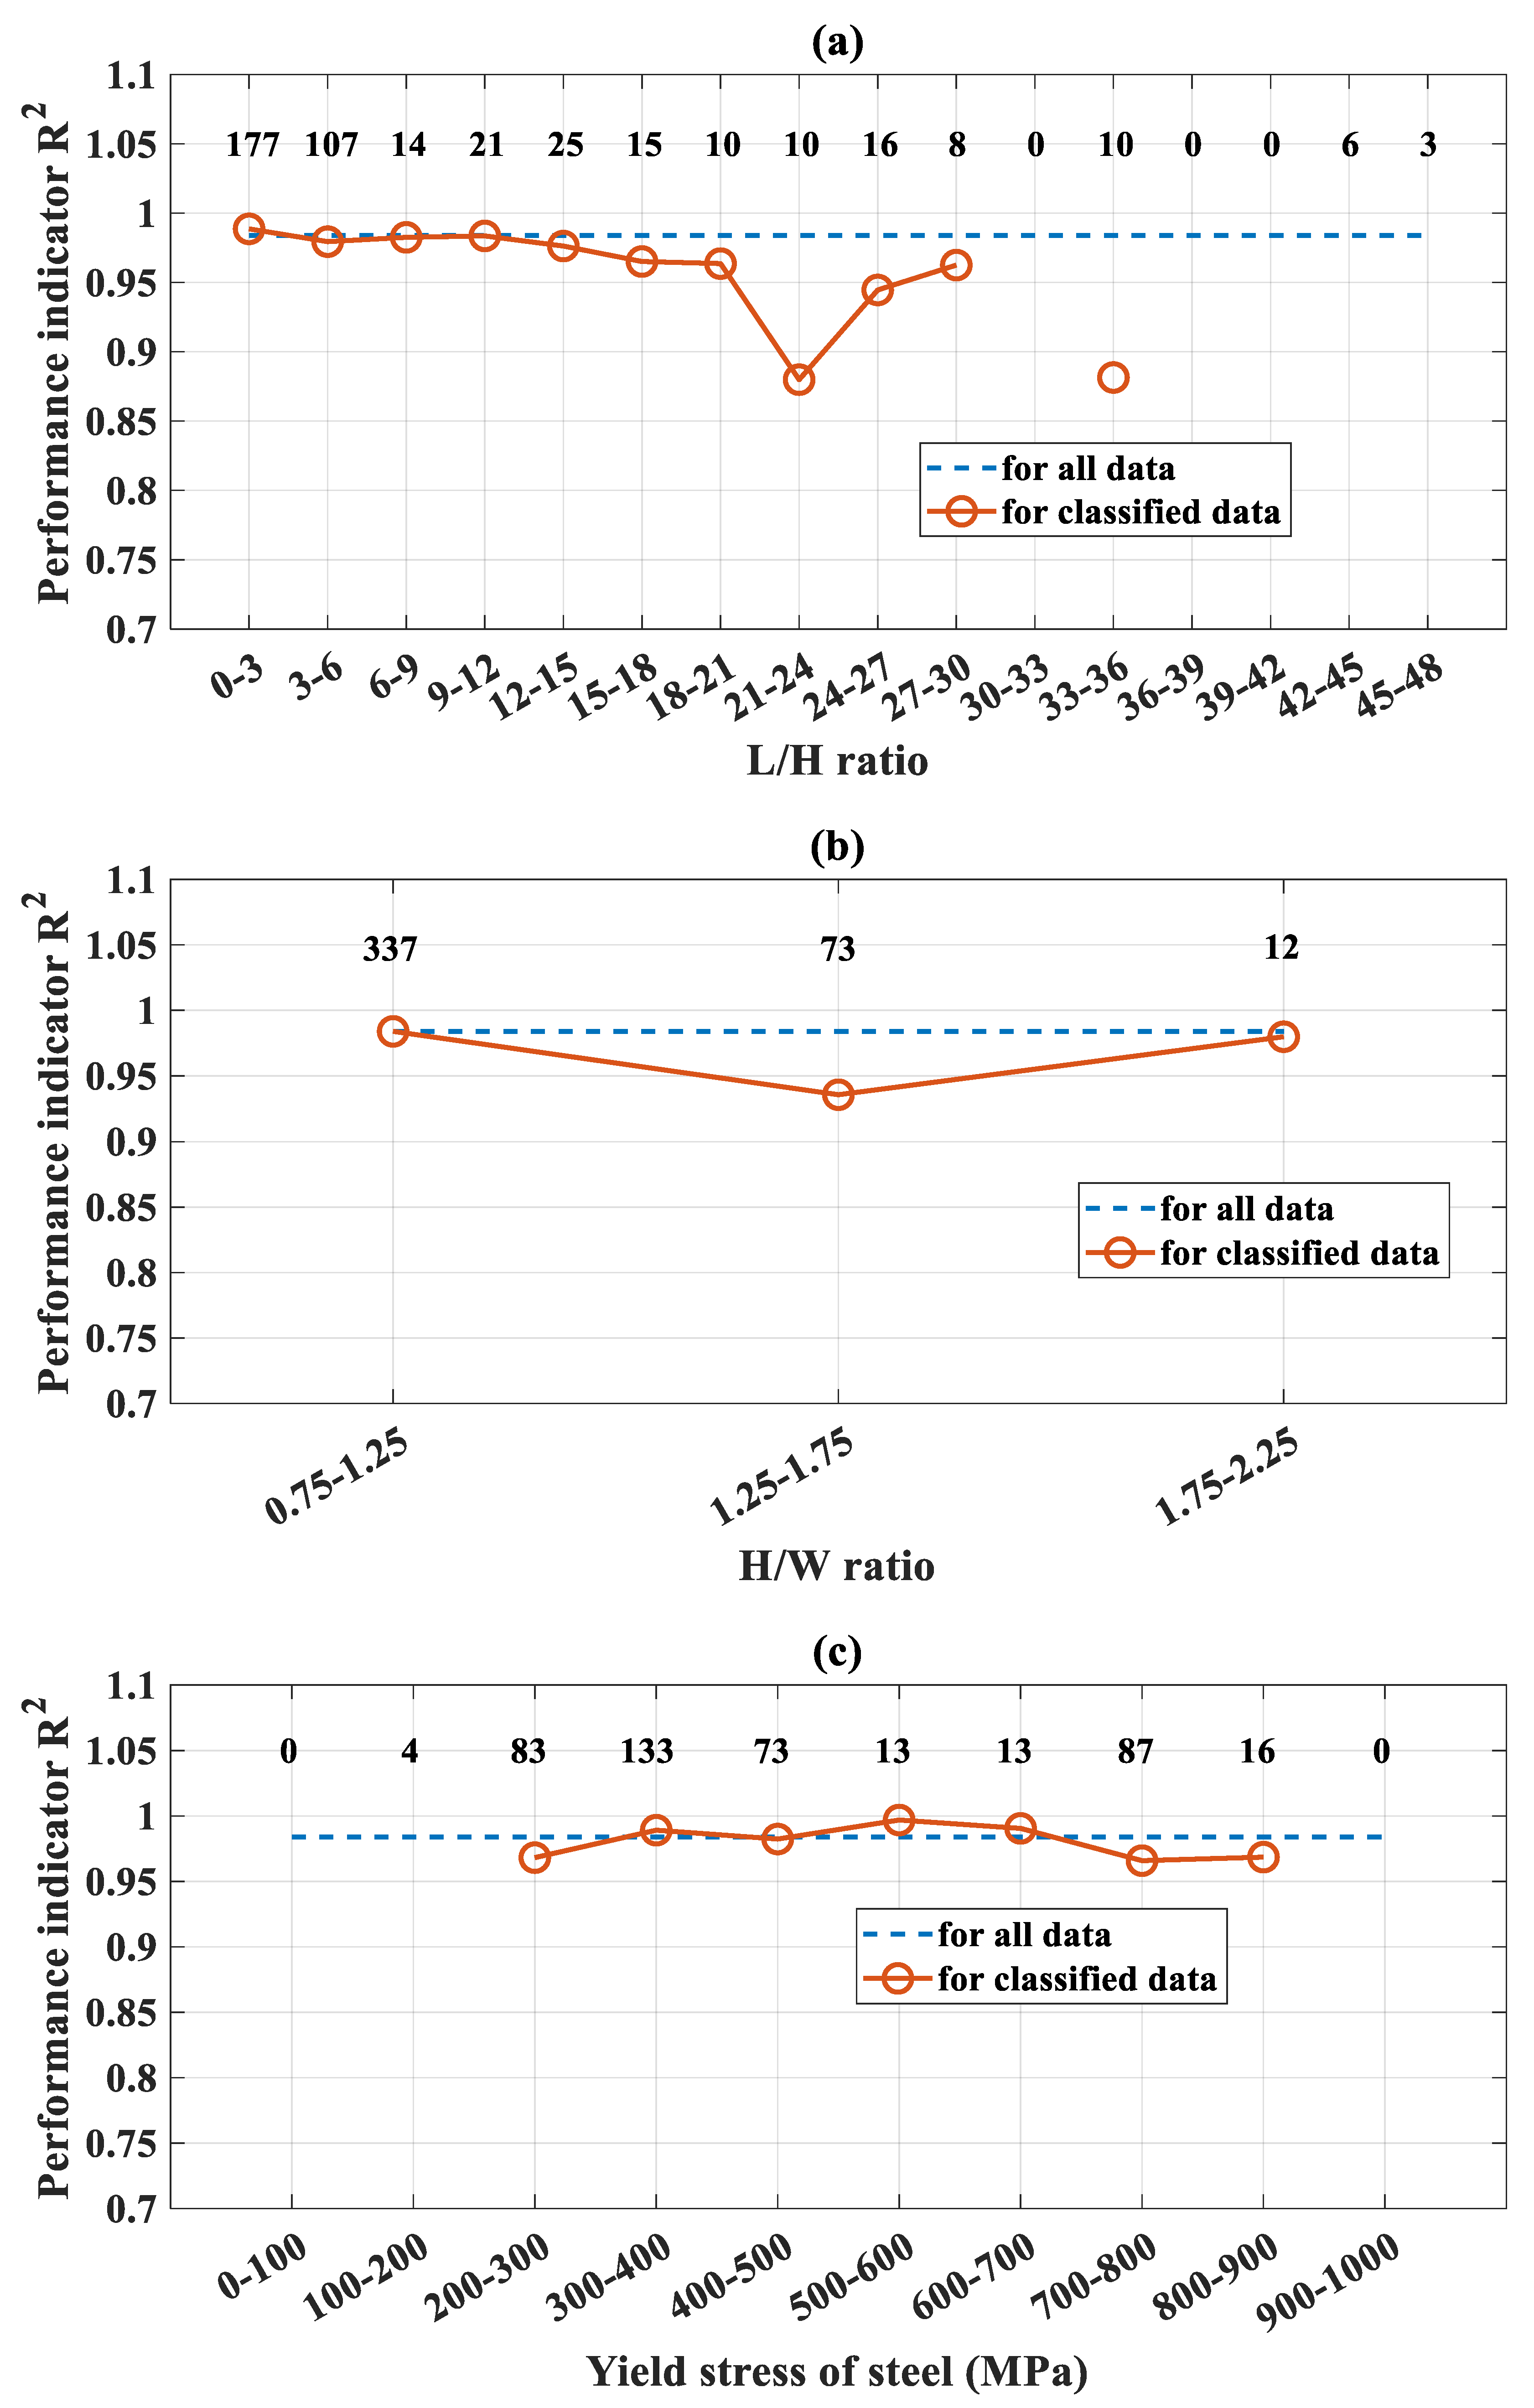
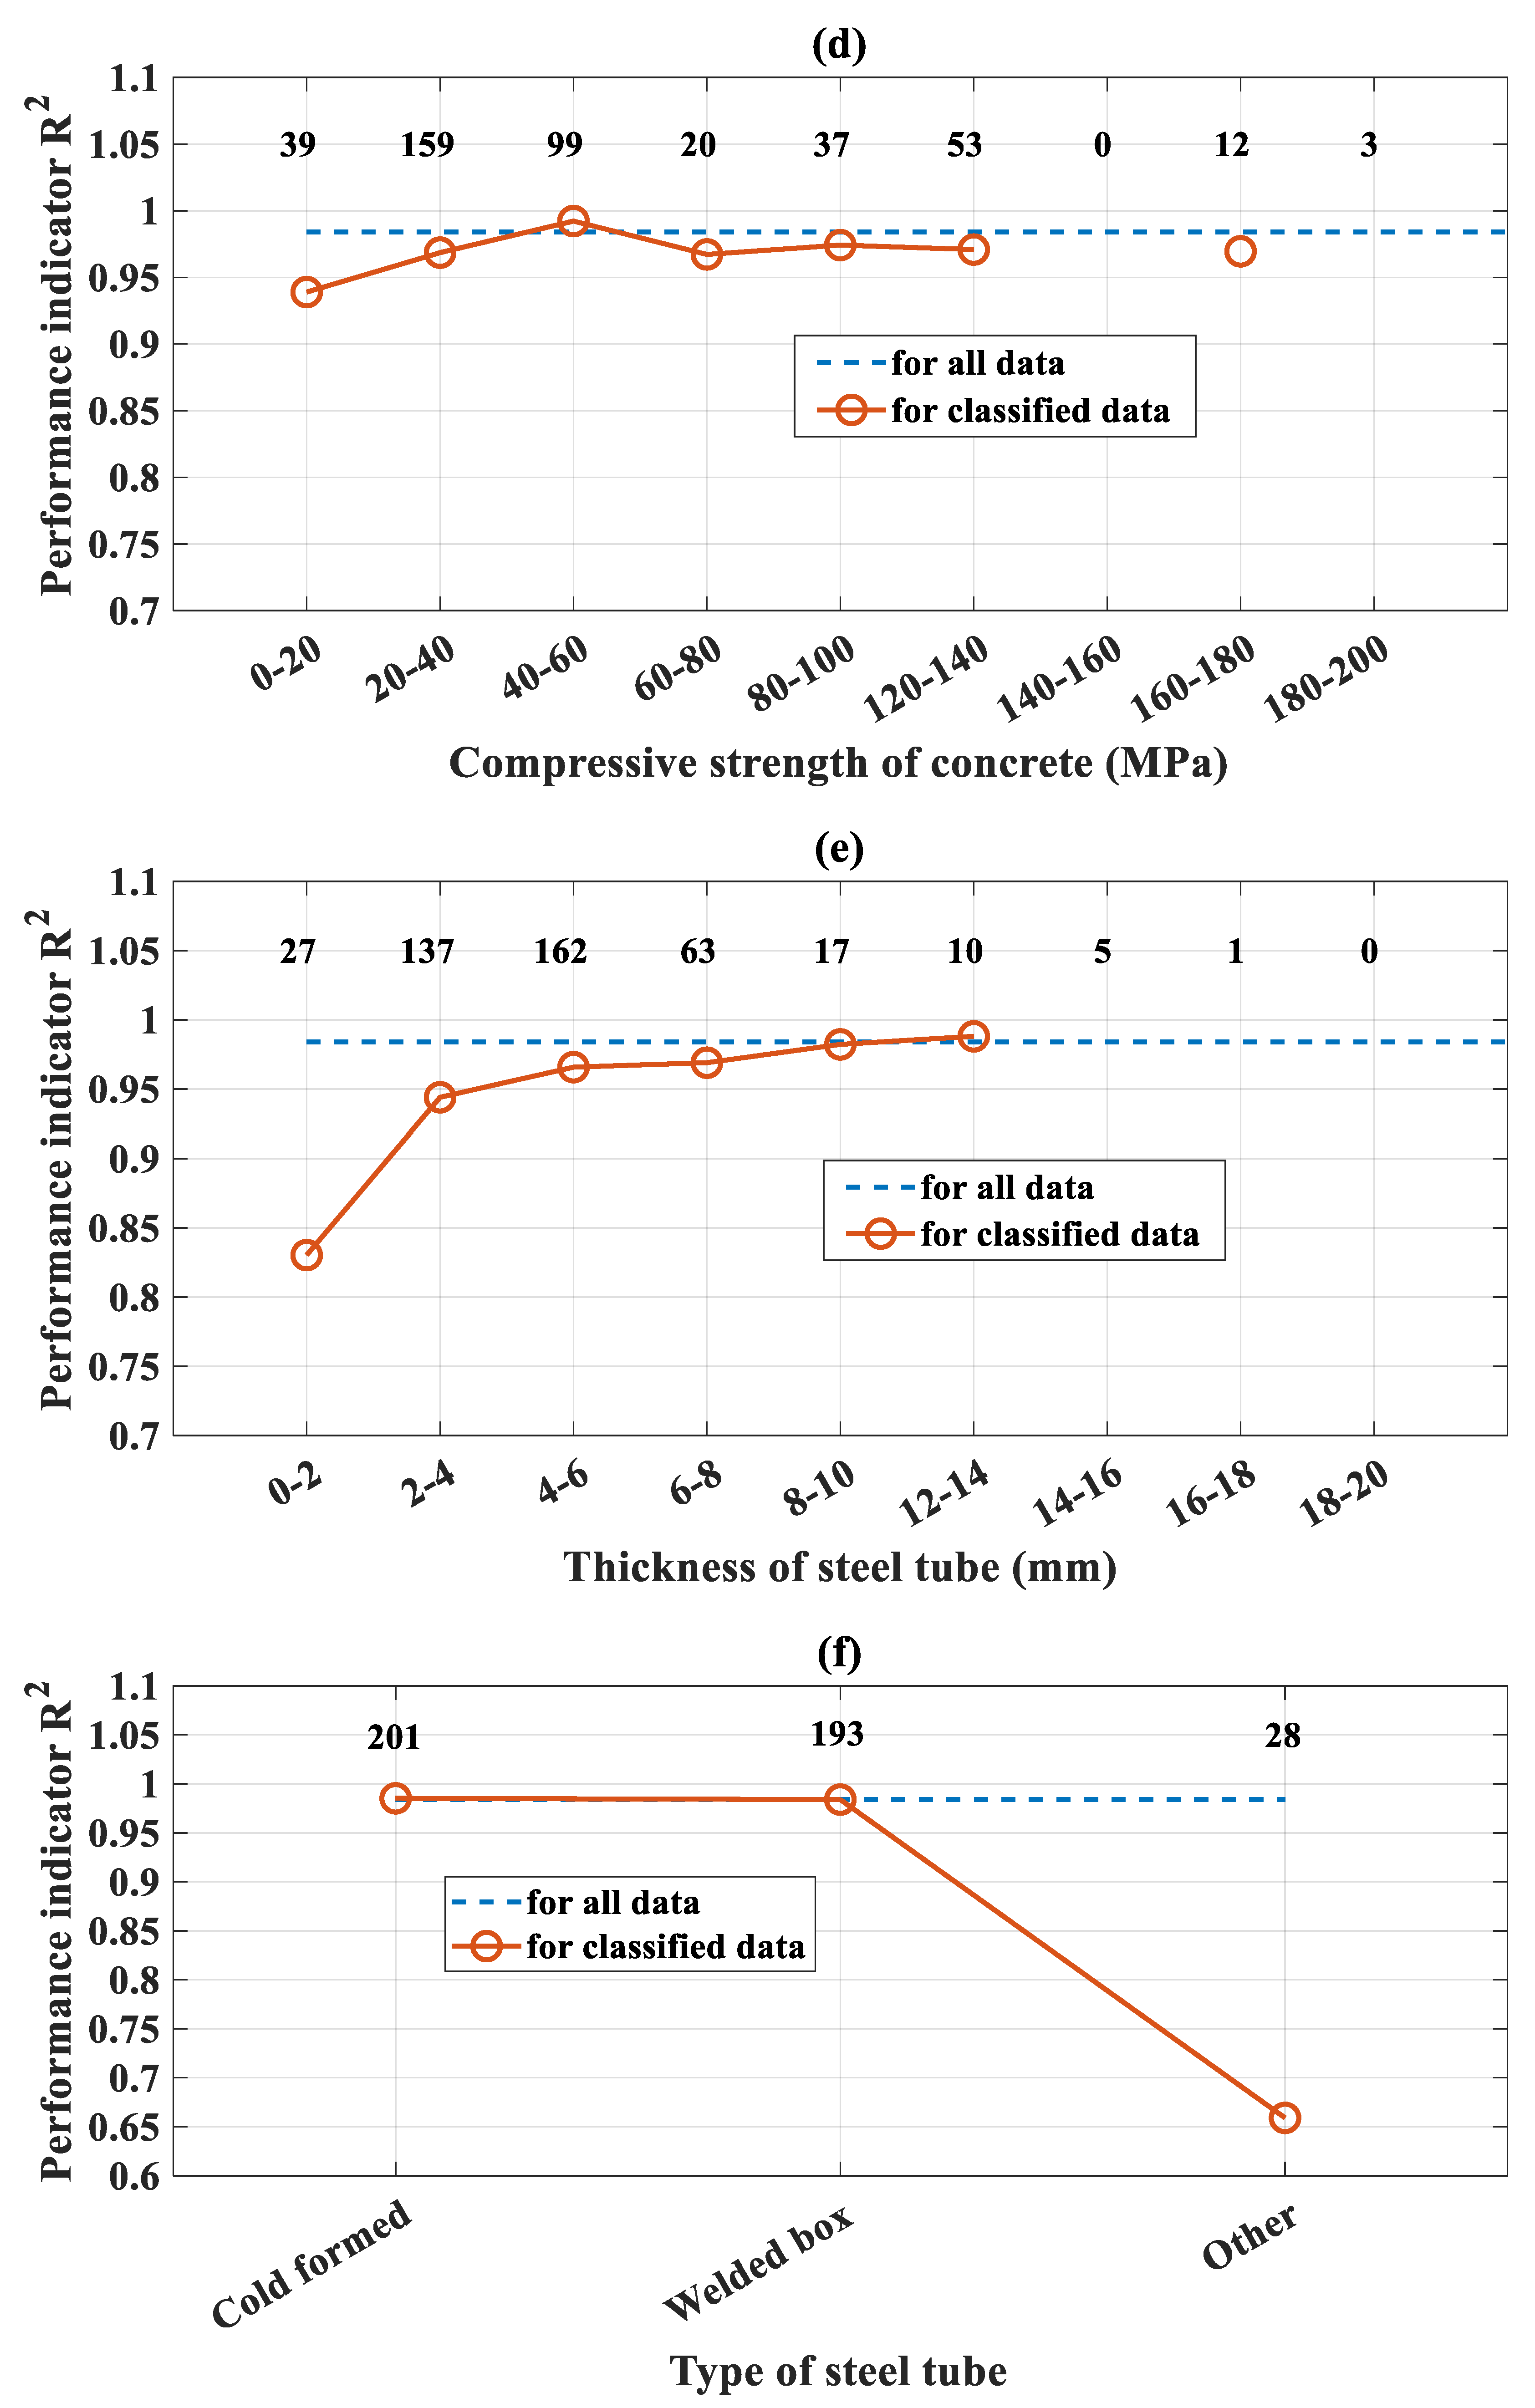
3.2.2. Local Analysis
4. Discussion
4.1. Comparison of Performance
4.2. Local Performance and Limitations
5. Conclusions and Outlook
Author Contributions
Funding
Conflicts of Interest
References
- Ren, Q.; Li, M.; Zhang, M.; Shen, Y.; Si, W. Prediction of Ultimate Axial Capacity of Square Concrete-Filled Steel Tubular Short Columns Using a Hybrid Intelligent Algorithm. Appl. Sci. 2019, 9, 2802. [Google Scholar] [CrossRef]
- Lai, Z.; Varma, A.H.; Zhang, K. Noncompact and slender rectangular CFT members: Experimental database, analysis, and design. J. Constr. Steel Res. 2014, 101, 455–468. [Google Scholar] [CrossRef]
- Guan, M.; Lin, S.; Du, H.; Cui, J.; Yan, T. Evaluation of Damage Indices for Rectangular Concrete-filled Steel Tube Structures. Meas. Sci. Rev. 2019, 19, 170–184. [Google Scholar] [CrossRef]
- Elremaily, A.; Azizinamini, A. Behavior and strength of circular concrete-filled tube columns. J. Constr. Steel Res. 2002, 58, 1567–1591. [Google Scholar] [CrossRef]
- Aslani, F.; Uy, B.; Wang, Z.; Patel, V. Confinement models for high strength short square and rectangular concrete-filled steel tubular columns. Steel Compos. Struct. 2016, 22. [Google Scholar] [CrossRef]
- Uy, B. Strength of short concrete filled high strength steel box columns. J. Constr. Steel Res. 2001, 57, 113–134. [Google Scholar] [CrossRef]
- Mursi, M.; Uy, B. Strength of Concrete Filled Steel Box Columns Incorporating Interaction Buckling. Fac. Eng. Pap. 2003, 129. [Google Scholar] [CrossRef]
- Morino, S.; Tsuda, K. Design and construction of concrete-filled steel tube column system in Japan. Earthq. Eng. Eng. Seismol. 2003, 4, 51–73. [Google Scholar]
- Tian, Z.; Liu, Y.; Jiang, L.; Zhu, W.; Ma, Y. A review on application of composite truss bridges composed of hollow structural section members. J. Traffic Transp. Eng. (Engl. Ed.) 2019, 6, 94–108. [Google Scholar] [CrossRef]
- Bong Kwon, Y.; Kyu Jeong, I. Resistance of rectangular concrete-filled tubular (CFT) sections to the axial load and combined axial compression and bending. Thin-Walled Struct. 2014, 79, 178–186. [Google Scholar] [CrossRef]
- Liu, D.; Gho, W.-M.; Yuan, J. Ultimate capacity of high-strength rectangular concrete-filled steel hollow section stub columns. J. Constr. Steel Res. 2003, 59, 1499–1515. [Google Scholar] [CrossRef]
- Liu, S.; Xinxin, D.; Li, X.; Liu, Y.; Zhao, S. Behavior of Rectangular-Sectional Steel Tubular Columns Filled with High-Strength Steel Fiber Reinforced Concrete under Axial Compression. Materials 2019, 12, 2716. [Google Scholar] [CrossRef]
- Sherman, D.R. Designing with structural tubing. Mod. Steel Constr. 1997, 37, 36–45. [Google Scholar]
- Yang, Y.-F.; Han, L.-H. Experiments on rectangular concrete-filled steel tubes loaded axially on a partially stressed cross-sectional area. J. Constr. Steel Res. 2009, 65, 1617–1630. [Google Scholar] [CrossRef]
- ACI Committee. Building Code Requirements for Structural Concrete (ACI 318-05) and Commentary (ACI 318R-05); American Concrete Institute: Farmington Hills, MI, USA, 2005. [Google Scholar]
- Dai, X.H.; Lam, D.; Jamaluddin, N.; Ye, J. Numerical analysis of slender elliptical concrete filled columns under axial compression. Thin-Walled Struct. 2014, 77, 26–35. [Google Scholar] [CrossRef]
- Zeghiche, J.; Chaoui, K. An experimental behaviour of concrete-filled steel tubular columns. J. Constr. Steel Res. 2005, 61, 53–66. [Google Scholar] [CrossRef]
- Liu, D.; Gho, W.-M. Axial load behaviour of high-strength rectangular concrete-filled steel tubular stub columns. Thin-Walled Struct. 2005, 43, 1131–1142. [Google Scholar] [CrossRef]
- AISC Committee. Specification for Structural Steel Buildings (ANSI/AISC 360-10); American Institute of Steel Construction: Chicago, IL, USA, 2010. [Google Scholar]
- Glover, B.; Kelly, B. Limit States Design of Steel Structures; National Standard of Canada CAN/CSA-S16.1-94; Canadian Standards Association: Rexdale, ON, Canada, 1994. [Google Scholar]
- Eurocode 4, E. 1994-1-1. Design of Composite Steel and Concrete Structures. Part 1.1. General Rules and Rules for Buildings; British Standards Institution: London, UK, 1994; Available online: https://www.phd.eng.br/wp-content/uploads/2015/12/en.1994.1.1.2004.pdf (accessed on 22 July 2020).
- Standard, Australian. AS5100. In Bridge Design Part 6: Steel and Composite; Bridge Design-Construction: Sydney, Australia, 2004. Available online: https://shop.standards.govt.nz/catalog/5100.6%3A2017%28AS%7CNZS%29/view (accessed on 22 July 2020).
- C.E.C.S. CECS 28:2012. In Technical Specification for Concrete-Filled Steel Tubular Structures; MOHURD: Beijing, China, 2012. Available online: https://www.codeofchina.com/standard/GB50936-2014.html (accessed on 22 July 2020).
- J.G. 3192. In Dimensions, Mass and Permissible Variations of Hot Rolled Steel Sections; Japanese Standards Association: Tokyo, Japan, 2005; Available online: https://global.ihs.com/doc_detail.cfm?document_name=JIS%20G%203192&item_s_key=00158267 (accessed on 22 July 2020).
- Chitawadagi, M.V.; Narasimhan, M.C.; Kulkarni, S.M. Axial capacity of rectangular concrete-filled steel tube columns—DOE approach. Constr. Build. Mater. 2010, 24, 585–595. [Google Scholar] [CrossRef]
- Schneider, S.P. Axially Loaded Concrete-Filled Steel Tubes. J. Struct. Eng. 1998, 124, 1125–1138. [Google Scholar] [CrossRef]
- Sakino, K.; Nakahara, H.; Morino, S.; Nishiyama, I. Behavior of Centrally Loaded Concrete-Filled Steel-Tube Short Columns. J. Struct. Eng. 2004, 130. [Google Scholar] [CrossRef]
- Tokgoz, S.; Dundar, C. Experimental study on steel tubular columns in-filled with plain and steel fiber reinforced concrete. Thin-Walled Struct. 2010, 48, 414–422. [Google Scholar] [CrossRef]
- Wang, X.; Qi, Y.; Sun, Y.; Xie, Z.; Liu, W. Compressive Behavior of Composite Concrete Columns with Encased FRP Confined Concrete Cores. Sensors 2019, 19, 1792. [Google Scholar] [CrossRef]
- Tort, C.; Hajjar, J.F. Mixed Finite-Element Modeling of Rectangular Concrete-Filled Steel Tube Members and Frames under Static and Dynamic Loads. J. Struct. Eng. ASCE 2010, 136. [Google Scholar] [CrossRef]
- Tao, Z.; Wang, Z.-B.; Yu, Q. Finite element modelling of concrete-filled steel stub columns under axial compression. J. Constr. Steel Res. 2013, 89, 121–131. [Google Scholar] [CrossRef]
- Ma, X.-B.; Zhang, S.-M. Comparison of design methods of load-carrying capacity for circular concrete-filled steel tube beam columns in typical codes worldwide. J. Harbin Inst. Technol. 2007, 39, 536–541. [Google Scholar]
- Du, Y.; Chen, Z.; Zhang, C.; Cao, X. Research on axial bearing capacity of rectangular concrete-filled steel tubular columns based on artificial neural networks. Front. Comput. Sci. 2017, 11, 863–873. [Google Scholar] [CrossRef]
- Dao, D.; Ly, H.-B.; Thi Vu, H.-L.; Le, T.-T.; Pham, B. Investigation and Optimization of the C-ANN Structure in Predicting the Compressive Strength of Foamed Concrete. Materials 2020, 13, 1072. [Google Scholar] [CrossRef] [PubMed]
- Ly, H.-B.; Le, T.-T.; Le, L.; Van Quan, T.; Le, V.; Thi Vu, H.-L.; Nguyen, Q.; Pham, B. Development of Hybrid Machine Learning Models for Predicting the Critical Buckling Load of I-Shaped Cellular Beams. Appl. Sci. 2019, 9, 5458. [Google Scholar] [CrossRef]
- Dao, D.V.; Adeli, H.; Ly, H.-B.; Le, L.M.; Pham, A. A Sensitivity and Robustness Analysis of GPR and ANN for High-Performance Concrete Compressive Strength Prediction Using a Monte Carlo Simulation. Sustainability 2020, 12, 830. [Google Scholar] [CrossRef]
- Ly, H.-B.; Le, L.; Phi, L.; Phan, V.-H.; Van Quan, T.; Pham, B.; Le, T.-T.; Derrible, S. Development of an AI Model to Measure Traffic Air Pollution from Multisensor and Weather Data. Sensors 2019, 19, 4941. [Google Scholar] [CrossRef] [PubMed]
- Pham, B.T.; Le, L.M.; Le, T.-T.; Bui, K.-T.T.; Le, V.M.; Ly, H.-B.; Prakash, I. Development of advanced artificial intelligence models for daily rainfall prediction. Atmos. Res. 2020, 237, 104845. [Google Scholar] [CrossRef]
- Le, T.-T. Surrogate Neural Network Model for Prediction of Load-Bearing Capacity of CFSS Members Considering Loading Eccentricity. Appl. Sci. 2020, 10, 3452. [Google Scholar] [CrossRef]
- Nguyen, Q.H.; Ly, H.-B.; Le, T.-T.; Nguyen, T.-A.; Phan, V.-H.; Tran, V.Q.; Pham, B.T. Parametric Investigation of Particle Swarm Optimization to Improve the Performance of the Adaptive Neuro-Fuzzy Inference System in Determining the Buckling Capacity of Circular Opening Steel Beams. Materials 2020, 13, 2210. [Google Scholar] [CrossRef]
- Ly, H.-B.; Le, T.-T.; Vu, H.-L.T.; Tran, V.Q.; Le, L.M.; Pham, B.T. Computational Hybrid Machine Learning Based Prediction of Shear Capacity for Steel Fiber Reinforced Concrete Beams. Sustainability 2020, 12, 2709. [Google Scholar] [CrossRef]
- Le, L.M.; Ly, H.-B.; Pham, B.T.; Le, V.M.; Pham, T.A.; Nguyen, D.-H.; Tran, X.-T.; Le, T.-T. Hybrid Artificial Intelligence Approaches for Predicting Buckling Damage of Steel Columns under Axial Compression. Materials 2019, 12, 1670. [Google Scholar] [CrossRef]
- Pham, B.T.; Nguyen-Thoi, T.; Ly, H.-B.; Nguyen, M.D.; Al-Ansari, N.; Tran, V.-Q.; Le, T.-T. Extreme Learning Machine Based Prediction of Soil Shear Strength: A Sensitivity Analysis Using Monte Carlo Simulations and Feature Backward Elimination. Sustainability 2020, 12, 2339. [Google Scholar] [CrossRef]
- Nguyen, M.D.; Pham, B.T.; Ho, L.S.; Ly, H.-B.; Le, T.-T.; Qi, C.; Le, V.M.; Le, L.M.; Prakash, I.; Son, L.H.; et al. Soft-computing techniques for prediction of soils consolidation coefficient. CATENA 2020, 195, 104802. [Google Scholar] [CrossRef]
- Amani, J.; Moeini, R. Prediction of shear strength of reinforced concrete beams using adaptive neuro-fuzzy inference system and artificial neural network. Sci. Iran. 2012, 19, 242–248. [Google Scholar] [CrossRef]
- Younesi, M.; Bahrololoom, M.E.; Ahmadzadeh, M. Prediction of wear behaviors of nickel free stainless steel–hydroxyapatite bio-composites using artificial neural network. Comput. Mater. Sci. 2010, 47, 645–654. [Google Scholar] [CrossRef]
- Haque, M.E.; Sudhakar, K.V. ANN back-propagation prediction model for fracture toughness in microalloy steel. Int. J. Fatigue 2002, 24, 1003–1010. [Google Scholar] [CrossRef]
- Mahdi, E.-S.; El Kadi, H. Crushing behavior of laterally compressed composite elliptical tubes: Experiments and predictions using artificial neural networks. Compos. Struct. 2008, 83, 399–412. [Google Scholar] [CrossRef]
- Nguyen, H.Q.; Ly, H.-B.; Tran, V.Q.; Nguyen, T.-A.; Le, T.-T.; Pham, B.T. Optimization of Artificial Intelligence System by Evolutionary Algorithm for Prediction of Axial Capacity of Rectangular Concrete Filled Steel Tubes under Compression. Materials 2020, 13, 1205. [Google Scholar] [CrossRef]
- Dao, D.V.; Nguyen, N.-L.; Ly, H.-B.; Pham, B.T.; Le, T.-T. Cost-Effective Approaches Based on Machine Learning to Predict Dynamic Modulus of Warm Mix Asphalt with High Reclaimed Asphalt Pavement. Materials 2020, 13, 3272. [Google Scholar] [CrossRef]
- Al-Khaleefi, A.M.; Terro, M.J.; Alex, A.P.; Wang, Y. Prediction of fire resistance of concrete filled tubular steel columns using neural networks. Fire Saf. J. 2002, 37, 339–352. [Google Scholar] [CrossRef]
- Wang, Y.; Liu, Z.; Zhang, M. Prediction of Mechanical Behavior of Concrete Filled Steel Tube Structure Using Artificial Neural Network. Appl. Mech. Mater. 2013, 368–370, 1095–1098. [Google Scholar] [CrossRef]
- Sarir, P.; Shen, S.-L.; Wang, Z.-F.; Chen, J.; Horpibulsuk, S.; Pham, B.T. Optimum model for bearing capacity of concrete-steel columns with AI technology via incorporating the algorithms of IWO and ABC. Eng. Comput. 2019. [Google Scholar] [CrossRef]
- Liao, F.-Y.; Han, L.-H.; Tao, Z. Behaviour of composite joints with concrete encased CFST columns under cyclic loading: Experiments. Eng. Struct. 2014, 59, 745–764. [Google Scholar] [CrossRef]
- Du, Y.; Chen, Z.; Xiong, M.-X. Experimental behavior and design method of rectangular concrete-filled tubular columns using Q460 high-strength steel. Constr. Build. Mater. 2016, 125, 856–872. [Google Scholar] [CrossRef]
- Ly, H.-B.; Le, L.M.; Duong, H.T.; Nguyen, T.C.; Pham, T.A.; Le, T.-T.; Le, V.M.; Nguyen-Ngoc, L.; Pham, B.T. Hybrid Artificial Intelligence Approaches for Predicting Critical Buckling Load of Structural Members under Compression Considering the Influence of Initial Geometric Imperfections. Appl. Sci. 2019, 9, 2258. [Google Scholar] [CrossRef]
- Sarir, P.; Chen, J.; Asteris, P.G.; Armaghani, D.J.; Tahir, M.M. Developing GEP tree-based, neuro-swarm, and whale optimization models for evaluation of bearing capacity of concrete-filled steel tube columns. Eng. Comput. 2019. [Google Scholar] [CrossRef]
- Han, L.-H.; Yao, G.-H. Influence of concrete compaction on the strength of concrete-filled steel RHS columns. J. Constr. Steel Res. 2003, 59, 751–767. [Google Scholar] [CrossRef]
- Yan, J.-B.; Dong, X.; Wang, T. Axial compressive behaviours of square CFST stub columns at low temperatures. J. Constr. Steel Res. 2020, 164, 105812. [Google Scholar] [CrossRef]
- Ding, F.; Fang, C.; Bai, Y.; Gong, Y. Mechanical performance of stirrup-confined concrete-filled steel tubular stub columns under axial loading. J. Constr. Steel Res. 2014, 98, 146–157. [Google Scholar] [CrossRef]
- Lyu, X.; Xu, Y.; Xu, Q.; Yu, Y. Axial Compression Performance of Square Thin Walled Concrete-Filled Steel Tube Stub Columns with Reinforcement Stiffener under Constant High-Temperature. Materials 2019, 12, 1098. [Google Scholar] [CrossRef]
- Aslani, F.; Uy, B.; Tao, Z.; Mashiri, F. Behaviour and design of composite columns incorporating compact high-strength steel plates. J. Constr. Steel Res. 2015, 107, 94–110. [Google Scholar] [CrossRef]
- Lin, C.Y. Axial Capacity of Concrete Infilled Cold-formed Steel Columns. In Proceedings of the Ninth International Specialty Conference on Cold-Formed Steel Structures, St. Louis, MO, USA, 8–9 November 1988; pp. 443–457. [Google Scholar]
- Bergmann, R. Load Introduction in Composite Columns Filled with High Strength Concrete. In Proceedings of the Sixth International Symposium on Tubular Structures, Tubular Structures VI, Melbourne, Australia, 14–16 December 1994; pp. 373–380. [Google Scholar]
- Matsui, C.; Tsuda, K.; Ozaki, I.; Ishibashi, Y. Strength of Slender Concrete Filled Steel Tubular Columns. J. Struct. Constr. Eng. (Trans. Aij) 1997, 62, 137–144. [Google Scholar] [CrossRef][Green Version]
- Bridge, R.Q. Concrete Filled Steel Tubular Columns. Ph.D. Thesis, School of Civil Engineering, University of Sydney, Sydney, Australia, 1976. [Google Scholar]
- Mursi, M.; Uy, B. Strength of slender concrete filled high strength steel box columns. J. Constr. Steel Res. 2004, 60, 1825–1848. [Google Scholar] [CrossRef]
- Chapman, J.C.; Neogi, P.K. Research on Concrete-Filled Tubular Columns: By J.C. Chapman [and] P.K. Neogi.; Engineering Structures Laboratories, Civil Engineering Department, Imperial College: London, UK, 1964. [Google Scholar]
- Chen, C.-C.; Ko, J.-W.; Huang, G.-L.; Chang, Y.-M. Local buckling and concrete confinement of concrete-filled box columns under axial load. J. Constr. Steel Res. 2012, 78, 8–21. [Google Scholar] [CrossRef]
- Sakino, K.; Hayashi, H. Behavior of Concrete Filled Steel Tubular Stub Columns under Concentric Loading. In Proceedings of the 3rd International Conference on Steel-Concrete Composite Structures, Fukuoka, Japan, 26–29 September 1991; pp. 25–30. [Google Scholar]
- Shakir-Khalil, H.; Mouli, M. Further Tests on Concrete-Filled Rectangular Hollow-Section Columns. Struct. Eng. 1990, 68, 405–413. [Google Scholar]
- Dundu, M. Column buckling tests of hot-rolled concrete filled square hollow sections of mild to high strength steel. Eng. Struct. 2016, 127, 73–85. [Google Scholar] [CrossRef]
- Shakir-Khalil, H.; Zeghiche, J. Experimental Behaviour of Concrete-Filled Rolled Rectangular Hollow-Section Columns. Struct. Eng. 1989, 67, 346–353. [Google Scholar]
- Fong, M.; Chan, S.L.; Uy, B. Advanced design for trusses of steel and concrete-filled tubular sections. Eng. Struct. 2011, 33, 3162–3171. [Google Scholar] [CrossRef]
- Tao, Z.; Han, L.-H.; Wang, D.-Y. Experimental behaviour of concrete-filled stiffened thin-walled steel tubular columns. Thin-Walled Struct. 2007, 45, 517–527. [Google Scholar] [CrossRef]
- Furlong, R.W. Strength of Steel-Encased Concrete Beam Columns. J. Struct. Div. 1967, 93, 113–124. [Google Scholar]
- Tomii, M.; Sakino, K. Experimental studies on the ultimate moment of concrete filled square steel tubular beam-columns. Trans. Archit. Inst. Jpn. 1979, 55–65. [Google Scholar] [CrossRef]
- Ghannam, S.; Jawad, Y.A.; Hunaiti, Y. Failure of lightweight aggregate concrete-filled steel tubular columns. Steel Compos. Struct. 2004, 4, 1–8. [Google Scholar] [CrossRef]
- Ly, H.-B.; Pham, B.T.; Le, L.M.; Le, T.-T.; Le, V.M.; Asteris, P.G. Estimation of axial load-carrying capacity of concrete-filled steel tubes using surrogate models. Neural Comput. Appl. 2020, in press. [Google Scholar] [CrossRef]
- Grauers, M. Composite Columns of Hollow Steel Sections Filled with High Strength Concrete. Ph.D. Thesis, Chalmers University, Göteborg, Sweden, 1993. [Google Scholar]
- Varma, A.H.; Ricles, J.M.; Sause, R.; Lu, L.W. Seismic Behavior and Design of High-Strength Square Concrete-Filled Steel Tube Beam Columns. J. Struct. Eng. 2004, 130, 169–179. [Google Scholar] [CrossRef]
- Han, L.-H. Tests on stub columns of concrete-filled RHS sections. J. Constr. Steel Res. 2002, 58, 353–372. [Google Scholar] [CrossRef]
- Vrcelj, Z.; Uy, B. Behaviour and Design of Steel Square Hollow Sections Filled with High Strength Concrete. Aust. J. Struct. Eng. 2002, 3, 153–170. [Google Scholar] [CrossRef]
- Han, L.-H.; Yang, Y.-F. Analysis of thin-walled steel RHS columns filled with concrete under long-term sustained loads. Thin-Walled Struct. 2003, 41, 849–870. [Google Scholar] [CrossRef]
- Xiong, M.-X.; Xiong, D.-X.; Liew, J.Y.R. Axial performance of short concrete filled steel tubes with high- and ultra-high- strength materials. Eng. Struct. 2017, 136, 494–510. [Google Scholar] [CrossRef]
- Yamamoto, T.; Kawaguchi, J.; Morino, S. Experimental Study of Scale Effects on the Compressive Behavior of Short Concrete-Filled Steel Tube Columns. Compos. Construct. Steel Concr. IV 2000, 879–890. [Google Scholar] [CrossRef]
- Han, L.-H.; Tao, Z.; Liu, W. Effects of Sustained Load on Concrete-Filled Hollow Structural Steel Columns. J. Struct. Eng. 2004, 130, 1392–1404. [Google Scholar] [CrossRef]
- Yang, Y.F.; Han, L.H. Concrete filled steel tube (CFST) columns subjected to concentrically partial compression. Thin-Walled Struct. 2012, 50, 147–156. [Google Scholar] [CrossRef]
- Khan, M.; Uy, B.; Tao, Z.; Mashiri, F. Behaviour and design of short high-strength steel welded box and concrete-filled tube (CFT) sections. Eng. Struct. 2017, 147, 458–472. [Google Scholar] [CrossRef]
- Yu, Q.; Tao, Z.; Wu, Y.-X. Experimental behaviour of high performance concrete-filled steel tubular columns. Thin-Walled Struct. 2008, 46, 362–370. [Google Scholar] [CrossRef]
- Knowles, R.B.; Park, R. Strength of Concrete Filled Steel Tubular Columns. J. Struct. Div. 1969, 95, 2565–2588. [Google Scholar]
- Zhu, A.; Zhang, X.; Zhu, H.; Zhu, J.; Lu, Y. Experimental study of concrete filled cold-formed steel tubular stub columns. J. Constr. Steel Res. 2017, 134, 17–27. [Google Scholar] [CrossRef]
- Lam, D.; Williams, C.A. Experimental study on concrete filled square hollow sections. Steel Compos. Struct. 2004, 4, 95–112. [Google Scholar] [CrossRef]
- Sharma, A.; Goyal, M.K. Bayesian network model for monthly rainfall forecast. In Proceedings of the 2015 IEEE International Conference on Research in Computational Intelligence and Communication Networks (ICRCICN); IEEE: Kolkata, India, 2015; pp. 241–246. [Google Scholar]
- Salcedo-Sanz, S.; Deo, R.C.; Carro-Calvo, L.; Saavedra-Moreno, B. Monthly prediction of air temperature in Australia and New Zealand with machine learning algorithms. Theor. Appl. Climatol. 2016, 125, 13–25. [Google Scholar] [CrossRef]
- Chan, Y.N.; Jin, P.; Anson, M.; Wang, J.S. Fire resistance of concrete: Prediction using artificial neural networks. Mag. Concr. Res. 1998, 50, 353–358. [Google Scholar] [CrossRef]
- Jegadesh, S.; Jayalekshmi, S. Application of Artificial Neural Network for Calculation of Axial Capacity of Circular Concrete Filled Steel Tubular Columns. Int. J. Earth Sci. Eng. 2015, 8, 35–42. [Google Scholar]
- Le, T.-T.; Pham, B.T.; Ly, H.-B.; Shirzadi, A.; Le, L.M. Development of 48-h Precipitation Forecasting Model Using Nonlinear Autoregressive Neural Network. In Proceedings of the CIGOS 2019, Innovation for Sustainable Infrastructure; Ha-Minh, C., Dao, D.V., Benboudjema, F., Derrible, S., Huynh, D.V.K., Tang, A.M., Eds.; Springer: Singapore, 2020; pp. 1191–1196. [Google Scholar]
- Chua, D.K.H.; Loh, P.K.; Kog, Y.C.; Jaselskis, E.J. Neural networks for construction project success. Expert Syst. Appl. 1997, 13, 317–328. [Google Scholar] [CrossRef]
- Pham, B.T.; Nguyen, M.D.; Ly, H.-B.; Pham, T.A.; Hoang, V.; Van Le, H.; Le, T.-T.; Nguyen, H.Q.; Bui, G.L. Development of Artificial Neural Networks for Prediction of Compression Coefficient of Soft Soil. In Proceedings of the CIGOS 2019, Innovation for Sustainable Infrastructure; Ha-Minh, C., Dao, D.V., Benboudjema, F., Derrible, S., Huynh, D.V.K., Tang, A.M., Eds.; Springer: Singapore, 2020; pp. 1167–1172. [Google Scholar]
- Khalaf, A.; Naser, Z.; Idan, F. Predicting the ultimate strength of circular concrete filled steel tubular columns by using artificial neural networks. Int. J. Civ. Eng. Technol. 2018, 9, 1724–1736. [Google Scholar]
- Wu, H.; Zhou, Y.-Q.; Luo, Q.; Abdel-Basset, M. Training Feedforward Neural Networks Using Symbiotic Organisms Search Algorithm. Comput. Intell. Neurosci. 2016, 2016, 9063065. [Google Scholar] [CrossRef] [PubMed]
- MATLAB; The MathWorks: Natick, MA, USA, 2018.
- Robitaille, B.; Marcos, B.; Veillette, M.; Payre, G. Modified quasi-Newton methods for training neural networks. Comput. Chem. Eng. 1996, 20, 1133–1140. [Google Scholar] [CrossRef]
- Mukherjee, I.; Routroy, S. Comparing the performance of neural networks developed by using Levenberg–Marquardt and Quasi-Newton with the gradient descent algorithm for modelling a multiple response grinding process. Expert Syst. Appl. 2012, 39, 2397–2407. [Google Scholar] [CrossRef]
- Pearson, K.; Galton, F., VII. Note on regression and inheritance in the case of two parents. Proc. R. Soc. Lond. 1895, 58, 240–242. [Google Scholar] [CrossRef]
- Taylor, R. Interpretation of the Correlation Coefficient: A Basic Review. J. Diagn. Med. Sonogr. 1990, 6, 35–39. [Google Scholar] [CrossRef]
- Nguyen, T.C.; Le, L.M.; Ly, H.-B.; Le, T.-T. Numerical investigation of force transmission in granular media using discrete element method. Vietnam J. Mech. 2020, 42, 153–171. [Google Scholar] [CrossRef]
- Ly, H.-B.; Monteiro, E.; Le, T.-T.; Le, V.M.; Dal, M.; Regnier, G.; Pham, B.T. Prediction and Sensitivity Analysis of Bubble Dissolution Time in 3D Selective Laser Sintering Using Ensemble Decision Trees. Materials 2019, 12, 1544. [Google Scholar] [CrossRef]
- Montavon, G.; Rupp, M.; Gobre, V.; Vazquez-Mayagoitia, A.; Hansen, K.; Tkatchenko, A.; Müller, K.-R.; von Lilienfeld, O.A. Machine learning of molecular electronic properties in chemical compound space. NewJ. Phys. 2013, 15, 095003. [Google Scholar] [CrossRef]
- Le, T.T.; Guilleminot, J.; Soize, C. Stochastic continuum modeling of random interphases from atomistic simulations. Application to a polymer nanocomposite. Comput. Methods Appl. Mech. Eng. 2016, 303, 430–449. [Google Scholar] [CrossRef]
- Guilleminot, J.; Le, T.T.; Soize, C. Stochastic framework for modeling the linear apparent behavior of complex materials: Application to random porous materials with interphases. Acta Mech. Sin. 2013, 29, 773–782. [Google Scholar] [CrossRef]
- Nguyen, T.X.; Le, L.M.; Nguyen, T.C.; Nguyen, N.T.H.; Le, T.-T.; Pham, B.T.; Le, V.M.; Ly, H.-B. Characterization of soybeans and calibration of their DEM input parameters. Part. Sci. Technol. 2020. [Google Scholar] [CrossRef]
- Qi, C.; Ly, H.-B.; Chen, Q.; Le, T.-T.; Le, V.M.; Pham, B.T. Flocculation-dewatering prediction of fine mineral tailings using a hybrid machine learning approach. Chemosphere 2020, 244, 125450. [Google Scholar] [CrossRef] [PubMed]
- Huang, L.; Asteris, P.G.; Koopialipoor, M.; Armaghani, D.J.; Tahir, M.M. Invasive Weed Optimization Technique-Based ANN to the Prediction of Rock Tensile Strength. Appl. Sci. 2019, 9, 5372. [Google Scholar] [CrossRef]
- Asteris, P.G.; Armaghani, D.J.; Hatzigeorgiou, G.D.; Karayannis, C.G.; Pilakoutas, K. Predicting the shear strength of reinforced concrete beams using Artificial Neural Networks. Comput. Concr. 2019, 24, 469–488. [Google Scholar] [CrossRef]
- Le, T.-H.; Nguyen, H.-L.; Pham, B.T.; Nguyen, M.H.; Pham, C.-T.; Nguyen, N.-L.; Le, T.-T.; Ly, H.-B. Artificial Intelligence-Based Model for the Prediction of Dynamic Modulus of Stone Mastic Asphalt. Appl. Sci. 2020, 10, 5242. [Google Scholar] [CrossRef]
- Defernez, M.; Kemsley, E.K. Avoiding overfitting in the analysis of high-dimensional data with artificial neural networks (ANNs). Analyst 1999, 124, 1675–1681. [Google Scholar] [CrossRef]
- Han, L.-H.; Yao, G.-H.; Zhao, X.-L. Tests and calculations for hollow structural steel (HSS) stub columns filled with self-consolidating concrete (SCC). J. Constr. Steel Res. 2005, 61, 1241–1269. [Google Scholar] [CrossRef]
- Wang, Z.-B.; Tao, Z.; Han, L.-H.; Uy, B.; Lam, D.; Kang, W.-H. Strength, stiffness and ductility of concrete-filled steel columns under axial compression. Eng. Struct. 2017, 135, 209–221. [Google Scholar] [CrossRef]
- Basak, D.; Pal, S.; Patranabis, D.C. Support vector regression. Neural Inf. Process.-Lett. Rev. 2007, 11, 203–224. [Google Scholar]
- Akkurt, S.; Tayfur, G.; Can, S. Fuzzy logic model for the prediction of cement compressive strength. Cem. Concr. Res. 2004, 34, 1429–1433. [Google Scholar] [CrossRef]
- Zięba, M.; Tomczak, S.K.; Tomczak, J.M. Ensemble boosted trees with synthetic features generation in application to bankruptcy prediction. Expert Syst. Appl. 2016, 58, 93–101. [Google Scholar] [CrossRef]
- Uenaka, K. Experimental study on concrete filled elliptical/oval steel tubular stub columns under compression. Thin-Walled Struct. 2014, 78, 131–137. [Google Scholar] [CrossRef]
- Han, L.-H.; Hou, C.; Wang, Q.-L. Square concrete filled steel tubular (CFST) members under loading and chloride corrosion: Experiments. J. Constr. Steel Res. 2012, 71, 11–25. [Google Scholar] [CrossRef]
- He, L.; Zhao, Y.; Lin, S. Experimental study on axially compressed circular CFST columns with improved confinement effect. J. Constr. Steel Res. 2018, 140, 74–81. [Google Scholar] [CrossRef]
- Ren, Q.-X.; Han, L.-H.; Lam, D.; Li, W. Tests on elliptical concrete filled steel tubular (CFST) beams and columns. J. Constr. Steel Res. 2014, 99, 149–160. [Google Scholar] [CrossRef]
Sample Availability: The raw data will be made available on request to Dr. Tien-Thinh Le. |


| Nr. | Reference | Nr. of Data | % of Proportion | Nr. | Reference | Nr. of Data | % of Proportion |
|---|---|---|---|---|---|---|---|
| 1 | Aslani et al. [62] | 12 | 2.8 | 20 | Lin [63] | 12 | 2.8 |
| 2 | Bergmann [64] | 4 | 0.9 | 21 | Matsui & Tsuda [65] | 6 | 1.4 |
| 3 | Bridge [66] | 1 | 0.2 | 22 | Mursi & Uy [67] | 4 | 0.9 |
| 4 | Chapman & Neogi [68] | 2 | 0.5 | 23 | Sakino et al. [56] | 48 | 11.4 |
| 5 | Chen et al. [69] | 4 | 0.9 | 24 | Sakino et al. [70] | 36 | 8.5 |
| 6 | Ding et al. [60] | 5 | 1.2 | 25 | Schneider [26] | 11 | 2.6 |
| 7 | Du et al. [55] | 14 | 3.3 | 26 | Shakir-Khalil & Mouli [71] | 14 | 3.3 |
| 8 | Dundu [72] | 27 | 6.4 | 27 | Shakir-Khalil & Zeghiche [73] | 1 | 0.2 |
| 9 | Fong et al. [74] | 1 | 0.2 | 28 | Tao et al. [75] | 2 | 0.5 |
| 10 | Furlong [76] | 5 | 1.2 | 29 | Tomii & Sakino [77] | 8 | 1.9 |
| 11 | Ghannam et al. [78] | 24 | 5.7 | 30 | Uy [79] | 18 | 4.3 |
| 12 | Grauers [80] | 18 | 4.3 | 31 | Varma [81] | 4 | 0.9 |
| 13 | Han [82] | 66 | 15.6 | 32 | Vrcelj & Uy [83] | 8 | 1.9 |
| 14 | Han & Yang [84] | 4 | 0.9 | 33 | Xiong et al. [85] | 15 | 3.6 |
| 15 | Han & Yao [58] | 34 | 8.1 | 34 | Yamamoto et al. [86] | 8 | 1.9 |
| 16 | Han et al. [87] | 2 | 0.5 | 35 | Yang & Han [88] | 2 | 0.5 |
| 17 | Khan et al. [89] | 55 | 13.0 | 36 | Yu et al. [90] | 10 | 2.4 |
| 18 | Knowles & Park [91] | 6 | 1.4 | 37 | Zhu et al. [92] | 6 | 1.4 |
| 19 | Lam & Williams [93] | 15 | 3.6 | Total | 422 | 100.0 |
| Parameter | Height of Steel Tube (H) | Width of Steel Tube (W) | Thickness of Steel Tube (t) | Length of Column (L) | Yield Stress of Steel (fy) | Compressive Strength of Concrete (f’c) | Load-Bearing Capacity (Nu) |
|---|---|---|---|---|---|---|---|
| Unit | mm | mm | mm | mm | MPa | MPa | kN |
| Minimum | 60.00 | 60.00 | 0.70 | 60.00 | 194.00 | 7.90 | 105.40 |
| Q25 | 101.60 | 100.00 | 3.00 | 450.00 | 320.00 | 26.39 | 808.08 |
| Median | 149.35 | 120.00 | 4.80 | 634.00 | 384.65 | 40.91 | 1537.00 |
| Q75 | 195.00 | 160.00 | 5.48 | 1514.00 | 618.00 | 80.00 | 3183.00 |
| Maximum | 500.00 | 500.00 | 16.00 | 4500.00 | 835.00 | 164.10 | 17,900.00 |
| Mean | 154.02 | 141.72 | 4.80 | 1115.58 | 459.11 | 54.36 | 2500.92 |
| StD | 66.08 | 65.36 | 2.34 | 957.49 | 195.18 | 37.00 | 2602.94 |
| CV (%) | 42.90 | 46.12 | 48.87 | 85.83 | 42.51 | 68.06 | 104.08 |
| N° | L/H Ratio | Number | H/W Ratio | Number | Steel Tube Type | Number |
|---|---|---|---|---|---|---|
| 1 | 0–3 | 177 | 0.75–1.25 | 337 | Cold formed | 201 |
| 2 | 3–6 | 107 | 1.25–1.75 | 73 | Welded box | 193 |
| 3 | 6–9 | 14 | 1.75–2.25 | 12 | Other | 28 |
| 4 | 9–12 | 21 | Total | 422 | Total | 422 |
| 5 | 12–15 | 25 | ||||
| 6 | 15–18 | 15 | ||||
| 7 | 18–21 | 10 | ||||
| 8 | 21–24 | 10 | ||||
| 9 | 24–27 | 16 | ||||
| 10 | 27–30 | 8 | ||||
| 11 | 30–33 | 0 | ||||
| 12 | 33–36 | 10 | ||||
| 13 | 36–39 | 0 | ||||
| 14 | 39–42 | 0 | ||||
| 15 | 42–45 | 6 | ||||
| 16 | 45–48 | 3 | ||||
| Total | 422 |
| Parameter | Notation | Value and Description |
|---|---|---|
| Neurons in input layer | ninput | 6 |
| Number of hidden layer | nlayer | 1 |
| Neurons in hidden layer | nneuron | 20 |
| Neurons in output layer | noutput | 1 |
| Number of weight parameters in hidden layer | ninput × nneuron = 120 | |
| Number of bias parameters in hidden layer | nneuron (20) | |
| Number of weight parameters in output layer | nneuron × noutput = 20 | |
| Number of bias parameters in output layer | noutput (1) | |
| Number of total parameters to be optimized | 161 | |
| Training algorithm | OSS | One Step Secant |
| Cost function | MSE | Mean square error |
| Activation function for hidden layer | Sigmoid | |
| Activation function for output layer | Linear |
| Parameter | Value and Description |
|---|---|
| Initial step size | 0.01 |
| Maximum step size | 26 |
| Search routine | linear |
| Lower limit | 0.1 |
| Upper limit | 0.5 |
| Scale tolerance | 20 |
| Maximum validation checks | 6 |
| Minimum gradient | 10−10 |
| Maximum iteration | 1000 |
| Indicator | Training Part | Testing Part | All Data |
|---|---|---|---|
| R2 | 0.986 | 0.982 | 0.984 |
| RMSE | 301.111 | 380.354 | 326.985 |
| MAE | 212.916 | 245.159 | 222.620 |
| ErrorMean | 8.605 | −10.279 | 2.922 |
| ErrorStD | 301.499 | 381.721 | 327.360 |
| Slope | 0.984 | 0.988 | 0.986 |
| SlopeAngle | 44.552 | 44.650 | 44.591 |
| Quantile | Training Actual | Predicted | Ratio | Testing Actual | Predicted | Ratio | All Data Actual | Predicted | Ratio |
|---|---|---|---|---|---|---|---|---|---|
| 0.1 | 501.71 | 478.92 | 0.955 | 577.80 | 502.51 | 0.870 | 505.59 | 494.66 | 0.978 |
| 0.2 | 682.00 | 666.38 | 0.977 | 759.93 | 766.54 | 1.009 | 716.37 | 702.09 | 0.980 |
| 0.3 | 890.00 | 903.50 | 1.015 | 909.00 | 920.13 | 1.012 | 899.69 | 912.10 | 1.014 |
| 0.4 | 1142.00 | 1164.17 | 1.019 | 1174.91 | 1193.35 | 1.016 | 1155.64 | 1175.72 | 1.017 |
| 0.5 | 1516.26 | 1520.30 | 1.003 | 1572.00 | 1510.30 | 0.961 | 1537.00 | 1515.30 | 0.986 |
| 0.6 | 2237.00 | 2234.19 | 0.999 | 2108.70 | 2222.24 | 1.054 | 2232.80 | 2222.24 | 0.995 |
| 0.7 | 2680.00 | 2673.99 | 0.998 | 2882.00 | 3093.02 | 1.073 | 2817.90 | 2795.47 | 0.992 |
| 0.8 | 3743.50 | 3732.15 | 0.997 | 4164.90 | 4045.63 | 0.971 | 3902.00 | 3899.69 | 0.999 |
| 0.9 | 5873.00 | 6018.26 | 1.025 | 6393.00 | 6453.91 | 1.010 | 6014.50 | 6074.74 | 1.010 |
| Average | 0.999 | Average | 0.997 | Average | 0.997 |
| H (mm) | W (mm) | t (mm) | L (mm) | fy (Mpa) | f’c (Mpa) | Exp. Nu (kN) | Predicted by Proposed Equation of Han et al. 2005 [119] (kN) | Predicted by Proposed Equation of Wang et al. 2017 [120] (kN) | Predicted by Proposed Equation of Ding et al. 2014 [60] (kN) | Predicted by SVM (kN) | Predicted by FL (kN) | Predicted by EBT (kN) | Predicted by FNN-OSS (kN) | Ref. |
|---|---|---|---|---|---|---|---|---|---|---|---|---|---|---|
| 150 | 150 | 4.5 | 600 | 438.4 | 31.9 | 1623.1 | 1950.7 | 1674.0 | 2011.4 | 2134.2 | 2242.4 | 1282.6 | 1690.7 | [65] |
| 150 | 150 | 4.5 | 1200 | 438.4 | 31.9 | 1611.2 | 1950.7 | 1674.0 | 2011.4 | 2013.9 | 2107.3 | 1266.9 | 1613.8 | |
| 150 | 150 | 4.5 | 1800 | 438.4 | 31.9 | 1598.2 | 1950.7 | 1674.0 | 2011.4 | 1893.5 | 1972.1 | 1266.9 | 1549.2 | |
| 150 | 150 | 4.5 | 2700 | 438.4 | 31.9 | 1378.0 | 1950.7 | 1674.0 | 2011.4 | 1712.9 | 1769.4 | 1239.5 | 1446.1 | |
| 150 | 150 | 4.5 | 3600 | 438.4 | 31.9 | 1161.8 | 1950.7 | 1674.0 | 2011.4 | 1532.3 | 1566.7 | 1152.4 | 1253.5 | |
| 150 | 150 | 4.5 | 4500 | 438.4 | 31.9 | 923.7 | 1950.7 | 1674.0 | 2011.4 | 1351.7 | 1363.9 | 1152.4 | 1091.0 | |
| 100.2 | 100.2 | 2.18 | 300.6 | 300.0 | 25.7 | 609.0 | 542.7 | 461.6 | 543.8 | 165.6 | −108.9 | 621.1 | 492.3 | [86] |
| 200.3 | 200.3 | 4.35 | 600.9 | 322.0 | 29.6 | 2230.0 | 2421.2 | 2050.0 | 2404.1 | 2907.4 | 3314.9 | 2247.6 | 2262.0 | |
| 300.5 | 300.5 | 6.1 | 901.5 | 395.0 | 26.5 | 5102.0 | 5443.9 | 4682.0 | 5607.5 | 5535.8 | 6561.6 | 4467.1 | 4835.7 | |
| 100.1 | 100.1 | 2.18 | 300.3 | 300.0 | 53.7 | 851.0 | 872.9 | 712.4 | 799.6 | 590.7 | 376.3 | 791.2 | 708.9 | |
| 200.1 | 200.1 | 4.35 | 600.3 | 322.0 | 57.9 | 3201.0 | 3754.5 | 3062.8 | 3437.2 | 3334.9 | 3802.7 | 2790.6 | 3231.9 | |
| 300.7 | 300.7 | 6.1 | 902.1 | 395.0 | 52.2 | 6496.0 | 8191.4 | 6782.8 | 7751.9 | 5932.0 | 7014.5 | 6038.7 | 6509.3 | |
| 100.1 | 100.1 | 2.18 | 300.3 | 300.0 | 61.0 | 911.0 | 959.3 | 778.0 | 866.5 | 702.0 | 503.4 | 816.6 | 775.9 | |
| 200.3 | 200.3 | 4.35 | 600.9 | 322.0 | 63.7 | 3417.0 | 4035.5 | 3276.8 | 3655.9 | 3427.5 | 3909.0 | 2828.7 | 3435.8 | |
| 110 | 110 | 5 | 330 | 784.2 | 28.0 | 1836.0 | 2093.5 | 1837.1 | 2256.2 | 2081.5 | 1874.7 | 2101.4 | 1913.9 | [79] |
| 110 | 110 | 5 | 330 | 784.2 | 28.0 | 1832.0 | 2093.5 | 1837.1 | 2256.2 | 2081.5 | 1874.7 | 2101.4 | 1913.9 | |
| 160 | 160 | 5 | 480 | 784.2 | 30.0 | 2868.0 | 3257.3 | 2918.5 | 3592.2 | 3150.2 | 3212.3 | 3046.3 | 2824.6 | |
| 160 | 160 | 5 | 480 | 784.2 | 30.0 | 2922.0 | 3257.3 | 2918.5 | 3592.2 | 3150.2 | 3212.3 | 3046.3 | 2824.6 | |
| 210 | 210 | 5 | 630 | 784.2 | 32.0 | 3710.0 | 4678.3 | 4149.1 | 5138.3 | 4219.0 | 4549.9 | 3613.9 | 3894.0 | |
| 210 | 210 | 5 | 630 | 784.2 | 32.0 | 3483.0 | 4678.3 | 4149.1 | 5138.3 | 4219.0 | 4549.9 | 3613.9 | 3894.0 | |
| 100 | 100 | 1.9 | 300 | 404.0 | 96.1 | 1209.0 | 1410.2 | 1136.9 | 1250.5 | 1366.2 | 1183.2 | 1005.1 | 1044.1 | [90] |
| 100 | 100 | 1.9 | 300 | 404.0 | 96.1 | 1220.0 | 1410.2 | 1136.9 | 1250.5 | 1366.2 | 1183.2 | 1005.1 | 1044.1 | |
| 100 | 100 | 1.9 | 300 | 404.0 | 96.1 | 1190.0 | 1410.2 | 1136.9 | 1250.5 | 1366.2 | 1183.2 | 1005.1 | 1044.1 | |
| 100 | 100 | 1.9 | 300 | 404.0 | 96.1 | 1220.0 | 1410.2 | 1136.9 | 1250.5 | 1366.2 | 1183.2 | 1005.1 | 1044.1 | |
| 100 | 100 | 1.9 | 900 | 404.0 | 96.1 | 1013.0 | 1410.2 | 1136.9 | 1250.5 | 1245.8 | 1048.1 | 979.8 | 1140.7 | |
| 100 | 100 | 1.9 | 900 | 404.0 | 96.1 | 1010.0 | 1410.2 | 1136.9 | 1250.5 | 1245.8 | 1048.1 | 979.8 | 1140.7 | |
| 100 | 100 | 1.9 | 1500 | 404.0 | 96.1 | 915.0 | 1410.2 | 1136.9 | 1250.5 | 1125.4 | 912.9 | 979.8 | 1225.9 | |
| 100 | 100 | 1.9 | 1500 | 404.0 | 96.1 | 945.0 | 1410.2 | 1136.9 | 1250.5 | 1125.4 | 912.9 | 979.8 | 1225.9 | |
| 100 | 100 | 1.9 | 3000 | 404.0 | 96.1 | 474.0 | 1410.2 | 1136.9 | 1250.5 | 824.4 | 575.0 | 488.7 | 478.9 | |
| 100 | 100 | 1.9 | 3000 | 404.0 | 96.1 | 466.0 | 1410.2 | 1136.9 | 1250.5 | 824.4 | 575.0 | 488.7 | 478.9 | |
| 150 | 150 | 8 | 450 | 779.0 | 152.3 | 6536.0 | 7813.8 | 6055.8 | 6982.4 | 5572.8 | 6060.2 | 6403.0 | 7010.3 | [85] |
| 150 | 150 | 8 | 450 | 779.0 | 157.2 | 6715.0 | 7943.9 | 6142.0 | 7070.4 | 5647.6 | 6145.6 | 6403.0 | 6916.8 | |
| 150 | 150 | 8 | 450 | 779.0 | 147.0 | 6616.0 | 7673.1 | 5962.5 | 6887.3 | 5492.0 | 5967.9 | 6375.1 | 7079.1 | |
| 150 | 150 | 8 | 450 | 779.0 | 164.1 | 7276.0 | 8127.1 | 6263.5 | 7194.3 | 5752.8 | 6265.8 | 6403.0 | 6739.8 | |
| 150 | 150 | 8 | 450 | 779.0 | 148.0 | 6974.0 | 7699.6 | 5980.1 | 6905.2 | 5507.2 | 5985.3 | 6403.0 | 7068.8 | |
| 150 | 150 | 12 | 450 | 756.0 | 152.3 | 8585.0 | 10,076.1 | 7174.7 | 8427.2 | 6561.1 | 7338.7 | 7837.1 | 8722.7 | |
| 150 | 150 | 12 | 450 | 756.0 | 157.2 | 8452.0 | 10,206.2 | 7250.9 | 8505.0 | 6635.8 | 7424.1 | 7837.1 | 8633.5 | |
| 150 | 150 | 12 | 450 | 756.0 | 147.0 | 8687.0 | 9935.4 | 7092.2 | 8343.1 | 6480.2 | 7246.4 | 7723.4 | 8802.9 | |
| 150 | 150 | 12 | 450 | 756.0 | 164.1 | 8730.0 | 10,389.4 | 7358.3 | 8614.5 | 6741.1 | 7544.3 | 7837.1 | 8477.2 | |
| 150 | 150 | 12 | 450 | 756.0 | 148.0 | 8912.0 | 9962.0 | 7107.8 | 8358.9 | 6495.5 | 7263.8 | 7837.1 | 8789.0 | |
| 150 | 150 | 12.5 | 450 | 446.0 | 152.3 | 5953.0 | 7796.7 | 5212.4 | 6059.2 | 6082.8 | 7015.5 | 6100.8 | 6055.0 | |
| 150 | 150 | 12.5 | 450 | 446.0 | 157.2 | 5911.0 | 7926.8 | 5287.4 | 6135.8 | 6157.5 | 7100.9 | 6100.8 | 6042.5 | |
| 150 | 150 | 12.5 | 450 | 446.0 | 147.0 | 6039.0 | 7655.9 | 5131.2 | 5976.4 | 6002.0 | 6923.2 | 6015.0 | 6036.6 | |
| 150 | 150 | 12.5 | 450 | 446.0 | 164.1 | 6409.0 | 8109.9 | 5393.0 | 6243.6 | 6262.8 | 7221.1 | 6100.8 | 5980.2 | |
| 150 | 150 | 12.5 | 450 | 446.0 | 148.0 | 6285.0 | 7682.5 | 5146.5 | 5992.0 | 6017.2 | 6940.6 | 6100.8 | 6042.6 | |
| 197 | 197 | 6.4 | 600 | 437.9 | 21.0 | 2730.0 | 3038.9 | 2665.7 | 3276.4 | 3462.5 | 3933.0 | 3032.7 | 2879.8 | [92] |
| 198.5 | 198.5 | 6.1 | 600 | 437.9 | 20.4 | 3010.0 | 2931.7 | 2581.4 | 3174.5 | 3407.7 | 3863.9 | 2919.2 | 2808.2 | |
| 200.5 | 200.5 | 6.3 | 600 | 437.9 | 19.3 | 2830.0 | 2991.0 | 2639.0 | 3254.0 | 3486.0 | 3964.7 | 2919.2 | 2865.5 | |
| 201 | 201 | 10.3 | 600 | 381.7 | 21.0 | 3980.0 | 4165.4 | 3459.7 | 4281.9 | 4445.3 | 5233.3 | 3955.0 | 3689.9 | |
| 201 | 201 | 10 | 600 | 381.7 | 20.4 | 3920.0 | 4028.7 | 3366.3 | 4167.2 | 4358.5 | 5124.1 | 3955.0 | 3567.5 | |
| 199.5 | 199.5 | 10.1 | 600 | 381.7 | 19.3 | 3900.0 | 3981.2 | 3325.7 | 4126.1 | 4336.2 | 5098.5 | 3685.4 | 3542.5 | |
| Min of Δ | 89.1 | 75.8 | 89.3 | 27.2 | −17.9 | 78.6 | 80.8 | |||||||
| Mean of Δ | 128.3 | 103.3 | 120.4 | 106.7 | 107.3 | 96.0 | 100.4 | |||||||
| Max of Δ | 302.6 | 244.0 | 268.3 | 176.9 | 148.7 | 124.8 | 134.0 | |||||||
| StD of Δ | 40.0 | 33.5 | 37.0 | 25.6 | 28.4 | 9.8 | 10.2 | |||||||
| CoV of Δ | 31.1 | 32.4 | 30.7 | 24.0 | 26.4 | 10.2 | 10.2 |
© 2020 by the authors. Licensee MDPI, Basel, Switzerland. This article is an open access article distributed under the terms and conditions of the Creative Commons Attribution (CC BY) license (http://creativecommons.org/licenses/by/4.0/).
Share and Cite
Nguyen, Q.H.; Ly, H.-B.; Tran, V.Q.; Nguyen, T.-A.; Phan, V.-H.; Le, T.-T.; Pham, B.T. A Novel Hybrid Model Based on a Feedforward Neural Network and One Step Secant Algorithm for Prediction of Load-Bearing Capacity of Rectangular Concrete-Filled Steel Tube Columns. Molecules 2020, 25, 3486. https://doi.org/10.3390/molecules25153486
Nguyen QH, Ly H-B, Tran VQ, Nguyen T-A, Phan V-H, Le T-T, Pham BT. A Novel Hybrid Model Based on a Feedforward Neural Network and One Step Secant Algorithm for Prediction of Load-Bearing Capacity of Rectangular Concrete-Filled Steel Tube Columns. Molecules. 2020; 25(15):3486. https://doi.org/10.3390/molecules25153486
Chicago/Turabian StyleNguyen, Quang Hung, Hai-Bang Ly, Van Quan Tran, Thuy-Anh Nguyen, Viet-Hung Phan, Tien-Thinh Le, and Binh Thai Pham. 2020. "A Novel Hybrid Model Based on a Feedforward Neural Network and One Step Secant Algorithm for Prediction of Load-Bearing Capacity of Rectangular Concrete-Filled Steel Tube Columns" Molecules 25, no. 15: 3486. https://doi.org/10.3390/molecules25153486
APA StyleNguyen, Q. H., Ly, H.-B., Tran, V. Q., Nguyen, T.-A., Phan, V.-H., Le, T.-T., & Pham, B. T. (2020). A Novel Hybrid Model Based on a Feedforward Neural Network and One Step Secant Algorithm for Prediction of Load-Bearing Capacity of Rectangular Concrete-Filled Steel Tube Columns. Molecules, 25(15), 3486. https://doi.org/10.3390/molecules25153486