
Study on FcγRn Electrochemical Receptor Sensor and Its Kinetics


Abstract
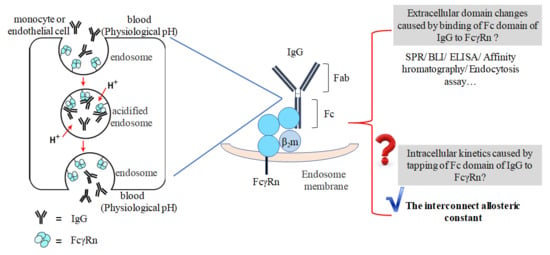
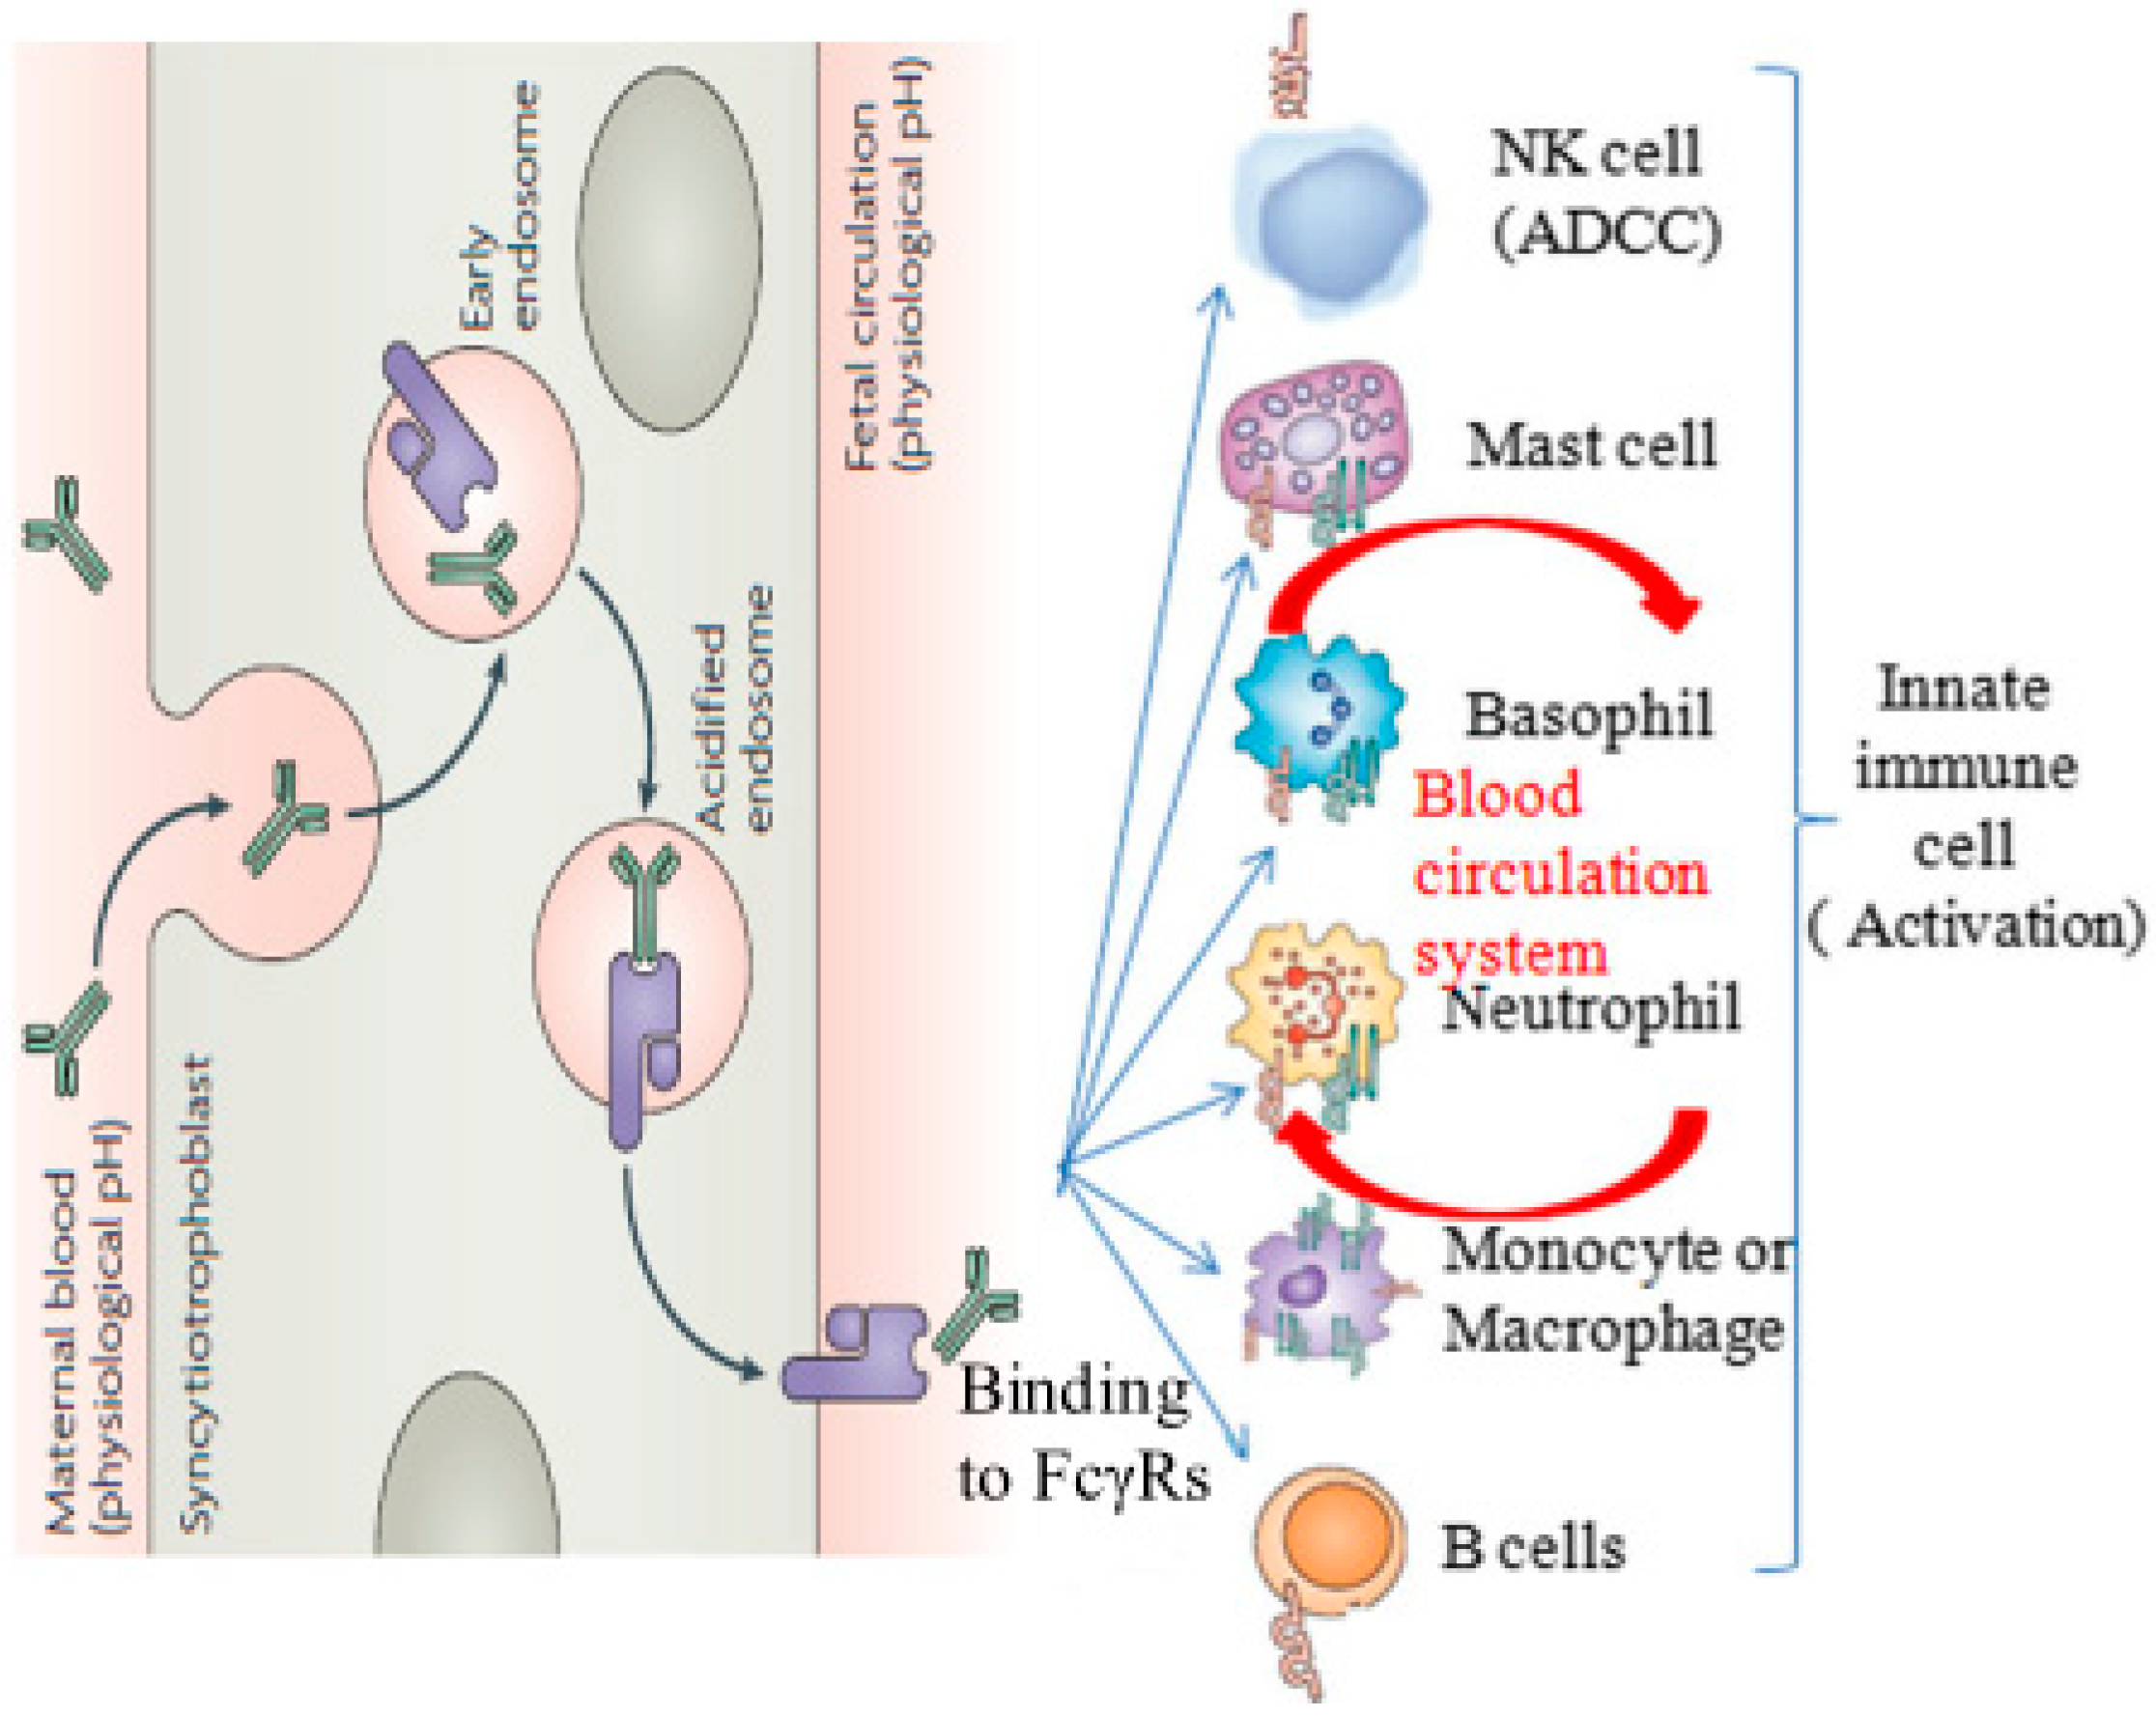
1. Introduction
2. Result
2.1. Ultraviolet–Visible Light (UV-Vis) Scanning and TEM Characterization of Gold Nanosol
2.2. Electrochemical Characterization of the Assembly Process of hFcγRn Electrochemical Receptor Sensor
2.3. Optimization of Determination Conditions of hFcγRn Electrochemical Receptor Sensor
2.3.1. Determination of Constant Voltage
2.3.2. Determination of Data Collection Time
2.4. The effect of IgG on hFcγRn Receptor
2.4.1. The Interaction between IgG and FcγRn Receptor
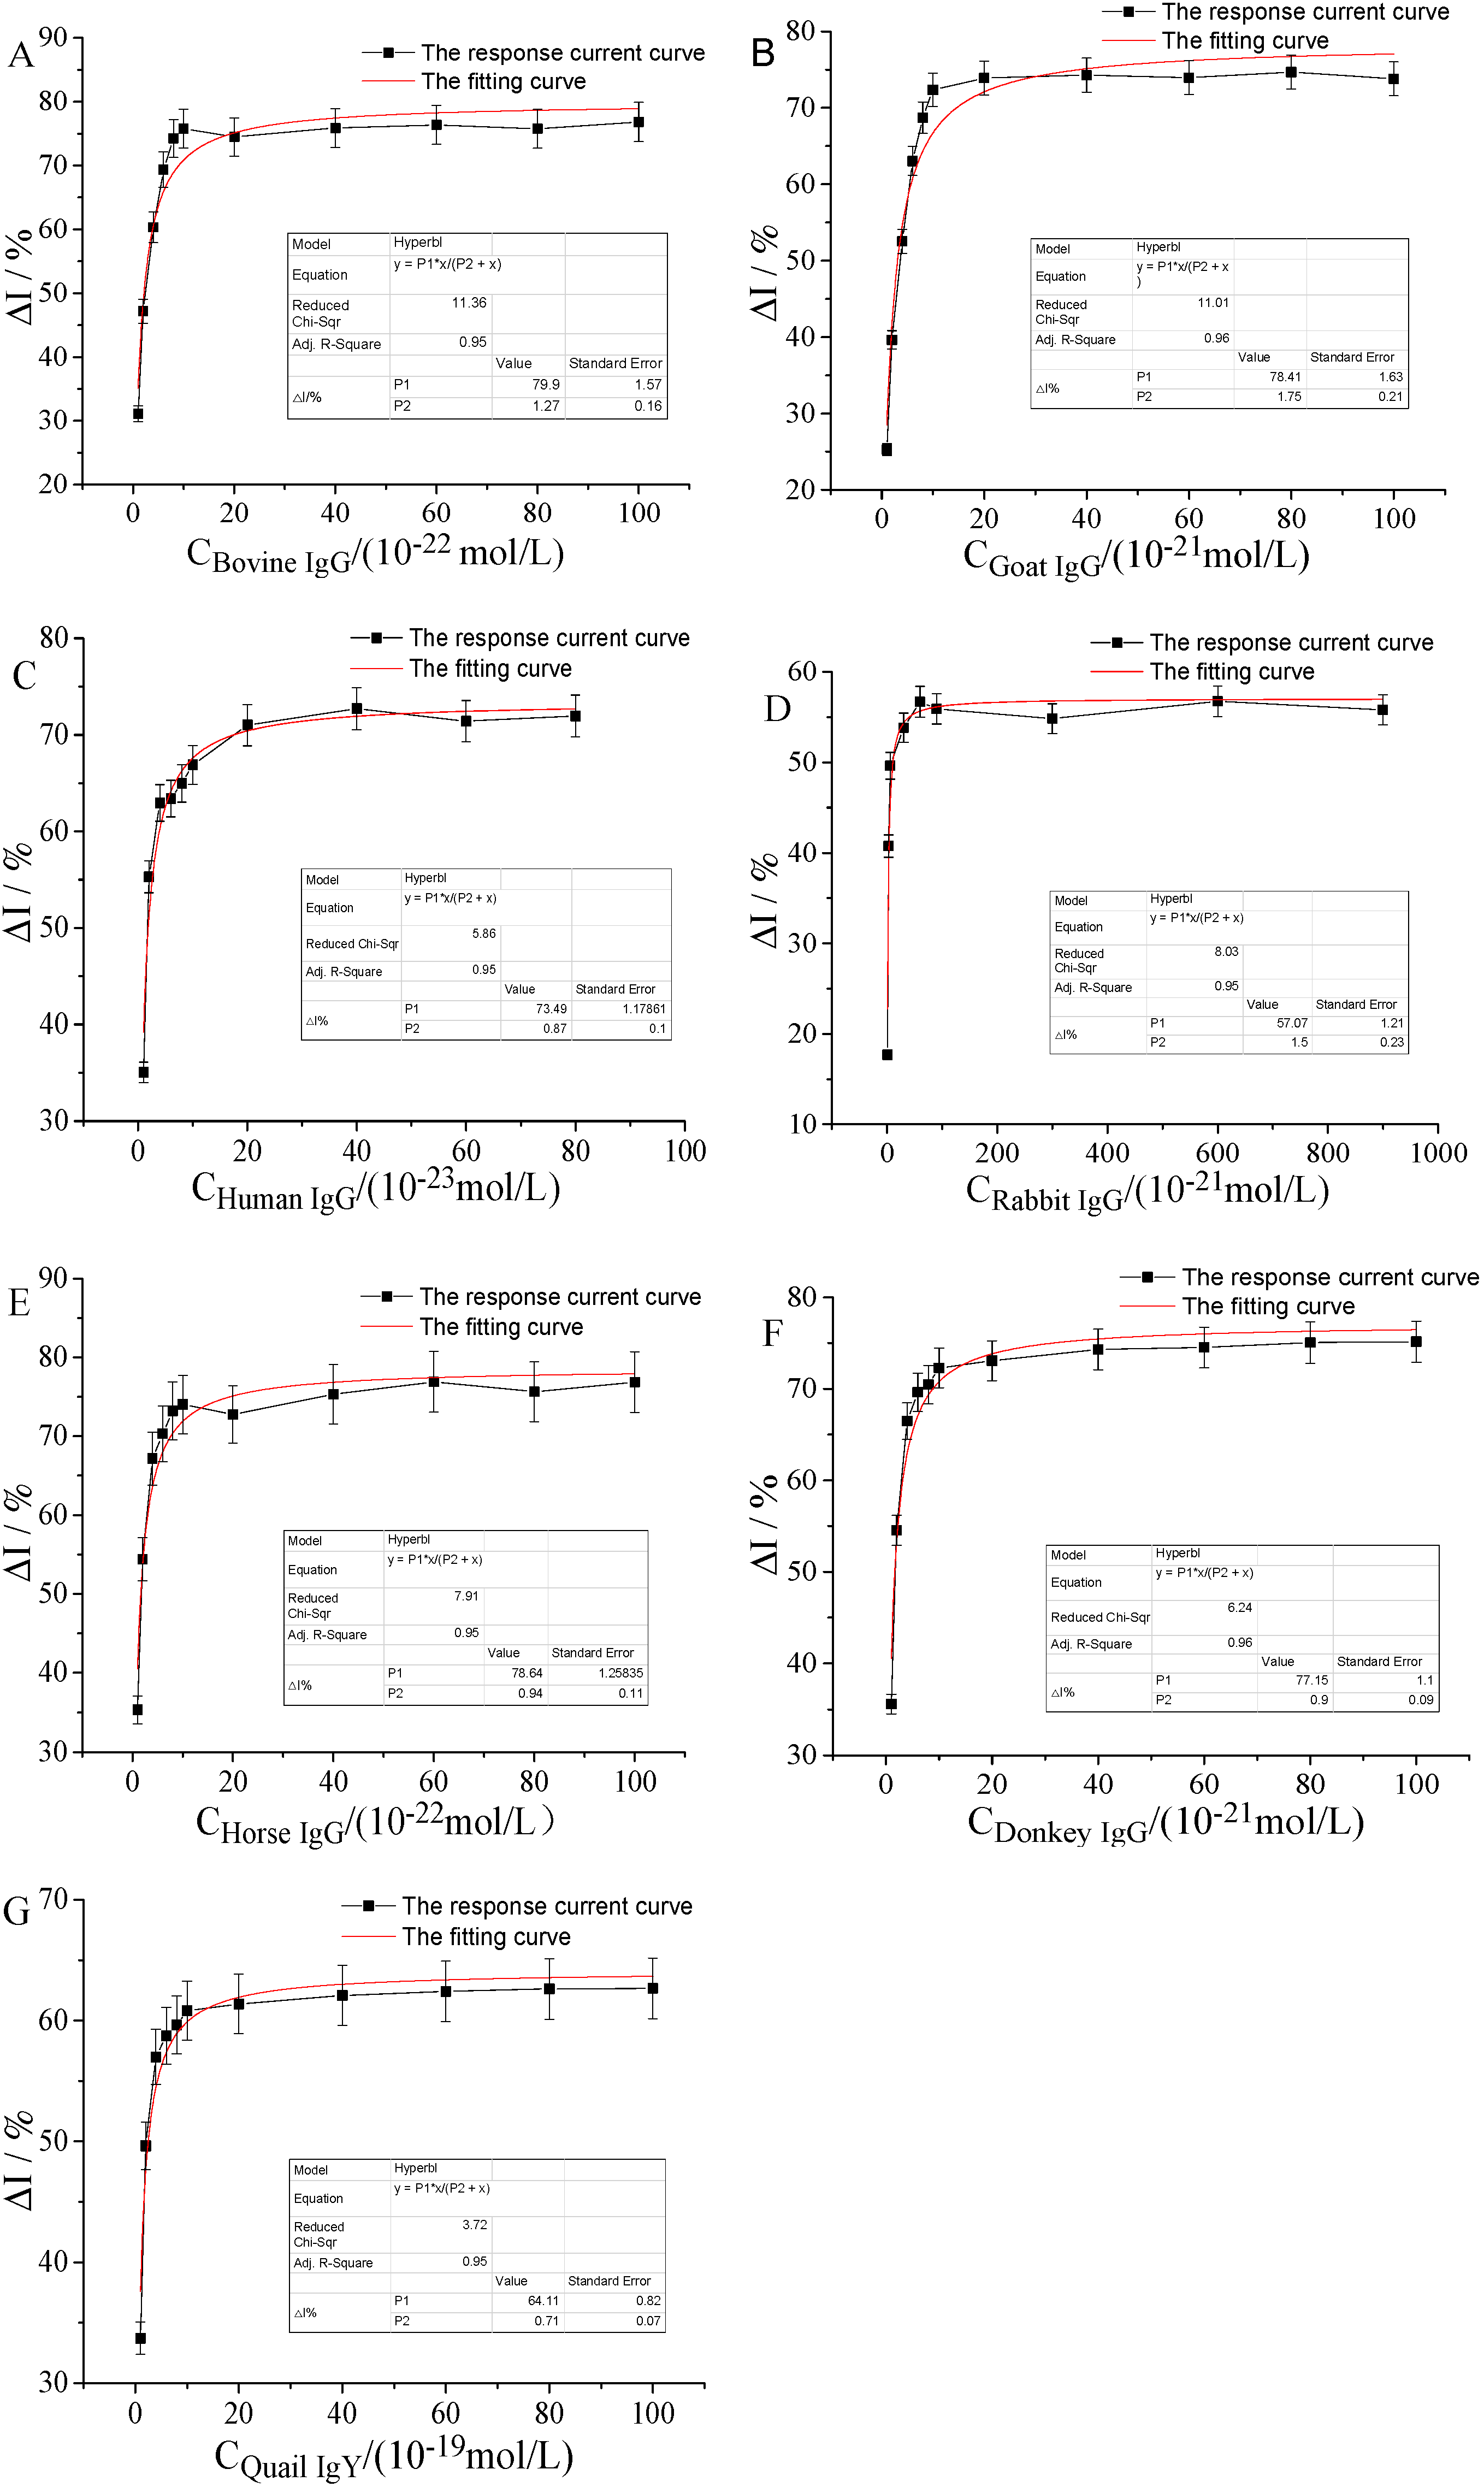
2.4.2. Kinetic Interaction Curve of IgG and FcγRn Receptor
2.4.3. Linkage Allosteric Constant of the Interaction between IgG and hFcγRn Receptor
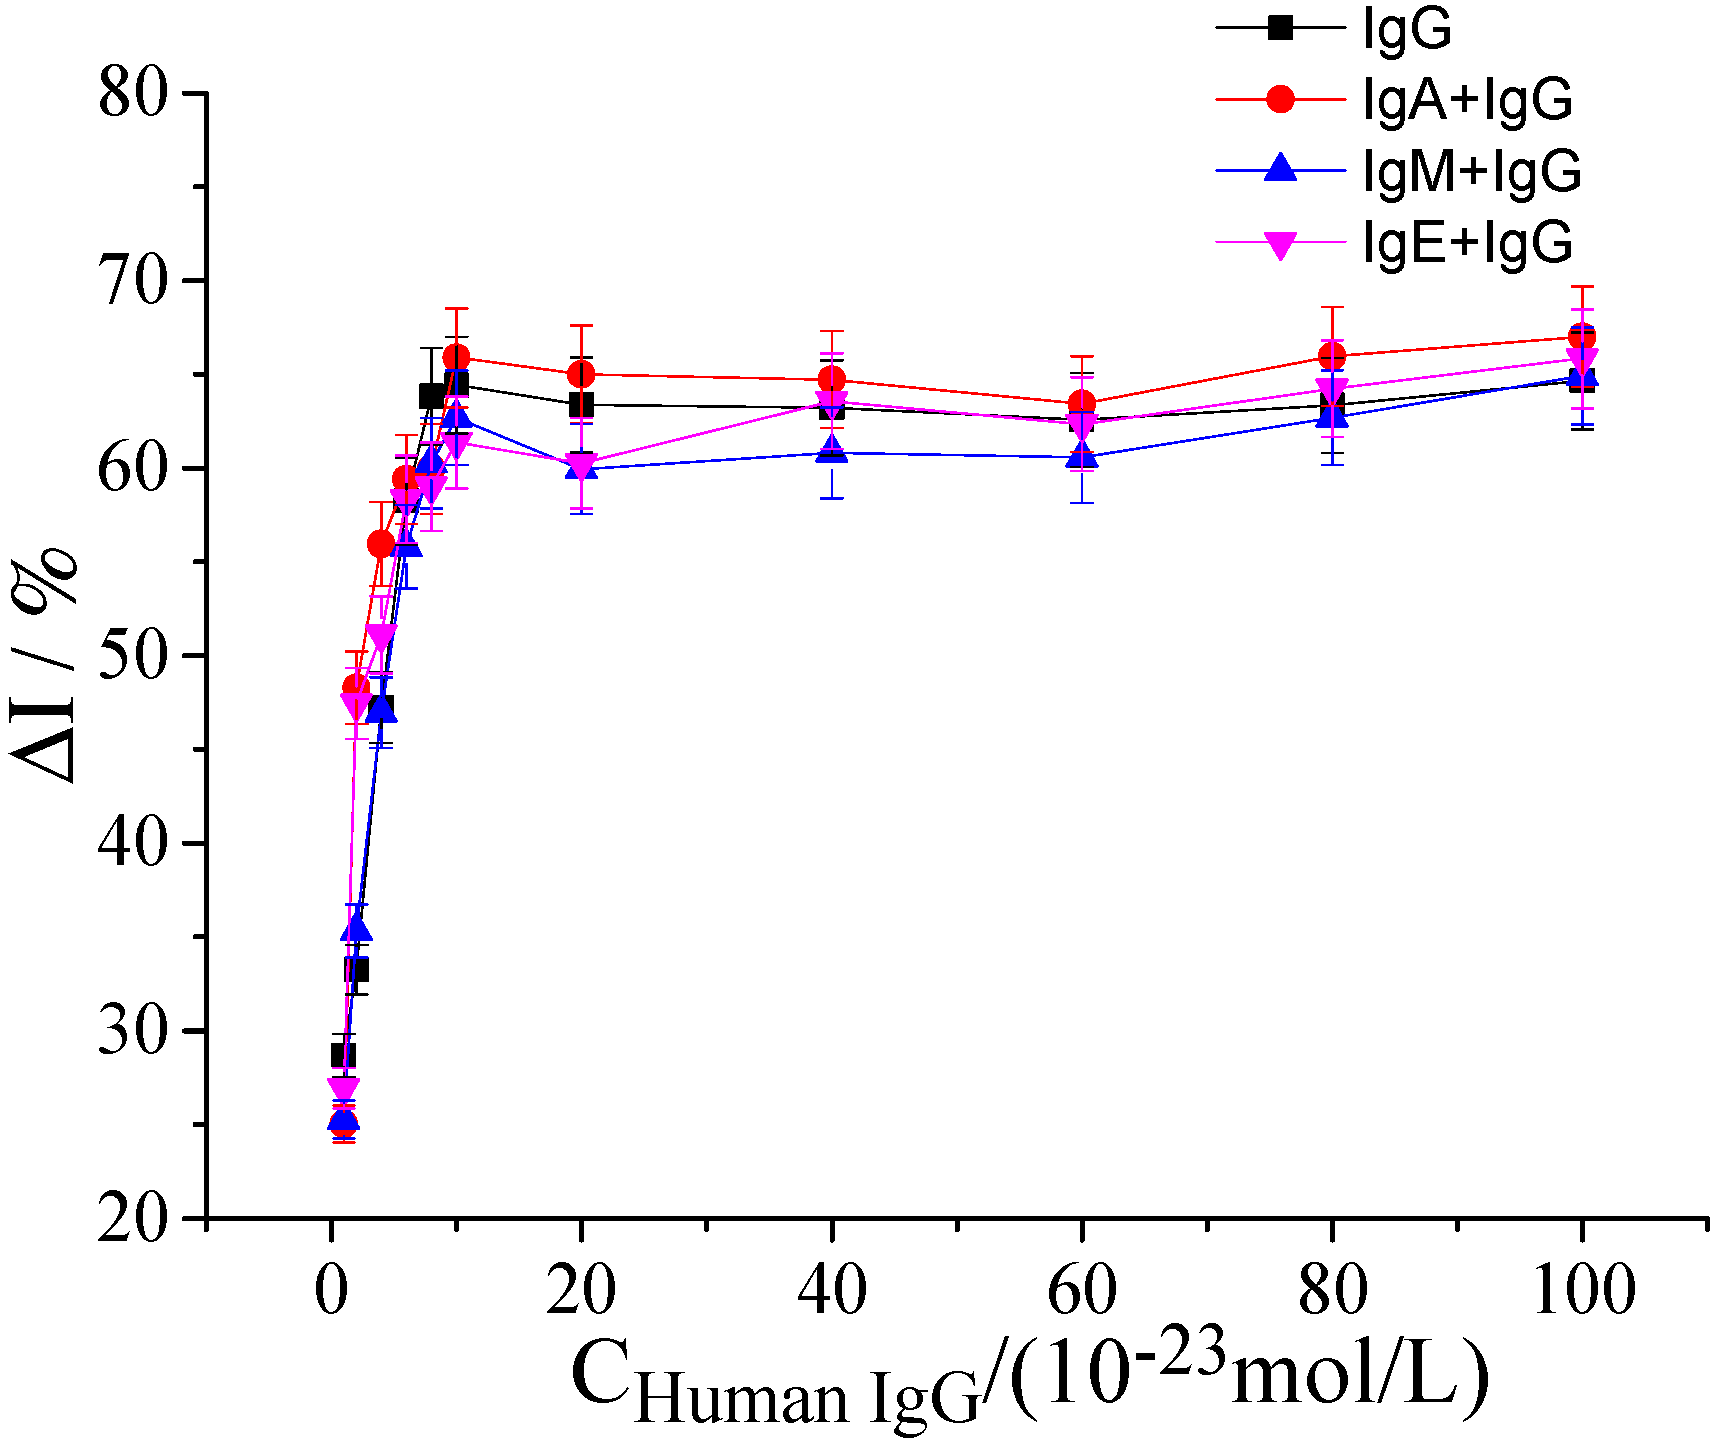
2.5. Determination of Specificity, Stability, and Reproducibility of hFcγRn Electrochemical Receptor Sensor
2.5.1. Specificity of hFcγRn Electrochemical Receptor Sensor
2.5.2. Stability of hFcγRn Electrochemical Receptor Sensor
2.5.3. Reproducibility of hFcγRn Electrochemical Receptor Sensor
3. Discussion
4. Materials and Methods
4.1. Reagent
4.2. Equipment
4.3. Preparation of hFcγRn Double-Layer Nanogold Electrochemical Receptor Sensor
4.3.1. Preparation and Characterization of Gold Nanoparticle Sol
4.3.2. Pretreatment and Characterization of Glassy Carbon Electrode
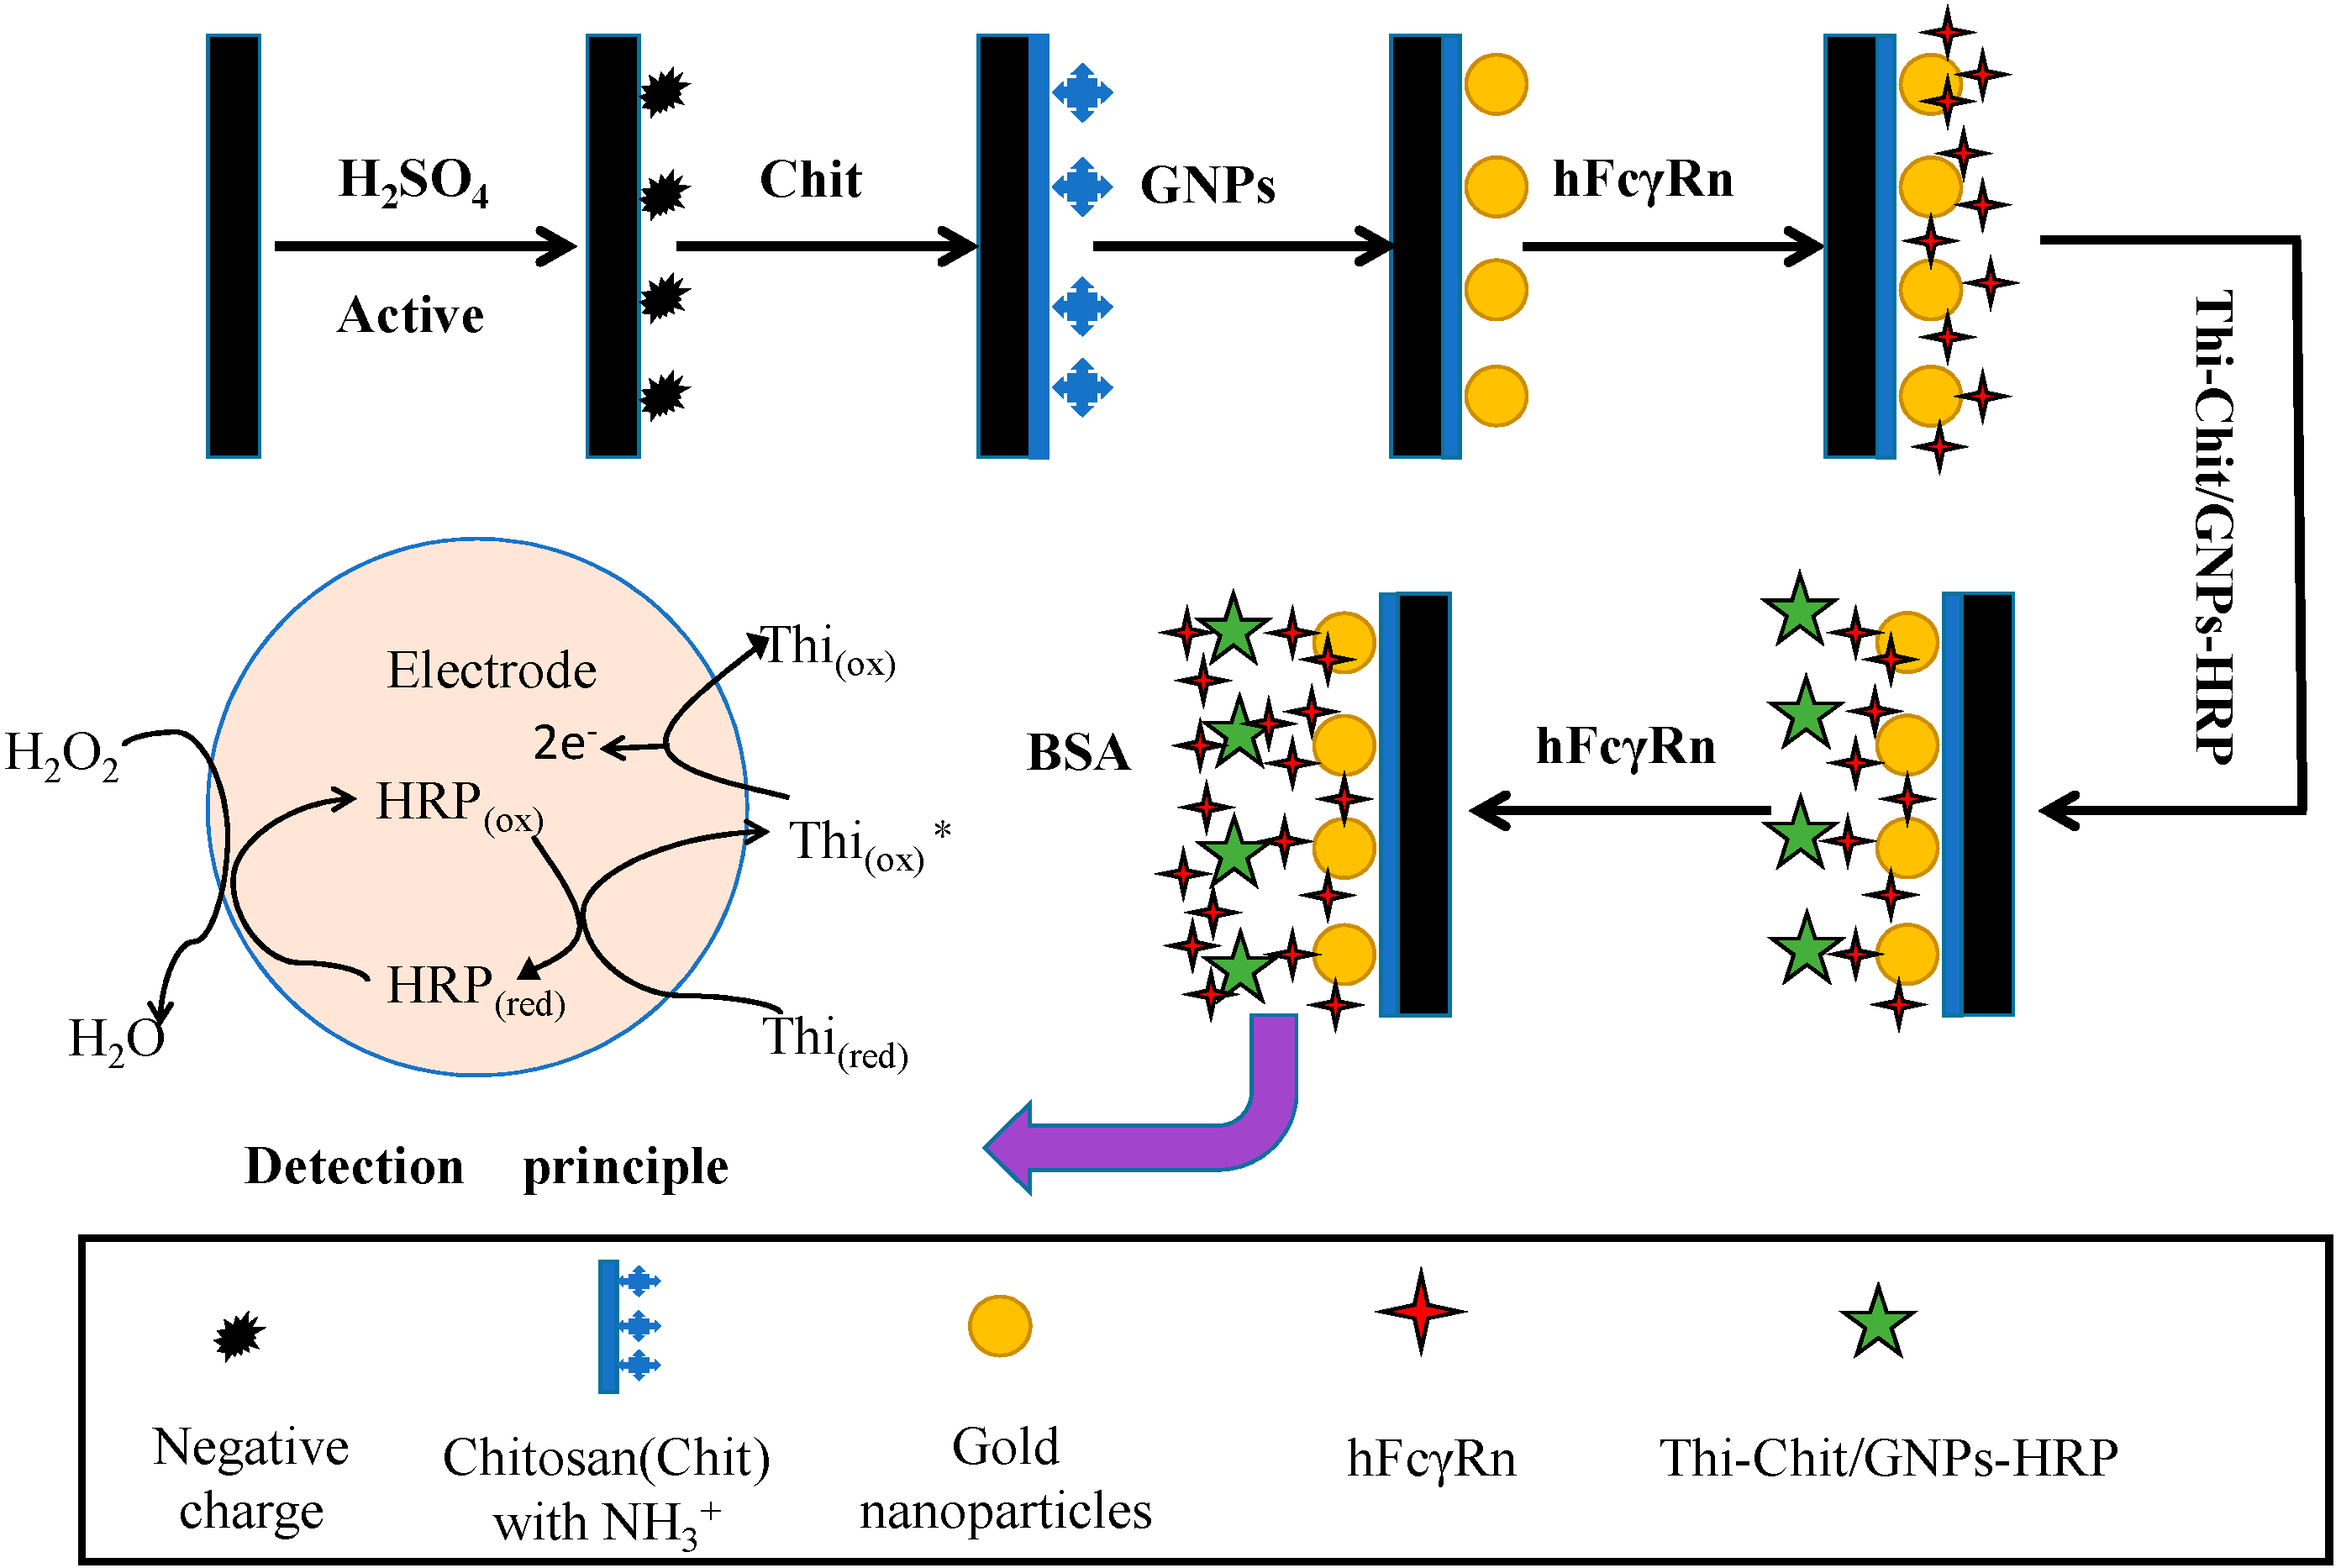
4.3.3. Assembly Method of hFcγRn Electrochemical Receptor Sensor
4.4. Determination of Different Kinds of IgG Using hFcγRn Double-Layer Nanogold Electrochemical Receptor Sensor
4.5. Data Analysis
5. Conclusions
Author Contributions
Funding
Conflicts of Interest
References
- Simister, N.E.; Mostov, K.E. An Fc receptor structurally related to MHC class I antigens. Nature 1989, 337, 184–187. [Google Scholar] [CrossRef]
- Le, D.K.; Taylor, S.; Allen, L.; Gorringe, A.; Heath, P.T.; Kampmann, B.; Hesseling, A.C.; Jones, C.E. Placental transfer of anti-group B Streptococcus immunoglobulin G antibody subclasses from HIV-infected and uninfected women to their uninfected infants. Aids 2016, 30, 471–475. [Google Scholar]
- Rath, T.; Kuo, T.T.; Baker, K.; Qiao, S.W.; Kobayashi, K.; Yoshida, M.; Blumberg, R.S. The Immunologic Functions of the Neonatal Fc Receptor for IgG. J. Clin. Immunol. 2013, 33, 9–17. [Google Scholar] [CrossRef]
- Veronesi, M.C.; Dall”Ara, P.; Gloria, A.; Servida, F.; Sala, E.; Robbe, D. IgG, IgA, and lysozyme in Martina Franca donkey jennies and their foals. Theriogenology 2014, 81, 825–831. [Google Scholar] [CrossRef]
- Roopenian, D.C.; Christianson, G.J.; Sproule, T.J.; Brown, A.C.; Akilesh, S.; Jung, N.; Petkova, S.; Avanessian, L.; Choi, E.Y.; Shaffer, D.J.; et al. The MHC Class I-Like IgG Receptor Controls Perinatal IgG Transport, IgG Homeostasis, and Fate of IgG-Fc-Coupled Drugs. Nat. Rev. Immunol. 2003, 170, 3528–3533. [Google Scholar] [CrossRef] [PubMed]
- Bryan, S.; Andrea, K.; Rocio, L.G.; Dixon, K.L.; Louis, C.; Catley, M.C.; Paul, A.; Lena, E.D.; Helene, F.; Kevin, G.; et al. Generation and characterization of a high affinity anti-human FcRn antibody, rozanolixizumab, and the effects of different molecular formats on the reduction of plasma IgG concentration. Mabs 2018, 10, 1111–1130. [Google Scholar]
- Anderson, C.; Kim, J. Surmounting an Impasse of FcRn Structure. Structure 2013, 21, 1907–1908. [Google Scholar] [CrossRef][Green Version]
- Sand, K.M.K.; Dalhus, B.; Christianson, G.J.; Bern, M.; Foss, S.; Cameron, J.; Roopenian, D.C.; Sandlie, I.; Andersen, J.T. Dissection of the Neonatal Fc Receptor (FcRn)-Albumin Interface Using Mutagenesis and Anti-FcRn Albumin-blocking Antibodies. J. Biol. Chem. 2014, 289, 17228–17239. [Google Scholar] [CrossRef] [PubMed]
- Tzaban, S.; Massol, R.H.; Yen, E.; Hamman, W.; Frank, S.R.; Lapierre, L.A.; Hansen, S.H.; Goldenring, J.R.; Blumberg, R.S.; Lencer, W.I. The recycling and transcytotic pathways for IgG transport by FcRn are distinct and display an inherent polarity. J. Cell Biol. 2009, 185, 673–684. [Google Scholar] [CrossRef] [PubMed]
- Chaudhury, C.; Mehnaz, S.; Robinson, J.M.; Hayton, W.L.; Pearl, D.K.; Roopenian, D.C.; Anderson, C.L. The Major Histocompatibility Complex-related Fc Receptor for IgG (FcRn) Binds Albumin and Prolongs Its Lifespan. J. Exp. Med. 2003, 197, 315–322. [Google Scholar] [CrossRef]
- Schmidt, M.M.; Townson, S.A.; Andreucci, A.J.; King, B.M.; Schirmer, E.B.; Murillo, A.J.; Dombrowski, C.; Tisdale, A.W.; Lowden, P.A.; Masci, A.L.; et al. Crystal Structure of an HSA/FcRn Complex Reveals Recycling by Competitive Mimicry of HSA Ligands at a pH-Dependent Hydrophobic Interface. Structure 2013, 21, 1966–1978. [Google Scholar] [CrossRef] [PubMed]
- Li, T.; Balthasar, J.P. Development and Evaluation of a Physiologically Based Pharmacokinetic Model for Predicting the Effects of Anti-FcRn Therapy on the Disposition of Endogenous IgG in Humans. J. Pharm. Sci. 2019, 108, 714–724. [Google Scholar] [CrossRef]
- Roopenian, D.C.; Akilesh, S. FcRn: The neonatal Fc receptor comes of age. Nat. Rev. Immunol. 2007, 7, 715–725. [Google Scholar] [CrossRef] [PubMed]
- Nezlin, R. Circulating non-immune IgG complexes in health and disease. Immunol. Lett. 2009, 122, 141–144. [Google Scholar] [CrossRef] [PubMed]
- Zhao, M.; Liu, T.; Pang, G. Intercellular wireless communication network between mother and fetus in rat pregnancy-a study on directed and weighted network. Reprod. Biol. Endocrin. 2019. [Google Scholar] [CrossRef]
- Albanesi, M.; Daëron, M. The interactions of therapeutic antibodies with Fc receptors. Immunol. Lett. 2012, 143, 20–27. [Google Scholar] [CrossRef]
- Simister, N.E.; Rees, A.R. Isolation and characterization of an Fc receptor from neonatal rat small intestine. Eur. J. Immunol. 1985, 15, 733–738. [Google Scholar] [CrossRef]
- Dall’Ozzo, S.; Tartas, S.; Paintaud, G.; Cartron, G.; Colombat, P.; Bardos, P.; Watier, H.; Thibault, G. Rituximab-Dependent Cytotoxicity by Natural Killer Cells: Influence of FCGR3A Polymorphism on the Concentration-Effect Relationship. Cancer Res. 2004, 64, 4664–4669. [Google Scholar] [CrossRef]
- Healy, C.M.; Rench, M.A.; Montesinos, D.P.; Ng, N.; Swaim, L.S. Knowledge and attitiudes of pregnant women and their providers towards recommendations for immunization during pregnancy. Vaccine 2015, 33, 5445–5451. [Google Scholar] [CrossRef]
- McCarthy, M. Vaccinating pregnant women against flu reduces newborns’ risk of infection, study finds. BMJ 2016, 353, i2469. [Google Scholar] [CrossRef]
- Fonte, P.; Araújo, F.; Silva, C.; Pereira, C.; Reis, S.; Santos, H.A.; Sarmento, B. Polymer-based nanoparticles for oral insulin delivery: Revisited approaches. Biotechnol. Adv. 2015, 33, 1342–1354. [Google Scholar] [CrossRef] [PubMed]
- Chouhan, R.; Goswami, S.; Bajpai, A.K. Chapter 15–Recent advancements in oral delivery of insulin: From challenges to solutions. Nanostruct. Oral Med. 2017, 435–465. [Google Scholar] [CrossRef]
- Barnhart, B.C.; Quigley, M. The role of Fc-FcγR interactions in the antitumor activity of therapeutic antibodies. Immunol. Cell Biol. 2016, 95, 340–346. [Google Scholar] [CrossRef]
- Perre, P.V.D. Transfer of antibody via mother’s milk. Vaccine 2003, 21, 3374–3376. [Google Scholar] [CrossRef]
- Wen, Y.; He, Q.; Ding, J.; Wang, H.; Hou, Q.; Zheng, Y.; Li, C.; Ma, Y.; Zhang, H.; Kwok, L.Y. Cow, yak, and camel milk diets differentially modulated the systemic immunity and fecal microbiota of rats. Sci. Bull. 2017, 62, 405–414. [Google Scholar] [CrossRef]
- Hurley, W.L.; Theil, P.K. Perspectives on Immunoglobulins in Colostrum and Milk. Nutrients 2011, 3, 442–474. [Google Scholar] [CrossRef]
- Guryanov, I.; Fiorucci, S.; Tennikova, T. Receptor-ligand interactions: Advanced biomedical applications. Mat. Sci. Eng. C Mater. 2016, 68, 890–903. [Google Scholar] [CrossRef] [PubMed]
- Du, L.; Wu, C.; Lu, F.; Liu, Q.; Huang, L.; Wang, P. Recent Advances in Olfactory Receptor Biosensors and Cell Signaling Cascade Amplification Systems. Sensormate 2018, 30, 67–87. [Google Scholar]
- Zhang, Y.; Wang, G.; Yang, L.; Wang, F.; Liu, A. Recent advances in gold nanostructures based biosensing and bioimaging. Coordin. Chem. Rev. 2018, 370, 1–21. [Google Scholar] [CrossRef]
- Xiang, Y.; Liu, H.; Yang, J.; Shi, Z.; Tan, Y.; Jin, J.; Wang, R.; Zhang, S.; Wang, J. Biochar decorated with gold nanoparticles for electrochemical sensing application. Electrochim. Acta 2018, 261, 464–473. [Google Scholar] [CrossRef]
- Pollastrini, J.; Dillon, T.M.; Bondarenko, P.; Chou, R.Y.T. Field flow fractionation for assessing neonatal Fc receptor and Fcγ receptor binding to monoclonal antibodies in solution. Anal. Biochem. 2011, 414, 88–98. [Google Scholar] [CrossRef] [PubMed]
- Pang, G.; Qiao, D.; Chen, Q.; Hu, Z.; Xie, J. Heterogeneous IgG interacts with FcRn and its transport across gastrointestinal barrier. Food Agric. Immunol. 2015, 26, 371–380. [Google Scholar] [CrossRef]
- Mathur, A.; Arora, T.; Liu, L.; Zeineddini, C.Z.; Mukku, V. Qualification of a homogeneous cell-based neonatal Fc receptor (FcRn) binding assay and its application to studies on Fc functionality of IgG-based therapeutics. J. Immunol. Methods 2013, 390, 81–91. [Google Scholar] [CrossRef]
- Taccioli, A.B.; Blum, A.; Xu, A.; Sosic, Z.; Bergelson, S.; Feschenko, M. Effect of protein aggregates on characterization of FcRn binding of Fc-fusion therapeutics. Mol. Immunol. 2015, 67, 616–624. [Google Scholar] [CrossRef]
- Wu, Q.; Lee, H.Y.; Wong, P.Y.; Jiang, J.; Santoro, H.G. Development and applications of AlphaScreen-based FcRn binding assay to characterize monoclonal antibodies. J. Immunol. Methods 2015, 420, 31–37. [Google Scholar] [CrossRef]
- Cooper, P.R.; Ciambrone, G.J.; Kliwinski, C.M.; Maze, E.; Johnson, L.; Li, Q.; Feng, Y.; Hornby, P.J. Efflux of monoclonal antibodies from rat brain by neonatal Fc receptor, FcRn. Brain Res. 2013, 1534, 13–21. [Google Scholar] [CrossRef] [PubMed]
- Aveskogh, M.; Hellman, L. Evidence for an early appearance of modern post-switch isotypes in mammalian evolution; cloning of IgE, IgG and IgA from the marsupial Monodelphis domestica. Eur. J. Immunol. 1998, 28, 2738–2750. [Google Scholar] [CrossRef]
- Cova, L. DNA-designed avian IgY antibodies: Novel tools for research, diagnostics and therapy. J. Clin. Virol. 2006, 34, S70–S74. [Google Scholar] [CrossRef]
- Leiva, C.L.; Gallardo, M.J.; Casanova, N.; Terzolo, H.; Chacana, P. IgY-technology (egg yolk antibodies) in human medicine: A review of patents and clinical trial. Int. Immunopharmacol. 2020, 81, 106269. [Google Scholar] [CrossRef]
- Amina, S.; Sonia, A.B.; Fatima, L.D. Development of a new approach of immunotherapy against scorpion envenoming: Avian IgYs an alternative to equine IgGs. Int. Immunopharmacol. 2018, 61, 256–265. [Google Scholar]
- Frens, G. Controlled Nucleation for the Regulation of the Particle Size in Monodisperse Gold Suspensions. Nat. Phys. Sci. 1973, 241, 20–22. [Google Scholar] [CrossRef]
- Kang, X.; Pang, G.; Liang, X.Y.; Wang, M.; Liu, J.; Zhu, W.M. Study on a hydrogen peroxide biosensor based on horseradish peroxidase/GNPs-thionine/chitosan. Electrochim Acta 2011, 62, 327–334. [Google Scholar] [CrossRef]
- Lu, D.; Xu, Q.; Pang, G. A bombykol electrochemical receptor sensor and its kinetics. Bioelectrochemistry 2019, 128, 263–273. [Google Scholar] [CrossRef] [PubMed]
- Wei, L.; Qiao, L.; Pang, G.; Xie, J. A kinetic study of bitter taste receptor sensing using immobilized porcine taste bud tissues. Biosens. Bioelectron. 2017, 92, 74–80. [Google Scholar] [CrossRef]
- Xu, Q.; Lu, D.; Pang, G. Study on Bombykol Receptor Self-Assembly and Universality of G Protein Cellular Signal Amplification System. ACS Sens. 2019, 4, 257–264. [Google Scholar] [CrossRef]
Sample Availability: Samples of the compounds are not available from the authors. |


| Types of IgG | Linear Regression Equation | R2 | Ka/(mol/L) |
|---|---|---|---|
| Bovine IgG | 0.98 | 1.59 × 10⁻²² | |
| Sheep IgG | 0.99 | 2.17 × 10⁻²¹ | |
| Human IgG | 0.95 | 1.02 × 10⁻²³ | |
| Rabbit IgG | 0.96 | 2.29 × 10⁻²¹ | |
| Horse IgG | 0.96 | 1.20 × 10⁻²² | |
| Donkey IgG | 0.96 | 1.14 × 10⁻²¹ | |
| Quail IgY | 0.95 | 8.61 × 10⁻²⁰ |
| Numbers of Sensor | Response Current (I2, μA) | Blank Current (I1, μA) | ΔI (%) |
|---|---|---|---|
| 1 | 5.99 | 8.83 | 32.14 |
| 2 | 7.15 | 10.50 | 31.95 |
| 3 | 6.69 | 9.85 | 32.08 |
| 4 | 7.46 | 11.59 | 35.62 |
| 5 | 5.79 | 8.50 | 31.93 |
| Detection Methods | Time | Sensitivity | References |
|---|---|---|---|
| Asymmetrical flow field flow fractionation (AF4) | 30 min | 0.1 μM | [31] |
| Surface plasmon resonance (SPR) | 30 min | 10 pM | [32] |
| Flow cytometer | 6 h | 4.6 μg·mL−1 | [33] |
| Biolayer interferometry (BLI) | 11 min | 4 nM | [34] |
| AlphaScreen | 1 h | 1.88 μM | [34,35] |
| Enzyme-linked immunosorbent assay (ELISA) | 30 min | 0.4 ng·mL−1 | [36] |
| hFcyRn electrochemical receptor sensor | 100 s | 10−11 pM | This study |
© 2020 by the authors. Licensee MDPI, Basel, Switzerland. This article is an open access article distributed under the terms and conditions of the Creative Commons Attribution (CC BY) license (http://creativecommons.org/licenses/by/4.0/).
Share and Cite
Peng, D.; Lu, D.; Pang, G. Study on FcγRn Electrochemical Receptor Sensor and Its Kinetics. Molecules 2020, 25, 3206. https://doi.org/10.3390/molecules25143206
Peng D, Lu D, Pang G. Study on FcγRn Electrochemical Receptor Sensor and Its Kinetics. Molecules. 2020; 25(14):3206. https://doi.org/10.3390/molecules25143206
Chicago/Turabian StylePeng, Dandan, Dingqiang Lu, and Guangchang Pang. 2020. "Study on FcγRn Electrochemical Receptor Sensor and Its Kinetics" Molecules 25, no. 14: 3206. https://doi.org/10.3390/molecules25143206
APA StylePeng, D., Lu, D., & Pang, G. (2020). Study on FcγRn Electrochemical Receptor Sensor and Its Kinetics. Molecules, 25(14), 3206. https://doi.org/10.3390/molecules25143206