
Targeting the Protein Tunnels of the Urease Accessory Complex: A Theoretical Investigation

 , , , ,
  and
and 
Abstract
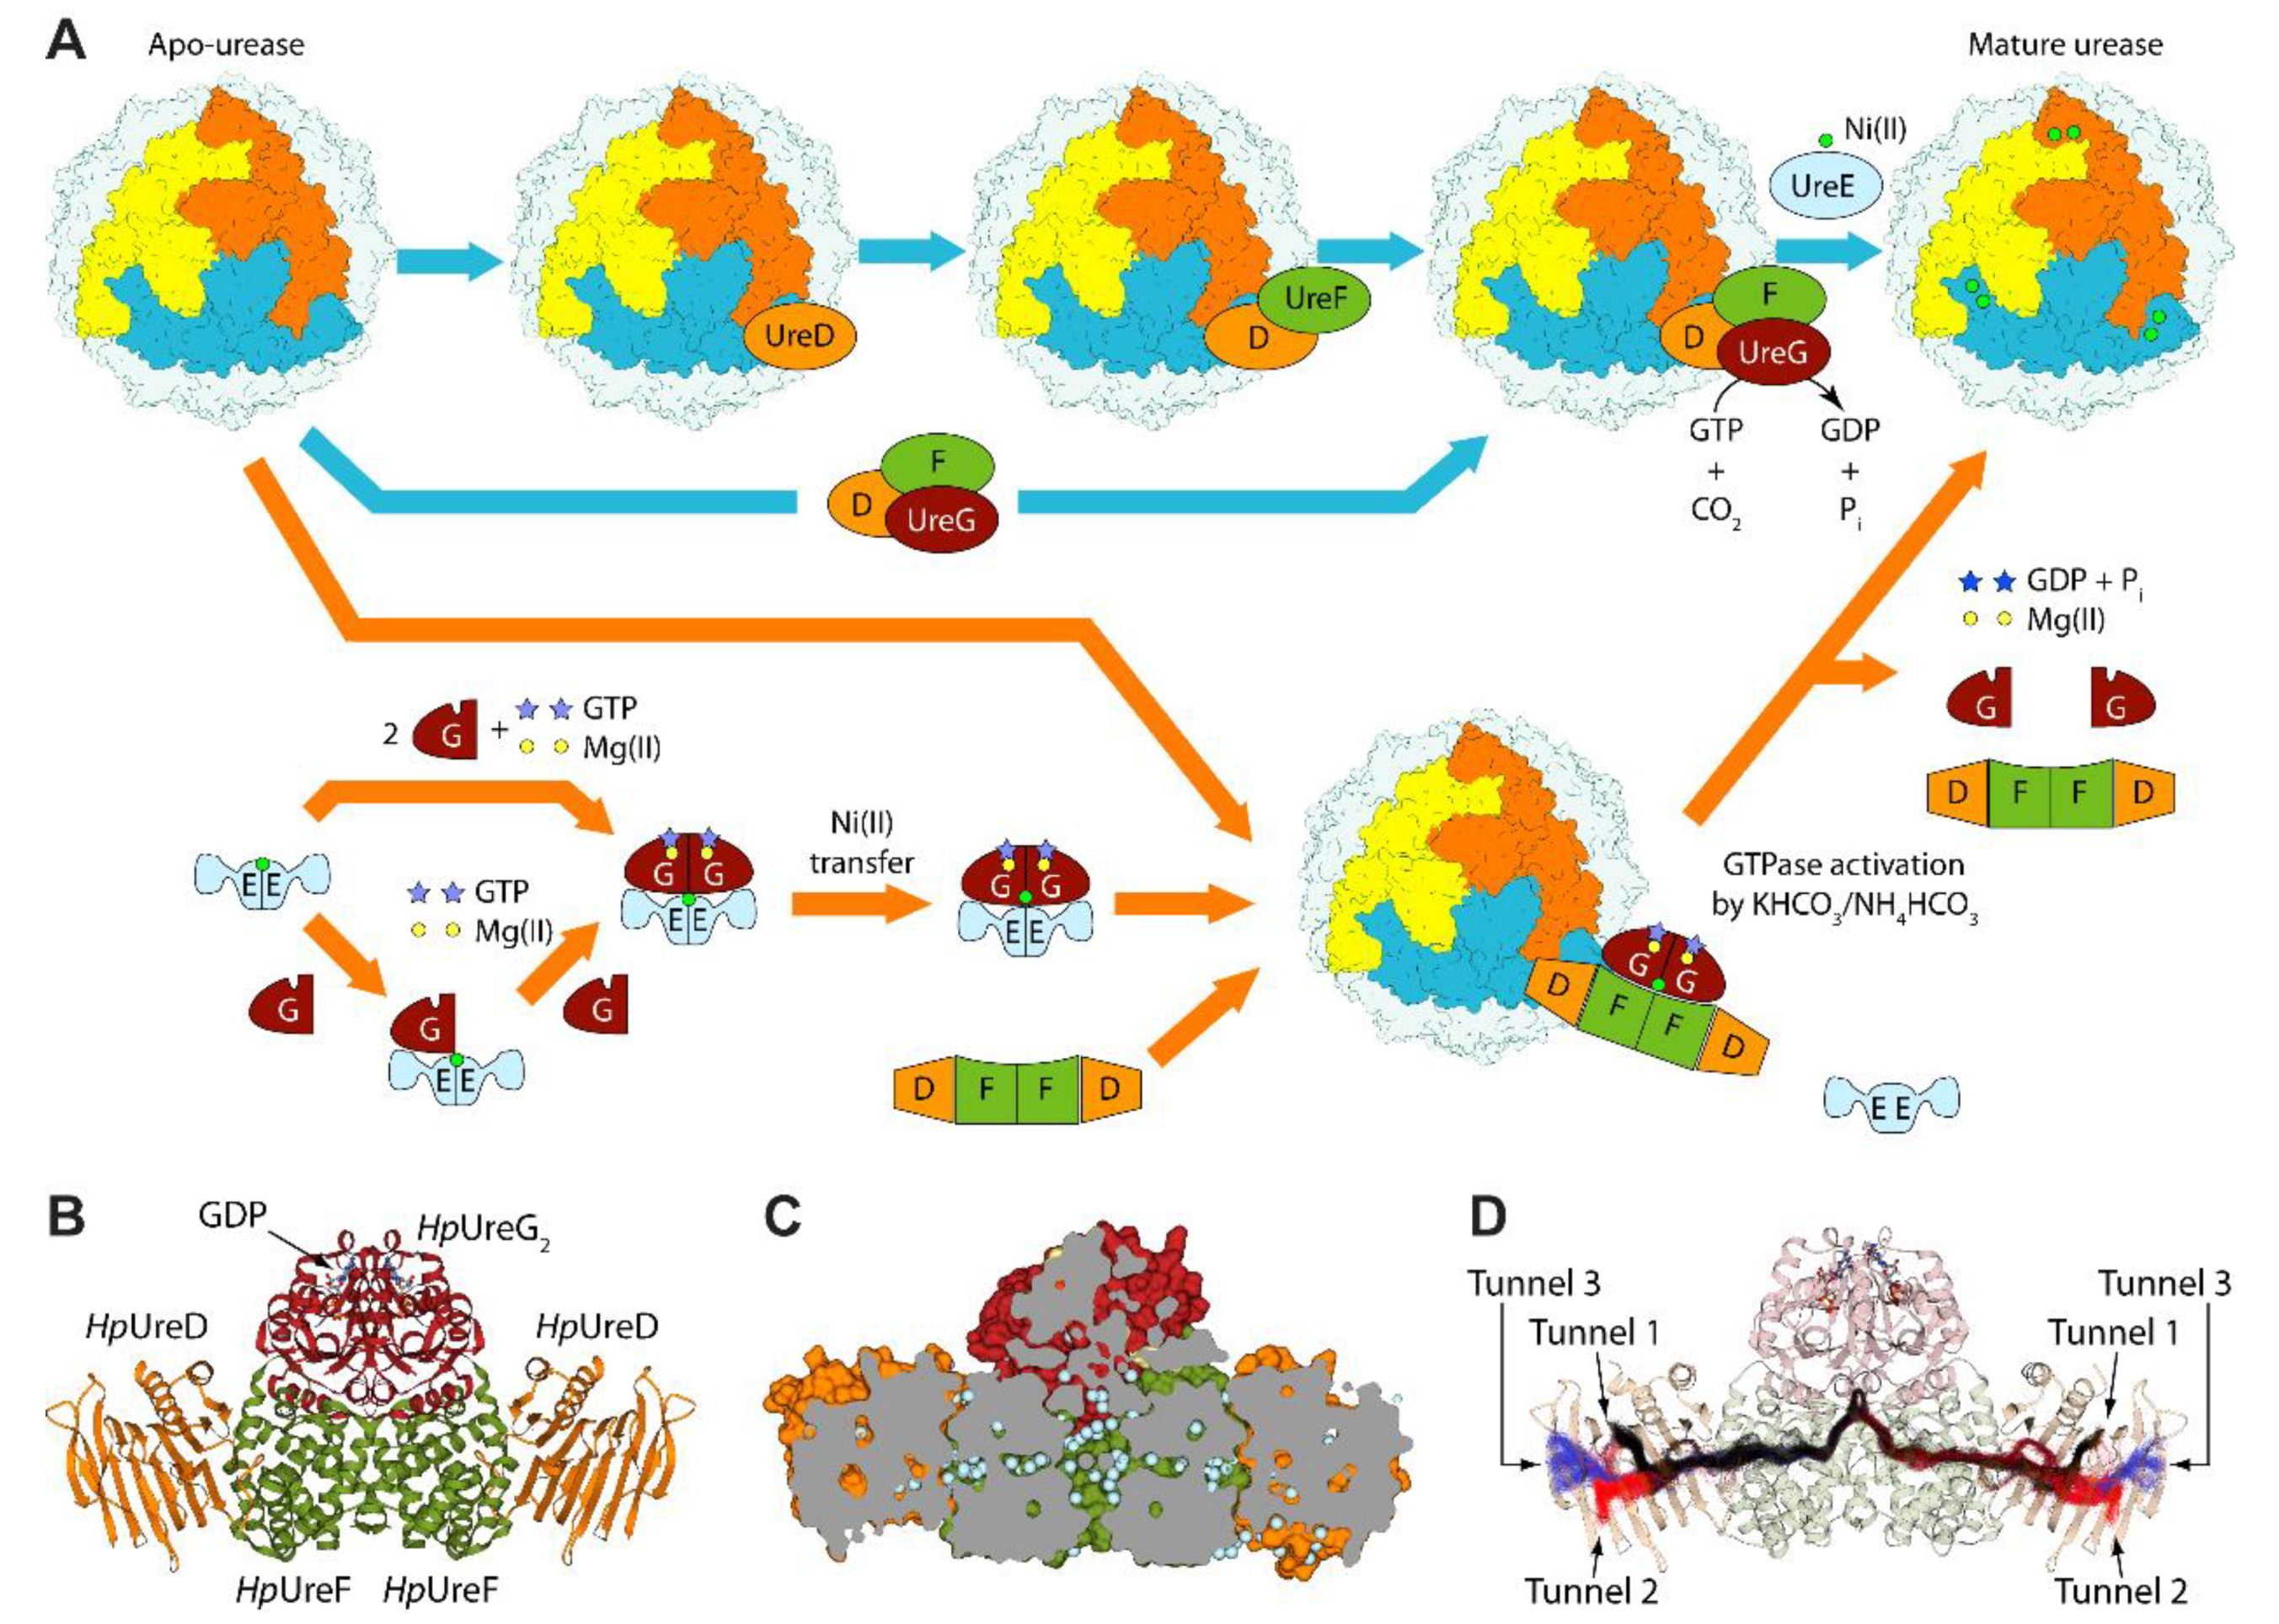
1. Introduction
2. Results and Discussion
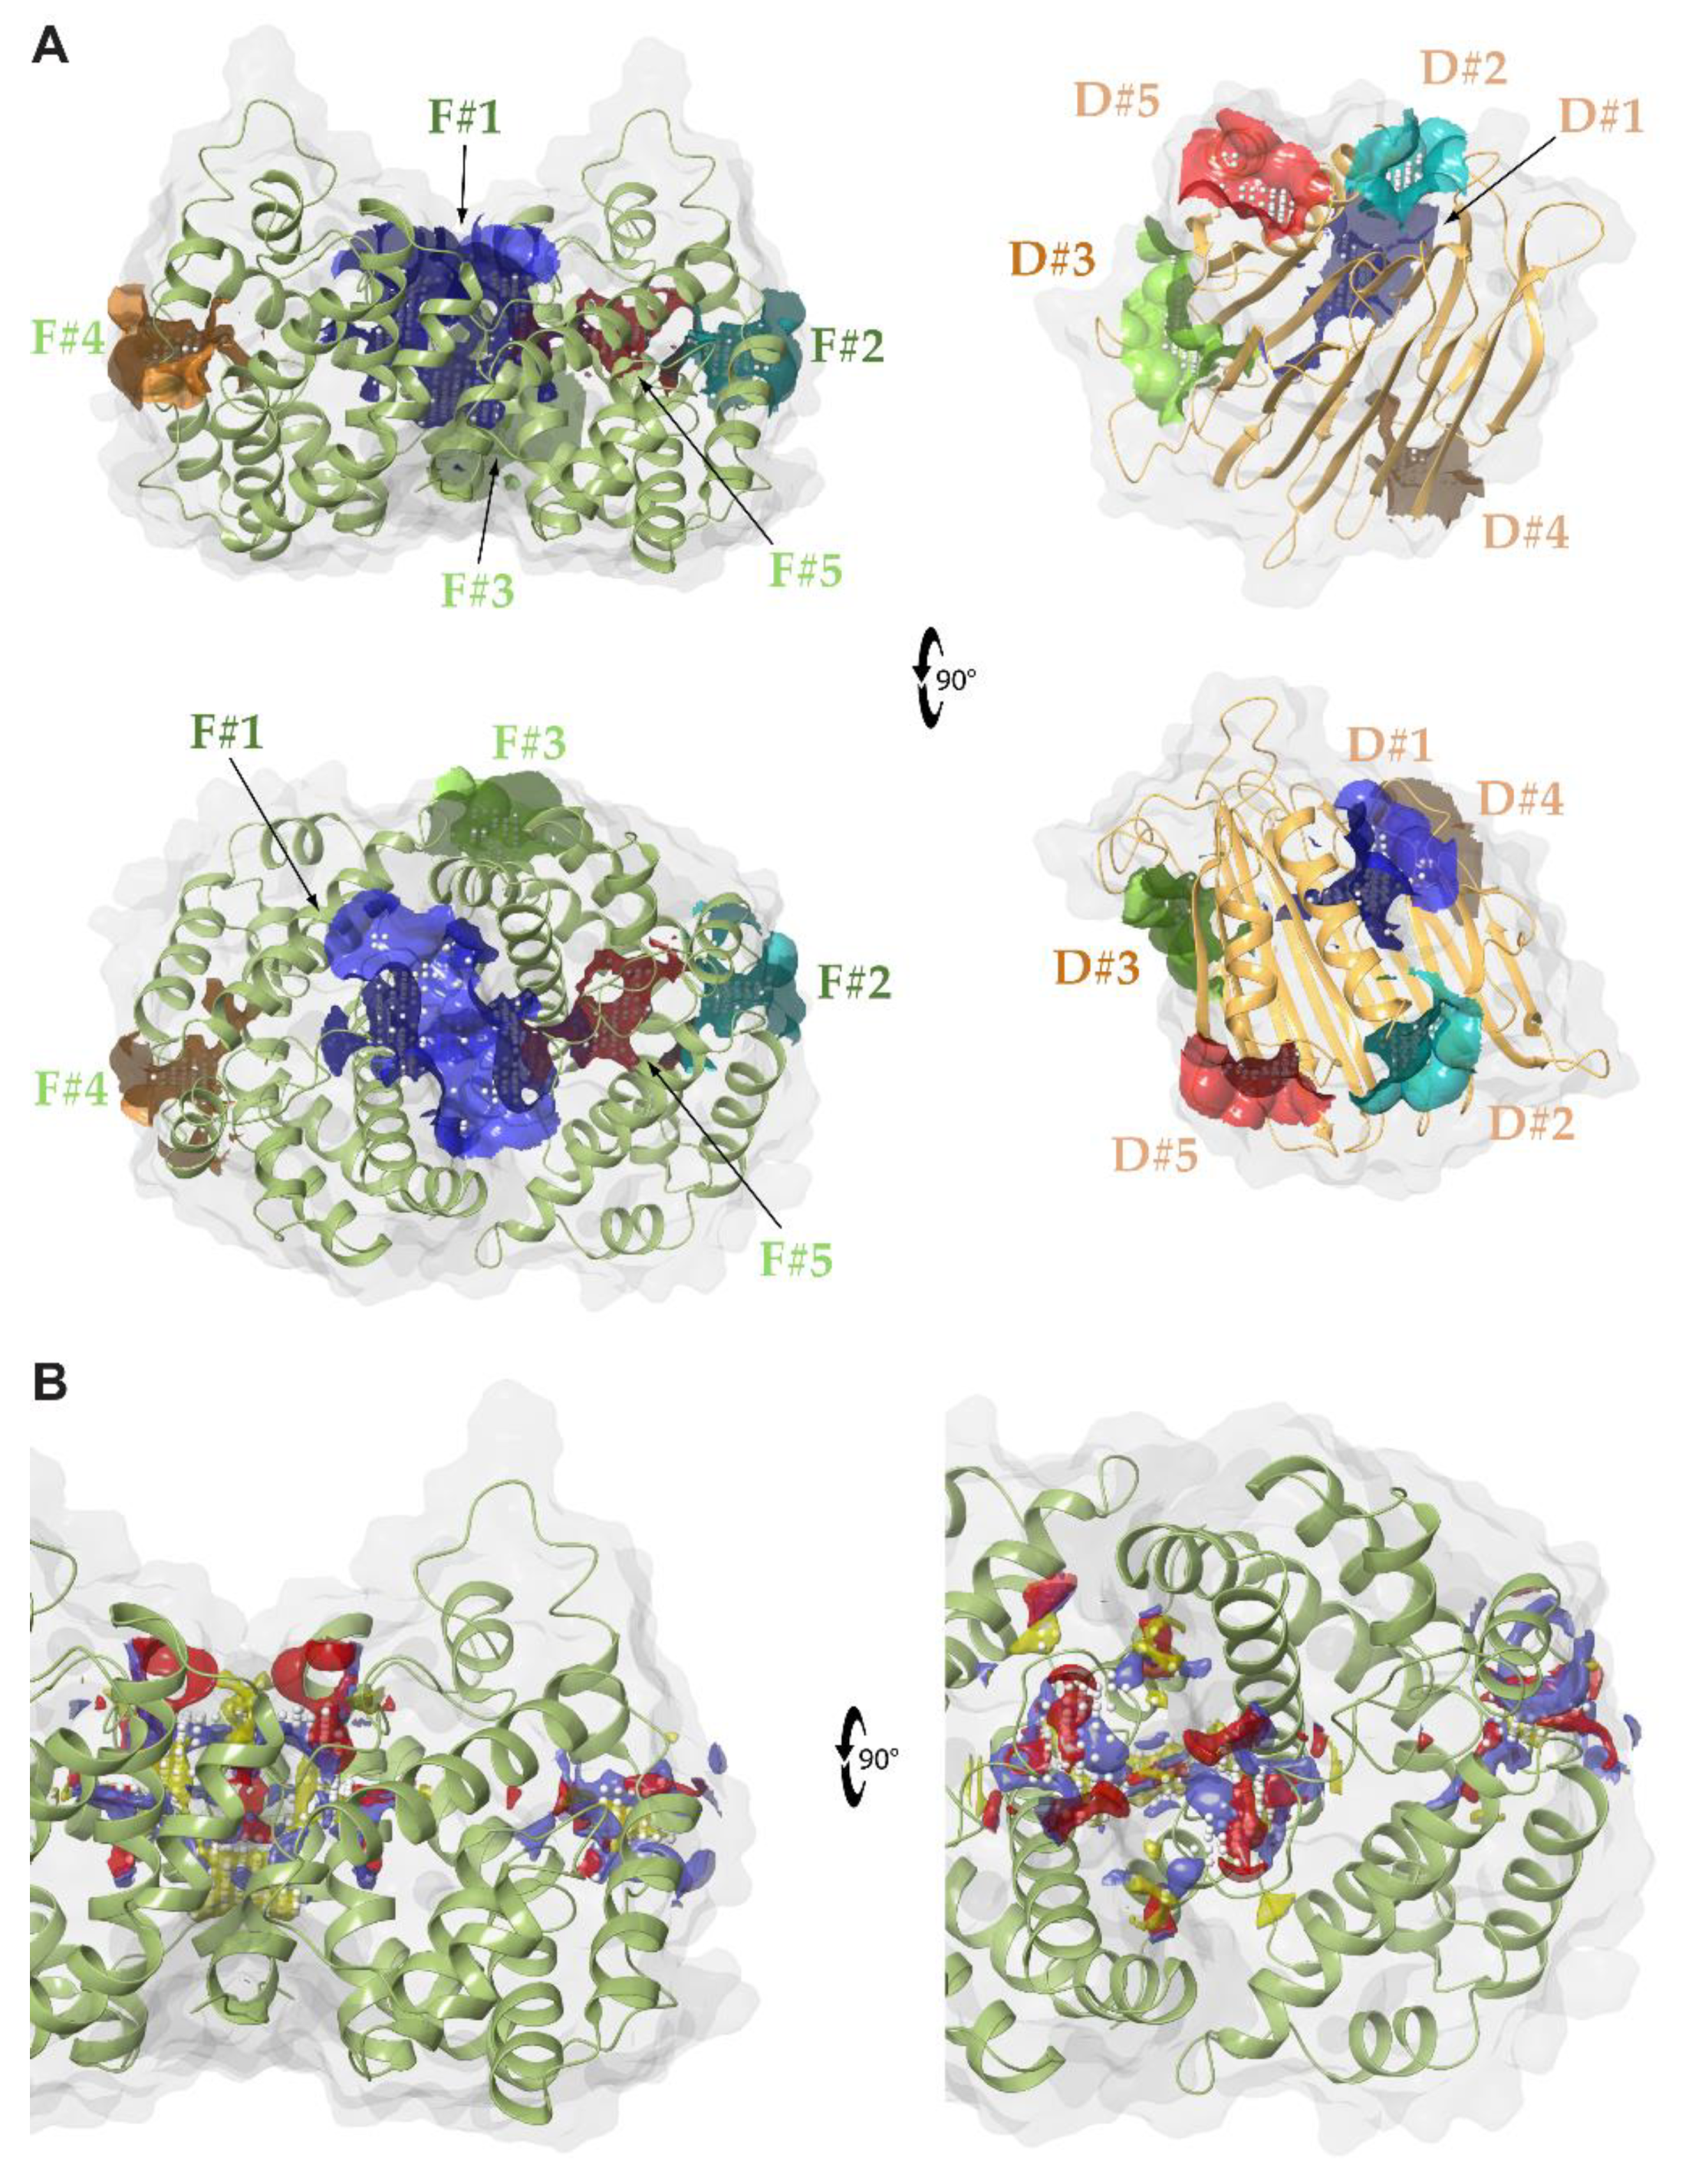
2.1. Identification of Druggable Pockets
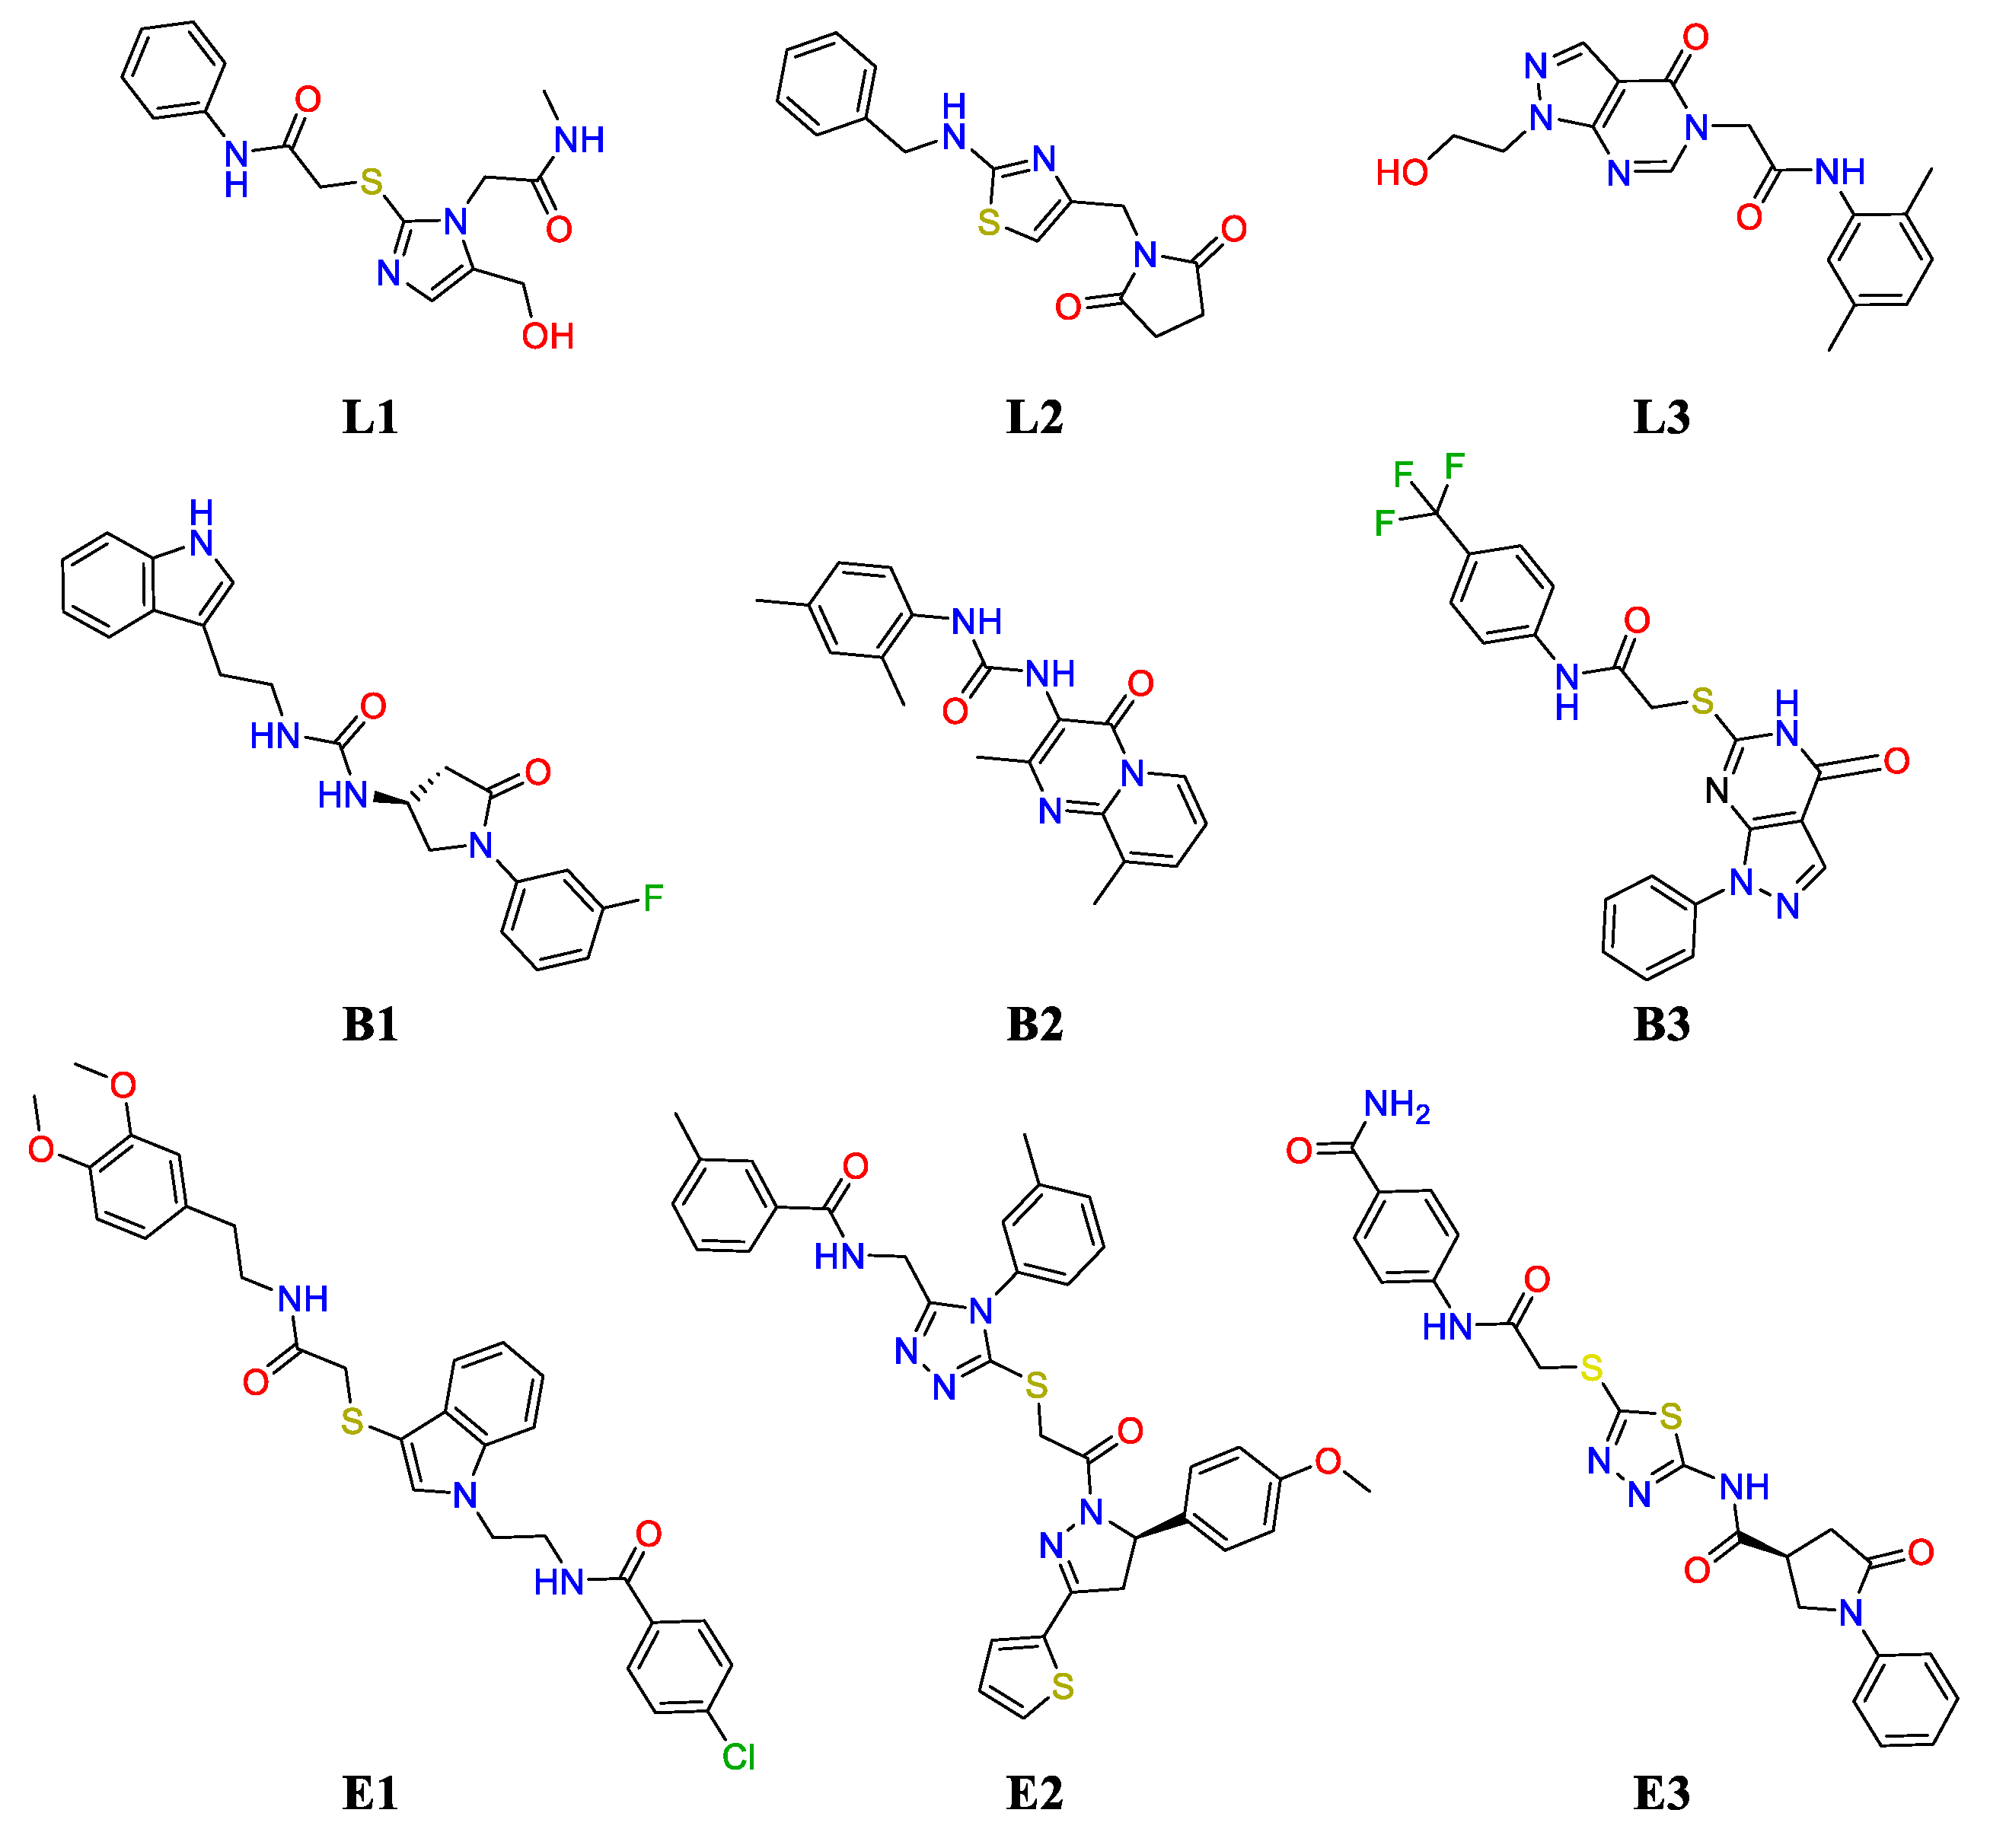
2.2. Challenging the (UreF)2 Druggable Sites through Virtual Screening
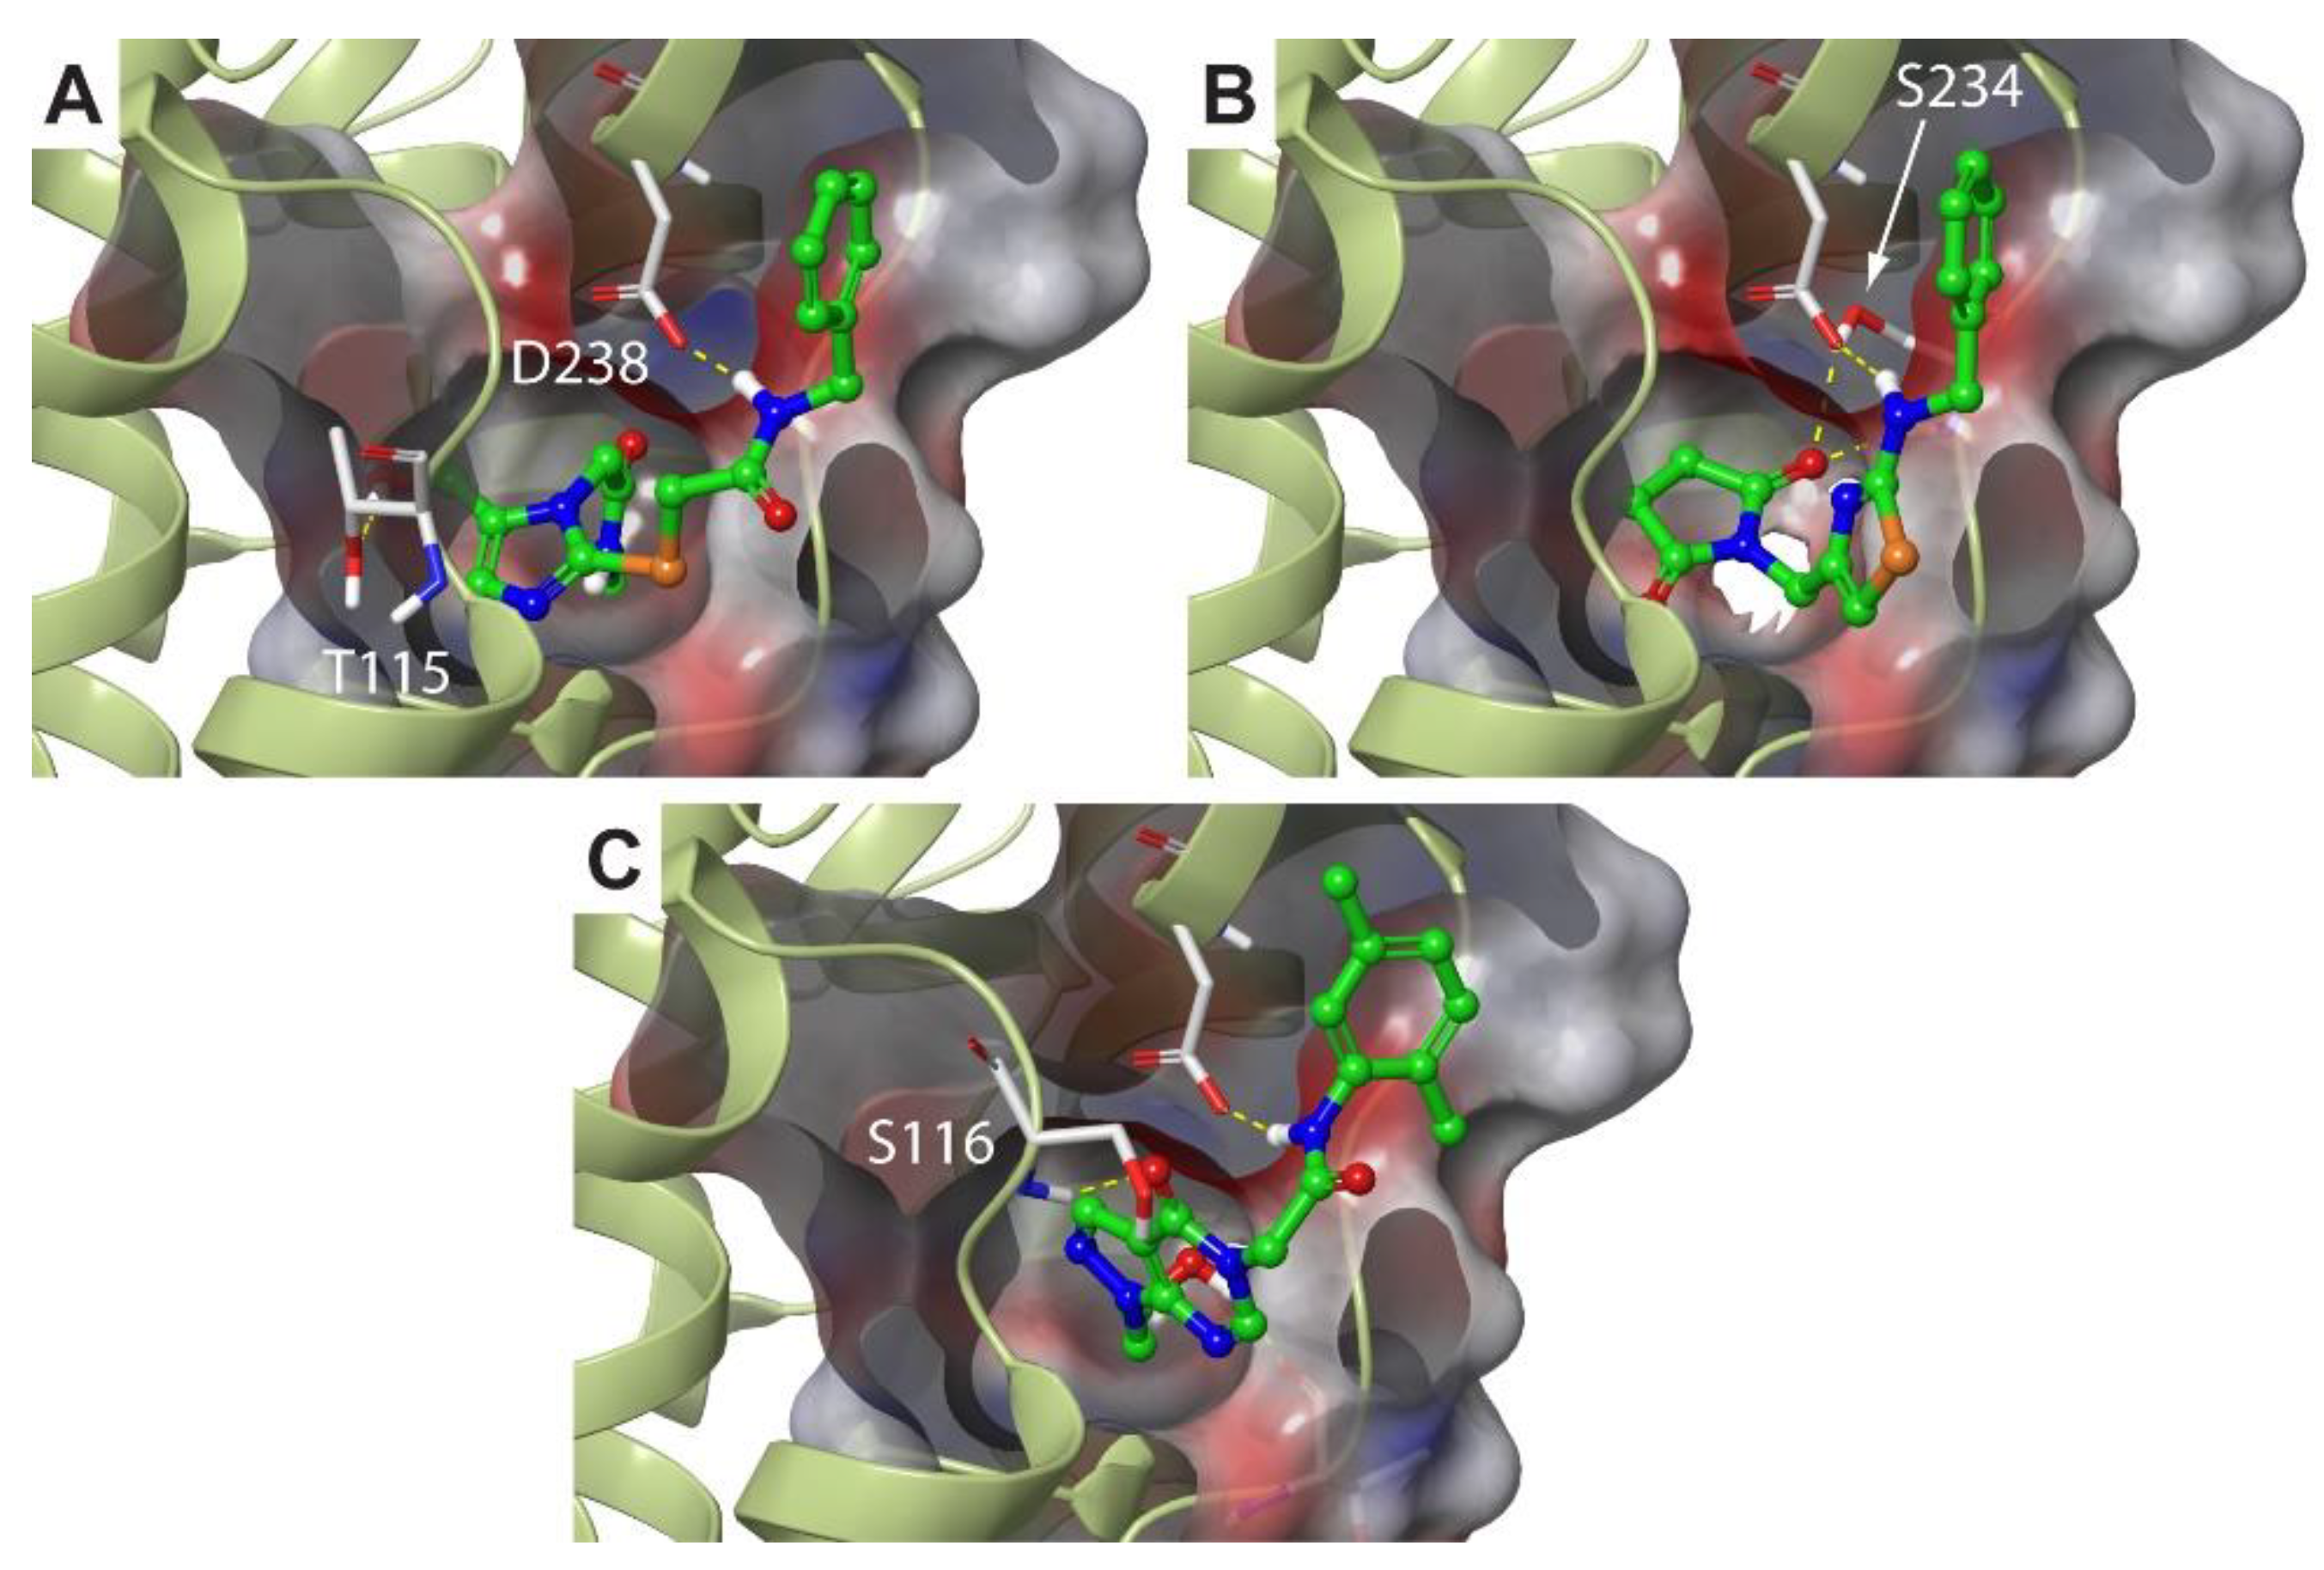
2.3. Molecular Dynamics Simulations Confirm the High Druggability of Site F#1
3. Materials and Methods
3.1. Structure-Based Virtual Screening
3.2. Molecular Dynamics
3.3. MM-GBSA Analysis
4. Conclusions
Supplementary Materials
Author Contributions
Funding
Acknowledgments
Conflicts of Interest
References
- Finney, L.A.; O’Halloran, T.V. Transition metal speciation in the cell: Insights from the chemistry of metal ion receptors. Science 2003, 300, 931–936. [Google Scholar] [CrossRef]
- Martinez-Finley, E.J.; Chakraborty, S.; Fretham, S.J.B.; Aschner, M. Cellular transport and homeostasis of essential and nonessential metals. Met. Integr. Biomet. Sci. 2012, 4, 593–605. [Google Scholar] [CrossRef] [PubMed]
- Ba, L.A.; Doering, M.; Burkholz, T.; Jacob, C. Metal trafficking: From maintaining the metal homeostasis to future drug design. Met. Integr. Biomet. Sci. 2009, 1, 292–311. [Google Scholar] [CrossRef]
- Ma, Z.; Jacobsen, F.E.; Giedroc, D.P. Coordination Chemistry of Bacterial Metal Transport and Sensing. Chem. Rev. 2009, 109, 4644–4681. [Google Scholar] [CrossRef] [PubMed]
- Higgins, K.A.; Carr, C.E.; Maroney, M.J. Specific metal recognition in nickel trafficking. Biochemistry 2012, 51, 7816–7832. [Google Scholar] [CrossRef] [PubMed]
- Sigel, A.; Sigel, H.; Sigel, R.K.O. Interrelations between Essential Metal Ions and Human Diseases; Springer: Amsterdam, The Netherlands, 2013; Volume 13. [Google Scholar]
- Musiani, F.; Zambelli, B.; Bazzani, M.; Mazzei, L.; Ciurli, S. Nickel-responsive transcriptional regulators. Met. Integr. Biomet. Sci. 2015, 7, 1305–1318. [Google Scholar] [CrossRef]
- Hunsaker, E.W.; Franz, K.J. Emerging opportunities to manipulate metal trafficking for therapeutic benefit. Inorg. Chem. 2019, 58, 13528–13545. [Google Scholar] [CrossRef]
- Zambelli, B.; Musiani, F.; Benini, S.; Ciurli, S. Chemistry of Ni2+ in Urease: Sensing, Trafficking, and Catalysis. Acc. Chem. Res. 2011, 44, 520–530. [Google Scholar] [CrossRef]
- Maroney, M.J.; Ciurli, S. Nonredox nickel enzymes. Chem. Rev. 2014, 114, 4206–4228. [Google Scholar] [CrossRef]
- Mazzei, L.; Musiani, F.; Ciurli, S. Urease. In The Biological Chemistry of Nickel; Zamble, D., Rowińska-Żyrek, M., Kozlowski, H., Eds.; The Royal Society of Chemistry: London, UK, 2017; pp. 60–97. [Google Scholar]
- Roesler, B.M.; Rabelo-Goncalves, E.M.; Zeitune, J.M. Virulence factors of Helicobacter pylori: A review. Clin. Med. Insights Gastroenterol. 2014, 7, 9–17. [Google Scholar] [CrossRef]
- Kusters, J.G.; van Vliet, A.H.; Kuipers, E.J. Pathogenesis of Helicobacter pylori infection. Clin. Microbiol. Rev. 2006, 19, 449–490. [Google Scholar] [CrossRef] [PubMed]
- Zhang, M. High antibiotic resistance rate: A difficult issue for Helicobacter pylori eradication treatment. World J. Gastroenterol. 2015, 21, 13432–13437. [Google Scholar] [CrossRef] [PubMed]
- Hu, Y.; Zhang, M.; Lu, B.; Dai, J.F. Helicobacter pylori and antibiotic resistance, a continuing and intractable problem. Helicobacter 2016, 21, 349–363. [Google Scholar] [CrossRef]
- WHO. Global Priority List of Antibiotic-Resistant Bacteria to Guide Research, Discovery, and Development of New Antibiotics. 2017. Available online: http://www.who.int/medicines/publications/global-priority-list-antibiotic-resistant-bacteria/en/ (accessed on 15 May 2020).
- Rowinska-Zyrek, M.; Zakrzewska-Czerwinska, J.; Zawilak-Pawlik, A.; Kozlowski, H. Ni2+ chemistry in pathogens—A possible target for eradication. Dalton Trans. 2014, 43, 8976–8989. [Google Scholar] [CrossRef] [PubMed]
- Kang, G.S.; Li, Q.; Chen, H.; Costa, M. Effect of metal ions on HIF-1alpha and Fe homeostasis in human A549 cells. Mutat. Res. 2006, 610, 48–55. [Google Scholar] [CrossRef] [PubMed]
- Yokoi, K.; Uthus, E.O.; Penland, J.G.; Nielsen, F.H. Effect of dietary nickel deprivation on vision, olfaction, and taste in rats. J. Trace Elem. Med. Biol. 2014, 28, 436–440. [Google Scholar] [CrossRef]
- Stipanuk, M.H.; Caudill, M.A. Biochemical, Physiological, and Molecular Aspects of Human Nutrition, 4th ed.; Elsevier—Health Sciences Division: St. Louis, MO, USA, 2018. [Google Scholar]
- Balasubramanian, A.; Ponnuraj, K. Crystal structure of the first plant urease from jack bean: 83 years of journey from its first crystal to molecular structure. J. Mol. Biol. 2010, 400, 274–283. [Google Scholar] [CrossRef]
- Balasubramanian, A.; Durairajpandian, V.; Elumalai, S.; Mathivanan, N.; Munirajan, A.K.; Ponnuraj, K. Structural and functional studies on urease from pigeon pea (Cajanus cajan). Int. J. Biol. Macromol. 2013, 58, 301–309. [Google Scholar] [CrossRef] [PubMed]
- Ha, N.C.; Oh, S.T.; Sung, J.Y.; Cha, K.A.; Lee, M.H.; Oh, B.H. Supramolecular assembly and acid resistance of Helicobacter pylori urease. Nat. Struct. Biol. 2001, 8, 505–509. [Google Scholar] [CrossRef]
- Mazzei, L.; Cianci, M.; Benini, S.; Bertini, L.; Musiani, F.; Ciurli, S. Kinetic and structural studies reveal a unique binding mode of sulfite to the nickel center in urease. J. Inorg. Biochem. 2016, 154, 42–49. [Google Scholar] [CrossRef]
- Mazzei, L.; Cianci, M.; Musiani, F.; Ciurli, S. Inactivation of urease by 1,4-benzoquinone: Chemistry at the protein surface. Dalton Trans. 2016, 45, 5455–5459. [Google Scholar] [CrossRef] [PubMed]
- Mazzei, L.; Cianci, M.; Contaldo, U.; Musiani, F.; Ciurli, S. Urease Inhibition in the presence of N-(n-butyl)thiophosphoric triamide, a suicide substrate: Structure and kinetics. Biochemistry 2017, 56, 5391–5404. [Google Scholar] [CrossRef] [PubMed]
- Mazzei, L.; Cianci, M.; Musiani, F.; Lente, G.; Palombo, M.; Ciurli, S. Inactivation of urease by catechol: Kinetics and structure. J. Inorg. Biochem. 2017, 166, 182–189. [Google Scholar] [CrossRef]
- Mazzei, L.; Cianci, M.; Gonzalez Vara, A.; Ciurli, S. The structure of urease inactivated by Ag(I): A new paradigm for enzyme inhibition by heavy metals. Dalton Trans. 2018, 47, 8240–8247. [Google Scholar] [CrossRef]
- Mazzei, L.; Broll, V.; Ciurli, S. An Evaluation of Maleic-Itaconic Copolymers as Urease Inhibitors. Soil Sci. Soc. Am. J. 2018, 82, 994–1003. [Google Scholar] [CrossRef]
- Casali, L.; Mazzei, L.; Shemchuk, O.; Honer, K.; Grepioni, F.; Ciurli, S.; Braga, D.; Baltrusaitis, J. Smart urea ionic co-crystals with enhanced urease inhibition activity for improved nitrogen cycle management. Chem. Commun. 2018, 54, 7637–7640. [Google Scholar] [CrossRef]
- Mazzei, L.; Wenzel, M.N.; Cianci, M.; Palombo, M.; Casini, A.; Ciurli, S. Inhibition Mechanism of Urease by Au(III) Compounds Unveiled by X-ray Diffraction Analysis. ACS Med. Chem. Lett. 2019, 10, 564–570. [Google Scholar] [CrossRef]
- Mazzei, L.; Cianci, M.; Contaldo, U.; Ciurli, S. Insights into Urease Inhibition by N-(n-Butyl) Phosphoric Triamide through an Integrated Structural and Kinetic Approach. J. Agric. Food Chem. 2019, 67, 2127–2138. [Google Scholar] [CrossRef]
- Mazzei, L.; Cianci, M.; Benini, S.; Ciurli, S. The impact of pH on catalytically critical protein conformational changes: The case of the urease, a nickel enzyme. Chemistry 2019, 25, 12145–12158. [Google Scholar] [CrossRef]
- Mazzei, L.; Cianci, M.; Benini, S.; Ciurli, S. The structure of the elusive urease-urea complex unveils a paradigmatic case of metallo-enzyme catalysis. Angew. Chem. Int. Ed. 2019, 58, 7415–7419. [Google Scholar] [CrossRef] [PubMed]
- Mazzei, L.; Broll, V.; Casali, L.; Silva, M.; Braga, D.; Grepioni, F.; Baltrusaitis, J.; Ciurli, S. Multifunctional Urea Cocrystal with Combined Ureolysis and Nitrification Inhibiting Capabilities for Enhanced Nitrogen Management. ACS Sustain. Chem. Eng. 2019, 7, 13369–13378. [Google Scholar] [CrossRef]
- Casali, L.; Mazzei, L.; Shemchuk, O.; Sharma, L.; Honer, K.; Grepioni, F.; Ciurli, S.; Braga, D.; Baltrusaitis, J. Novel Dual-Action Plant Fertilizer and Urease Inhibitor: Urea·Catechol Cocrystal. Characterization and Environmental Reactivity. ACS Sustain. Chem. Eng. 2019, 7, 2852–2859. [Google Scholar] [CrossRef]
- Fiori-Duarte, A.T.; Rodrigues, R.P.; Kitagawa, R.R.; Kawano, D.F. Insights into the design of inhibitors of the urease enzyme—A major target for the treatment of Helicobacter pylori infections. Curr. Med. Chem. 2019, 26. [Google Scholar] [CrossRef] [PubMed]
- Moncrief, M.B.; Hausinger, R.P. Characterization of UreG, identification of a UreD-UreF-UreG complex, and evidence suggesting that a nucleotide-binding site in UreG is required for in vivo metallocenter assembly of Klebsiella aerogenes urease. J. Bacteriol. 1997, 179, 4081–4086. [Google Scholar] [CrossRef]
- Soriano, A.; Hausinger, R.P. GTP-dependent activation of urease apoprotein in complex with the UreD, UreF, and UreG accessory proteins. Proc. Natl. Acad. Sci. USA 1999, 96, 11140–11144. [Google Scholar] [CrossRef] [PubMed]
- Zambelli, B.; Stola, M.; Musiani, F.; de Vriendt, K.; Samyn, B.; Devreese, B.; van Beeumen, J.; Turano, P.; Dikiy, A.; Bryant, D.A.; et al. UreG, a chaperone in the urease assembly process, is an intrinsically unstructured GTPase that specifically binds Zn2+. J. Biol. Chem. 2005, 280, 4684–4695. [Google Scholar] [CrossRef]
- Musiani, F.; Ippoliti, E.; Micheletti, C.; Carloni, P.; Ciurli, S. Conformational fluctuations of UreG, an intrinsically disordered enzyme. Biochemistry 2013, 52, 2949–2954. [Google Scholar] [CrossRef]
- Salomone-Stagni, M.; Zambelli, B.; Musiani, F.; Ciurli, S. A model-based proposal for the role of UreF as a GTPase-activating protein in the urease active site biosynthesis. Proteins 2007, 68, 749–761. [Google Scholar] [CrossRef]
- Soriano, A.; Colpas, G.J.; Hausinger, R.P. UreE stimulation of GTP-dependent urease activation in the UreD-UreF-UreG-urease apoprotein complex. Biochemistry 2000, 39, 12435–12440. [Google Scholar] [CrossRef]
- Bellucci, M.; Zambelli, B.; Musiani, F.; Turano, P.; Ciurli, S. Helicobacter pylori UreE, a urease accessory protein: Specific Ni(2+)- and Zn(2+)-binding properties and interaction with its cognate UreG. Biochem. J. 2009, 422, 91–100. [Google Scholar] [CrossRef]
- Merloni, A.; Dobrovolska, O.; Zambelli, B.; Agostini, F.; Bazzani, M.; Musiani, F.; Ciurli, S. Molecular landscape of the interaction between the urease accessory proteins UreE and UreG. Biochim. Biophys. Acta 2014, 1844, 1662–1674. [Google Scholar] [CrossRef]
- Yang, X.; Li, H.; Lai, T.P.; Sun, H. UreE-UreG complex facilitates nickel transfer and preactivates GTPase of UreG in Helicobacter pylori. J. Biol. Chem. 2015, 290, 12474–12485. [Google Scholar] [CrossRef] [PubMed]
- Lam, R.; Romanov, V.; Johns, K.; Battaile, K.P.; Wu-Brown, J.; Guthrie, J.L.; Hausinger, R.P.; Pai, E.F.; Chirgadze, N.Y. Crystal structure of a truncated urease accessory protein UreF from Helicobacter pylori. Proteins 2010, 78, 2839–2848. [Google Scholar] [CrossRef] [PubMed]
- Fong, Y.H.; Wong, H.C.; Chuck, C.P.; Chen, Y.W.; Sun, H.; Wong, K.B. Assembly of preactivation complex for urease maturation in Helicobacter pylori: Crystal structure of UreF-UreH protein complex. J. Biol. Chem. 2011, 286, 43241–43249. [Google Scholar] [CrossRef] [PubMed]
- Fong, Y.H.; Wong, H.C.; Yuen, M.H.; Lau, P.H.; Chen, Y.W.; Wong, K.B. Structure of UreG/UreF/UreH complex reveals how urease accessory proteins facilitate maturation of Helicobacter pylori urease. PLoS Biol. 2013, 11, e1001678. [Google Scholar] [CrossRef] [PubMed]
- Zambelli, B.; Berardi, A.; Martin-Diaconescu, V.; Mazzei, L.; Musiani, F.; Maroney, M.J.; Ciurli, S. Nickel binding properties of Helicobacter pylori UreF, an accessory protein in the nickel-based activation of urease. J. Biol. Inorg. Chem. 2014, 19, 319–334. [Google Scholar] [CrossRef]
- Farrugia, M.A.; Wang, B.; Feig, M.; Hausinger, R.P. Mutational and computational evidence that a nickel-transfer tunnel in UreD is used for activation of Klebsiella aerogenes urease. Biochemistry 2015, 54, 6392–6401. [Google Scholar] [CrossRef]
- Musiani, F.; Gioia, D.; Masetti, M.; Falchi, F.; Cavalli, A.; Recanatini, M.; Ciurli, S. Protein tunnels: The case of urease accessory proteins. J. Chem. Theory Comput. 2017, 13, 2322–2331. [Google Scholar] [CrossRef]
- Halgren, T. New method for fast and accurate binding-site identification and analysis. Chem. Biol. Drug Des. 2007, 69, 146–148. [Google Scholar] [CrossRef]
- Halgren, T.A. Identifying and characterizing binding sites and assessing druggability. J. Chem. Inf. Model. 2009, 49, 377–389. [Google Scholar] [CrossRef]
- Sterling, T.; Irwin, J.J. ZINC 15—Ligand Discovery for Everyone. J. Chem. Inf. Model. 2015, 55, 2324–2337. [Google Scholar] [CrossRef] [PubMed]
- Patschull, A.O.; Gooptu, B.; Ashford, P.; Daviter, T.; Nobeli, I. In silico assessment of potential druggable pockets on the surface of α1-antitrypsin conformers. PLoS ONE 2012, 7, e36612. [Google Scholar] [CrossRef] [PubMed]
- Di Martino, G.P.; Masetti, M.; Ceccarini, L.; Cavalli, A.; Recanatini, M. An automated docking protocol for hERG channel blockers. J. Chem. Inf. Model. 2013, 53, 159–175. [Google Scholar] [CrossRef] [PubMed]
- Gioia, D.; Bertazzo, M.; Recanatini, M.; Masetti, M.; Cavalli, A. Dynamic docking: A paradigm shift in computational drug discovery. Molecules 2017, 22, 2029. [Google Scholar] [CrossRef] [PubMed]
- Masetti, M.; Rocchia, W. Molecular mechanics and dynamics: Numerical tools to sample the configuration space. Front. Biosci. 2014, 19, 578–604. [Google Scholar] [CrossRef]
- Lionta, E.; Spyrou, G.; Vassilatis, D.K.; Cournia, Z. Structure-based virtual screening for drug discovery: Principles, applications and recent advances. Curr. Top. Med. Chem. 2014, 14, 1923–1938. [Google Scholar] [CrossRef]
- Wichapong, K.; Rohe, A.; Platzer, C.; Slynko, I.; Erdmann, F.; Schmidt, M.; Sippl, W. Application of docking and QM/MM-GBSA rescoring to screen for novel Myt1 kinase inhibitors. J. Chem. Inf. Model. 2014, 54, 881–893. [Google Scholar] [CrossRef]
- Kim, M.; Cho, A.E. Incorporating QM and solvation into docking for applications to GPCR targets. Phys. Chem. Chem. Phys. 2016, 18, 28281–28289. [Google Scholar] [CrossRef]
- De Vivo, M.; Masetti, M.; Bottegoni, G.; Cavalli, A. Role of molecular dynamics and related methods in drug discovery. J. Med. Chem. 2016, 59, 4035–4061. [Google Scholar] [CrossRef]
- Decherchi, S.; Masetti, M.; Vyalov, I.; Rocchia, W. Implicit solvent methods for free energy estimation. Eur. J. Med. Chem. 2015, 91, 27–42. [Google Scholar] [CrossRef]
- Colizzi, F.; Perozzo, R.; Scapozza, L.; Recanatini, M.; Cavalli, A. Single-molecule pulling simulations can discern active from inactive enzyme inhibitors. J. Am. Chem. Soc. 2010, 132, 7361–7371. [Google Scholar] [CrossRef]
- Rastelli, G.; Pinzi, L. Refinement and rescoring of virtual screening results. Front. Chem. 2019, 7, 498. [Google Scholar] [CrossRef]
- Genheden, S.; Ryde, U. The MM/PBSA and MM/GBSA methods to estimate ligand-binding affinities. Expert Opin. Drug Discov. 2015, 10, 449–461. [Google Scholar] [CrossRef]
- Li, J.; Abel, R.; Zhu, K.; Cao, Y.; Zhao, S.; Friesner, R.A. The VSGB 2.0 model: A next generation energy model for high resolution protein structure modeling. Proteins 2011, 79, 2794–2812. [Google Scholar] [CrossRef] [PubMed]
- Falchi, F.; Caporuscio, F.; Recanatini, M. Structure-based design of small-molecule protein–protein interaction modulators: The story so far. Future Med. Chem. 2014, 6, 343–357. [Google Scholar] [CrossRef]
- Ferraro, M.; Colombo, G. Targeting difficult protein-protein interactions with plain and general computational approaches. Molecules 2018, 23, 2256. [Google Scholar] [CrossRef]
- Masetti, M.; Falchi, F.; Recanatini, M. Protein dynamics of the HIF-2alpha PAS-B domain upon heterodimerization and ligand binding. PLoS ONE 2014, 9, e94986. [Google Scholar] [CrossRef]
- Sastry, G.M.; Adzhigirey, M.; Day, T.; Annabhimoju, R.; Sherman, W. Protein and ligand preparation: Parameters, protocols, and influence on virtual screening enrichments. J. Comput. Aided Mol. Des. 2013, 27, 221–234. [Google Scholar] [CrossRef] [PubMed]
- Harder, E.; Damm, W.; Maple, J.; Wu, C.; Reboul, M.; Xiang, J.Y.; Wang, L.; Lupyan, D.; Dahlgren, M.K.; Knight, J.L.; et al. OPLS3: A Force Field Providing Broad Coverage of Drug-like Small Molecules and Proteins. J. Chem. Theory Comput. 2016, 12, 281–296. [Google Scholar] [CrossRef]
- Friesner, R.A.; Banks, J.L.; Murphy, R.B.; Halgren, T.A.; Klicic, J.J.; Mainz, D.T.; Repasky, M.P.; Knoll, E.H.; Shelley, M.; Perry, J.K.; et al. Glide: A new approach for rapid, accurate docking and scoring. 1. Method and assessment of docking accuracy. J. Med. Chem. 2004, 47, 1739–1749. [Google Scholar] [CrossRef]
- Halgren, T.A.; Murphy, R.B.; Friesner, R.A.; Beard, H.S.; Frye, L.L.; Pollard, W.T.; Banks, J.L. Glide: A new approach for rapid, accurate docking and scoring. 2. Enrichment factors in database screening. J. Med. Chem. 2004, 47, 1750–1759. [Google Scholar] [CrossRef]
- Friesner, R.A.; Murphy, R.B.; Repasky, M.P.; Frye, L.L.; Greenwood, J.R.; Halgren, T.A.; Sanschagrin, P.C.; Mainz, D.T. Extra precision glide: Docking and scoring incorporating a model of hydrophobic enclosure for protein-ligand complexes. J. Med. Chem. 2006, 49, 6177–6196. [Google Scholar] [CrossRef]
- Sastry, M.; Lowrie, J.F.; Dixon, S.L.; Sherman, W. Large-scale systematic analysis of 2D fingerprint methods and parameters to improve virtual screening enrichments. J. Chem. Inf. Model. 2010, 50, 771–784. [Google Scholar] [CrossRef]
- Duan, J.; Dixon, S.L.; Lowrie, J.F.; Sherman, W. Analysis and comparison of 2D fingerprints: Insights into database screening performance using eight fingerprint methods. J. Mol. Graph. Model. 2010, 29, 157–170. [Google Scholar] [CrossRef]
- Bowers, K.J.; Chow, D.E.; Xu, H.; Dror, R.O.; Eastwood, M.P.; Gregersen, B.A.; Klepeis, J.L.; Kolossvary, I.; Moraes, M.A.; Sacerdoti, F.D.; et al. Scalable Algorithms for Molecular Dynamics Simulations on Commodity Clusters. In Proceedings of the SC’06: 2006 ACM/IEEE Conference on Supercomputing, Tampa, FL, USA, 11–17 November 2006; Volume 2006. [Google Scholar]
- Berendsen, H.J.C.; van der Spoel, D.; van Drunen, R. GROMACS: A message-passing parallel molecular dynamics implementation. Comput. Phys. Commun. 1995, 91, 43–56. [Google Scholar] [CrossRef]
- Lindahl, E.; Hess, B.; van der Spoel, D. GROMACS 3.0: A package for molecular simulation and trajectory analysis. J. Mol. Model. 2001, 7, 306–317. [Google Scholar] [CrossRef]
- Van Der Spoel, D.; Lindahl, E.; Hess, B.; Groenhof, G.; Mark, A.E.; Berendsen, H.J.C. GROMACS: Fast, flexible, and free. J. Comput. Chem. 2005, 26, 1701–1718. [Google Scholar] [CrossRef]
- Daura, X.; Gademann, K.; Jaun, B.; Seebach, D.; van Gunsteren, W.F.; Mark, A.E. Peptide folding: When simulation meets experiment. Angew. Chem. Int. Ed. 1999, 38, 236–240. [Google Scholar] [CrossRef]
- Jorgensen, W.L.; Maxwell, D.S.; Tirado-Rives, J. Development and Testing of the OPLS All-Atom Force Field on Conformational Energetics and Properties of Organic Liquids. J. Am. Chem. Soc. 1996, 118, 11225–11236. [Google Scholar] [CrossRef]
- Jacobson, M.P.; Friesner, R.A.; Xiang, Z.; Honig, B. On the role of the crystal environment in determining protein side-chain conformations. J. Mol. Biol. 2002, 320, 597–608. [Google Scholar] [CrossRef]
- Jacobson, M.P.; Pincus, D.L.; Rapp, C.S.; Day, T.J.F.; Honig, B.; Shaw, D.E.; Friesner, R.A. A hierarchical approach to all-atom protein loop prediction. Proteins 2004, 55, 351–367. [Google Scholar] [CrossRef] [PubMed]
Sample Availability: Samples of the compounds are not available, data and the results of calculations are available from the authors. |


| Ranking | SiteScore | DrugScore | Volume (Å3) |
|---|---|---|---|
| HpUreD | |||
| D#1 | 1.004 | 0.986 | 167.770 |
| D#2 | 0.800 | 0.778 | 90.766 |
| D#3 | 0.785 | 0.792 | 144.060 |
| D#4 | 0.610 | 0.546 | 91.924 |
| D#5 | 0.610 | 0.514 | 71.644 |
| HpUreF | |||
| F#1 | 1.087 | 1.103 | 643.554 |
| F#2 | 0.849 | 0.818 | 109.031 |
| F#3 | 0.738 | 0.700 | 125.538 |
| F#4 | 0.864 | 0.778 | 108.645 |
| F#5 | 0.942 | 0.700 | 107.616 |
| Name | ZINC Id | Ranking | Docking Score | Cluster Id. | Logp | MW (Da) | Buriedness |
|---|---|---|---|---|---|---|---|
| F#2 | |||||||
| L1 | ZINC9827332 | 314 | −6.38 | 4 | −0.852 | 334.401 | 0.798 |
| L2 | ZINC211138067 | 361 | −6.33 | 2 | 2.404 | 301.371 | 0.776 |
| L3 | ZINC4940493 | 494 | −6.22 | 1 | 0.841 | 341.371 | 0.779 |
| F#1 | |||||||
| B1 | ZINC4373981 | 8 | −10.37 | 1 | 2.954 | 380.423 | 0.992 |
| E1 | ZINC97963747 | 11 | −10.31 | 3 | 5.193 | 552.096 | 0.870 |
| B2 | ZINC13707391 | 21 | −10.15 | 3 | 3.572 | 336.395 | 0.983 |
| B3 | ZINC9507588 | 24 | −10.09 | 5 | 3.858 | 445.426 | 0.984 |
| E2 | ZINC97961716 | 32 | −10.00 | 5 | 6.354 | 636.803 | 0.839 |
| E3 | ZINC9517885 | 36 | −9.92 | 2 | 2.359 | 496.574 | 0.813 |
| Statistical Ensemble | NPT |
| Production time | 100 ns |
| Number of repeated runs per complex | 3 |
| Timestep: bonded, near, far | 2 fs, 2 fs, 6 fs |
| Cutoff short-range interactions | 8.0 Å |
| Thermostat | Langevin, relaxation time 1.0 ps |
| Temperature | 300 K |
| Barostat | Langevin, relaxation time 2.0 ps |
| Pressure | 1 atm |
| Heating and equilibration protocol | 100 ps, T = 10 K, Brownian dynamics NVT, solute heavy atoms restrained |
| 12 ps, T = 10 K, MD NVT, solute heavy atoms restrained | |
| 12 ps, T = 10 K, MD NPT, solute heavy atoms restrained | |
| 12 ps, T = 300 K, MD NPT, solute heavy atoms restrained | |
| 24 ps, T = 300 K, MD NPT, no restraints | |
| Hardware | NVIDIA GTX980 |
© 2020 by the authors. Licensee MDPI, Basel, Switzerland. This article is an open access article distributed under the terms and conditions of the Creative Commons Attribution (CC BY) license (http://creativecommons.org/licenses/by/4.0/).
Share and Cite
Masetti, M.; Falchi, F.; Gioia, D.; Recanatini, M.; Ciurli, S.; Musiani, F. Targeting the Protein Tunnels of the Urease Accessory Complex: A Theoretical Investigation. Molecules 2020, 25, 2911. https://doi.org/10.3390/molecules25122911
Masetti M, Falchi F, Gioia D, Recanatini M, Ciurli S, Musiani F. Targeting the Protein Tunnels of the Urease Accessory Complex: A Theoretical Investigation. Molecules. 2020; 25(12):2911. https://doi.org/10.3390/molecules25122911
Chicago/Turabian StyleMasetti, Matteo, Federico Falchi, Dario Gioia, Maurizio Recanatini, Stefano Ciurli, and Francesco Musiani. 2020. "Targeting the Protein Tunnels of the Urease Accessory Complex: A Theoretical Investigation" Molecules 25, no. 12: 2911. https://doi.org/10.3390/molecules25122911
APA StyleMasetti, M., Falchi, F., Gioia, D., Recanatini, M., Ciurli, S., & Musiani, F. (2020). Targeting the Protein Tunnels of the Urease Accessory Complex: A Theoretical Investigation. Molecules, 25(12), 2911. https://doi.org/10.3390/molecules25122911