
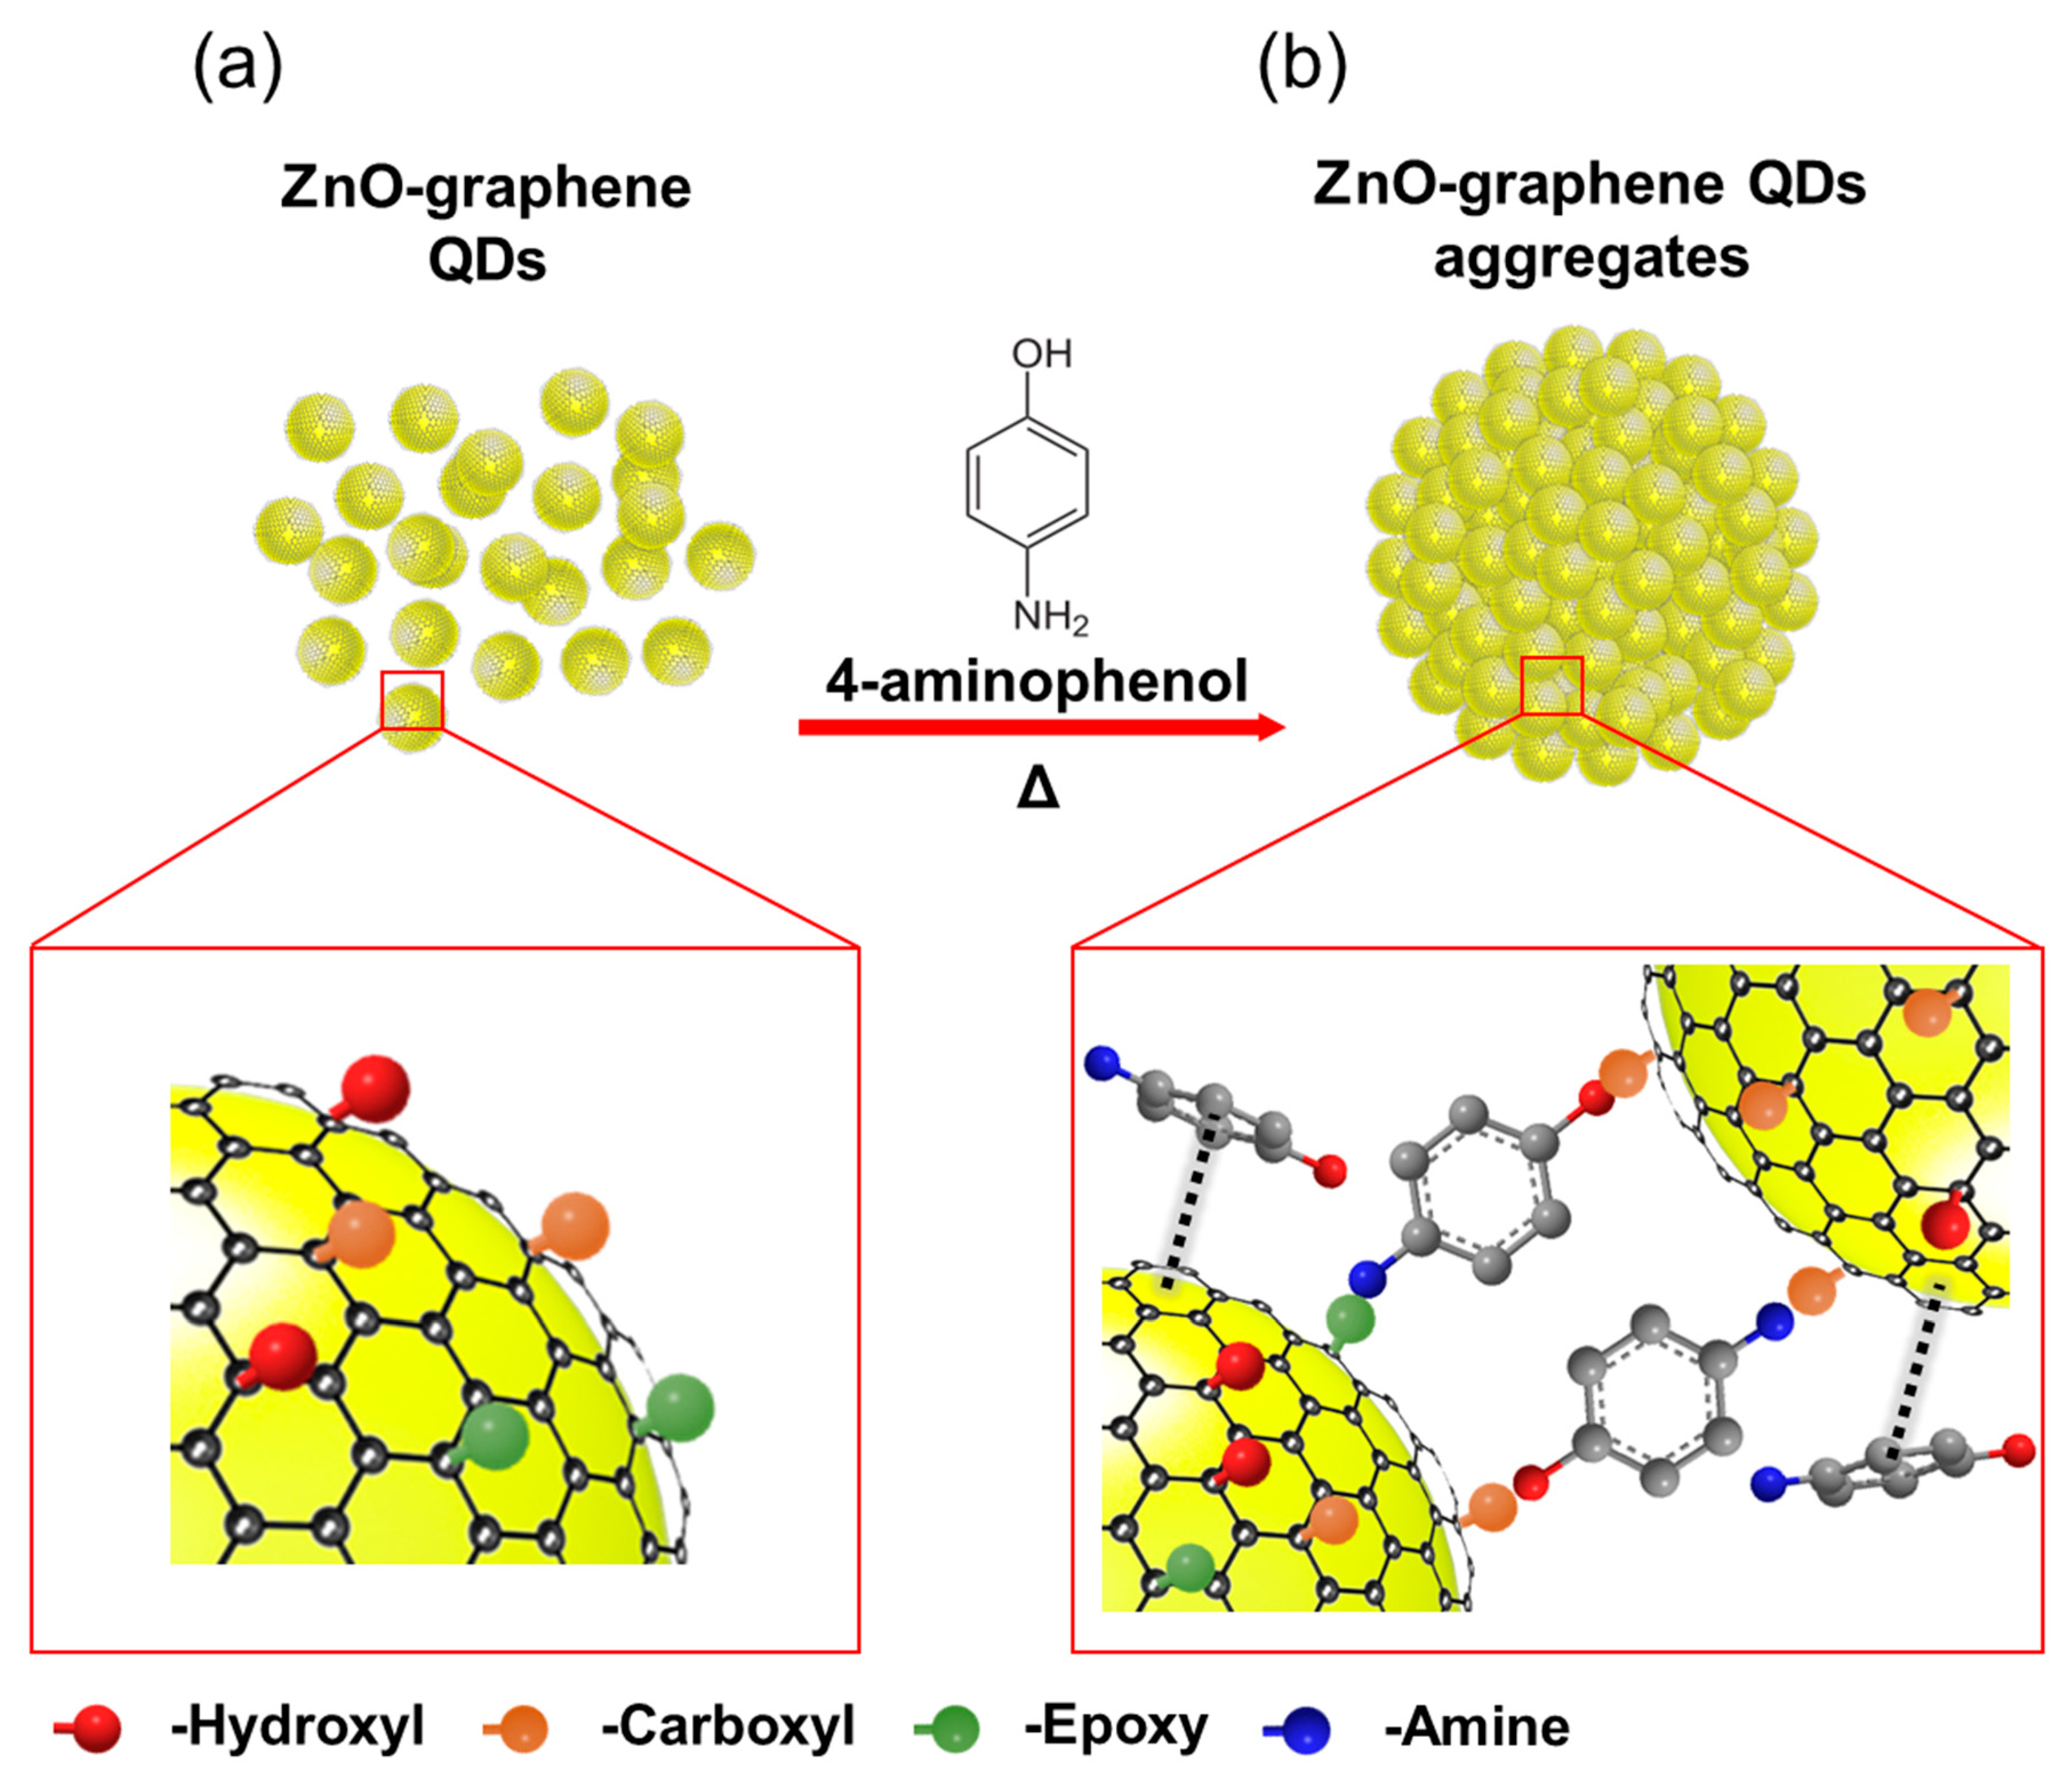
Inhibition of Photoconversion Activity in Self-Assembled ZnO-Graphene Quantum Dots Aggregated by 4-Aminophenol Used as a Linker

 ,
,  ,
,
Abstract
:1. Introduction
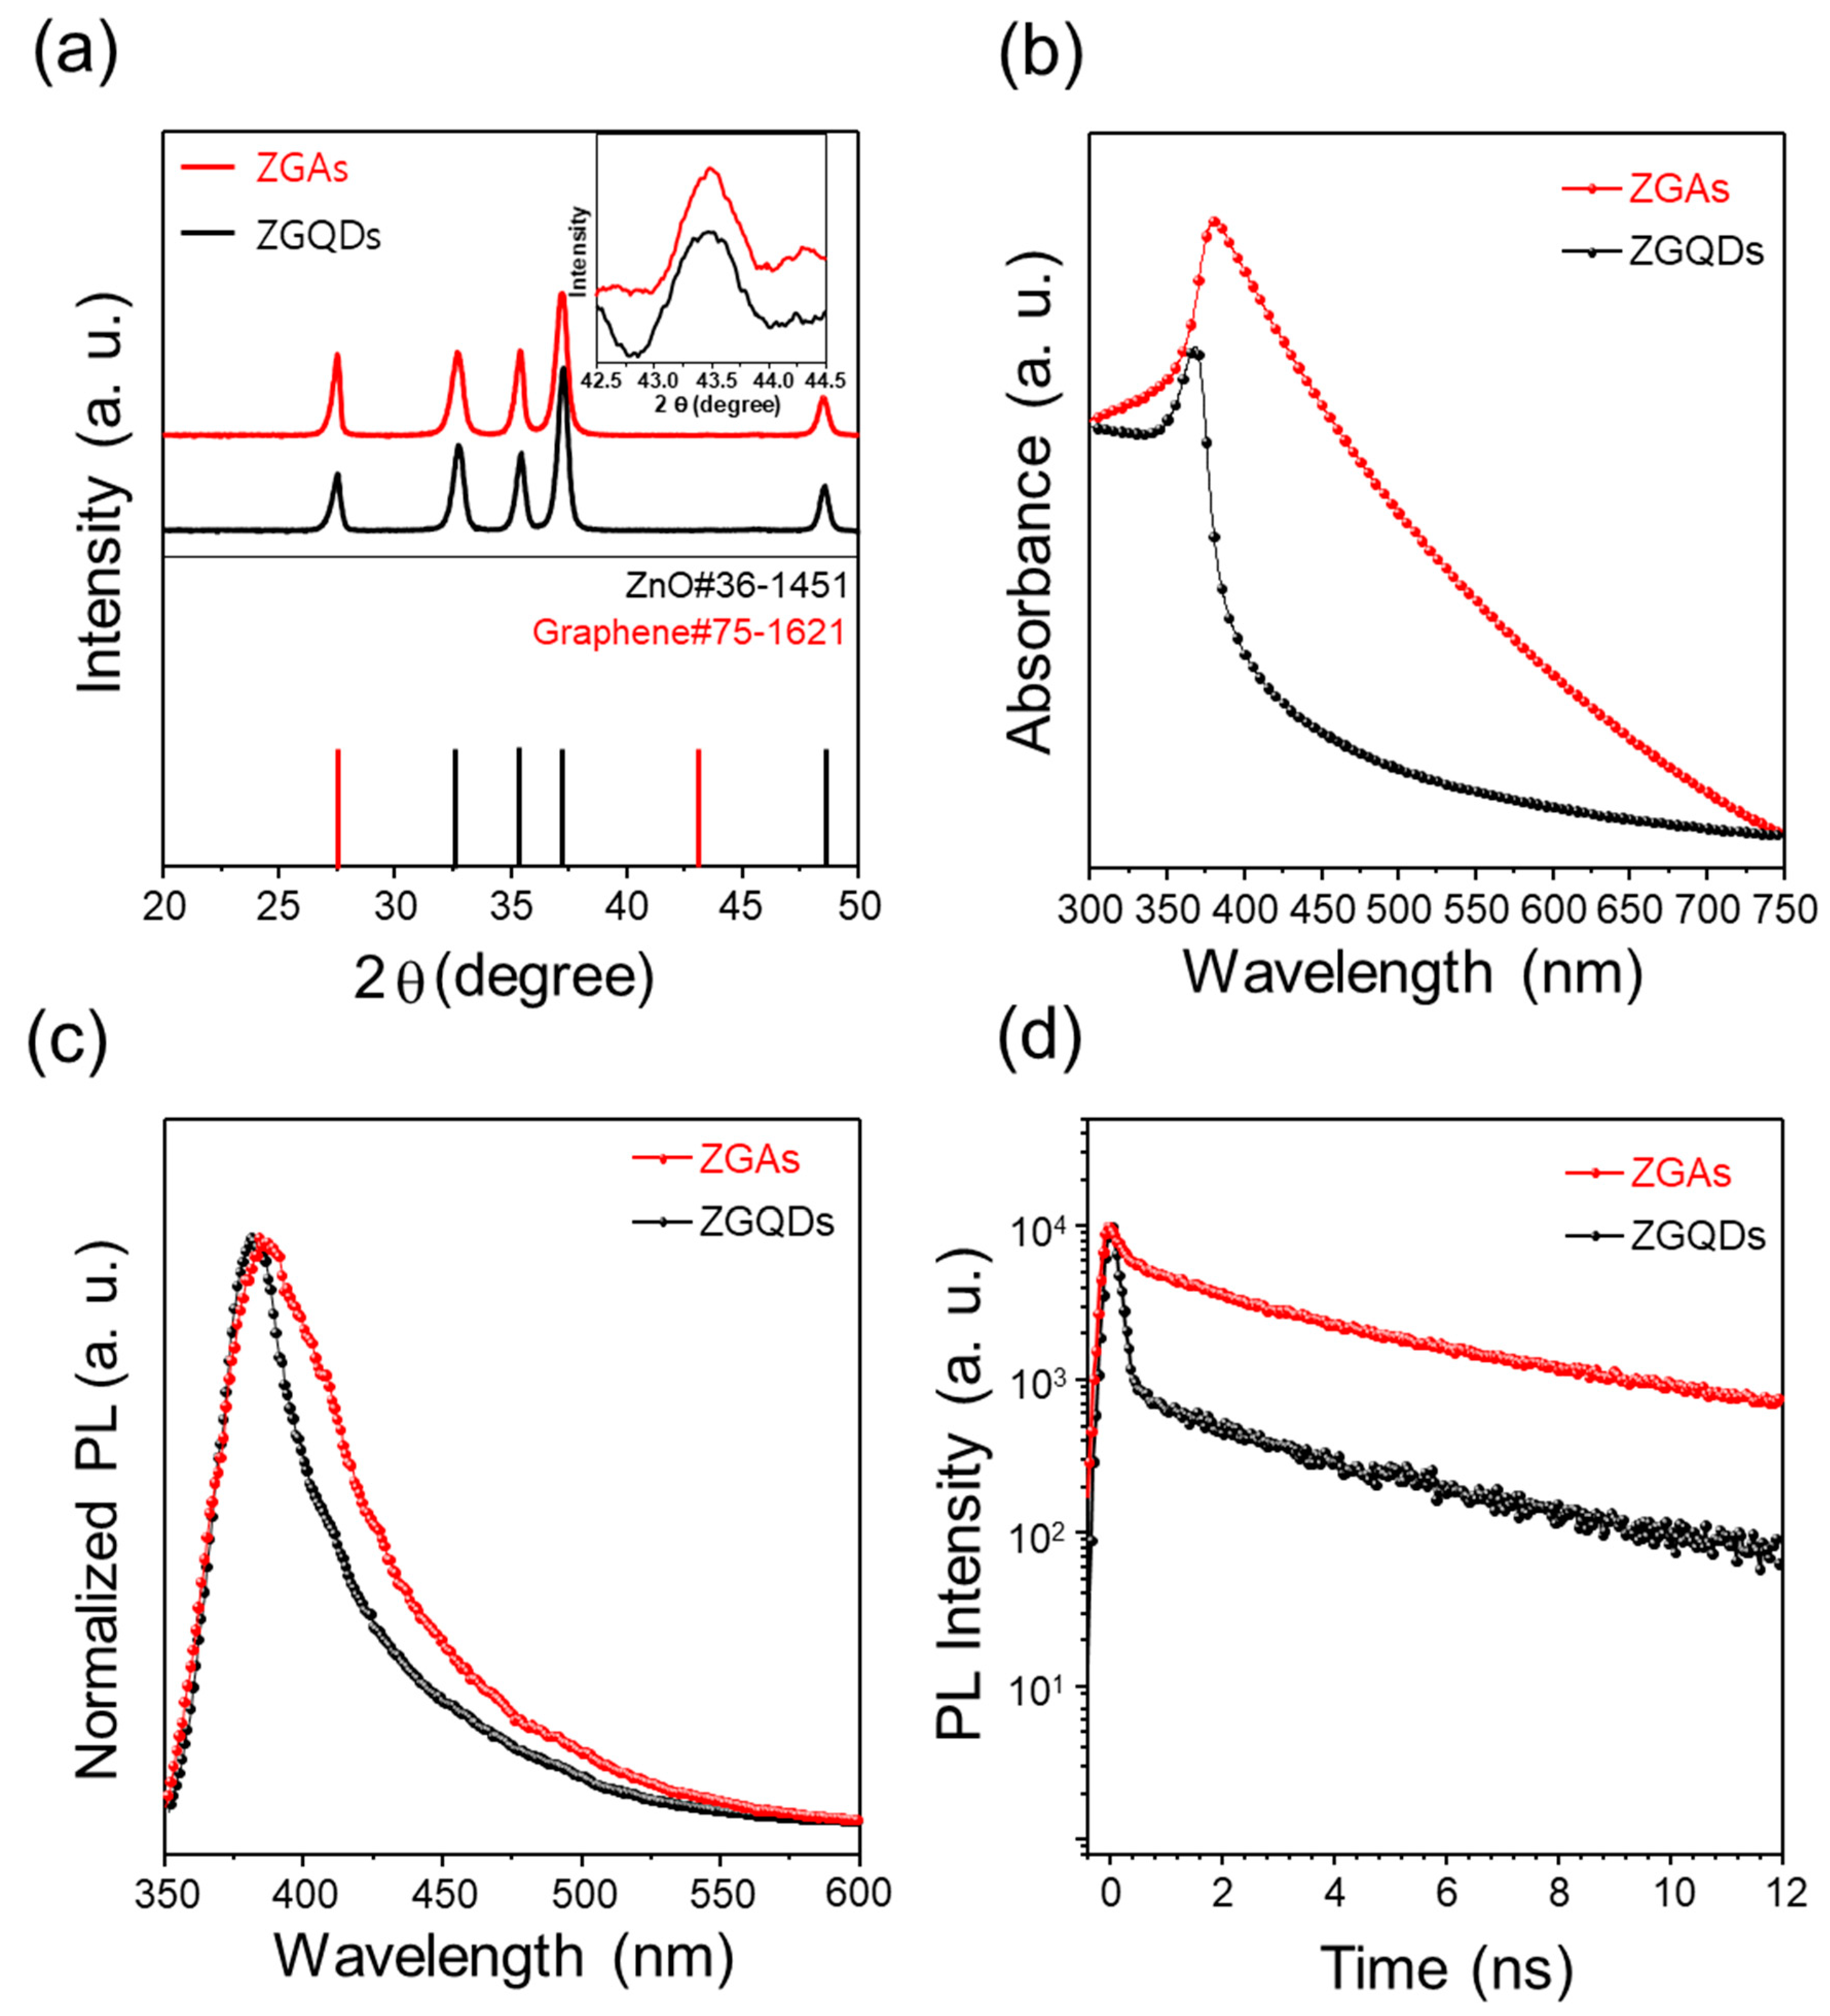
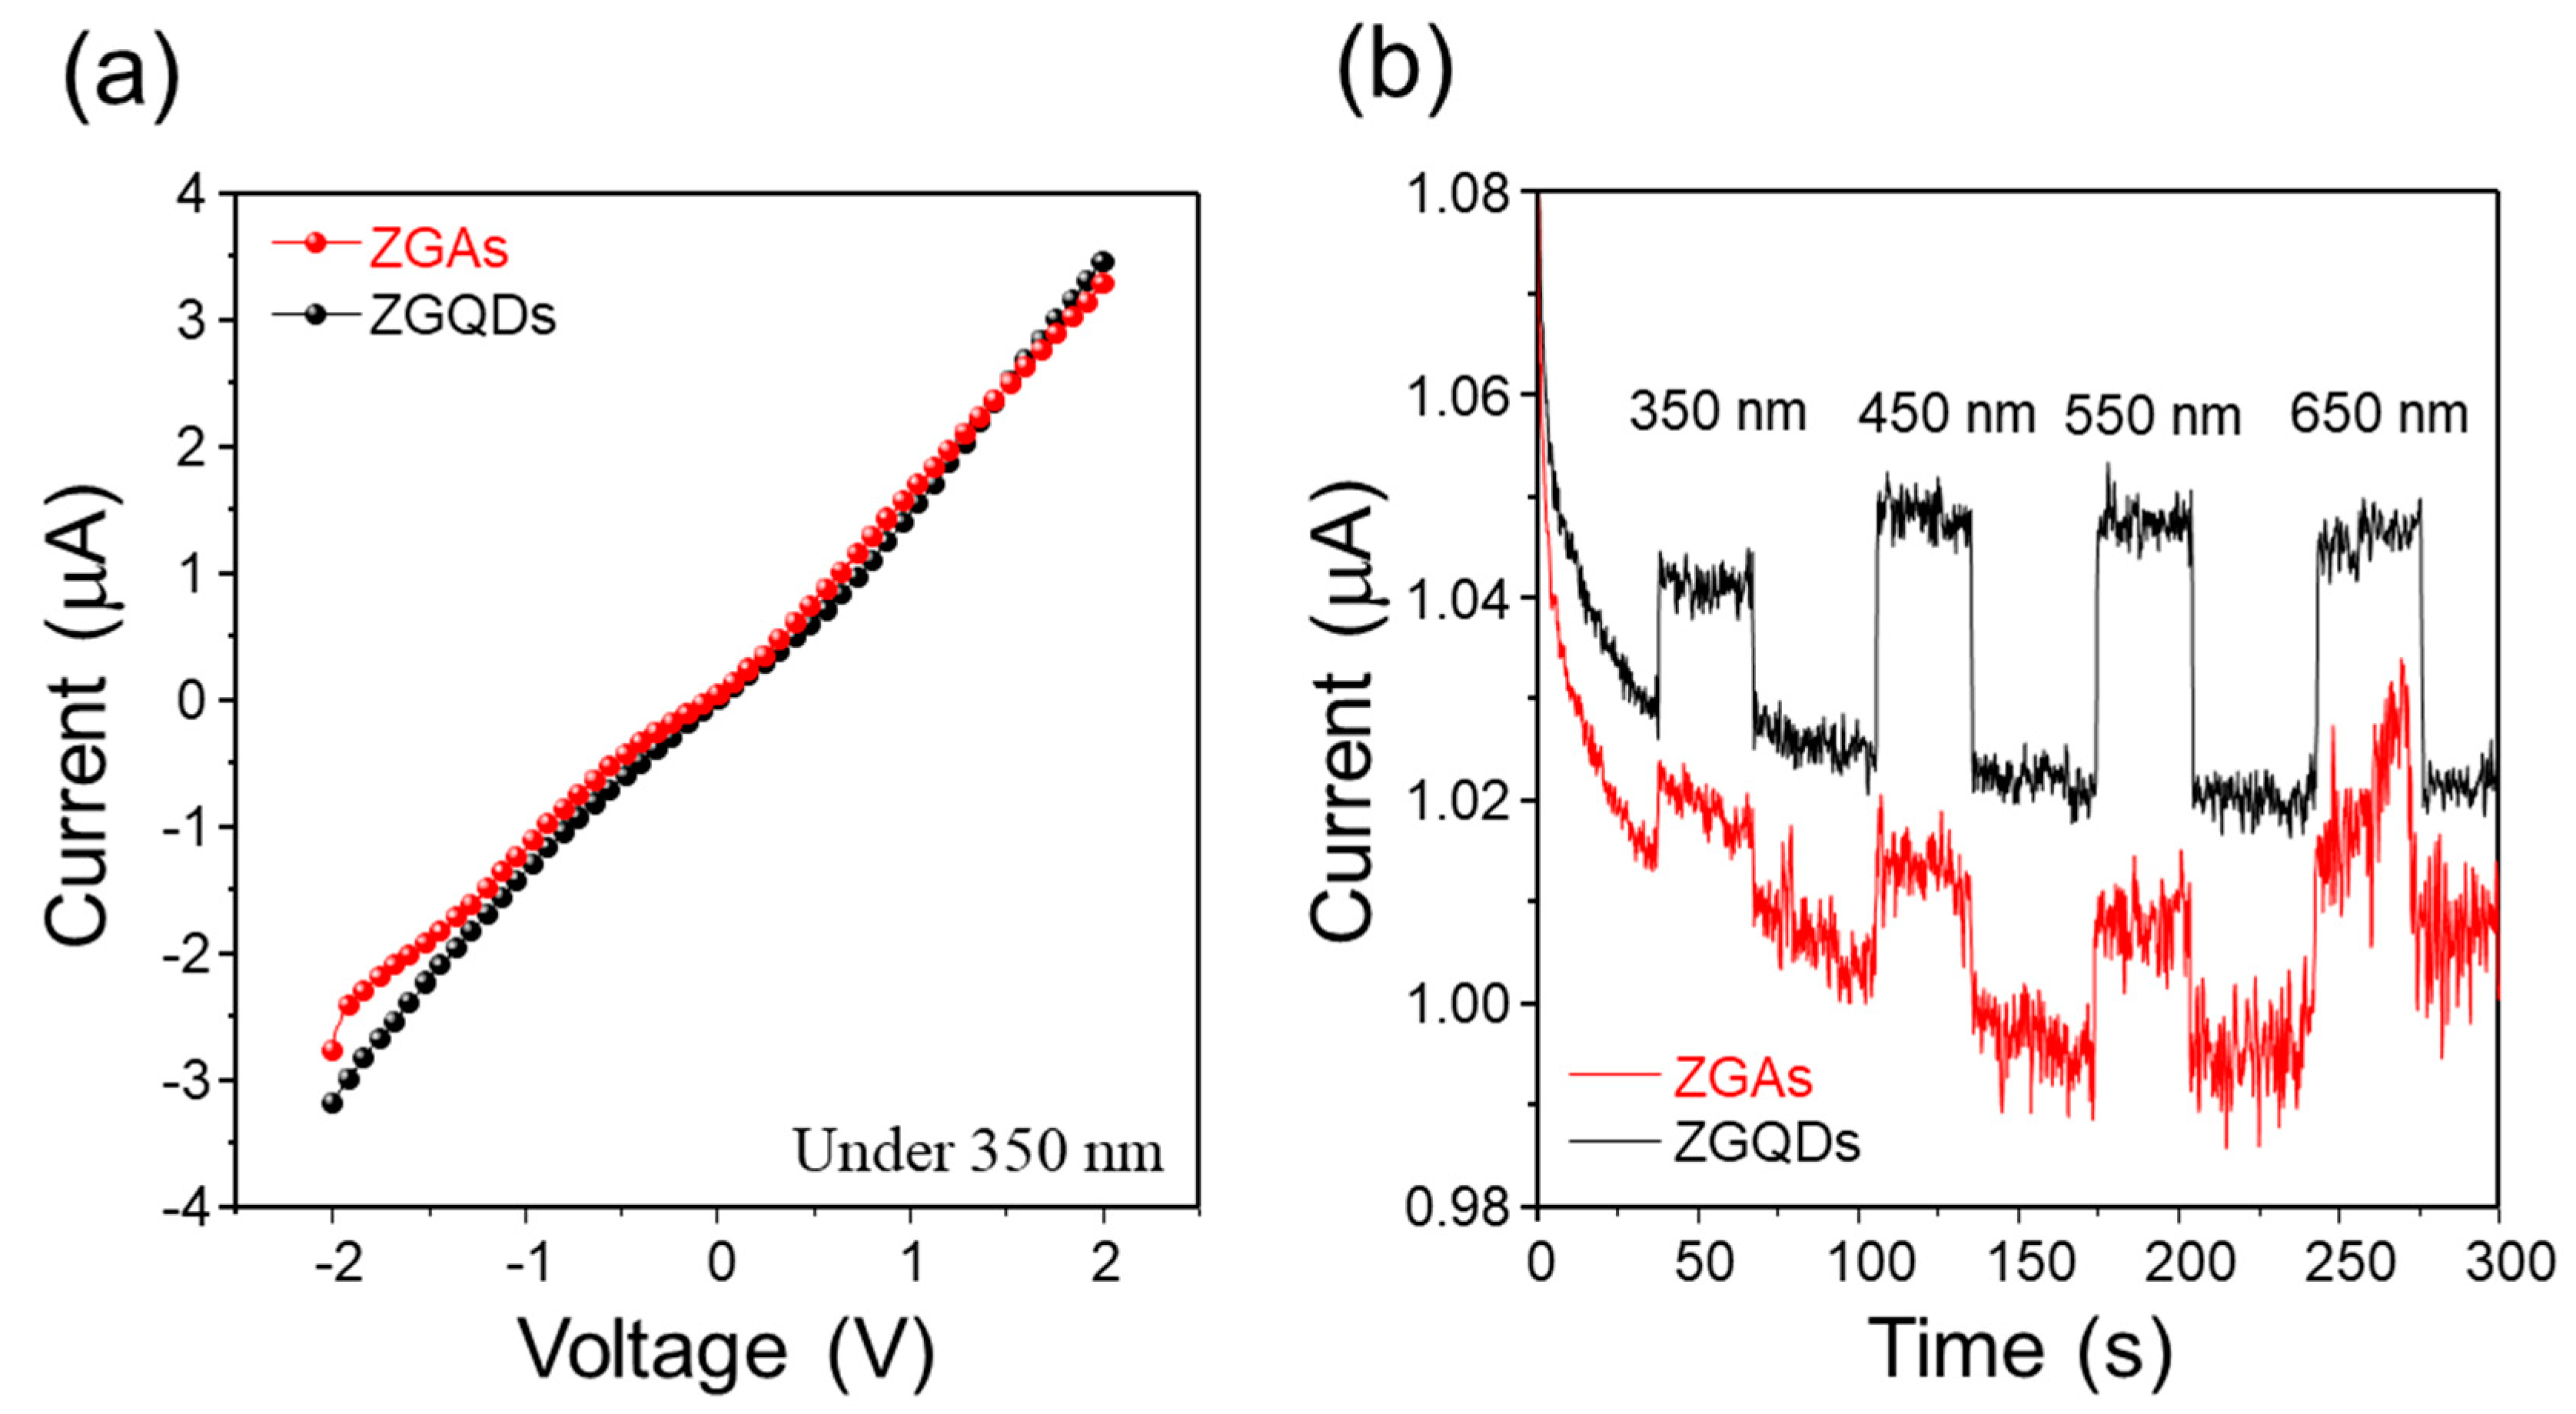
2. Results and Discussion
3. Experimental Details
3.1. Synthesis of ZGAs
3.2. Characterization of ZGAs and ZGQDs
3.3. Photoelectrochemical (PEC) Measurements
3.4. Photodegradation Experiment
3.5. Fabrication of ZGA- and ZGQD-Based Photodetector and Measurements
4. Conclusions
Supplementary Materials
Author Contributions
Funding
Conflicts of Interest
References
- Liu, K.; Sakurai, M.; Aono, M. ZnO-Based Ultraviolet Photodetectors. Sensors 2010, 10, 8604–8634. [Google Scholar] [CrossRef] [Green Version]
- Zhai, T.; Fang, X.; Liao, X.; Xu, X.; Zeng, H.; Yoshio, B.; Golberg, D. A Comprehensive Review of One-Dimensional Metal-Oxide Nanostructure Photodetectors. Sensors 2009, 9, 6504–6529. [Google Scholar] [CrossRef]
- Shao, D.; Yu, M.; Lian, J.; Sawyer, S. An ultraviolet photodetector fabricated from WO3 nanodiscs/reduced graphene oxide composite material. Nanotechnology 2013, 24, 295701. [Google Scholar] [CrossRef] [PubMed]
- Zhao, C.; Liang, Z.; Su, M.; Liu, P.; Mai, W.; Xie, W. Self-Powered, High-Speed and Visible–Near Infrared Response of MoO3–x/n-Si Heterojunction Photodetector with Enhanced Performance by Interfacial Engineering. ACS Appl. Mater. Interfaces 2015, 7, 25981–25990. [Google Scholar] [CrossRef] [PubMed]
- Li, S.-S.; Chen, C.-W. Polymer–metal-oxide hybrid solar cells. J. Mater. Chem. A 2013, 1, 10574–10591. [Google Scholar] [CrossRef]
- Zheng, H.; Tachibana, Y.; Kalantar-zadeh, K. Dye-Sensitized Solar Cells Based on WO3. Langmuir 2010, 26, 19148–19152. [Google Scholar] [CrossRef] [PubMed]
- Schulz, P.; Tiepelt, J.; Christians, J.A.; Levine, I.; Edri, E.; Sanehira, E.M.; Hodes, G.D. High Work-Function Molybdenum Oxide Hole Extraction Contacts in Hybrid Organic–Inorganic Perovskite Solar Cells. ACS Appl. Mater. Interfaces 2016, 8, 31491–31499. [Google Scholar] [CrossRef]
- Chen, Q.; Tong, R.; Chen, X.; Xue, Y.; Xie, Z.; Kuang, Q.; Zheng, L. Ultrafine ZnO quantum dot-modified TiO2 composite photocatalysts: The role of the quantum size effect in heterojunction-enhanced photocatalytic hydrogen evolution. Catal. Sci. Technol. 2018, 8, 1296–1303. [Google Scholar] [CrossRef]
- Feng, X.; Litao, S. Solution-derived ZnO nanostructures for photoanodes of dye-sensitized solar cells. Energy Environ. Sci. 2011, 4, 818. [Google Scholar]
- Hamann, T.W.; Martinson, A.B.F.; Elam, M.J.W.; Pellin, M.J.; Hupp, J.T. Aerogel Templated ZnO Dye-Sensitized Solar Cells. Adv. Mater. 2008, 20, 1560–1564. [Google Scholar] [CrossRef]
- Wu, D.; Gao, Z.; Xu, F.; Chang, J.; Tao, W.; He, J.; Gao, S.; Jiang, K. Hierarchical ZnO aggregates assembled by orderly aligned nanorods for dye-sensitized solar cells. Cryst. Eng. Comm. 2013, 15, 1210–1217. [Google Scholar] [CrossRef]
- Chemelewski, W.D.; Lee, H.-C.; Lin, J.-F.; Bard, A.J.; Mullins, C.B. Amorphous FeOOH Oxygen Evolution Reaction Catalyst for Photoelectrochemical Water Splitting. J. Am. Chem. Soc. 2014, 136, 2843–2850. [Google Scholar] [CrossRef]
- Wang, Y.; Shi, R.; Lin, J.; Zhu, Y. Enhancement of photocurrent and photocatalytic activity of ZnO hybridized with graphite-like C3N4. Energy Environ. Sci. 2011, 4, 2922–2929. [Google Scholar] [CrossRef]
- Kim, J.K.; Bae, S.; Kim, W.; Jeong, M.J.; Lee, S.H.; Lee, C.-L.; Choi, W.K.; Hwang, J.Y.; Park, J.H.; Son, D.I. Nano carbon conformal coating strategy for enhanced photoelectrochemical responses and long-term stability of ZnO quantum dots. Nano Energy 2015, 13, 258–266. [Google Scholar] [CrossRef]
- Vusa, C.S.R.; Venkatesan, M.; Aneesh, K.; Berchmans, S.; Arumugam, P. Tactical tuning of the surface and interfacial properties of graphene: A Versatile and rational electrochemical approach. Sci. Reports 2017, 7, 8354. [Google Scholar] [CrossRef]
- Son, D.I.; Kwon, B.W.; Park, D.H.; Seo, W.S.; Yi, Y.; Angadi, B.; Lee, C.L.; Choi, W.K. Emissive ZnO-graphene quantum dots for white-light-emitting diodes. Nat. Nanotechnol. 2012, 7, 465. [Google Scholar] [CrossRef]
- Xue, B.; Zhu, J.; Liu, N.; Li, Y. Facile functionalization of graphene oxide with ethylenediamine as a solid base catalyst for Knoevenagel condensation reaction. Catal. Commun. 2015, 64, 105–109. [Google Scholar] [CrossRef]
- Georgakilas, V.; Tiwari, J.N.; Kemp, C.; Perman, J.A.; Bourlinos, A.B.; Kim, K.S.; Zboril, R. Noncovalent Functionalization of Graphene and Graphene Oxide for Energy Materials, Biosensing, Catalytic, and Biomedical Applications. Chem. Rev. 2016, 116, 5464–5519. [Google Scholar] [CrossRef] [Green Version]
- Lin, Y.; Jin, J.; Song, M. Preparation and characterisation of covalent polymer functionalized graphene oxide. J. Mater. Chem. 2011, 21, 3455–3461. [Google Scholar] [CrossRef]
- Tang, X.-Z.; Li, W.; Yu, Z.-Z.; Rafiee, M.A.; Rafiee, J.; Yavari, F.; Koratkarm, N. Enhanced thermal stability in graphene oxide covalently functionalized with 2-amino-4,6-didodecylamino-1,3,5-triazine. Carbon 2011, 49, 1258–1265. [Google Scholar] [CrossRef]
- Kudin, K.N.; Ozbas, B.; Schniepp, H.C.; Prud’homme, R.K.; Aksay, I.A.; Car, R. Raman Spectra of Graphite Oxide and Functionalized Graphene Sheets. Nano Lett. 2008, 8, 36–41. [Google Scholar] [CrossRef] [PubMed]
- Ferrari, A.C.; Meyer, J.C.; Scardaci, V.; Casiraghi, C.; Lazzeri, M.; Mauri, F.; Piscanec, S.; .Jiang, D.; Novoselov, K.S.; Roth, S.; et al. Raman Spectrum of Graphene and.Graphene Layers. Phys. Rev. Lett. 2006, 97, 187401. [Google Scholar] [CrossRef] [PubMed] [Green Version]
- Rao, A.M.; Eklund, P.C.; Bandow, S.; Thess, A.; Smalley, R.A. Evidence for charge transfer.in doped carbon nanotube bundles from Raman scattering. Nature 1997, 388, 257. [Google Scholar] [CrossRef]
- Das, A.; Pisana, S.; Chakraborty, B.; Piscanec, S.; Saha, S.K.; Waghmare, U.V.; Novoselov, K.S.; Krishnamurthy, H.R.; Geim, A.K.; Ferrari, A.C.; et al. Monitoring dopants by Raman scattering in an electrochemically top-gated graphene transistor. Nat. Nanotechnol. 2008, 3, 210. [Google Scholar] [CrossRef] [PubMed] [Green Version]
- Moon, B.J.; Lee, K.S.; Shim, J.H.; Park, S.H.; Kim, S.H.; Bae, S.; Park, M.; Lee, C.L.; Choi, W.K.; Yi, Y.; et al. Enhanced photovoltaic performance of inverted. polymer solar cells utilizing versatile chemically functionalized ZnO@graphene quantum dot monolayer. Nano Energy 2016, 20, 221–232. [Google Scholar] [CrossRef]
- Liu, Y.; Zhou, J.; Zhu, E.; Tang, J.; Liu, X.; Tang, W. Facile synthesis of bacterial cellulose. fibres covalently intercalated with graphene oxide by one-step cross-linking for robust supercapacitors. J. Mater. Chem. C 2015, 3, 1011–1017. [Google Scholar] [CrossRef]
- Krishna, R.; Fernandes, D.M.; Dias, C.; Ventura, J.; Ramana, E.V.; Freire, C.; Titus, E. Novel synthesis of Ag@Co/RGO nanocomposite and its high catalytic activity towards hydrogenation of 4-nitrophenol to 4-aminophenol. Int. J. Hydrog. Energy 2015, 40, 4996–5005. [Google Scholar] [CrossRef]
- Zhang, Q.; Chou, T.P.; Russo, B.; Jenekhe, S.A.; Cao, G. Aggregation of ZnO nanocrystallites for high conversion efficiency in dye-sensitized solar cells. Angew. Chem. Int. Ed. 2008, 47, 2402–2406. [Google Scholar] [CrossRef]
- Xu, T.; Zhang, L.; Cheng, H.; Zhu, Y. Significantly enhanced photocatalytic performance of ZnO via graphene hybridization and the mechanism study. Appl. Catal. B Environ. 2011, 101, 382–387. [Google Scholar] [CrossRef]
- Lee, K.S.; Park, Y.J.; Shim, J.; Chung, H.-S.; Yim, S.-Y.; Hwang, J.Y.; Cho, H.; Lim, B.; Son, D.I. ZnO@graphene QDs with tuned surface functionalities formed on eco-friendly keratin nanofiber textile for transparent and flexible ultraviolet photodetectors. Org. Electron. 2020, 77, 105489. [Google Scholar] [CrossRef]
- Kim, J.K.; Moon, J.H.; Lee, T.-W.; Park, J.H. Inverse opal tungsten trioxide films with mesoporous skeletons: Synthesis and photoelectrochemical responses. Chem. Commun. 2012, 48, 11939. [Google Scholar] [CrossRef] [Green Version]
- Xiong, J.; Li, Z.; Chen, J.; Zhang, S.; Wang, L.; Dou, S. Facile Synthesis of Highly Efficient One-Dimensional Plasmonic Photocatalysts through Ag@Cu2O Core–Shell Heteronanowires. ACS Appl. Mater. Interfaces 2014, 6, 15716–15725. [Google Scholar] [CrossRef] [PubMed] [Green Version]
- Boruah, B.D. Zinc oxide ultraviolet photodetectors: Rapid progress from conventional to self-powered photodetectors. Nanoscale Adv. 2019, 1, 2059–2085. [Google Scholar] [CrossRef] [Green Version]
Sample Availability: Samples of the compounds are available from the authors. |


| Sample | Rise Time (s) | Fall Time (s) | Darkcurrent (μA·cm−2) | Photocurrent (μA·cm−2) | Sensitivity | Responsivity (μA·mW−1) |
|---|---|---|---|---|---|---|
| ZGQDs | 28.2 | 0.7 | 7.28 | 7.38 | 0.0137 | 3.85 |
| ZGAs | 29.9 | 0.8 | 8.16 | 8.2 | 0.005 | 1.54 |
© 2020 by the authors. Licensee MDPI, Basel, Switzerland. This article is an open access article distributed under the terms and conditions of the Creative Commons Attribution (CC BY) license (http://creativecommons.org/licenses/by/4.0/).
Share and Cite
Lee, K.S.; Park, Y.J.; Shim, J.; Lim, G.-H.; Yim, S.-Y.; Seo, J.W.; Ryu, J.H.; Son, D.I. Inhibition of Photoconversion Activity in Self-Assembled ZnO-Graphene Quantum Dots Aggregated by 4-Aminophenol Used as a Linker. Molecules 2020, 25, 2802. https://doi.org/10.3390/molecules25122802
Lee KS, Park YJ, Shim J, Lim G-H, Yim S-Y, Seo JW, Ryu JH, Son DI. Inhibition of Photoconversion Activity in Self-Assembled ZnO-Graphene Quantum Dots Aggregated by 4-Aminophenol Used as a Linker. Molecules. 2020; 25(12):2802. https://doi.org/10.3390/molecules25122802
Chicago/Turabian StyleLee, Kyu Seung, Young Jae Park, Jaeho Shim, Guh-Hwan Lim, Sang-Youp Yim, Jin Won Seo, Jae Hyoung Ryu, and Dong Ick Son. 2020. "Inhibition of Photoconversion Activity in Self-Assembled ZnO-Graphene Quantum Dots Aggregated by 4-Aminophenol Used as a Linker" Molecules 25, no. 12: 2802. https://doi.org/10.3390/molecules25122802
APA StyleLee, K. S., Park, Y. J., Shim, J., Lim, G.-H., Yim, S.-Y., Seo, J. W., Ryu, J. H., & Son, D. I. (2020). Inhibition of Photoconversion Activity in Self-Assembled ZnO-Graphene Quantum Dots Aggregated by 4-Aminophenol Used as a Linker. Molecules, 25(12), 2802. https://doi.org/10.3390/molecules25122802