Article

Zinc Phthalocyanine Photochemistry by Raman Imaging, Fluorescence Spectroscopy and Femtosecond Spectroscopy in Normal and Cancerous Human Colon Tissues and Single Cells

Laboratory of Laser Molecular Spectroscopy, Institute of Applied Radiation Chemistry, Lodz University of Technology, Wroblewskiego 15, 93-590 Lodz, Poland
*
Author to whom correspondence should be addressed.
Molecules 2020, 25(11), 2688; https://doi.org/10.3390/molecules25112688
Submission received: 4 May 2020 / Revised: 8 June 2020 / Accepted: 9 June 2020 / Published: 10 June 2020

Abstract

:
Photodynamic therapy is a clinically approved alternative method for cancer treatment in which a combination of nontoxic drugs known as photosensitizers and oxygen is used. Despite intensive investigations and encouraging results, zinc phthalocyanines (ZnPcs) have not yet been approved as photosensitizers for clinical use. Label-free Raman imaging of nonfixed and unstained normal and cancerous colon human tissues and normal human CCD18-Co and cancerous CaCo-2 cell lines, without and after adding ZnPcS4 photosensitizer, was analyzed. The biochemical composition of normal and cancerous colon tissues and colon cells without and after adding ZnPcS4 at the subcellular level was determined. Analyzing the fluorescence/Raman signals of ZnPcS4, we found that in normal human colon tissue samples, in contrast to cancerous ones, there is a lower affinity to ZnPcS4 phthalocyanine. Moreover, a higher concentration in cancerous tissue was concomitant with a blue shift of the maximum peak position specific for the photosensitizer from 691–695 nm to 689 nm. Simultaneously for both types of samples, the signal was observed in the monomer region, confirming the excellent properties of ZnPcS4 for photo therapy (PDT). For colon cell experiments with a lower concentration of ZnPcS4 photosensitizer, c = 1 × 10⁻⁶ M, the phthalocyanine was localized in mitochondria/lipid structures; for a higher concentration, c = 9 × 10⁻⁶ M, localization inside the nucleus was predominant. Based on time-resolved experiments, we found that ZnPcS4 in the presence of biological interfaces features longer excited-state lifetime photosensitizers compared to the aqueous solution and bare ZnPcS4 film on CaF2 substrate, which is beneficial for application in PDT.

1. Introduction

Phthalocyanines are important photosensitizers in medical photo diagnostic and photo therapy (PDD, PDT). The unique physical and chemical properties of phthalocyanines, such as their similarity in structure to the biological molecules (chlorophyll, hemoglobin), diversity in chemical structure (central atoms, substituents), near-infrared absorption, high excitation coefficients (typically >105 L mol−1cm−1), and intrinsic capability to self-assemble, have increased interest in this group of compounds for many years and are crucial for their applications in medicine [1,2,3,4,5,6,7,8,9,10,11,12,13,14,15,16,17,18,19,20].
Every year, the World Health Organization reports thousands of new cases of cancer and around 10 million cancer deaths. Colorectal cancer is the top-ranking cancer, with a ca. 60% mortality rate worldwide. Colectomy, chemotherapy, and radiotherapy are the primary therapeutic methods. However, the chemotherapeutic drug-based treatment of colon cancer is challenging due to the high metastatic potential of cancerous human colon cells and drug toxicity. This is why all new diagnostics and treatment protocols—designed for early-stage cancer detection and the programming of cancer cells’ destruction—are so promising in the fight against this deadly disease.
PDT is an alternative to chemotherapy and chemoradiotherapy. To be brief, PDT involves the combination of light and a photosensitizer. Both factors are harmless in and of themselves, but when combined with oxygen they produce lethal cytotoxic agents, such as singlet oxygen, that destroy cancer cells. It has been proven that the presence of diamagnetic atoms in the phthalocyanine complex, such as zinc (II), aluminum (III), gallium (III), and silicon, results in high triplet quantum yields (ΦT > 0.4) and long triplet lifetimes (τT > 100 μs) [21]. Both of these parameters, ΦT and τT, effectively influence the efficiency of singlet oxygen generation [21]. Zinc phthalocyanines (ZnPcs) have additional advantageous characteristics such as high chemical and photochemical stability, and excitation at wavelengths greater than 630 nm, resulting in deep tissue penetration, and low dark toxicity [22,23]. The relatively poor solubility of ZnPcs can be overcome by introducing peripheral and non-peripheral substituents in the Pc framework. Another important disadvantage of Pcs, including ZnPcs, is their intrinsic capability to self-assemble, which effectively reduces the capacity for singlet oxygen production. The photochemical activity is exclusively related to the monomer species [24,25]. Aggregates not only decrease the photoactivity of the Pcs, but also limit access to the neoplastic cells, affecting the bioavailability [26]. This is why additional studies to design new soluble compounds are still necessary. A higher affinity of Pcs to the cancer cells can be obtained due to the specific structure of membranes of cells, e.g., a high content of low-density lipoprotein receptors, which enhances the uptake of photosensitizers [27].
One of the most important factors in PDT is selectivity towards diseased tissue, as only those cells that are simultaneously exposed to the photosensitizer, light, and oxygen are subject to the cytotoxic effect. The selectivity of PDT can be obtained in different ways: by preferential uptake of the photosensitizer by the diseased tissue or by the ability to confine the activation of the photosensitizer by restricting the illumination to a specific tissue region. In general, PDT should allow for the selective destruction of cancers, leaving normal tissue intact.
To date, only a few phthalocyanines have been approved for clinical use or have reached the stage of clinical testing: aluminum phthalocyanine (Photosens®, Russia), against skin, breast, and lung malignancies and cancers of the gastrointestinal tract; and silicon Pc (Pc4®, USA), for the sterilization of blood components against human colon, breast, and ovarian cancers, and gliomas. Zinc phthalocyanine (CGP55847) has undergone clinical trials (phase I/II in Switzerland) against squamous cell carcinomas of the upper aerodigestive tract.
Raman spectroscopy and imaging are well known as sensitive, nondestructive, and highly structured methods that allow for the simultaneous characterization of the biological tissue samples and their interactions with drugs, including photosensitizers, with minimal impact. It has been shown that Raman spectroscopy and imaging have great potential in cancer identification for many human organs (brain [28,29,30,31], breast [32,33,34,35,36,37], esophageal [38,39], stomach [40], salivary gland [41], cervical [42], and colon [43,44,45]) with high sensitivity and specificity. Simultaneously promising results in Pcs characterization, including their aggregation and selective accumulation, crucial for effective PDT, have been obtained by using Raman spectroscopy and imaging [46,47,48,49,50]. It has also been shown that Raman spectroscopy and imaging can determine effective light doses for PDT, which are safe for noncancerous human tissues surrounding tumor masses and also sufficient to destroy cancer cells [51].
Mechanisms of energy dissipation in biological samples, including systems containing photosensitizers, can be determined by femtosecond spectroscopy. It has been shown that the photochemistry mechanisms observed for normal and cancerous human tissues are different and characterized by long-timescale relaxation processes typical of cancer cells [52,53]. The excited-state lifetime of zinc tetrasulphonated phthalocyanine (ZnPcS4) in pure water was found to be fast (<80 ps) due to the formation of aggregates. On the contrary, in micelles the electronic relaxation appears to be longer than 1 ns. The elongation of the lifetime in micelles is advantageous for PDT because ZnPcS4 has more time to transfer electronic energy from its triplet state to the triplet state of O2, which leads to an increase in the quantum yield of singlet oxygen formation [54].
Despite phthalocyanines having been studied for many years by experimental and theoretical methods, some problems remain to be solved, including selective accumulation in biological systems and interactions with cells and tissues.
In this paper, we will focus on the photochemical properties of ZnPcS4 and the interactions of ZnPcS4 with normal and cancerous human colon cells and tissues.

2. Experimental Methods

2.1. Phthalocyanine Synthesis

Zinc tetrasulphonated phthalocyanine was synthesized according to Griffiths and co-workers’ method [52]. In this method, dry 4-sulphophthalic anhydride, urea, ammonium chloride, ammonium molybdate, boric acid, and anhydrous aluminum chloride are introduced to sulfolane, slowly heated, and kept for a few hours at a high temperature. The excess of sulfolane is removed and the residue is dissolved in hot water. Finally, a chromatographically pure dye is obtained.

2.2. Sample Preparation

Tissue samples were collected during routine surgery. The nonfixed, fresh samples were used to prepare 16 μm sections. Specimens of the tissue from the tumor mass and the tissue from the safety margin outside of the tumor mass were prepared for Raman analysis by placing the samples on CaF2 windows. Adjacent sections were used for the typical histological analysis. All tissue procedures were conducted under a protocol approved by the institutional Bioethical Committee at the Medical University of Lodz, Poland (RNN/323/17/KE/17/10/2017). Written informed consent was obtained from all patients. Details of the sample preparation and the research methodology were given in our previous papers [32,50,51,52]. There are 30 patients in our database.

2.3. Cell Culture

CCD-18Co (CRL-1459) cell line was purchased from ATCC (American Type Culture Collection) and cultured using ATCC-formulated Eagle’s Minimum Essential Medium (catalog No. 30-2003). To make the complete growth medium, fetal bovine serum was added to a final concentration of 10%. Every 2–3 days, a new medium was used. The CaCo-2 cell line was also purchased from ATCC and cultured according to the ATCC protocols. To make the complete growth medium base on Eagle’s Minimum Essential Medium, we added a fetal bovine serum to a final concentration of 20%. The medium was renewed once or twice a week. For all results presented in this manuscript, we recorded the Raman spectra and imaging for paraformaldehyde-fixed cells. The procedure for fixed cells was as follows: cells were seeded onto CaF2 windows (25 × 1 mm) at a low density of 103 cells/cm3. After 24 h incubation on the CaF2 slides of up to half of the samples, ZnPcS4-H2O solution was added for 30 min. After 30 min, the cells were rinsed with phosphate-buffered saline (PBS, Sigma P-5368, pH 7.4 at 25 °C, c = 0.01 M) to remove any residual medium and an excess photosensitizer that did not penetrate inside the cells to be sure that we analyze only the ZnPcS4 accumulated inside the cells, fixed in paraformaldehyde (4% buffered formaldehyde) for 10 min, and washed twice with distilled water. The Raman confocal measurements or femtosecond measurements were made immediately after the preparation of the samples.

2.4. Raman Spectroscopy and Imaging

All Raman images and spectra reported in this manuscript were recorded using an Alpha 300 RSA+ confocal microscope (WITec, Ulm, Germany) using a 50-μm core diameter fiber, an Ultra-High-Throughput Spectrometer and CCD Camera Andor Newton DU970NUVB- 353 operating in standard mode with 1600 × 200 pixels at −60 °C with full vertical binning. A 532-nm excitation line—the second harmonic of the Nd:YAG laser—was focused on the sample through 40× dry objective (NA of 0.60) for tissue measurements or 40× water dipping objective (NA of 1.0) for cell measurements. The average laser excitation power was 10 mW, with an integration time of 0.5 s for Raman measurements for the high-frequency region, of 1.0 s for the low-frequency region, and of 0.1 s for fluorescence experiments. An edge filter was used to remove the Rayleigh scattered light. A piezoelectric table was used to record Raman images. Spectra were collected at one acquisition per pixel and 1200 lines/mm diffraction grating. The cosmic rays were removed from each Raman spectrum (model: filter size: 2, dynamic factor: 10) and for the smoothing procedure the Savitzky–Golay method was also implemented (model: order: 4, derivative: 0). Data acquisition and processing were performed using WITec Project Plus. All imaging data were analyzed using the Cluster Analysis (CA) method. Briefly, CA allows for grouping a set of objects (vibrational spectra in our studies) that are similar to each other (in vibrational features in our case). CA was performed using WITec Project Plus software with the Centroid model and the k-means algorithm (each cluster was represented by a single mean vector). Normalization of the data was performed using the Origin software normalization model, divided by norm.

2.5. Chemical Compounds for Fluorescence Measurements

Fluorescence measurements were performed using the alpha 300 RSA+ confocal Raman microscope (WITec, Ulm, Germany) described above. Hoechst 33342 (catalog No. B2261, Sigma Life Science, USA) and Red Oil-O (catalog No. O0625, Sigma-Aldrich, MO, USA) were used to visualize cells’ substructures without any additional purification.

2.6. Femtosecond Spectroscopy

Transient absorption (TA) measurements were performed using a femtosecond laser setup based on a Ti:sapphire oscillator (Tsunami, Spectra-Physics, 82 MHz, 800 nm, pulse duration < 100 fs), pumped by a diode laser (Millennia Pro, Spectra-Physics, 532 nm, 5 W). The femtosecond pulses from the oscillator were used to seed the regenerative amplifier (Spitfire ACE, Spectra-Physics, 1 kHz, output power: 4 W). The output from the amplifier pumped two optical parametric amplifiers (OPA, Topas Prime, Light Conversion). The outputs from OPAs were directly used in pump-probe experiments. The transient absorption signal ΔA was detected by the photodiode (Thorlabs, DET10A) using lock-in detection (Stanford Research, SR830). The pulse duration was determined to be 150 fs in the sample position, as measured by the cross-correlation between the pump and probe pulses in a sample position. The pump and probe pulse energies in TA experiments were set to ~200 nJ and 15 nJ, respectively.

2.7. UV-VIS Spectroscopy

Absorption spectra were recorded with a resolution of 0.5 nm using a Perkin Elmer Lambda 750 spectrophotometer.

3. Results and Discussion

In this section, we present the Raman spectroscopy and imaging results for cancerous and normal (noncancerous) human colon tissues from the same patient. Before we formulate general conclusions that may be useful in clinical diagnostics and treatment, we provide data for the patient denoted as ZK in our database, to discuss the most important observations regarding the chemical composition of normal and cancerous colon tissues without and after adding ZnPcS4 photosensitizer. We present typical Raman spectra based on the thousands of spectra recorded in our measurements. We focus on the vibrational features typical to human colon cells, normal CCD18-Co, and cancerous CaCo-2 without and after adding the ZnPcS4 photosensitizer.

3.1. Absorption Spectra

Figure 1 shows the absorption spectra of aqueous ZnPcS4 solutions for the photosensitizer concentrations of c = 1 × 10⁻⁴ M (used in our further experiments with human colon tissues), c = 1 × 10⁻⁵, and 1 × 10⁻⁶ M (used in our further experiments with human colon cell lines).
The spectra shown in Figure 1 comprise two characteristic strong and broad electronic bands: the Soret band (S0→S2, π→π*) in the near UV and the Q band (S0→S1, π→π*) on the red side of the spectrum with maxima at ca. 337, 635, and 674 nm [55].
From a practical point of view and considering the medical applications of phthalocyanines, the most important is an analysis of the Q band, which provides information about the photosensitizer aggregation. One can see from Figure 1 that the Q band has a complex structure. The band at 635 nm should be assigned to the dimer and vibrational progression of monomer, while the band at 674 nm should be assigned to the monomer of ZnPcS4. The aggregation of phthalocyanines plays a crucial role in PDT applications because only monomeric forms effectively generate reactive oxygen species (ROS), constituting the basis of PDT [24,25]. One can also see from Figure 1 that, in the concentration range used in our further experiments, the dimerization of ZnPcS4–H2O, even for the concentration c = 1 × 10⁻⁶ M, is not negligible. Fortunately, it has been proven that in a human body the dimerization for the aqueous solution of ZnPcS4 has definitely shifted in favor of the monomer [49], which promotes the effectiveness of PDT treatment.
Figure 2 presents the absorption spectra of aqueous ZnPcS4 solution (c = 1 × 10⁻⁴ M) and ZnPcS4–H2O in the form of a thin film on human colon tissue substrates from normal and cancerous tissues of the same patient, ZK.
One can see from Figure 2 that, in contrast to the solutions, the absorption spectra on biological substrates for normal and cancerous human colon tissues are very broad. These spectra are structureless in the Q band region, characteristic of the absorption of monomers, dimers, and higher-order aggregates.

3.2. Human Colon Tissue Without ZnPcS4

Figure 3 presents the microscopy image, Raman image constructed by CA method, Raman images of all clusters identified by CA, Raman spectra typical of all clusters, and average Raman spectra for cancerous human colon tissue at 532 nm (for no resonant conditions).
Figure 4 presents the same type of data, obtained by using Raman spectroscopy and imaging for the normal colon tissue from the same patient.
One can see from Figure 3 and Figure 4 that, using Raman spectroscopy and imaging, we can obtain the complex biochemical characteristics of human colon tissue samples based on well-resolved vibrational spectra. It is well known that cancerogenesis affects cellular metabolism. The presented results confirm that Raman spectra can provide relevant information about that reprograming metabolism in a simple way compared to traditional biochemical protocols, because Raman-based techniques are label-free, relatively fast, and objective.
For the cancerous human colon tissue, we used two clusters in CA because the sample was very homogenous; the clusters differ subtly in Raman intensity (see Figure 3). This was the expected result; because the cancerous tissue sample during the surgery was extracted directly from the center of the cancer mass. For the normal human colon tissue, the third cluster, dedicated to the lipid-rich regions of the sample (blue), was added and, as one can see from Figure 4, characterized by totally different vibrational profiles in the low- and high-frequency regions.
The fingerprint (low-frequency) region of Raman spectra shown in panel D of Figure 3 and Figure 4 provides a lot of information on the chemical composition of biological samples because each Raman peak corresponds to specific functional groups of the tissues’ chemical constituents.
The peak at 749 cm−1 is typically associated with nucleic acids, DNA, tryptophan, and nucleoproteins [56]; the broad peak with two maxima, ca. 829 and 849 cm−1, should be assigned to tyrosine (the Fermi resonance between the first overtone of the aromatic out of plane ring bend and the aromatic breathing fundamental) [57]; the peak at 858 cm−1 is typical of the stretching mode of the phosphate group from phosphorylated tyrosine (partially overlapping with the phosphate group from DNA) [57]; 872 cm−1 and 938 cm−1 are most probably due to single bond stretching vibrations for the amino acids proline and valine and polysaccharides collagen and tryptophan [56]; the sharp peak at 1004 cm−1 is associated with phenylalanine [57]; the peak at 1085 cm−1 is typical of phosphodiester groups in nucleic acids [57,58]; the signal at 1129 cm−1 is characteristic of saturated fatty acids; the band at 1337 cm−1 is typical of CH3CH2 wagging vibrations of collagen [59]; the band at 1445 cm−1 is typical of lipids and proteins; the peak at 1585 cm−1 is typical of CN2 scissoring and NH2 rock of mitochondria and phosphorylated proteins [57]; and the peak at 1745 cm−1 characterizes the C=O group of lipids and lipids esters. The other, high-intensity group of vibrations can be assigned to lipids, fatty acids, and proteins. Moreover, Raman spectra are secondary structure sensitive [41]. Proteins can be characterized using Raman spectra by peaks typical of Amide I (C=O stretch near 1655 cm−1), Amide II (N–H bend + C–N stretch near 1557 cm−1, very weak), and Amide III (C–N stretch + N–H bend near 1260 cm−1) [57,60]. The recorded high-frequency signals originate in the symmetric and antisymmetric stretching vibrations of C-H bonds of lipids, glycogen, proteins, RNA, and DNA. Lipids and fatty acids, including unsaturated fraction, appear at 2848, 2875, 2882, and 3009 cm−1 [32,56,57,60]. The contribution of proteins, in the high-frequency region, is seen specifically at 2875, 2882, and 2930 cm−1 [32,56,57,60].
Table 1 summarize all our observations.
To summarize, one can see from Figure 3 and Figure 4 that many peaks are observed for both types of human colon tissues, but this does not mean that the biochemical composition of normal and cancerous human colon tissues is the same. Many qualitative and quantitative differences can be found. The difference spectrum (average spectrum typical of normal tissue minus average spectrum typical of cancerous tissue) is presented in Figure 5. One can see from Figure 5 that the biggest differences can be found for DNA/RNA, phenylalanine, collagen, proteins including phosphorylated proteins, and lipids. The positive peaks in Figure 5 confirm the higher content of DNA/RNA, phenylalanine, collagen, proteins, and phosphorylated proteins in cancerous human colon tissue and the higher content of lipids including unsaturated fraction in the normal one (negative peaks).

3.3. Human Colon Tissue After Adding ZnPcS4

The same analysis was performed for human colon tissue samples after adding the ZnPcS4 photosensitizer (the concentration of the aqueous solution was 1 × 10⁻⁴ M, the volume used was 20 μL, and the analyzed area was the same as for the tissue without the photosensitizer). Figure 6 presents the microscopy image, Raman image constructed by CA method, and average Raman spectra typical for all clusters for cancerous human colon tissue in the low- and high-frequency ranges and in the range typical of ZnPcS4 fluorescence.
One can see from Figure 6 (panel D) that, after adding ZnPcS4, using Raman spectroscopy and imaging is still possible to obtain complex information about the chemical composition of human colon cancer tissue. Moreover, together with the Raman spectra typical of human cancer tissue, the fluorescence spectra of ZnPcS4 can be recorded (Figure 6C) to give information on the localization, concentration, and aggregation of the photosensitizer and its interactions with constituents of the tissue. As the π-stacked aggregates do not show fluorescence since the relevant electronic transition is forbidden [61], the observed signal arises from ZnPcS4 monomers or non-cofacial aggregates.
Similar to the sample without ZnPcS4, the spectra for the two clusters are very much alike, which once again confirms the homogeneity of the pathological tissue, removed directly from the tumor mass. From Figure 6C, one can see that the concentration of the ZnPcS4 photosensitizer is also very similar in both clusters as the fluorescence intensity is comparable. The fitting procedure confirmed that the maximum of the fluorescence band of ZnPcS4 photosensitizer is observed for 4302 cm−1 (689 nm for 532 nm excitation wavelength).
Figure 7 presents the results obtained for normal colon tissue.
One can see from Figure 6 and Figure 7 that, for the normal tissue sample, the Raman signal typical of ZnPcS4 fluorescence is lower than for cancerous tissue and differentiated in terms of the maximum band position (Figure 6C and Figure 7C). The maximum peak positions typical of phthalocyanine fluorescence observed for the normal colon tissue are 4330 cm−1 (691 nm for 532 nm excitation wavelength), 4369 cm−1 (693 nm for 532 nm excitation wavelength), and 4422 cm−1 (695 nm for 532 nm excitation wavelength). This confirms that, for normal human colon samples, the red shift of the maximum peak position compared to the cancerous tissue (689 nm for 532 nm excitation wavelength) is observed. Moreover, this effect is accompanied by a decrease in the fluorescence intensity, which suggests a lower concentration of the photosensitizer. The lowest concentration for normal human colon tissue was observed for the lipid-rich region. Moreover, adding ZnPcS4 phthalocyanine does not disrupt the Raman peaks of chemical constituents typical of normal human colon tissue (Figure 7D).
To summarize, for normal human colon tissue samples in contrast to cancerous ones, we observed a lower affinity to ZnPcS4 phthalocyanine (lower Raman/fluorescence signals typical of ZnPcS4). The higher concentration in cancerous tissue was concomitant with the blue-shift of the maximum peak position of the photosensitizer (689 nm for cancerous tissue and 691–695 nm for normal tissue), but, simultaneously for both types of samples, the signal was observed in the monomer region, confirming the excellent properties of ZnPcS4 for PDT [39,62].

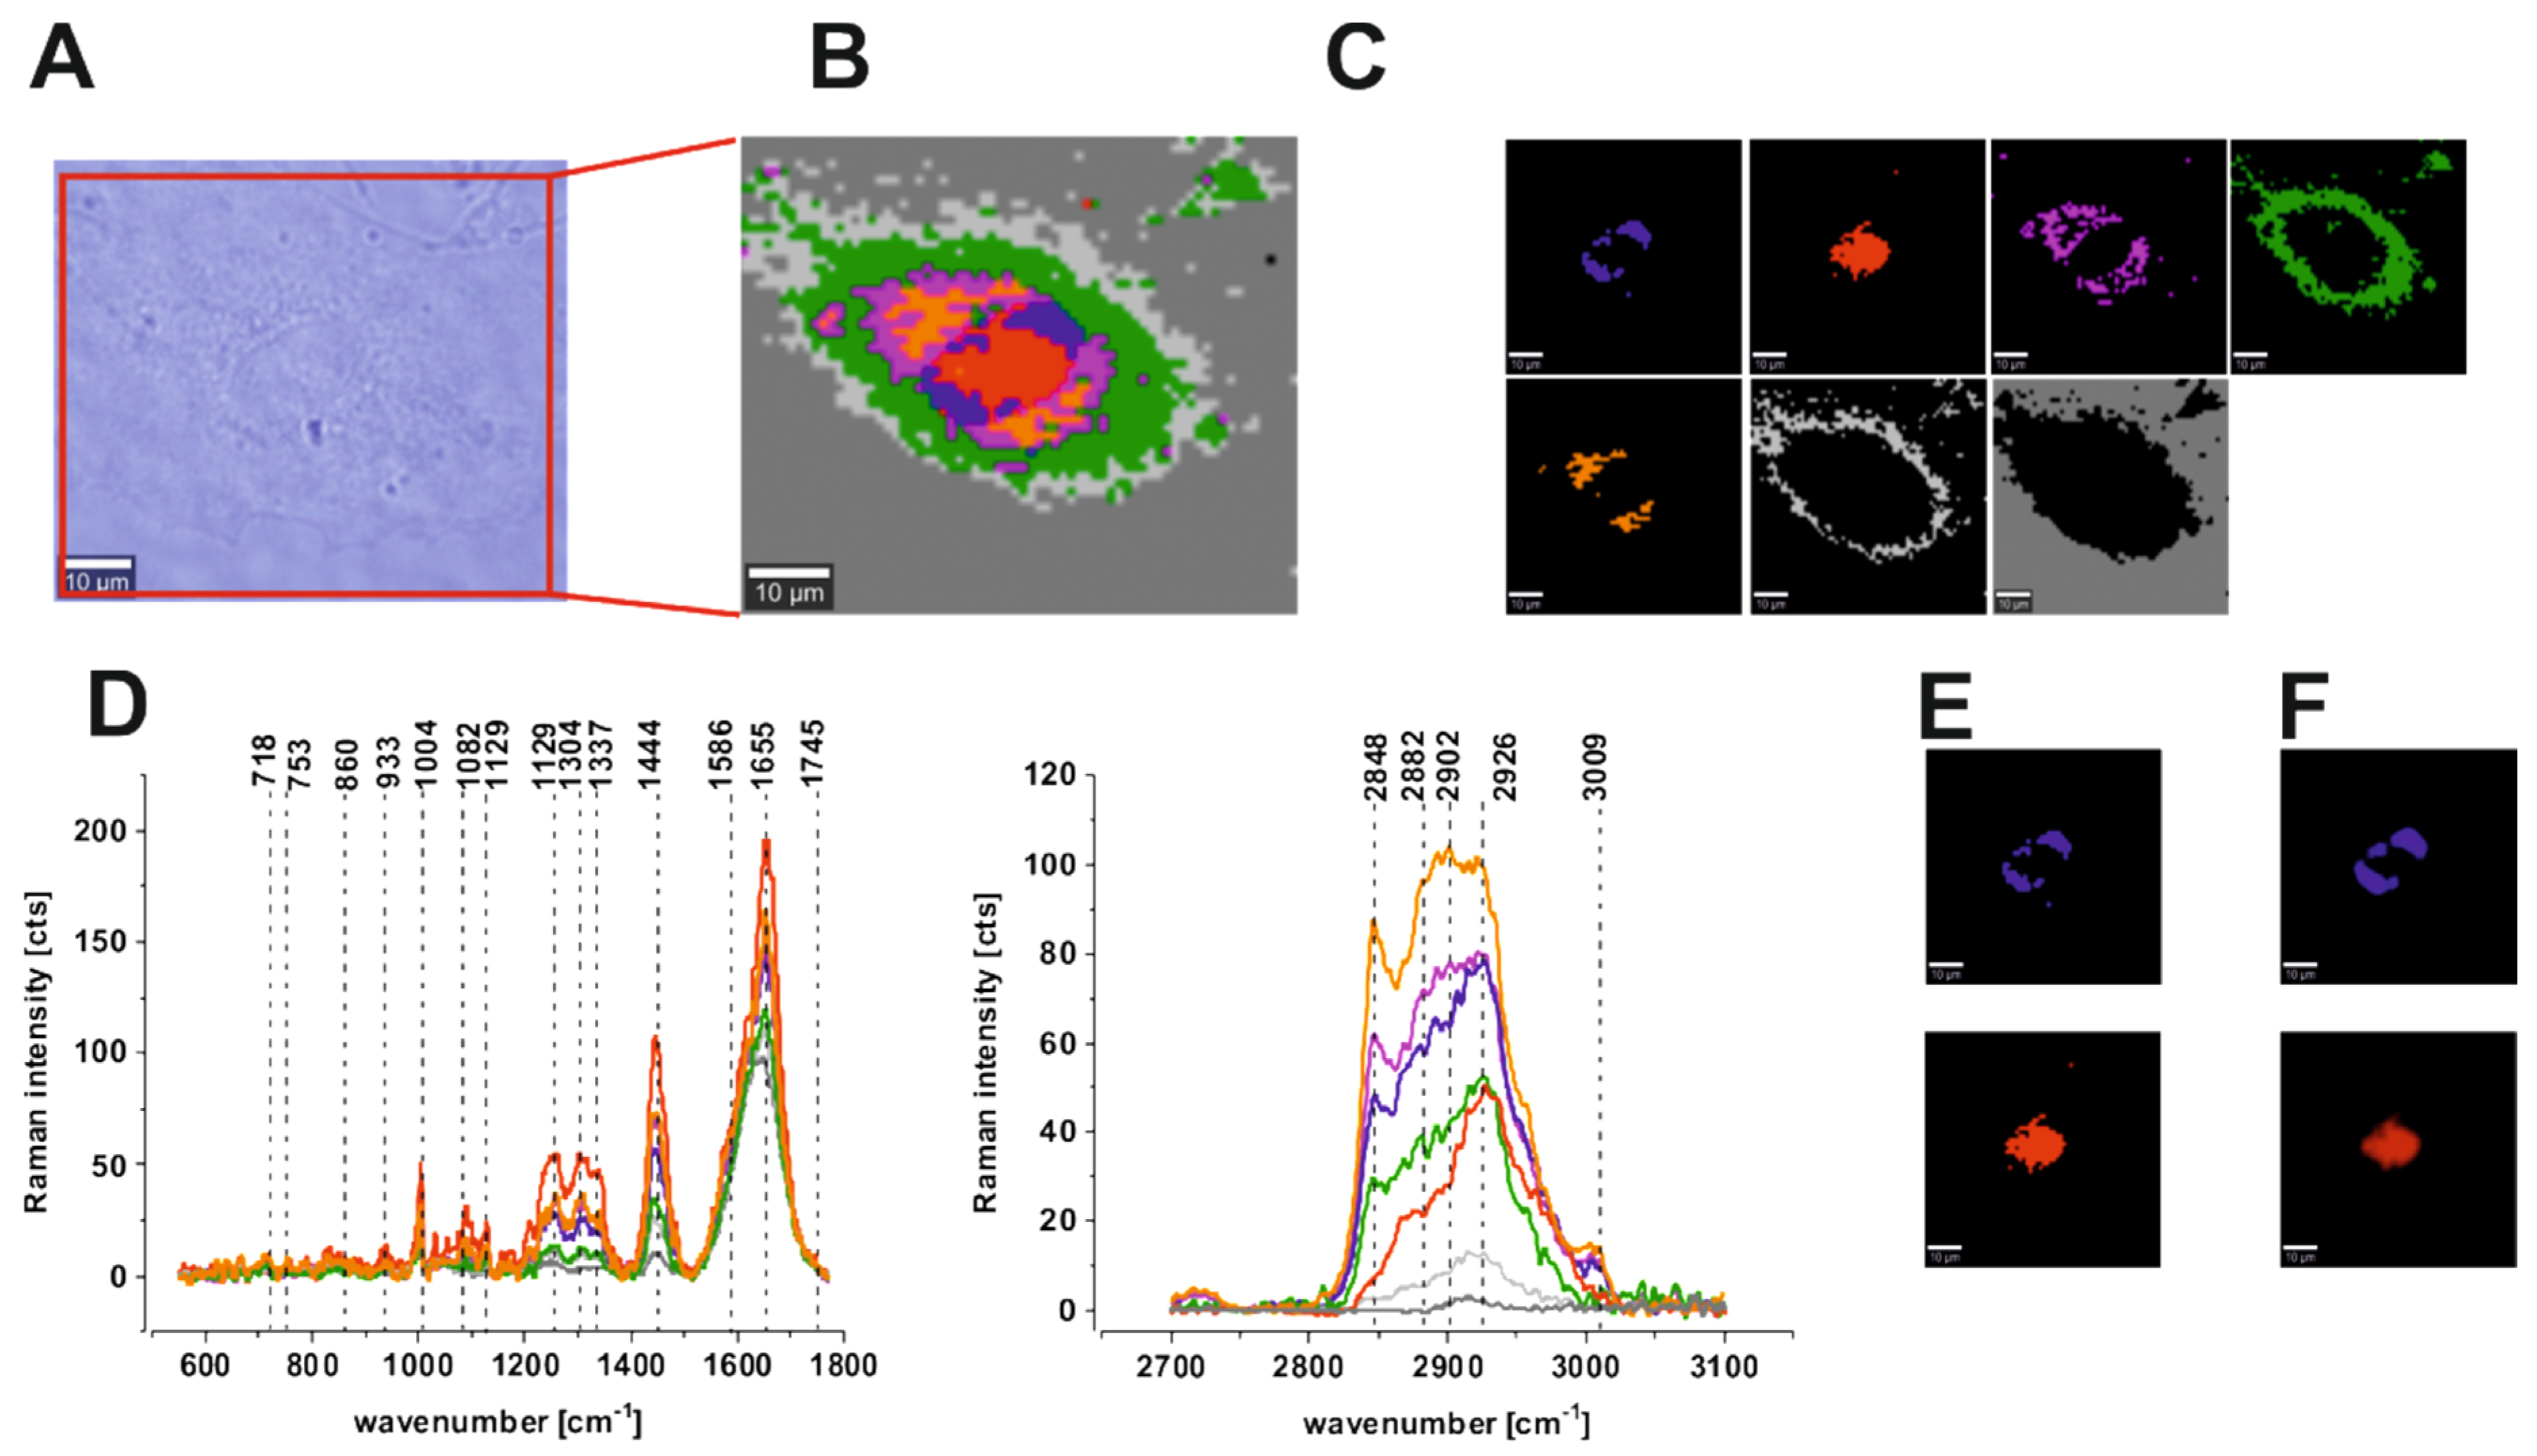
3.4. Human Colon Cells Without ZnPcS4

An analogous analysis was made for single cells of the human colon. We performed CA to visualize and analyze vibrational features for all substructures of human cells: the nucleus (red), mitochondria (magenta), lipid-rich regions (blue and orange), membrane (light gray), and cytoplasm (green) in low- and high-frequency regions. Figure 8 presents results obtained for cancer human colon cell line CaCo-2: the microscopy image, Raman image constructed based on CA method, Raman images of all clusters identified by CA, Raman spectra typical of all clusters for the low-frequency and high-frequency regions, Raman clusters typical of lipid-rich structures, and nucleus and fluorescence imaging after cell staining using Hoechst 33342 to visualize the nucleus and Red Oil-O to visualize lipid-rich regions (including lipid droplets) for CaCo-2 human cancer cells; the colors of the spectra correspond to the colors of the clusters.
To compare the results for normal and cancerous cells, we performed the same analysis for CCD-18Co normal human colon cells.
Figure 9 presents the microscopy image, Raman image constructed based on CA method, Raman images of all clusters identified by CA, Raman spectra typical of all clusters for low- and high-frequency regions, Raman clusters typical of lipid-rich structures and nucleus, and fluorescence staining obtained using Hoechst 33342 to visualize the nucleus and Red Oil-O to visualize lipid-rich regions, including lipid droplets for CCD18-Co normal human colon cells. The colors of the spectra correspond to the colors of the clusters.
One can see from Figure 8 and Figure 9 that Raman imaging provides well-resolved Raman spectra of single colon cells, enabling the characterization of many cell organelles such as the nucleus, mitochondria, lipid-rich regions including lipid droplets, membrane, and cytoplasm. Moreover, Figure 8F and Figure 9F confirm that fluorescence imaging accurately corresponds to the Raman imaging of the nucleus and lipid-rich regions for both normal and cancerous human colon cells, which helps with spectroscopic data interpretation and the correct assignment of different clusters to organelles. For the average spectra of normal and cancer cells, we calculated the difference spectrum, which is presented in Figure 10.
The Amide III (1230–1300 cm−1) and Amide I bands (1600–1690 cm−1) are widely used to study the secondary structure of proteins and the’ global amount of protein [29,39]. One can see from Figure 10 that these peaks are positive on the difference spectrum, which confirms the higher contribution of proteins for the cancerous CaCo-2 cell line; the other protein-related bands observed at 1004, 1585, and 2926 cm−1 also are more intense in the cancerous cells. The higher content of proteins in the cancerous CaCo-2 cell line can be explained by the fact that cancer cells typically have higher RNA/DNA content and an increasing number of studies demonstrate, e.g., the potential use of cell-free DNA as a surrogate marker for multiple indications in cancer, including diagnosis, prognosis, and monitoring [63,64]. The same trend can be observed for the band 858 cm−1, assigned to hydroxyproline [57]. All bands associated with the phosphates, ca. 749, 1085, 1586 cm−1, also show a higher contribution to the cancer CaCo-2 cell line. The higher phosphorylation status of cancerous tissues has been shown in the literature for many organs including the breast, brain, and colon [57]. In contrast, a negative correlation for the cancerous CaCo-2 colon line can be observed in Figure 10 for lipid peaks from the high-frequency region (2845 cm−1), which confirms the reprogramming of lipids’ metabolism in cancer cells [65].
To summarize, chemical differences were found between normal CCD18-Co and cancerous CaCo-2 human colon lines, based on vibrational features, for several chemical constituents: DNA/RNA, lipids, and proteins. The Raman imaging results confirm that vibrational spectra can be used to visualize many organelles of single cells, including the nucleus, cell membrane, lipid structures, mitochondria, and cytoplasm, based on the Cluster Analysis method. Moreover, we show that the Raman imaging results accurately correspond to the fluorescence imaging data, confirming the possibility of analyzing the cells’ substructures without adding external dyes.

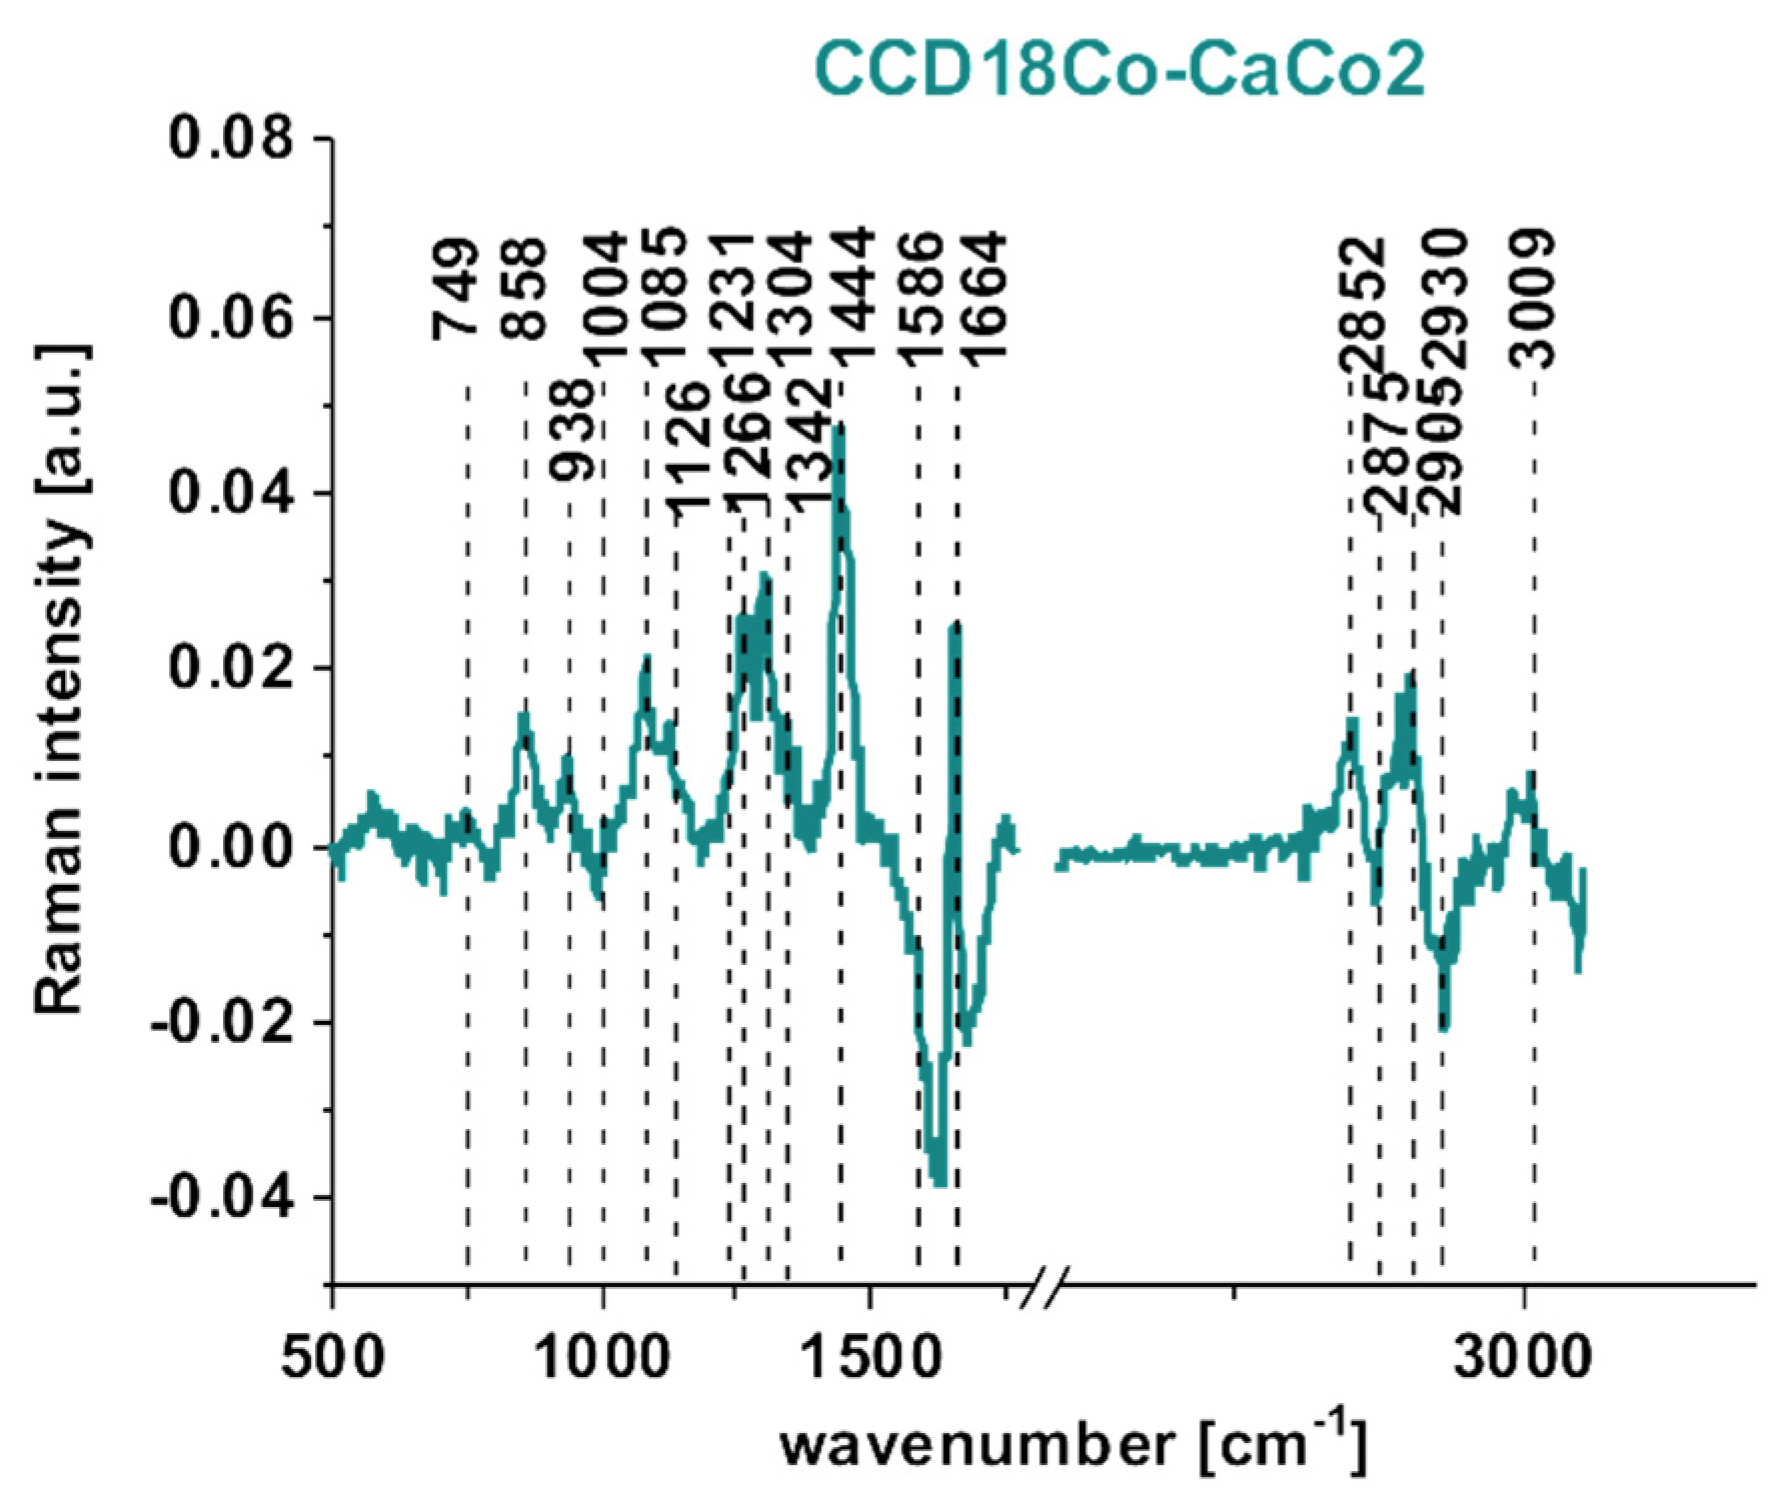
3.5. Human Colon Cells After Adding ZnPcS4

Raman spectroscopy and imaging were also used to investigate the localization and photochemistry of ZnPcS4 phthalocyanine in normal and cancerous human colon single cells.
Figure 11 presents the Raman imaging data obtained after adding ZnPcS4 phthalocyanine for a final concentration in cells of c = 1 × 10⁻⁶ M for the CCD-18Co and CaCo-2 human colon cell lines.
One can see from Figure 11 that, for the cell lines, after adding the photosensitizer it is still possible to characterize the vibrational features of each cell substructure such as the nucleus, lipid structures, mitochondria, membrane, and cytoplasm (panel B). Moreover, based on the Raman spectra (panel C), it is possible to identify DNA/RNA, proteins, phosphorylated proteins, lipids, and unsaturated lipid signals. However, in this experiment, we mostly focused on the localization of the phthalocyanine inside each cell. One can see from Figure 11 that, based on the Raman imaging data and filters typical of mitochondria and lipids (2820–2870 cm−1) in panel E and the Raman/fluorescence signals of ZnPcS4 (3700–4630 cm−1) in panel D, a perfect match is observed between the localization of mitochondria, lipids structures, and phthalocyanine inside cells. Moreover, this observation is true for both the normal CCD18-Co and cancerous CaCo2-Co human colon cells. This finding is confirmed by Figure 11F, which shows the overlay of mitochondria/lipids and phthalocyanine filters.
To check if the ZnPcS4 concentration can affect the localization of the photosensitizer inside cells, we performed the same experiments for the higher concentration of ZnPcS4 (c = 9 × 10⁻⁶ M). Figure 12 shows the results obtained for human normal and cancerous colon cells CCD18-Co and CaCo-2, respectively.
Once again, one can see from Figure 12 that adding the photosensitizer does not disturb the vibrational features of normal and cancerous human colon cells (panel C), but the most important finding of this experiment is that, for the higher concentration of ZnPcS4, the localization of the photosensitizer (panel D) is different and the localization inside the nucleus is predominant (panels E and F). As for the lower concentration, this conclusion was true for both normal and cancerous human colon cells (CCD18-Co and CaCo-2 respectively).
To summarize, for normal and cancerous human colon cells, we proved that the localization of ZnPcS4 is concentration-dependent and so different mechanisms of cell death should be taken into account.
In PDT, an appropriate Pcs should be capable of inducing efficient formation of ROS after irradiation. Because ROS formation is a local effect, due to their short life-time and minimal radius of action, knowledge about the localization of the photosensitizer is crucial to the understanding of the mechanisms of programming cell death. It has been shown that many factors affect the complexity of the localization process, such as the central atom, substituents present in the macrocycle, and cell type (including cancer type and stage) [65]. Moreover, it has been proven that cellular uptake is a time- and concentration-dependent process [66]. This is why all of the studies regarding the PC localization are so important for future PDT development. Our results represent, therefore, another voice contributing to this lively discussion.
In our experiments, we show that, for the low ZnPcS4 phthalocyanine concentration (c = 1 × 10⁻⁶ M), the localization of the photosensitizer applies to mitochondria and lipid structures. This finding is consistent with the results proving that mono- or polysubstituted ZnPcs are mainly localized in the mitochondria and/or lysosomes in the Golgi apparatus, and, at a lower concentration, in the endoplasmic reticulum (ER) [67,68,69,70,71,72,73,74].
The mitochondrial-targeted PDT using ZnPcs was investigated by Muli et al. and Lan et al. [70,71].
It is well known also that mitochondrial homeostasis is essential for cell viability. This is why the mechanisms involving PDT damage to this organelle including caspase activation, deregulation in the expression of Bcl-2 family proteins, and reduction of mitochondria membrane potential are so interesting and have been reported in the literature after ZnPcs PDT [72,75].
Although the role of ER as a Pcs location is not clear, we have to remember that the ER is a key organelle involved in the folding and trafficking of newly synthesized proteins as well as in the maintenance of Ca2+ homeostasis, which is why ER photodamage after PDT can contribute to apoptotic cell death. An increase in the intracellular Ca2+ concentration and higher expression levels of ER stress marker proteins were reported after PDT treatment by using ZnPcs [76].
For the higher ZnPcS4 phthalocyanine concentration, we proved the preferential localization in the nucleus, which is the most important organelle. These results are in agreement with the data obtained by Kuzyniak et al. [77] and Machado et al. [78].
The nucleus is the largest cellular organelle, storing genetic information in the form of DNA. Singlet oxygen generated during PDT treatment is able to react with DNA by inducing guanine-to-thymine transversions due to 8-oxo-7,8-dihydro-20-deoxyguanosine generation. Nucleotide excision repair, base excision repair, and mismatch repair are implicated in the correction of DNA lesions induced by 1O2. At the molecular level, 1O2 is also able to induce the expression of genes involved in the cellular response to oxidative stress, such as NF-kB (nuclear factor kappa-light-chain-enhancer of activated B cells), c-fos (proto-oncogene), and c-jun (protein encoded by the JUN gene), and genes involved in tissue damage and inflammation such as ICAM-1 and interleukins 1 and 6. DNA–PDT damage-controlled cell death can be observed, e.g., as a result of nuclear condensation and DNA fragmentation during apoptosis. The most-studied pathway involves the nuclear translocation of apoptosis-inducing factor [79,80,81].

3.6. Transient Absorption

The impact of biological interfaces such as normal and cancerous colon tissues and cells on excited state lifetime of ZnPcS4 was investigated by means of transient absorption spectroscopy. Figure 13 shows the transient absorption kinetic traces of ZnPcS4 film on CaF2 substrate (green line), CaCo-2 cells incubated with ZnPcS4 at c = 1 × 10⁻⁴ M (violet line), CCD18-Co cells incubated with ZnPcS4 at c = 1 × 10⁻⁴ M (turquoise line), normal colon tissue soaked with an aqueous ZnPcS4 solution at c = 1 × 10⁻⁴ M (blue line), cancerous colon tissue soaked with an aqueous ZnPcS4 solution at c = 1 × 10⁻⁴ M (red line) for pump and probe wavelength 650 nm (200 nJ) and 570 nm (15 nJ), respectively.
ROS form as a result of reactions of the long-lived triplet state of the sensitizer with biomolecules in the presence of oxygen (type I reactions), or directly with oxygen in its ground triplet state (type II reactions). Therefore, the long excited-state lifetime of the photosensitizer is expected to favor photosensing efficiency. As the excited state lifetime depends on the surrounding of the chromophore, studying lifetimes in environments such as cells or tissues helps us to assess the potential effectiveness of the photosensitizer in vivo. For this reason, we measured the transient absorption of cancerous (CaCo-2) and normal (CCD18-Co) cells incubated with ZnPcS4, and cancerous and normal colon tissues soaked with an aqueous solution of ZnPcS4. We compared the kinetic traces of ZnPcS4 in biological environments with those of ZnPcS4 film on a bare CaF2 substrate (see Figure 13). The positive ΔA signals observed for all decay curves arise mainly from the excited state absorption because the probe at 570 nm covers only the edge of the ground state absorption spectrum of ZnPcS4 (see Figure 1). However, ground state bleaching also participates in the ΔA signal, reducing the absolute value of the ΔA. The decay of ΔA signal at 570 nm was three exponential and fitted with time constants varying from single ps to hundreds of ps. Table 2 shows the relaxation time constants for ZnPcS4 phthalocyanine obtained in our experiments.
One can see from Table 2 that the shorter time constant varies from 3.0 ps for 4.4 ps. Longer time constants of 424 and 432 ps were determined for cancerous cells and tissue, respectively. For cells and tissues, the determined lifetimes are 4.4 ± 3.1 ps, 65 ± 32 ps, and 424 ± 138 ps for CaCo-2 cancer cells; 3.0 ± 2.5 ps, 70 ± 32 ps, and 340 ± 89 ps for CCD18-Co normal cells; 3.6 ± 0.25 ps, 74.0 ± 9.0 ps, and 432.0 ± 98 ps for cancerous human colon tissue; and 3.0 ± 0.25 ps, 53.5 ± 5.7 ps, and 346.0 ± 38 ps for normal human colon tissue. The relative amplitudes of the determined time constants are also presented in Table 2. The longest time constant observed for samples of tissues and cells should be assigned to the excited single state (S1) lifetime of the photosensitizer. In contrast, for the aqueous solution, the long-time constant of few hundred ps is not observed due to fast S1→S0 internal conversion occurring in aggregates of ZnPcS4 [14,54]. While we are not able to measure the triplet state lifetime due to limited length of our delay stage, the increase S1 state lifetime should lead to higher yield of triplet state formation. The observed elongation of excited state lifetime is similar to that observed for ZnPcS4 monomers in micelles and in DMSO [14,54]. The most probable explanation of this behavior is disaggregation caused by interactions between ZnPcS4 molecules and biological interfaces. This mechanism is supported by the presence of observable fluorescence presumably having contribution from both ZnPcS4 monomers and non-cofacial aggregates (Figure 6C and Figure 7C). If this is the case, then the smaller amount of aggregates should facilitate interactions between the triplet state of photosensitizer and molecular oxygen as aggregates are more difficult to be penetrated by oxygen. The increase of S1 lifetime due to presence of ZnPcS4 monomers at biological interfaces should lead to rise of quantum yield of T1 because of less efficient S1→S0 internal conversion which is a competitive process for intersystem crossing S1→T1. The relative amplitude of the longest time constant assigned to the S1 lifetime varies from 38% to 65% for all ZnPcS4 at biological interfaces. This means that the value of triplet state quantum yield for ZnPcS4 at biological interfaces can be estimated to vary from 0.38 × 0.3 to 0.65 × 0.3 where 0.3 is reported value for ZnPcS4 in disaggregating solvent—DMF [82]. The value of triplet state quantum yield formation for ZnPcS4 at biological interfaces is expected to be much higher than that for pure aggregates in which very efficient internal conversion occurs. Apart from the a few hundred picosecond time constant assigned to S1 state of ZnPcS4 monomer, we observe two shorter time constants. The time constant in the range of 30–75 ps we assign to vibrational cooling. The time constants in the range of 3–5 ps may arise from internal conversion of aggregates. The observations presented for biological samples are in agreement with those made for human breast tissues by Abramczyk et al. [52,53,83]
To summarize, the presence of biological interfaces leads to an elongation of the excited state lifetime, which is beneficial for application in PDT, and the biological environment plays a crucial role in energy dissipation mechanisms in biological systems.

4. Conclusions

Raman imaging and spectroscopy were successfully used to characterize and differentiate normal and cancerous human colon tissues and cell lines based on vibrational features. Moreover, substructures of human colon single cells such as the nucleus, mitochondria lipid-rich regions, membrane, and cytoplasm can be precisely visualized based on the Raman spectra. Detailed biochemical information on human tissue samples can be obtained using Raman imaging for human colon tissues and cells without and after adding the ZnPcS4 photosensitizer. Fluorescence-based images accurately correspond to the Raman images, confirming the location of nucleus and lipid-rich structures. Based on Raman/fluorescence spectra and the images we obtained, we gleaned new information about the photosensitizer localization, concentration, and aggregation in normal and cancerous human colon tissues and cells. For normal human colon tissue samples, in contrast to cancerous ones, we observed lower affinity to ZnPcS4 phthalocyanine and the lower Raman/fluorescence signals typical of ZnPcS4. The higher concentration in cancerous tissue was concomitant with a blue-shift of the maximum peak position of the photosensitizer (689 nm for cancerous tissue and 691–695 nm for normal tissue; excitation wavelength: 532 nm). For both types of samples, the signal was observed in the monomer region, confirming the excellent properties of ZnPcS4 for PDTF. For colon cells, in experiments with a low concentration of ZnPcS4 photosensitizer (c = 1 × 10⁻⁶ M), the phthalocyanine was located in the mitochondria/lipid structures; for the higher concentration (c = 9 × 10⁻⁶ M), localization inside the nucleus was predominant. ZnPcS4 in the presence of biological interfaces is characterized by longer excited state lifetimes in comparison to aqueous solutions and bare ZnPcS4 films on CaF2 substrates. This finding is beneficial for the application of ZnPcS4 in PDT, and indicates that the biological environment plays a crucial role in energy dissipation mechanisms.

Author Contributions

H.A.: Conceptualization, Raman and fluorescence data analysis, femtosecond spectroscopy data analysis, manuscript editing. B.B.-P.: Conceptualization, Raman and fluorescence data measurements, Raman, fluorescence and femtosecond spectroscopy data analysis, original draft preparation, reviewing and manuscript editing. A.J.: Femtosecond spectroscopy data measurements and analysis, reviewing and manuscript editing. R.K.: Femtosecond spectroscopy data measurements and analysis. All authors have read and agreed to the published version of the manuscript.

Funding

This project was funded through the National Science Centre Poland Grant UMO-2017/25/B/ST4/01788.

Acknowledgments

The authors would like to thank A.K. Olejnik from the Institute of Applied Radiation Chemistry, Lodz University of Technology, Lodz, Poland for human colon cell lines culturing.

Conflicts of Interest

The authors declare no competing interests.

References

  1. Lu, G.; Yan, S.; Shi, M.; Yu, W.; Li, J.; Zhu, W.; Ou, Z.; Kadish, K.M. A new class of rare earth tetrapyrrole sandwich complexes containing corrole and phthalocyanine macrocycles: Synthesis, physicochemical characterization and X-ray analysis. Chem. Commun. 2015, 51, 2411–2413. [Google Scholar] [CrossRef] [PubMed]
  2. Abramczyk, H.; Szymczyk, I.; Waliszewska, G.; Lebioda, A. Photoinduced Redox Processes in Phthalocyanine Derivatives by Resonance Raman Spectroscopy. J. Phys. Chem. A 2004, 108, 264–274. [Google Scholar] [CrossRef]
  3. Abramczyk, H.; Szymczyk, I. Novel Approaches to the Structure and Dynamics of Liquids: Experiments, Theories and Simulations; Springer Science & Business Media: Heidelberg, Germany, 2013; ISBN 978-1-4020-2384-2. [Google Scholar]
  4. Szymczyk, I.; Abramczyk, H. Peripheral substituent and solvent effects on the aggregation and photochemical properties of copper(II)phthalocyanine and copper(II)phthalocyanine-3,4’,4’’,4’’’-tetrasulfonic anion. Pure Appl. Chem. 2004, 76, 183–187. [Google Scholar] [CrossRef]
  5. Abramczyk, H.; Szymczyk, I. Aggregation of phthalocyanine derivatives in liquid solutions and human blood. J. Mol. Liq. 2004, 110, 51–56. [Google Scholar] [CrossRef]
  6. An, L.B.; Feng, L.J.; Lu, C.G. Mechanical Properties and Applications of Carbon Nanotubes. Adv. Mater. Res. 2011, 295, 1516–1521. [Google Scholar] [CrossRef]
  7. Kobayashi, N.; Sirai, H. Phthalocyanines - Chemistry and Functions; IPc: Tokyo, Japan, 1997. [Google Scholar]
  8. Prasad, D.R.; Ferraudi, G. Photochemistry of transition-metal phthalocyanines. Monophotonic and sequential biphotonic photochemical processes of copper(II) tetrakis(N-octadecylsulfamoyl)phthalocyanine in nonaqueous media. Inorg. Chem. 1982, 21, 2967–2971. [Google Scholar] [CrossRef]
  9. Ferraudi, G.; Muralidharan, S. Photochemistry of transition-metal phthalocyanines. Analysis of the photochemical and photophysical properties of the acido(phthalocyaninato)rhodium(III) complexes. Inorg. Chem. 1983, 22, 1369–1374. [Google Scholar] [CrossRef]
  10. Muralidharan, S.; Ferraudi, G. Sequential biphotonic processes in rhodium(III) phthalocyanines. J. Phys. Chem. 1983, 87, 4877–4881. [Google Scholar] [CrossRef]
  11. Kaneko, Y.; Arai, T.; Sakuragi, H.; Tokumaru, K.; Pac, C. Effect of excitation wavelength on photoreduction of metal-free and copper(II) 1,4,8,11,15,18,22,25-octabutoxyphthalocyanines with triethanolamine. J. Photochem. Photobiol. A Chem. 1996, 97, 155–162. [Google Scholar] [CrossRef]
  12. Kaneko, Y.; Nishimura, Y.; Arai, T.; Sakuragi, H.; Tokumaru, K.; Matsunaga, D. UV light and red light chemistry of metallophthalocyanine: Wavelength-dependent photochemical reduction of tetrasodium salts of Zn(II) and Cu(II) tetrasulphonatophthalocyanines with amines. J. Photochem. Photobiol. A Chem. 1995, 89, 37–44. [Google Scholar] [CrossRef]
  13. Kaneko, Y.; Nishimura, Y.; Takane, N.; Arai, T.; Sakuragi, H.; Kobayashi, N.; Matsunaga, D.; Pac, C.; Tokumaru, K. Violet emission observed from phthalocyanines. J. Photochem. Photobiol. A Chem. 1997, 106, 177–183. [Google Scholar] [CrossRef]
  14. Howe, L.; Zhang, J.Z. Ultrafast Studies of Excited-State Dynamics of Phthalocyanine and Zinc Phthalocyanine Tetrasulfonate in Solution. J. Phys. Chem. A 1997, 101, 3207–3213. [Google Scholar] [CrossRef]
  15. RuUckmann, I.; Zeug, A.; Herter, R.; Röder, B. On the Influence of Higher Excited States on the ISC Quantum Yield of Octa-aL-alkyloxy-substituted Zn-Phthalocyanine Molecules Studied by Nonlinear Absorption. Photochem. Photobiol. 1997, 66, 576–584. [Google Scholar] [CrossRef]
  16. Chahraoui, D.; Valat, P.; Kossanyi, J. Fluorescence of phthalocyanines: Emission from an upper excited state. Res. Chem. Intermed. 1992, 17, 219–232. [Google Scholar] [CrossRef]
  17. Ball, D.J.; Mayhew, S.; Wood, S.R.; Griffiths, J.; Vernon, D.I.; Brown, S.B. A Comparative Study of the Cellular Uptake and Photodynamic Efficacy of Three Novel Zinc Phthalocyanines of Differing Charge. Photochem. Photobiol. 2008, 69, 390–396. [Google Scholar] [CrossRef]
  18. Kobayashi, N.; Lever, A.B.P. Cation or solvent-induced supermolecular phthalocyanine formation: Crown ether substituted phthalocyanines. J. Am. Chem. Soc. 1987, 109, 7433–7441. [Google Scholar] [CrossRef]
  19. Kobayashi, N.; Lam, H.; Nevin, W.A.; Janda, P.; Leznoff, C.C.; Koyama, T.; Monden, A.; Shirai, H. Synthesis, spectroscopy, electrochemistry, spectroelectrochemistry, Langmuir-Blodgett film formation, and molecular orbital calculations of planar binuclear phthalocyanines. J. Am. Chem. Soc. 1994, 116, 879–890. [Google Scholar] [CrossRef]
  20. Kobayashi, N.; Togashi, M.; Osa, T.; Ishii, K.; Yamauchi, S.; Hino, H. Low Symmetrical Phthalocyanine Analogues Substituted with Three Crown Ether Voids and Their Cation-Induced Supermolecules. J. Am. Chem. Soc. 1996, 118, 1073–1085. [Google Scholar] [CrossRef]
  21. Lagorio, M.G.; Dicelio, L.E.; Roman, E.S. Visible and near-IR spectroscopic and photochemical characterization of substituted metallophthalocyanines. J. Photochem. Photobiol. A Chem. 1993, 72, 153–161. [Google Scholar] [CrossRef]
  22. Marino, J.; Vior, M.C.G.; Dicelio, L.E.; Roguin, L.P.; Awruch, J. Photodynamic effects of isosteric water-soluble phthalocyanines on human nasopharynx KB carcinoma cells. Eur. J. Med. Chem. 2010, 45, 4129–4139. [Google Scholar] [CrossRef] [PubMed]
  23. Jori, G. Far-red-absorbing photosensitizers: Their use in the photodynamic therapy of tumours. J. Photochem. Photobiol. A Chem. 1992, 62, 371–378. [Google Scholar] [CrossRef]
  24. Kuznetsova, N.A.; Gretsova, N.S.; Derkacheva, V.M.; Kaliya, O.L.; Lukyanets, E.A. Sulfonated phthalocyanines: Aggregation and singlet oxygen quantum yield in aqueous solutions. J. Porphyrins Phthalocyanines 2003, 7, 147–154. [Google Scholar] [CrossRef]
  25. Wang, S.; Gao, R.; Zhou, F.; Selke, M. Nanomaterials and singlet oxygen photosensitizers: Potential applications in photodynamic therapy. J. Mater. Chem. 2004, 14, 487. [Google Scholar] [CrossRef]
  26. Zhang, Y.; Lovell, J.F. Recent Applications of Phthalocyanines and Naphthalocyanines for Imaging and Therapy. Wiley Interdiscip. Rev. Nanomed. Nanobiotechnol. 2016, 9, e1420. [Google Scholar] [CrossRef] [PubMed] [Green Version]
  27. Brown, S.B.; A Brown, E.; Walker, I. The present and future role of photodynamic therapy in cancer treatment. Lancet Oncol. 2004, 5, 497–508. [Google Scholar] [CrossRef]
  28. Zhang, J.; Fan, Y.; He, M.; Ma, X.; Song, Y.; Liu, M.; Xu, J. Accuracy of Raman spectroscopy in differentiating brain tumor from normal brain tissue. Oncotarget 2017, 8, 36824–36831. [Google Scholar] [CrossRef] [PubMed] [Green Version]
  29. Kalkanis, S.N.; Kast, R.; Rosenblum, M.L.; Mikkelsen, T.; Yurgelevic, S.M.; Nelson, K.M.; Raghunathan, A.; Poisson, L.M.; Auner, G.W. Raman spectroscopy to distinguish grey matter, necrosis, and glioblastoma multiforme in frozen tissue sections. J. Neuro Oncol. 2014, 116, 477–485. [Google Scholar] [CrossRef] [PubMed]
  30. Hollon, T.; Lewis, S.; Freudiger, C.W.; Xie, X.S.; Orringer, D.A. Improving the accuracy of brain tumor surgery via Raman-based technology. Neurosurg. Focus 2016, 40, E9. [Google Scholar] [CrossRef] [PubMed]
  31. Anna, I.; Bartosz, P.; Lech, P.; Halina, A. Novel strategies of Raman imaging for brain tumor research. Oncotarget 2017, 8, 85290–85310. [Google Scholar] [CrossRef] [PubMed] [Green Version]
  32. Abramczyk, H.; Brozek-Pluska, B.; Surmacki, J.M.; Jablonska-Gajewicz, J.; Kordek, R. Raman ‘optical biopsy’ of human breast cancer. Prog. Biophys. Mol. Boil. 2012, 108, 74–81. [Google Scholar] [CrossRef] [PubMed]
  33. Li, Q.; Gao, Q.; Zhang, G. Classification for breast cancer diagnosis with Raman spectroscopy. Biomed. Opt. Express 2014, 5, 2435–2445. [Google Scholar] [CrossRef] [PubMed] [Green Version]
  34. Li, Q.; Hao, C.; Xu, Z. Diagnosis of Breast Cancer Tissues Using 785 nm Miniature Raman Spectrometer and Pattern Regression. Sensors 2017, 17, 627. [Google Scholar] [CrossRef] [PubMed] [Green Version]
  35. Abramczyk, H.; Brozek-Pluska, B. Apical-basal polarity of epithelial cells imaged by Raman microscopy and Raman imaging: Capabilities and challenges for cancer research. J. Mol. Liq. 2017, 245, 52–61. [Google Scholar] [CrossRef]
  36. Brozek-Pluska, B.; Kopeć, M.; Abramczyk, H. Development of a new diagnostic Raman method for monitoring epigenetic modifications in the cancer cells of human breast tissue. Anal. Methods 2016, 8, 8542–8553. [Google Scholar] [CrossRef]
  37. Surmacki, J.M.; Brozek-Pluska, B.; Kordek, R.; Abramczyk, H. The lipid-reactive oxygen species phenotype of breast cancer. Raman spectroscopy and mapping, PCA and PLSDA for invasive ductal carcinoma and invasive lobular carcinoma. Molecular tumorigenic mechanisms beyond Warburg effect. Analyst 2015, 140, 2121–2133. [Google Scholar] [CrossRef] [PubMed]
  38. Ishigaki, M.; Maeda, Y.; Taketani, A.; Andriana, B.B.; Ishihara, R.; Wongravee, K.; Ozaki, Y.; Sato, H. Diagnosis of early-stage esophageal cancer by Raman spectroscopy and chemometric techniques. Analyst 2016, 141, 1027–1033. [Google Scholar] [CrossRef] [PubMed]
  39. Shetty, G.; Kendall, C.; Shepherd, N.; Stone, N.; Barr, H. Raman spectroscopy: Elucidation of biochemical changes in carcinogenesis of oesophagus. Br. J. Cancer 2006, 94, 1460–1464. [Google Scholar] [CrossRef] [PubMed] [Green Version]
  40. Teh, S.K.; Zheng, W.; Ho, K.Y.; Teh, M.; Yeoh, K.G.; Huang, Z. Diagnosis of gastric cancer using near-infrared Raman spectroscopy and classification and regression tree techniques. J. Biomed. Opt. 2008, 13, 034013. [Google Scholar] [CrossRef] [PubMed]
  41. Brozek-Pluska, B.; Morawiec-Sztandera, A.; Kopeć, M.; Niedzwiecka, I. Label-free determination of lipid composition and secondary protein structure of human salivary noncancerous and cancerous tissues by Raman microspectroscopy. Analyst 2015, 140, 2107–2113. [Google Scholar] [CrossRef] [PubMed]
  42. Kanter, E.M.; Majumder, S.; Vargis, E.; Robichaux-Viehoever, A.; Kanter, G.J.; Shappell, H.; Jones, H.W.; Mahadevan-Jansen, A. Multiclass discrimination of cervical precancers using Raman spectroscopy. J. Raman Spectrosc. 2009, 40, 205–211. [Google Scholar] [CrossRef] [PubMed] [Green Version]
  43. Liu, W.; Wang, H.; Du, J.; Jing, C. Raman microspectroscopy of nucleus and cytoplasm for human colon cancer diagnosis. Biosens. Bioelectron. 2017, 97, 70–74. [Google Scholar] [CrossRef] [PubMed]
  44. A Jenkins, C.; Lewis, P.D.; Dunstan, P.; A Harris, D. Role of Raman spectroscopy and surface enhanced Raman spectroscopy in colorectal cancer. World J. Gastrointest. Oncol. 2016, 8, 427–438. [Google Scholar] [CrossRef] [PubMed]
  45. Park, D.; Ryu, S.; Kim, Y.-H.; Lee, C.K.; Eun, C.; Han, D.-S.; Lee, S.-H. Comparison of a Guaiac-Based and a Quantitative Immunochemical Fecal Occult Blood Testing in Average-Risk Population for Colorectal Cancer Screening. Gastrointest. Endosc. 2009, 69, AB278–AB279. [Google Scholar] [CrossRef]
  46. Brozek-Pluska, B.; Miazek, K.; Musiał, J.; Kordek, R. Label-free diagnostics and cancer surgery Raman spectra guidance for the human colon at different excitation wavelengths. RSC Adv. 2019, 9, 40445–40454. [Google Scholar] [CrossRef] [Green Version]
  47. Brozek-Pluska, B.; Orlikowski, M.; Abramczyk, H.; Kadish, K.M.; Smith, K.M.; Guilard, R. Phthalocyanines: From Dyes to Photosensitizers in Diagnostics and Treatment of Cancer. Spectroscopy and Raman Imaging Studies of Phthalocyanines in Human Breast Tissues. In Handbook of Porphyrin Science (Volumes 36–40); World Scientific Pub Co Pte Lt: Hackensack, NJ, USA, 2016; Volume 40, pp. 1–49. [Google Scholar]
  48. Brozek-Pluska, B.; Jarota, A.; Kurczewski, K.; Abramczyk, H. Photochemistry of tetrasulphonated zinc phthalocyanine in water and DMSO solutions by absorption, emission, Raman spectroscopy and femtosecond transient absorption spectroscopy. J. Mol. Struct. 2009, 924, 338–346. [Google Scholar] [CrossRef]
  49. Brozek-Pluska, B.; Szymczyk, I.; Abramczyk, H. Raman spectroscopy of phthalocyanines and their sulfonated derivatives. J. Mol. Struct. 2005, 744, 481–485. [Google Scholar] [CrossRef]
  50. Brozek-Pluska, B.; Jarota, A.; Jablonska-Gajewicz, J.; Kordek, R.; Czajkowski, W.; Abramczyk, H. Distribution of phthalocyanines and Raman reporters in human cancerous and noncancerous breast tissue as studied by Raman imaging. Technol. Cancer Res. Treat. 2012, 11, 317–331. [Google Scholar] [CrossRef] [PubMed] [Green Version]
  51. Abramczyk, H.; Brozek-Pluska, B.; Surmacki, J.M.; Musial, J.; Kordek, R. Oncologic photodynamic diagnosis and therapy: Confocal Raman/fluorescence imaging of metal phthalocyanines in human breast cancer tissue in vitro. Analyst 2014, 139, 5547–5559. [Google Scholar] [CrossRef] [PubMed] [Green Version]
  52. Abramczyk, H.; Brozek-Pluska, B.; Tondusson, M.; Freysz, E. Ultrafast Dynamics of Metal Complexes of Tetrasulfonated Phthalocyanines at Biological Interfaces: Comparison between Photochemistry in Solutions, Films, and Noncancerous and Cancerous Human Breast Tissues. J. Phys. Chem. C 2013, 117, 4999–5013. [Google Scholar] [CrossRef] [Green Version]
  53. Jarota, A.; Tondusson, M.; Galle, G.; Freysz, E.; Abramczyk, H. Ultrafast Dynamics of Metal Complexes of Tetrasulphonated Phthalocyanines. J. Phys. Chem. A 2012, 116, 4000–4009. [Google Scholar] [CrossRef] [PubMed] [Green Version]
  54. Howe, L.; Zhang, J.Z. The Effect of Biological Substrates on the Ultrafast Excited-state Dynamics of Zinc Phthalocyanine Tetrasulfonate in Solution. Photochem. Photobiol. 1998, 67, 90–96. [Google Scholar] [CrossRef] [PubMed]
  55. Mack, J.; Stillman, M.J. Transition assignments in the ultraviolet-visible absorption and magnetic circular dichroism spectra of phthalocyanines. Inorg. Chem. 2001, 40, 812–814. [Google Scholar] [CrossRef] [PubMed]
  56. Movasaghi, Z.; Rehman, S.; Rehman, I.U. Raman Spectroscopy of Biological Tissues. Appl. Spectrosc. Rev. 2007, 42, 493–541. [Google Scholar] [CrossRef]
  57. Abramczyk, H.; Imiela, A.; Brozek-Pluska, B.; Kopeć, M.; Surmacki, J.M.; Sliwinska, A. Aberrant Protein Phosphorylation in Cancer by Using Raman Biomarkers. Cancers 2019, 11, 2017. [Google Scholar] [CrossRef] [PubMed] [Green Version]
  58. Dukor, R.K. Vibrational Spectroscopy in the Detection of Cancer. In Handbook of Vibrational Spectroscopy; Wiley: Hoboken, NJ, USA, 2006. [Google Scholar]
  59. Kopec, M.; Imiela, A.; Abramczyk, H. Monitoring glycosylation metabolism in brain and breast cancer by Raman imaging. Sci. Rep. 2019, 9, 166. [Google Scholar] [CrossRef] [PubMed] [Green Version]
  60. Brozek-Pluska, B.; Musial, J.; Kordek, R.; Abramczyk, H.; Pluska, B. Analysis of Human Colon by Raman Spectroscopy and Imaging-Elucidation of Biochemical Changes in Carcinogenesis. Int. J. Mol. Sci. 2019, 20, 3398. [Google Scholar] [CrossRef] [PubMed] [Green Version]
  61. Kasha, M. Energy Transfer Mechanisms and the Molecular Exciton Model for Molecular Aggregates. Radiat. Res. 1963, 20, 55. [Google Scholar] [CrossRef] [PubMed]
  62. Ke, M.-R.; Chen, S.-F.; Peng, X.-H.; Zheng, Q.-F.; Zheng, B.-Y.; Yeh, C.-K.; Huang, J.-D. A tumor-targeted activatable phthalocyanine-tetrapeptide-doxorubicin conjugate for synergistic chemo-photodynamic therapy. Eur. J. Med. Chem. 2017, 127, 200–209. [Google Scholar] [CrossRef] [PubMed]
  63. Damania, D.; Subramanian, H.; Backman, V.; Anderson, E.C.; Wong, M.H.; Mccarty, O.J.T.; Phillips, K.G. Network signatures of nuclear and cytoplasmic density alterations in a model of pre and postmetastatic colorectal cancer. J. Biomed. Opt. 2014, 19, 16016. [Google Scholar] [CrossRef] [PubMed] [Green Version]
  64. Bronkhorst, A.J.; Ungerer, V.; Holdenrieder, S. The emerging role of cell-free DNA as a molecular marker for cancer management. Biomol. Detect. Quantif. 2019, 17, 100087. [Google Scholar] [CrossRef] [PubMed]
  65. Abramczyk, H.; Imiela, A.; Śliwińska, A. Novel strategies of Raman imaging for exploring cancer lipid reprogramming. J. Mol. Liq. 2019, 274, 52–59. [Google Scholar] [CrossRef]
  66. Tynga, I.; Houreld, N.N.; Abrahamse, H. The primary subcellular localization of Zinc phthalocyanine and its cellular impact on viability, proliferation and structure of breast cancer cells (MCF-7). J. Photochem. Photobiol. B Biol. 2013, 120, 171–176. [Google Scholar] [CrossRef] [PubMed]
  67. Wood, S.R.; Holroyd, J.A.; Brown, S.B. The Subcellular Localization of Zn(ll) Phthalocyanines and Their Redistribution on Exposure to Light. Photochem. Photobiol. 1997, 65, 397–402. [Google Scholar] [CrossRef] [PubMed]
  68. Manoto, S.L.; Houreld, N.N.; Abrahamse, H. Phototoxic effect of photodynamic therapy on lung cancer cells grown as a monolayer and three dimensional multicellular spheroids. Lasers Surg. Med. 2013, 45, 186–194. [Google Scholar] [CrossRef] [PubMed]
  69. Tynga, I.; Houreld, N.N.; Abrahamse, H. Induced Cell Death Pathway Post Photodynamic Therapy Using a Metallophthalocyanine Photosensitizer in Breast Cancer Cells. Photomed. Laser Surg. 2014, 32, 205–211. [Google Scholar] [CrossRef] [PubMed]
  70. Muli, D.K.; Rajaputra, P.; You, Y.; McGrath, D.V. Asymmetric ZnPc–rhodamine B conjugates for mitochondrial targeted photodynamic therapy. Bioorg. Med. Chem. Lett. 2014, 24, 4496–4500. [Google Scholar] [CrossRef] [PubMed]
  71. Lan, W.-L.; Liu, F.-R.; Ke, M.-R.; Lo, P.-C.; Fong, W.-P.; Ng, D.; Huang, J.-D. The effects of formulation and serum albumin on the in vitro photodynamic activity of zinc(II) phthalocyanines substituted with sulfonated quinolineoxy groups. Dye. Pigment. 2016, 128, 215–225. [Google Scholar] [CrossRef]
  72. Shao, J.-W.; Dai, Y.; Zhao, W.; Xie, J.; Xue, J.; Ye, J.; Jia, L. Intracellular distribution and mechanisms of actions of photosensitizer Zinc(II)-phthalocyanine solubilized in Cremophor EL against human hepatocellular carcinoma HepG2 cells. Cancer Lett. 2013, 330, 49–56. [Google Scholar] [CrossRef] [PubMed]
  73. Manoto, S.L.; Sekhejane, P.R.; Houreld, N.N.; Abrahamse, H. Localization and phototoxic effect of zinc sulfophthalocyanine photosensitizer in human colon (DLD-1) and lung (A549) carcinoma cells (in vitro). Photodiagnosis Photodyn. Ther. 2012, 9, 52–59. [Google Scholar] [CrossRef] [PubMed]
  74. Ongarora, B.G.; Hu, X.; Verberne-Sutton, S.D.; Garno, J.C.; Vicente, M.G.H. Syntheses and Photodynamic Activity of Pegylated Cationic Zn(II)-Phthalocyanines in HEp2 Cells. Theranostics 2012, 2, 850–870. [Google Scholar] [CrossRef] [PubMed] [Green Version]
  75. Doustvandi, M.A.; Mohammadnejad, F.; Mansoori, B.; Mohammadi, A.; Navaeipour, F.; Baradaran, B.; Tajalli, H. The interaction between the light source dose and caspase-dependent and -independent apoptosis in human SK-MEL-3 skin cancer cells following photodynamic therapy with zinc phthalocyanine: A comparative study. J. Photochem. Photobiol. B Biol. 2017, 176, 62–68. [Google Scholar] [CrossRef] [PubMed]
  76. Chiarante, N.; Vior, M.C.G.; Rey, O.; Marino, J.; Roguin, L.P. Lysosomal permeabilization and endoplasmic reticulum stress mediate the apoptotic response induced after photoactivation of a lipophilic zinc(II) phthalocyanine. Int. J. Biochem. Cell Biol. 2018, 103, 89–98. [Google Scholar] [CrossRef] [PubMed] [Green Version]
  77. Kuzyniak, W.; Schmidt, J.; Glac, W.; Berkholz, J.; Steinemann, G.; Nitzsche, B.; Hoffmann, B.; Ermilov, E.A.; Gürek, A.G.; Ahsen, V.; et al. Novel zinc phthalocyanine as a promising photosensitizer for photodynamic treatment of esophageal cancer. Int. J. Oncol. 2017, 50, 953–963. [Google Scholar] [CrossRef] [PubMed] [Green Version]
  78. Machado, A.H.A.; Braga, F.M.P.; Soares, C.P.; Pelisson, M.M.M.; Beltrame, M.; Da Silva, N.S. Photodynamic Therapy with a New Photosensitizing Agent. Photomed. Laser Surg. 2007, 25, 220–228. [Google Scholar] [CrossRef] [PubMed]
  79. He, L.; He, X.; Lim, L.P.; De Stanchina, E.; Xuan, Z.; Liang, Y.; Xue, W.; Zender, L.; Magnus, J.; Ridzon, D.; et al. A microRNA component of the p53 tumour suppressor network. Nature 2007, 447, 1130–1134. [Google Scholar] [CrossRef] [PubMed] [Green Version]
  80. Raver-Shapira, N.; Marciano, E.; Meiri, E.; Spector, Y.; Rosenfeld, N.; Moskovits, N.; Bentwich, Z.; Oren, M. Transcriptional Activation of miR-34a Contributes to p53-Mediated Apoptosis. Mol. Cell 2007, 26, 731–743. [Google Scholar] [CrossRef] [PubMed]
  81. Candé, C.; Cecconi, F.; Dessen, P.; Kroemer, G. Apoptosis-inducing factor (AIF): Key to the conserved caspase-independent pathways of cell death? J. Cell Sci. 2002, 115, 4727–4734. [Google Scholar] [CrossRef] [PubMed] [Green Version]
  82. Matlaba, P.M. Synthesis of Zinc Phthalocyanine Derivatives for Possible Use in Photodynamic Therapy. Masters’ Thesis, Rhodes University, Grahamstown, South Africa, 2002. [Google Scholar]
  83. Abramczyk, H.; Brozek-Pluska, B.; Surmacki, J.M.; Tondusson, M.; Freysz, E. Photostability of biological systems—Femtosecond dynamics of zinc tetrasulfonated phthalocyanine at cancerous and noncancerous human Breast tissues. J. Photochem. Photobiol. A Chem. 2017, 332, 10–24. [Google Scholar] [CrossRef] [Green Version]
Sample Availability: Samples of the compound are not available from the authors.
Figure 1. Absorption spectra of aqueous ZnPcS4 solutions for the photosensitizer concentrations of c = 1 × 10⁻⁴, 1 × 10⁻⁵, and 1 × 10⁻⁶ M. Fluorescence spectrum of ZnPcS4 (c = 2 × 10⁻⁵ M) is also shown.
Molecules 25 02688 g001
Figure 2. Absorption spectra of ZnPcS4 in a form of a thin film produced on normal and cancerous human colon tissue substrates (V = 20 μL, c = 1 × 10⁻⁴ M) and in aqueous solution (c = 1 × 10⁻⁴ M).
Molecules 25 02688 g002
Figure 3. The microscopy image (A), Raman image constructed by Cluster Analysis (CA) method (B), Raman images of all clusters identified by CA (C), average Raman spectra typical of all clusters, colors of the spectra correspond to colors of clusters seen in B and C (D), and average (arithmetic mean) Raman spectrum for the entire area of analyzed tissue (E) for the cancerous human colon tissue (patient ZK) at 532 nm.
Molecules 25 02688 g003
Figure 4. The microscopy image (A), Raman image constructed by CA method (B), Raman images of all clusters identified by CA (C), average Raman spectra typical of all clusters, colors of the spectra correspond to colors of clusters seen in B and C (D), and average (arithmetic mean) Raman spectrum for the entire area of analyzed tissue (E) for the normal human colon tissue (patient ZK) at 532 nm.
Molecules 25 02688 g004
Figure 5. The difference spectrum calculated for normal and cancerous human colon tissues (average spectrum typical of normal tissue minus average spectrum typical of cancerous tissue, based on 4050 Raman single spectra).
Molecules 25 02688 g005
Figure 6. Microscopy image (A), Raman image constructed by CA method (B), Raman/fluorescence spectra in the range typical of ZnPcS4 phthalocyanine fluorescence (C) and average Raman spectra for all clusters, for low- and high-frequency ranges for cancerous human colon tissue after adding ZnPcS4 phthalocyanine (patient ZK) at 532 nm (D).
Molecules 25 02688 g006
Figure 7. Microscopy image (A), Raman image constructed by CA method (B), Raman/fluorescence spectra in the range typical of ZnPcS4 phthalocyanine fluorescence (C) and average Raman spectra for all clusters, for low- and high-frequency ranges for normal human colon tissue after adding ZnPcS4 phthalocyanine (patient ZK) at 532 nm (D).
Molecules 25 02688 g007
Figure 8. Microscopy image (A), Raman image constructed based on CA method (B), Raman images of all clusters identified by CA, nucleus (red), mitochondria (magenta), lipid-rich regions (blue and orange), membrane (light gray), cytoplasm (green), cell environment (dark gray) (C), Raman spectra typical of all clusters for the low- and high-frequency regions (D), Raman clusters typical of all lipid-rich structures (blue), nucleus (red) (E) and fluorescence staining (F) obtained using Red Oil-O to visualize lipid-rich regions, including lipid droplets (blue) and Hoechst 33342 to visualize nucleus (red) for CaCo-2 human colon cancer cells. The colors of the spectra correspond to the colors of the clusters.
Molecules 25 02688 g008
Figure 9. Microscopy image (A), Raman image constructed based on CA method (B), Raman images of all clusters identified by CA, nucleus (red), mitochondria (magenta), lipid-rich regions (blue and orange), membrane (light gray), cytoplasm (green), cell environment (dark gray) (C), Raman spectra typical of all clusters for low- and high-frequency regions (D), Raman clusters typical of all lipid-rich structures (blue), nucleus (red) (E), and fluorescence staining (F) obtained using Red Oil-O to visualize lipid-rich regions including lipid droplets (blue) and Hoechst 33342 to visualize nucleus (red) for CCD18-Co normal human colon cells. The colors of the spectra correspond to the colors of the clusters.
Molecules 25 02688 g009
Figure 10. The difference spectrum calculated for normal human colon CCD18-Co and cancerous CaCo-2 cell lines.
Molecules 25 02688 g010
Figure 11. Microscopy image (A), Raman image constructed based on CA method and Raman images of all clusters identified by CA, nucleus (red), mitochondria (magenta), lipid-rich regions (blue and orange), membrane (light gray), cytoplasm (green), cell environment (dark gray) (B), Raman spectra typical of all clusters for low- and high-frequency regions (C), Raman image of ZnPcS4 phthalocyanine distribution based on filter 3700–4630 cm−1 (D), Raman image of the distribution of lipids structures and mitochondria based on filter 2820–2870 cm−1, (E) overlay of ZnPcS4 phthalocyanine, and mitochondria/lipids distribution filters, (F) the concentration of ZnPcS4 in a medium c = 1 × 10⁻⁶ M.
Molecules 25 02688 g011
Figure 12. Microscopy image (A), Raman image constructed based on CA method and Raman images of all clusters identified by CA, nucleus (red), mitochondria (magenta), lipid-rich regions (blue and orange), membrane (light gray), cytoplasm (green), cell environment (dark gray) (B), Raman spectra typical of all clusters for low- and high-frequency regions (C), Raman image of ZnPcS4 phthalocyanine distribution based on filter 3700–4630 cm−1 (D), Raman image of the nucleus based on filter 2910–2940 cm−1, (E) overlay of ZnPcS4 phthalocyanine, and nucleus distribution filters, (F) the concentration of ZnPcS4 in a medium c = 9 × 10⁻⁶ M.
Molecules 25 02688 g012
Figure 13. The transient absorption kinetic traces of ZnPcS4 film on CaF2 substrate (green line), CaCo-2 cells incubated with ZnPcS4 at c = 1 × 10⁻⁴ M (violet line), CCD18-Co cells incubated with ZnPcS4 at c = 1 × 10⁻⁴ M (turquoise line), normal colon tissue soaked with an aqueous ZnPcS4 solution at c = 1 × 10⁻⁴ M (blue line), cancerous colon tissue soaked with an aqueous solution at c = 1 × 10⁻⁴ M (red line). Pump and probe wavelength and energies were 650 nm (200 nJ) and 570 nm (15 nJ), respectively.
Molecules 25 02688 g013
Table 1. The tentative assignments of Raman peaks differentiating the noncancerous and the cancerous tissues of human colon samples. Abbreviations: C—cancerous tissue, N—noncancerous tissue of human colon.
Wavenumber [cm−1]Tentative AssignmentsType of Human Colon Tissue
749nucleic acids, DNA, tryptophan, and nucleoproteinsC ↑
829/849tyrosine N ↑
858stretching mode of the phosphate group N ↑
872/938stretching vibrations for the amino acids proline and valine and polysaccharides N ↑
1004phenylalanine C ↑
1085phosphodiester groups in nucleic acids C ↑
1129saturated fatty acidsC ↑
1260Amide III (C–N stretch + N–H bend) N ↑
1337CH3CH2 wagging vibrations of collagen C ↑
1445lipids and proteinsN ↑
1557Amide II (N–H bend + C–N stretch)C ↑
1585CN2 scissoring and NH2 rock of mitochondria and phosphorylated proteins C ↑
1655Amide I (C=O stretch) N ↑
1745C=O group of lipids and lipids esters. N ↑
2848, 3009C–H bonds of lipids, glycogen, proteins, RNA, and DNA. N ↑
2931ProteinsC ↑
Table 2. Relaxation time constants for ZnPcS4 phthalocyanine. The relative amplitudes for time constants are given in parentheses.
SampleTime Constants
ZnPcS4 film on CaF23.97 ± 1.2 ps (28%), 32.3 ± 6.3 ps (44%), 190 ps ±46 (28%)
CaCo-2 cells incubated with ZnPcS44.4 ± 3.1 ps (7%), 65 ± 32 ps (28%), 424 ± 138 ps (65%)
CCD18-Co cells incubated with ZnPcS43.0 ± 2.5 ps (7%), 70 ± 32 ps (31%), 340 ± 89 ps (62%)
Cancerous colon tissue soaked with ZnPcS4 solution3.6 ± 0.25 ps (25%), 74.0 ± 9.0 ps (37%), 432.0 ± 98 ps (38%)
Normal colon tissue soaked with ZnPcS4 solution3.0 ± 0.25 ps (21%), 53.5 ± 5.7 ps (36%), 346.0 ± 38 ps (43%)

