
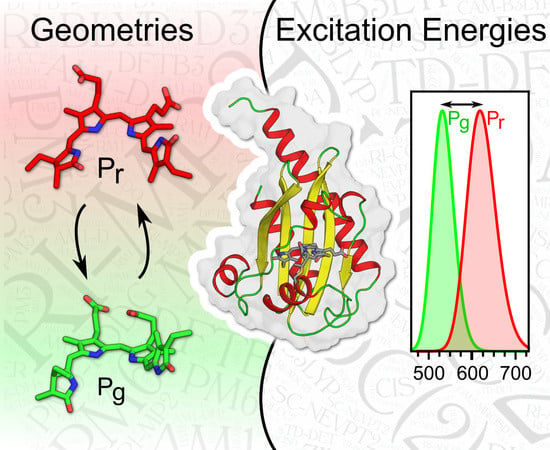
QM/MM Benchmarking of Cyanobacteriochrome Slr1393g3 Absorption Spectra


Abstract
1. Introduction
2. Results
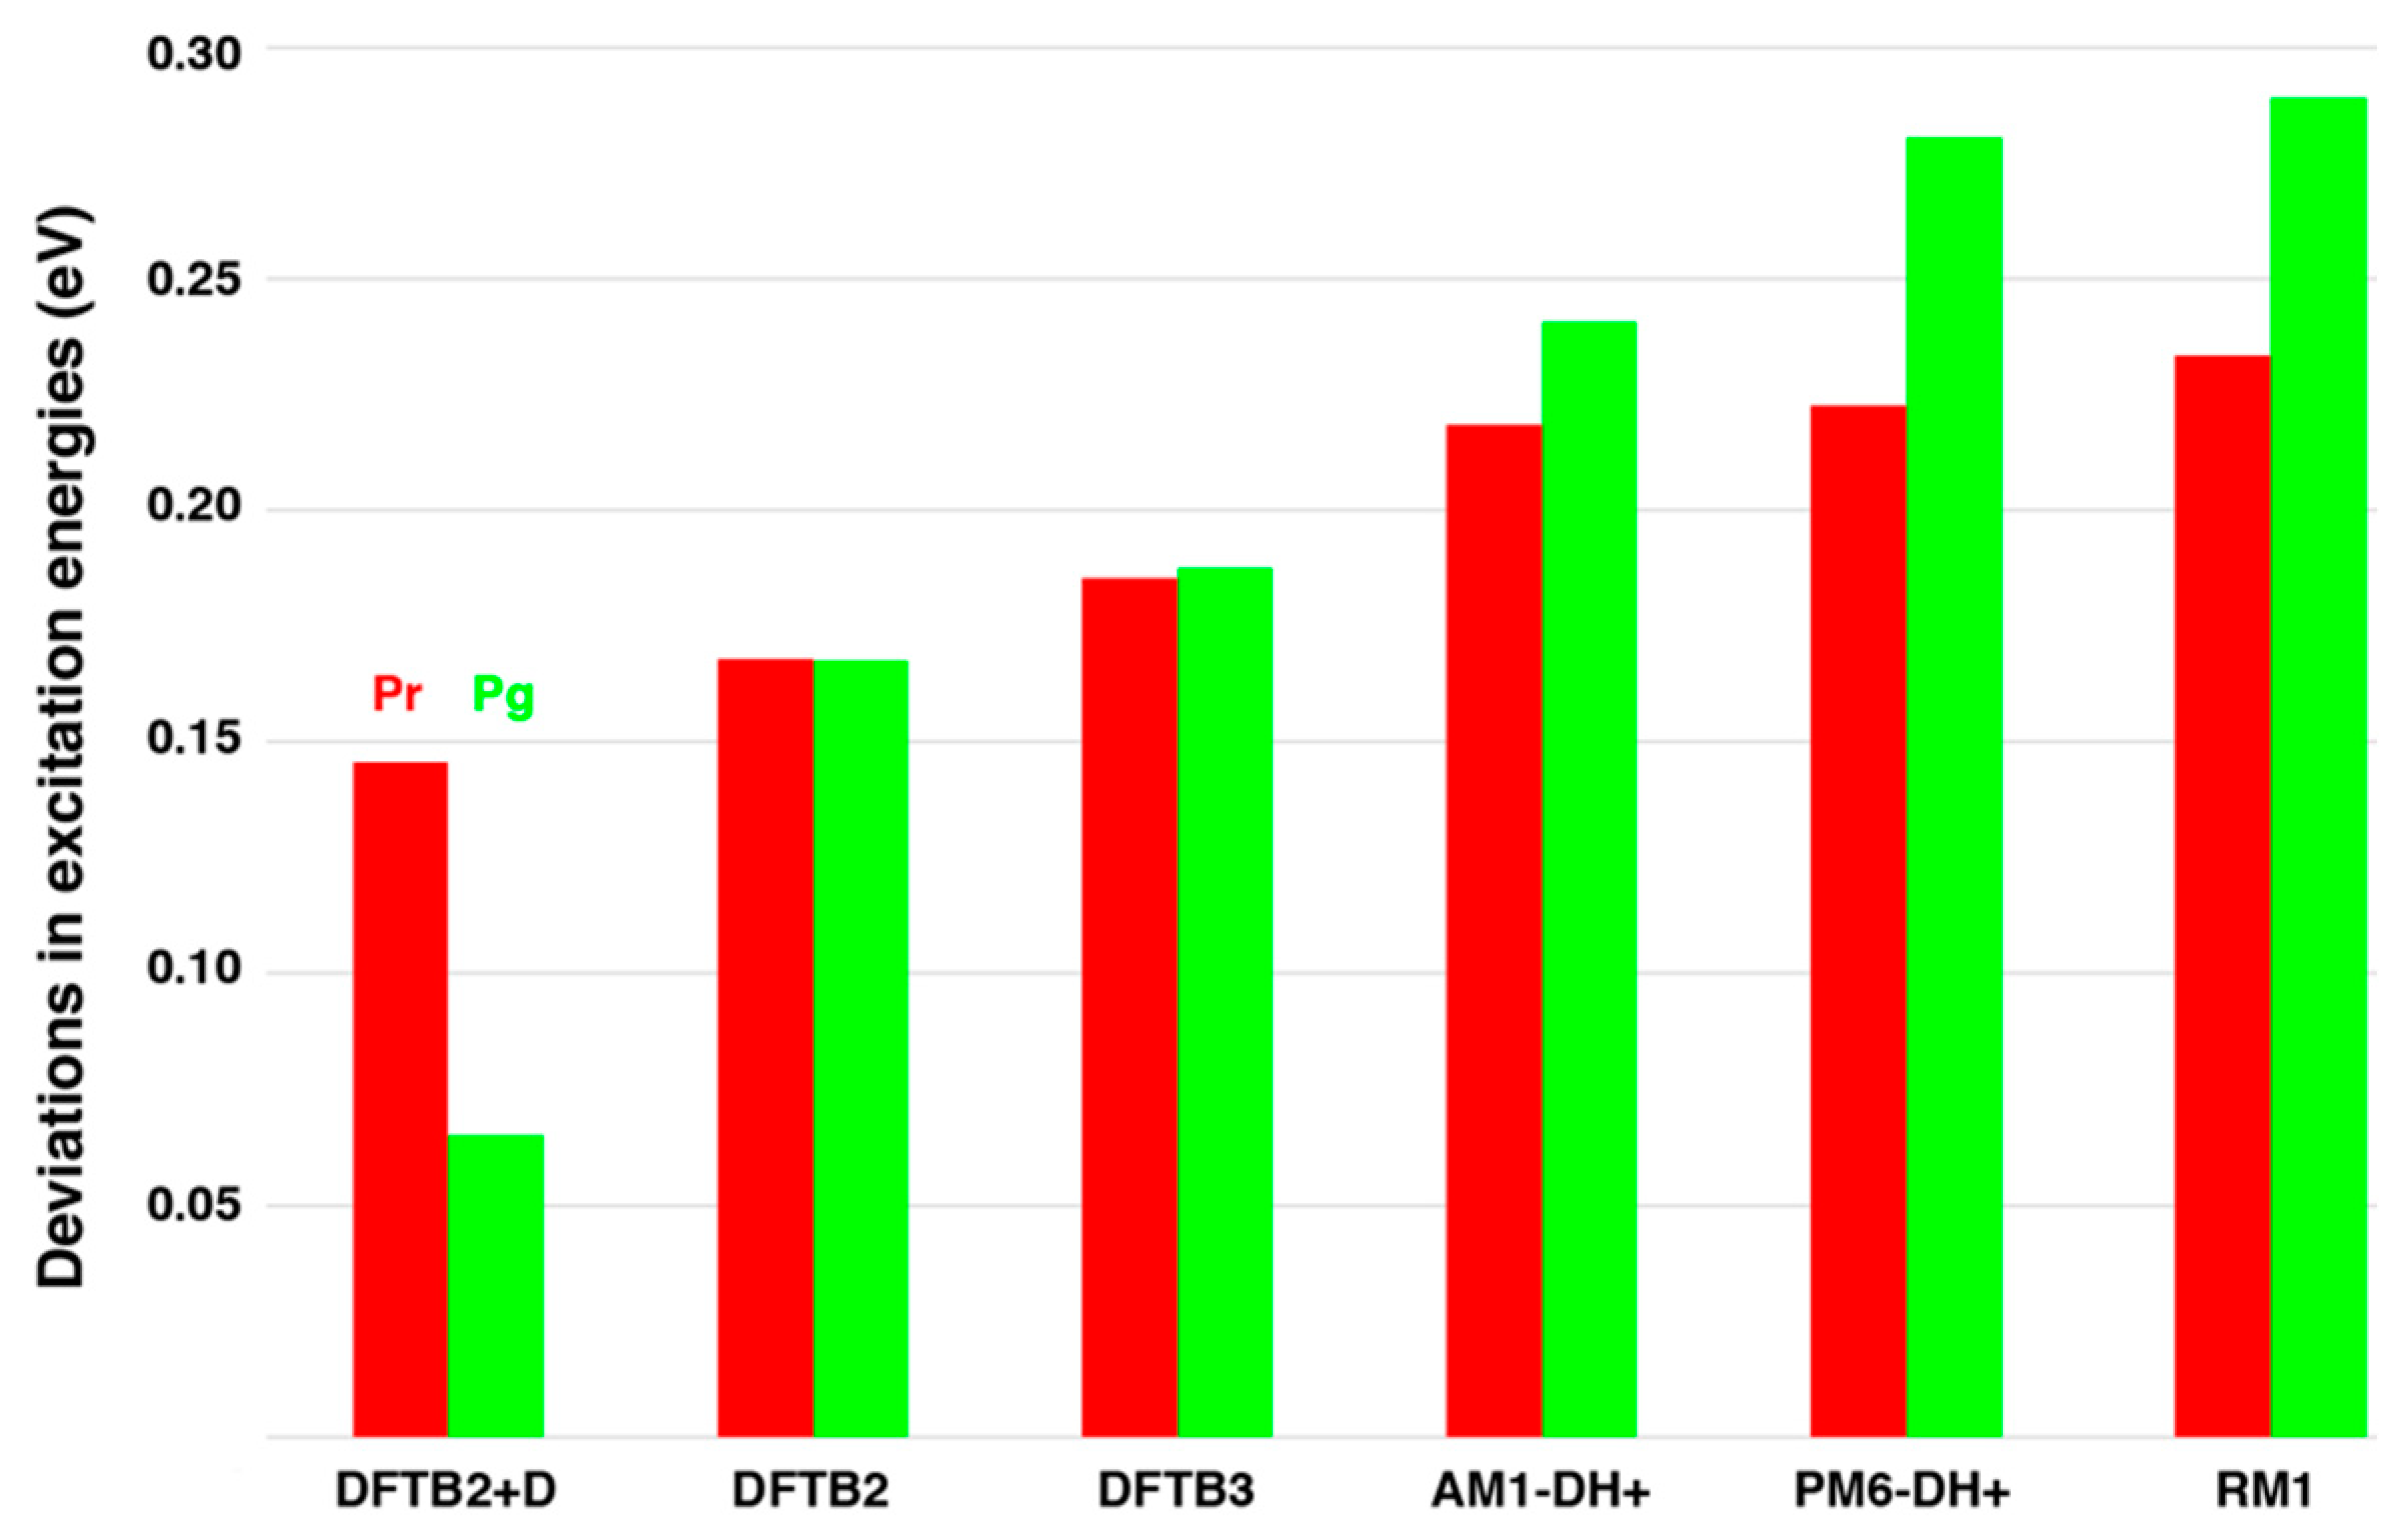
2.1. Chromophore Structure Optimizations with Semiempirical Methods
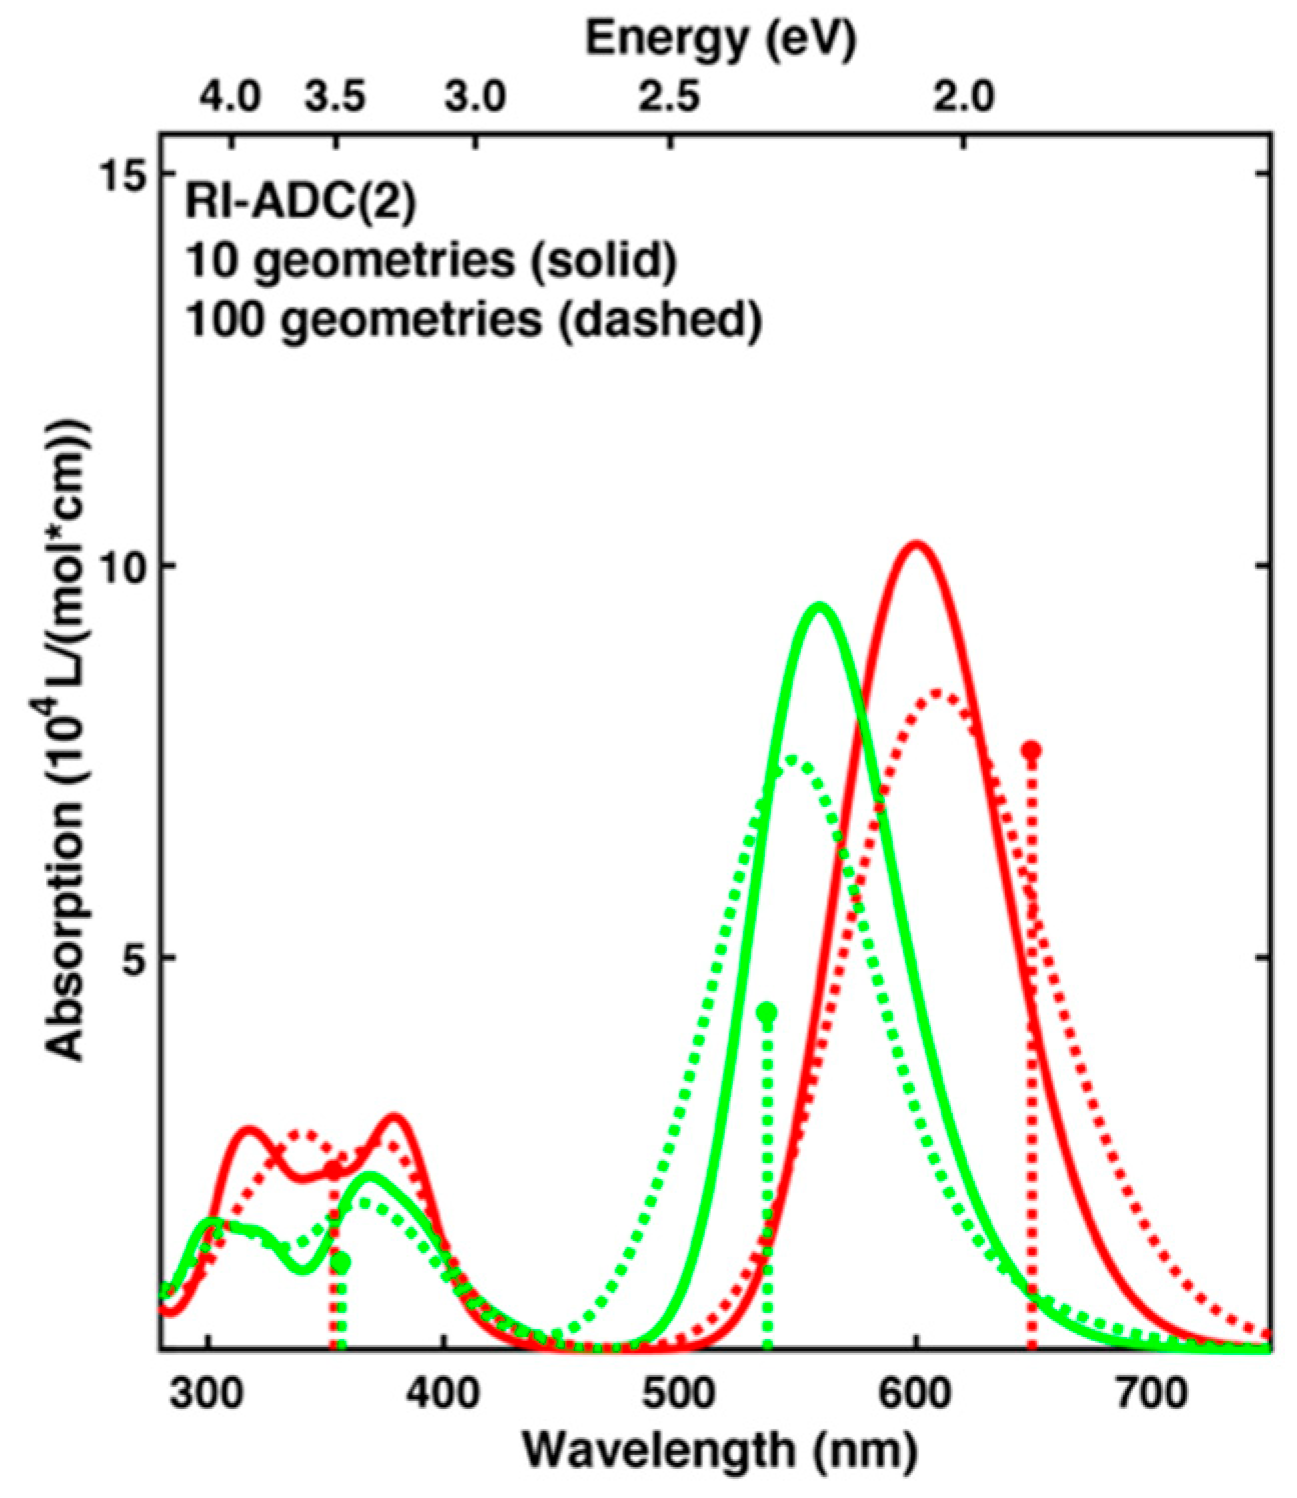
2.2. Spectrum Simulations Based on Sampling from Molecular Dynamics
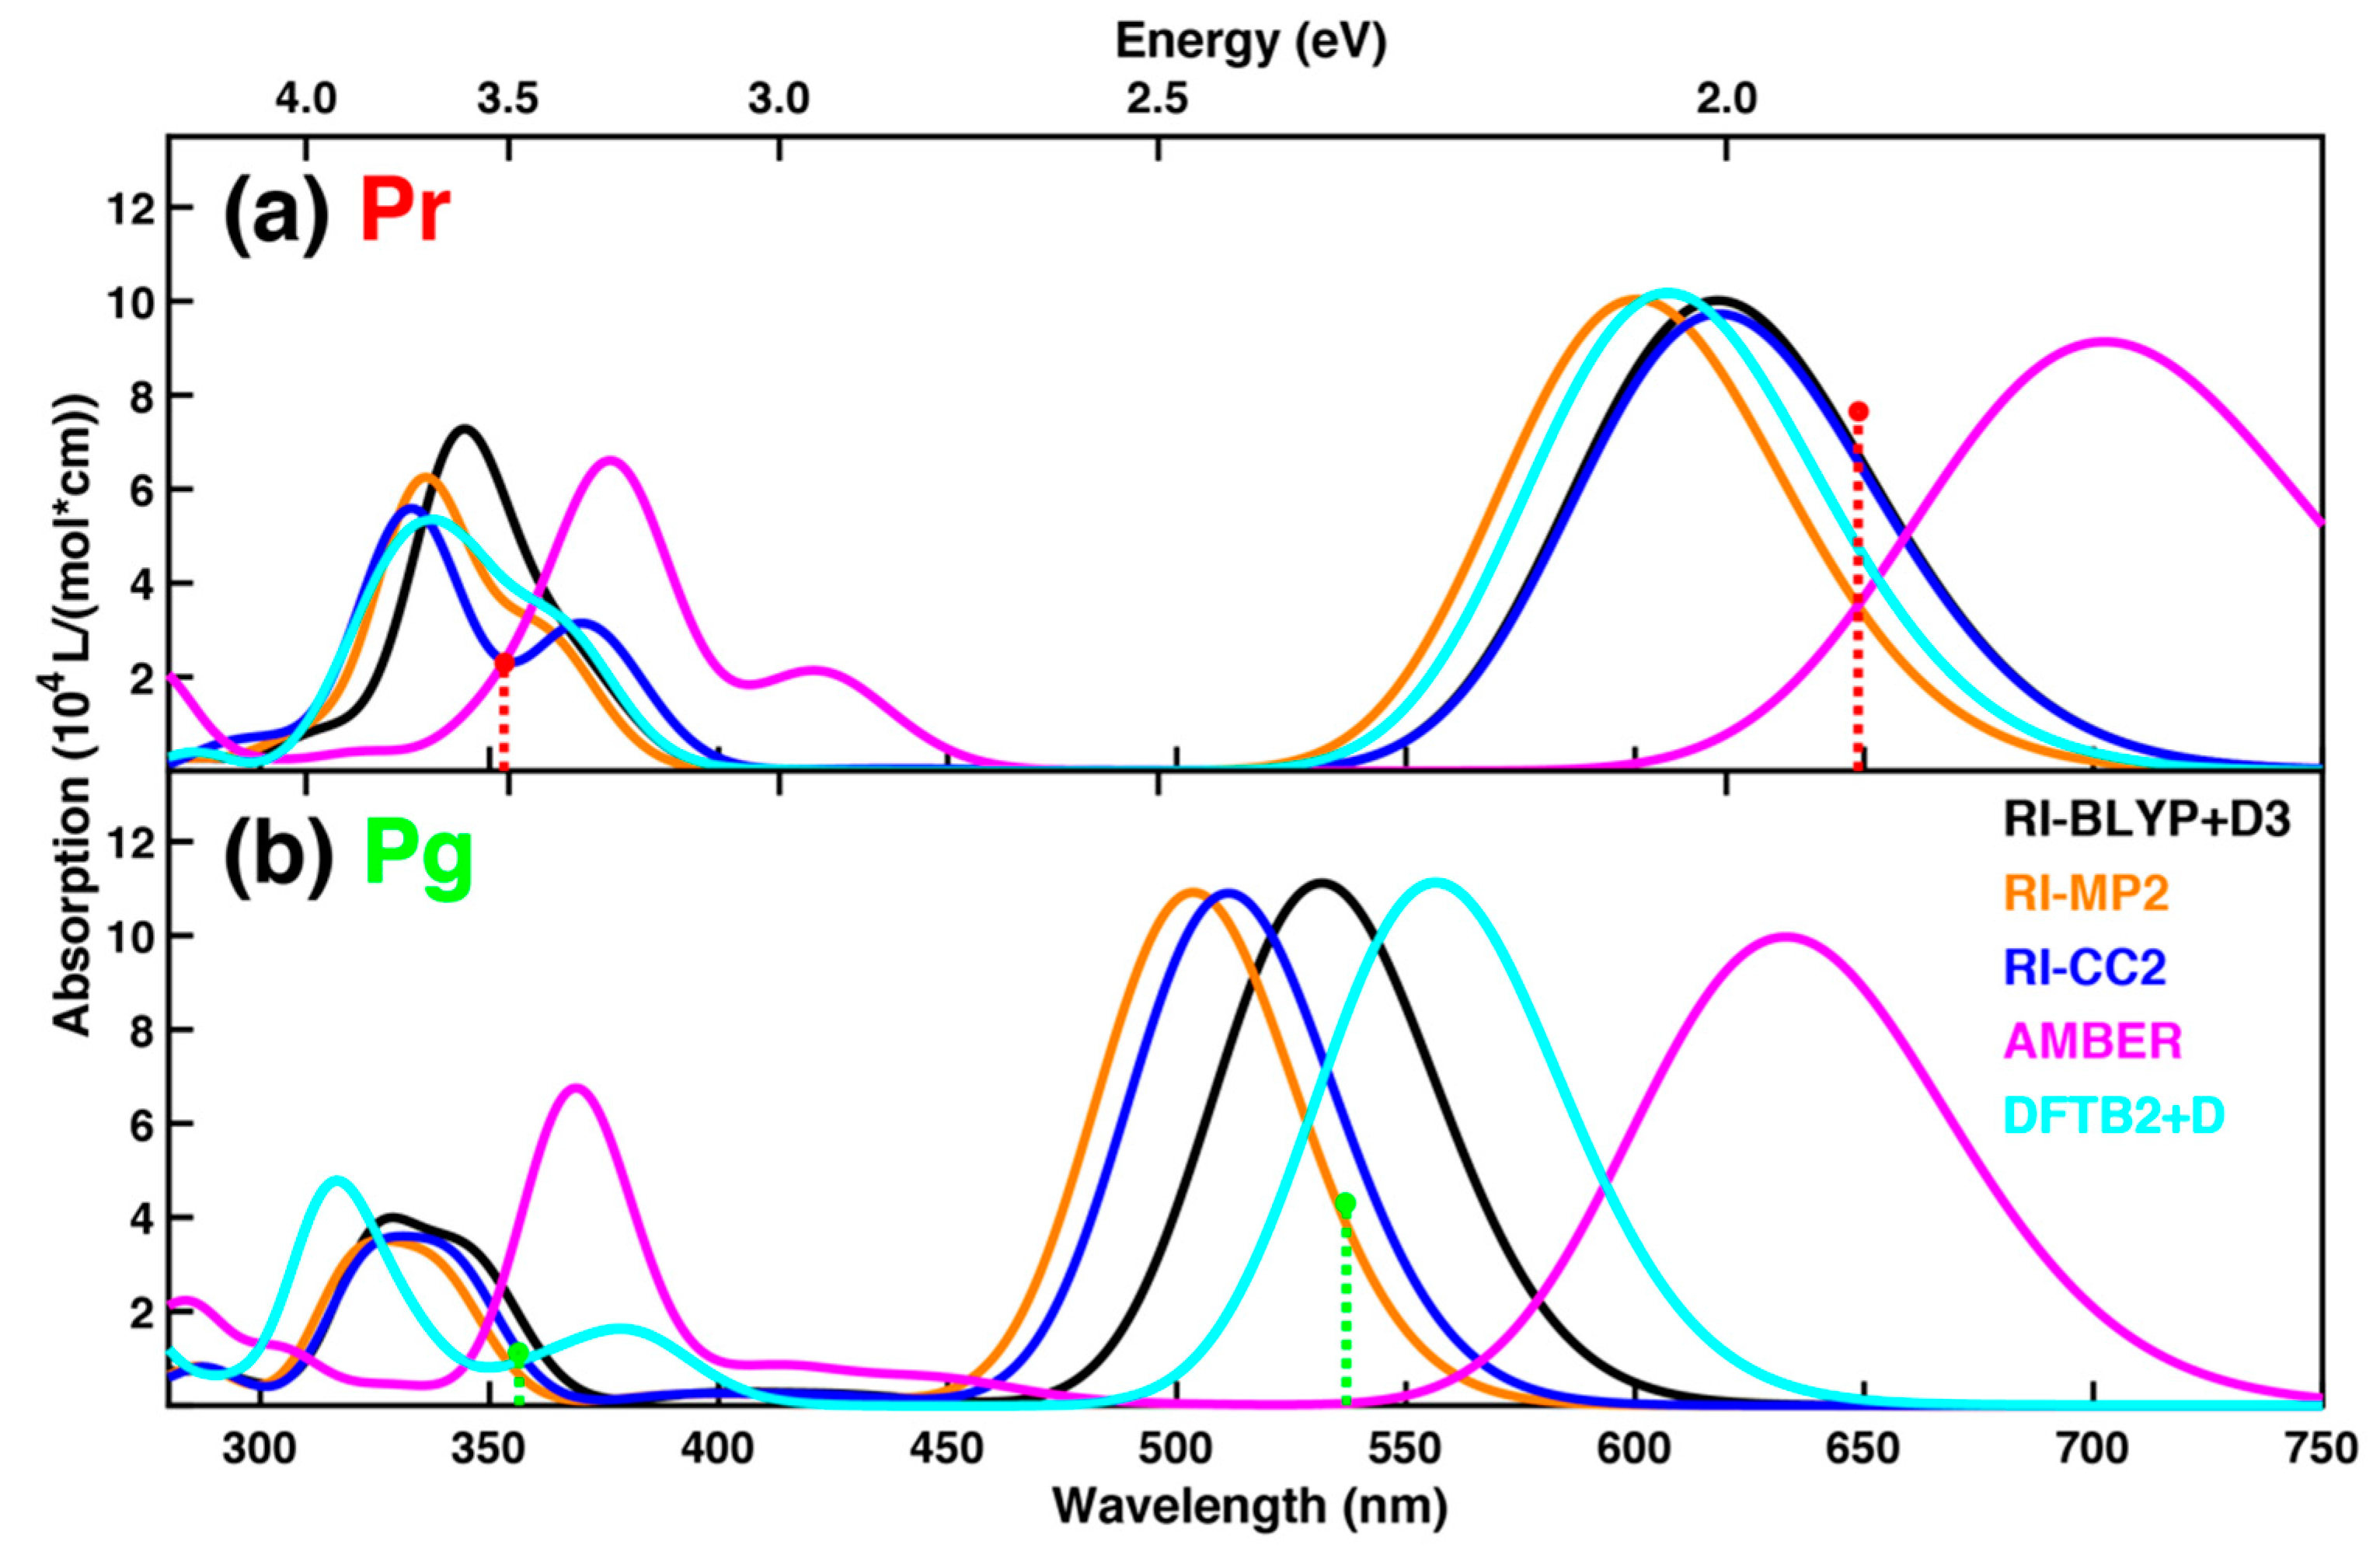
2.3. Spectrum Simulations Based on QM/MM Geometry Optimizations
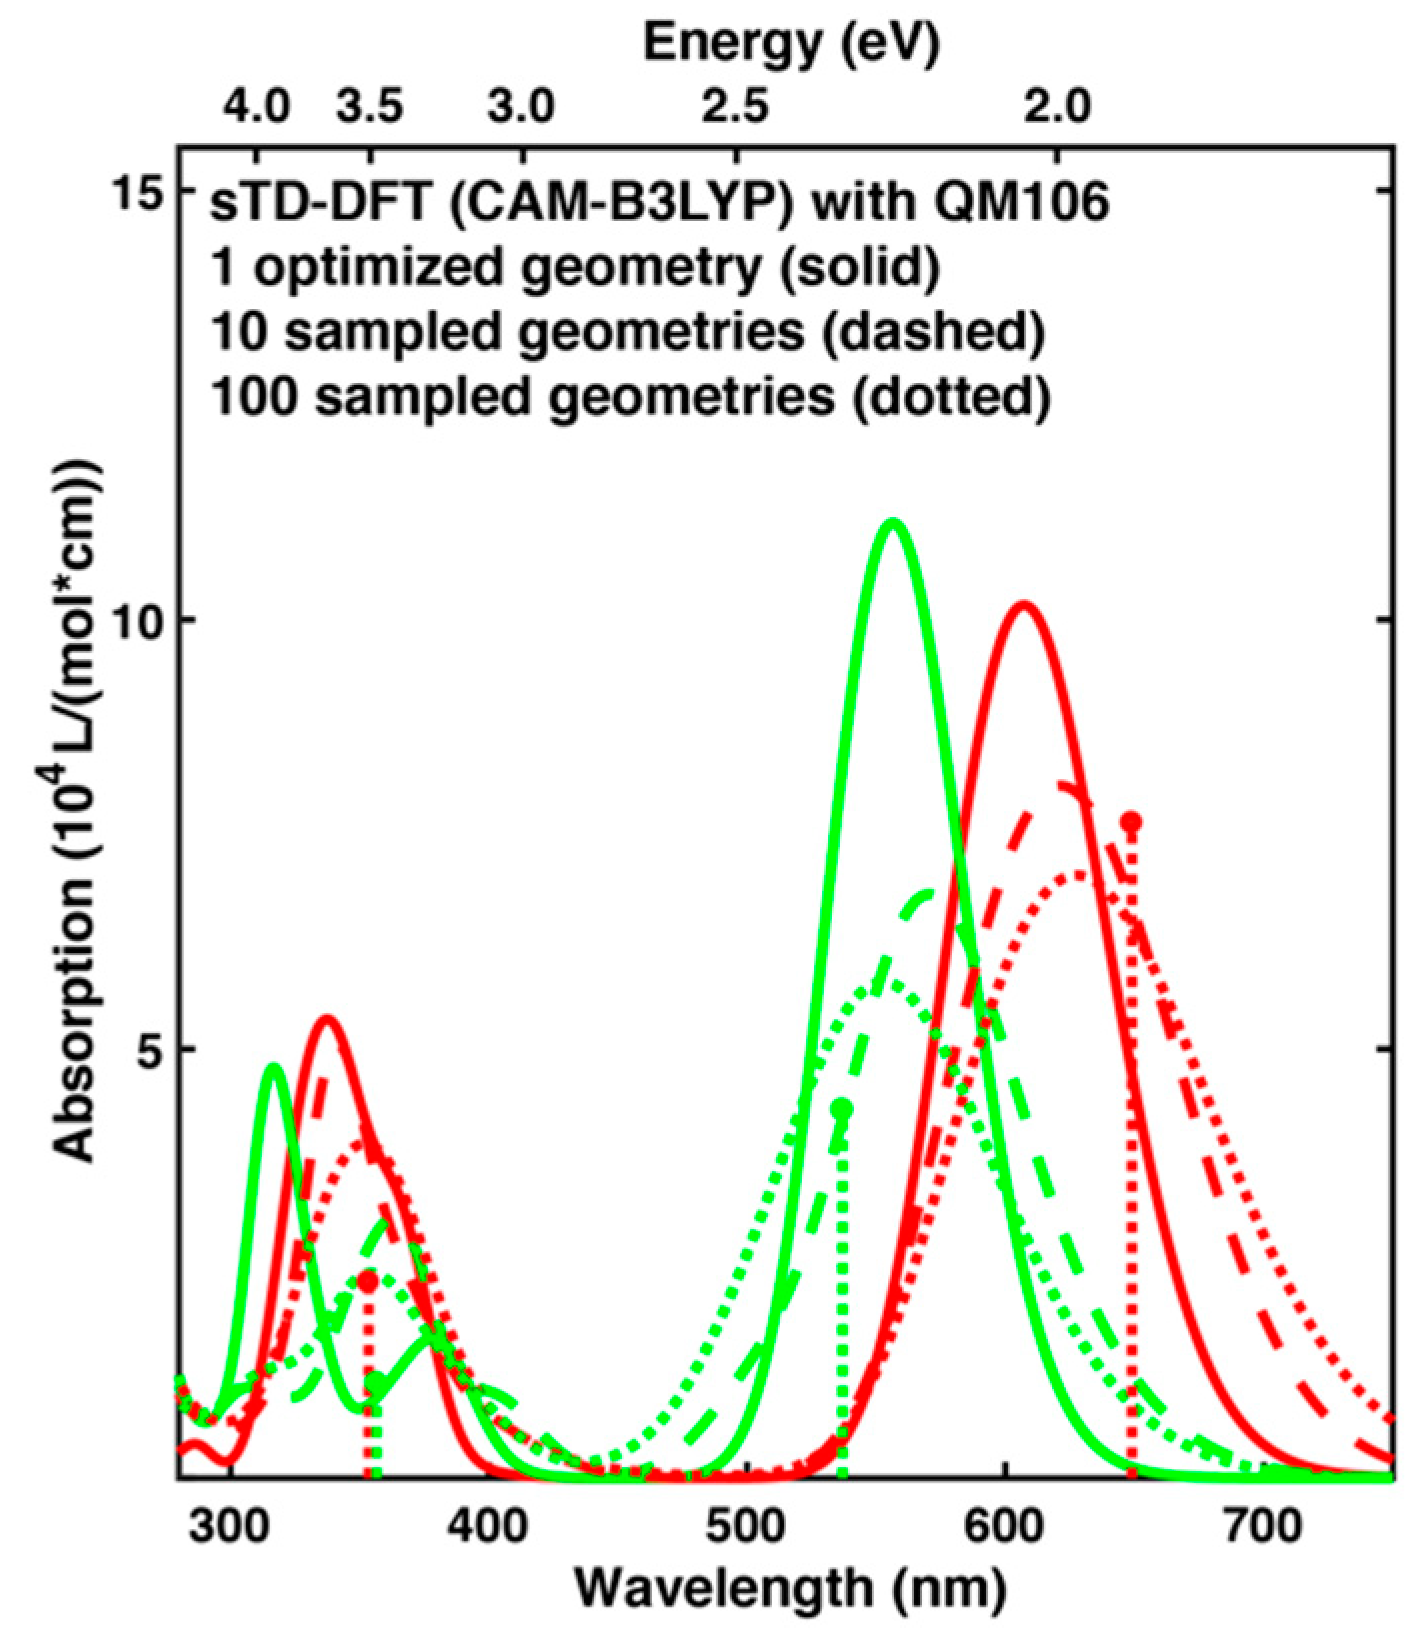
2.4. Comparison of Absorption Spectra: Sampling versus Optimized Structures
3. Discussion
4. Materials and Methods
4.1. Chromophore Structure Optimizations with Semiempirical Methods
4.2. Spectrum Simulations Based on Sampling from Molecular Dynamics
- (i)
- Optimization via AMBER ff14SB force field [107] of the environment employing harmonic restraints of 500 kcal/(mol Å2) on the atoms of the protein with respect to their crystallographic positions.
- (ii)
- Optimization via AMBER of the whole system with restraints on the atoms of the modified residue, i.e., on the PCB chromophore and CYS-528, which binds PCB.
- (iii)
- (i)
- Thermalization with classical MD with stepwise increase of the temperature from 0 to 300 K within 1 ns employing restraints of 10 kcal/(mol Å2) on the modified residue to keep the geometry close to the DFTB2+D/AMBER optimized one.
- (ii)
- Equilibration via classical MD for 100 ns at 300 K to allow backbone relaxation employing the same restraints as before.
- (iii)
- Production run with DFTB2+D/AMBER for 1 ns at 300 K without any restraints.
4.3. Spectrum Simulations Based on QM/MM Geometry Optimizations
Supplementary Materials
Author Contributions
Funding
Acknowledgments
Conflicts of Interest
References
- Yoshihara, S.; Katayama, M.; Geng, X.; Ikeuchi, M. Cyanobacterial phytochrome-like PixJ1 holoprotein shows novel reversible photoconversion between blue- and green-absorbing forms. Plant Cell Physiol. 2004, 45, 1729–1737. [Google Scholar] [CrossRef]
- Ikeuchi, M.; Ishizuka, T. Cyanobacteriochromes: A new superfamily of tetrapyrrole-binding photoreceptors in cyanobacteria. Photochem. Photobiol. Sci. 2008, 7, 1159–1167. [Google Scholar] [CrossRef]
- Heintzen, C. Plant and fungal photopigments. WIREs Membr. Trans. Signal. 2012, 1, 411–432. [Google Scholar] [CrossRef]
- Rockwell, N.C.; Ohlendorf, R.; Möglich, A. Cyanobacteriochromes in full color and three dimensions. Proc. Natl. Acad. Sci. USA 2013, 110, 806–807. [Google Scholar] [CrossRef]
- Fushimi, K.; Narikawa, R. Cyanobacteriochromes: Photoreceptors covering the entire UV-to-visible spectrum. Curr. Opin. Struct. Biol. 2019, 57, 39–46. [Google Scholar] [CrossRef] [PubMed]
- Pennacchietti, F.; Losi, A.; Xu, X.; Zhao, K.; Gärtner, W.; Viappiani, C.; Cella, F.; Diaspro, A.; Abbruzzetti, S. Photochromic conversion in a red/green cyanobacteriochrome from Synechocystis PCC6803: Quantum yields in solution and photoswitching dynamics in living E. coli cells. Photochem. Photobiol. Sci. 2015, 14, 229–237. [Google Scholar] [CrossRef]
- Oliinyk, O.S.; Chernov, K.G.; Verkhusha, V.V. Bacterial phytochromes, cyanobacteriochromes and allophycocyanins as a source of near-infrared fluorescent probes. Int. J. Mol. Sci. 2017, 18, 1691. [Google Scholar] [CrossRef]
- Chernov, K.G.; Redchuk, T.A.; Omelina, E.S.; Verkhusha, V.V. Near-Infrared Fluorescent Proteins, Biosensors, and Optogenetic Tools Engineered from Phytochromes. Chem. Rev. 2017, 117, 6423–6446. [Google Scholar] [CrossRef]
- Shcherbakova, D.M.; Stepanenko, O.V.; Turoverov, K.K.; Verkhusha, V.V. Near-Infrared Fluorescent Proteins: Multiplexing and Optogenetics across Scales. Trends Biotechnol. 2018, 36, 1230–1243. [Google Scholar] [CrossRef] [PubMed]
- Gourinchas, G.; Etzl, S.; Winkler, A. Bacteriophytochromes—From informative model systems of phytochrome function to powerful tools in cell biology. Curr. Opin. Struct. Biol. 2019, 57, 72–83. [Google Scholar] [CrossRef]
- Oliinyk, O.S.; Shemetov, A.A.; Pletnev, S.; Shcherbakova, D.M.; Verkhusha, V.V. Smallest near-infrared fluorescent protein evolved from cyanobacteriochrome as versatile tag for spectral multiplexing. Nat. Commun. 2019, 10, 1–13. [Google Scholar] [CrossRef]
- Wiebeler, C.; Gopalakrishna Rao, A.; Gärtner, W.; Schapiro, I. The Effective Conjugation Length is Responsible for the Red/Green Spectral Tuning in the Cyanobacteriochrome Slr1393g3. Angew. Chem. Int. Ed. 2019, 58, 1934–1938. [Google Scholar] [CrossRef] [PubMed]
- Xu, X.-L.; Gutt, A.; Mechelke, J.; Raffelberg, S.; Tang, K.; Miao, D.; Valle, L.; Borsarelli, C.D.; Zhao, K.-H.; Gärtner, W. Combined Mutagenesis and Kinetics Characterization of the Bilin-Binding GAF Domain of the Protein Slr1393 from the Cyanobacterium Synechocystis PCC6803. ChemBioChem 2014, 15, 1190–1199. [Google Scholar] [CrossRef] [PubMed]
- Slavov, C.; Xu, X.; Zhao, K.H.; Gärtner, W.; Wachtveitl, J. Detailed insight into the ultrafast photoconversion of the cyanobacteriochrome Slr1393 from Synechocystis sp. Biochim. Biophys. Acta Bioenerg. 2015, 1847, 1335–1344. [Google Scholar] [CrossRef] [PubMed]
- Narikawa, R.; Ishizuka, T.; Muraki, N.; Shiba, T.; Kurisu, G.; Ikeuchi, M. Structures of cyanobacteriochromes from phototaxis regulators AnPixJ and TePixJ reveal general and specific photoconversion mechanism. Proc. Natl. Acad. Sci. USA 2013, 110, 918–923. [Google Scholar] [CrossRef] [PubMed]
- Velazquez Escobar, F.; Utesch, T.; Narikawa, R.; Ikeuchi, M.; Mroginski, M.A.; Gärtner, W.; Hildebrandt, P. Photoconversion Mechanism of the Second GAF Domain of Cyanobacteriochrome AnPixJ and the Cofactor Structure of Its Green-Absorbing State. Biochemistry 2013, 52, 4871–4880. [Google Scholar] [CrossRef] [PubMed]
- Scarbath-Evers, L.K.; Jähnigen, S.; Elgabarty, H.; Song, C.; Narikawa, R.; Matysik, J.; Sebastiani, D. Structural heterogeneity in a parent ground-state structure of AnPixJg2 revealed by theory and spectroscopy. Phys. Chem. Chem. Phys. 2017, 19, 13882–13894. [Google Scholar] [CrossRef] [PubMed]
- Rockwell, N.C.; Njuguna, S.L.; Roberts, L.; Castillo, E.; Parson, V.L.; Dwojak, S.; Lagarias, J.C.; Spiller, S.C. A second conserved GAF domain cysteine is required for the blue/green photoreversibility of cyanobacteriochrome Tlr0924 from Thermosynechococcus elongatus. Biochemistry 2008, 47, 7304–7316. [Google Scholar] [CrossRef] [PubMed]
- Rockwell, N.C.; Martin, S.S.; Lim, S.; Lagarias, J.C.; Ames, J.B. Characterization of red/green cyanobacteriochrome NpR6012g4 by solution nuclear magnetic resonance spectroscopy: A protonated bilin ring system in both photostates. Biochemistry 2015, 54, 2581–2600. [Google Scholar] [CrossRef]
- Zazza, C.; Sanna, N.; Aschi, M. Theoretical study of α-84 phycocyanobilin chromophore from the thermophilic cyanobacterium Synechococcus elongatus. J. Phys. Chem. B 2007, 111, 5596–5601. [Google Scholar] [CrossRef] [PubMed]
- Matute, R.A.; Contreras, R.; Pérez-Hernández, G.; González, L. The Chromophore Structure of the Cyanobacterial Phytochrome Cph1 as Predicted by Time-Dependent Density Functional Theory. J. Phys. Chem. B 2008, 112, 16253–16256. [Google Scholar] [CrossRef] [PubMed]
- Strambi, A.; Durbeej, B. Initial excited-state relaxation of the bilin chromophores of phytochromes: A computational study. Photochem. Photobiol. Sci. 2011, 10, 569–579. [Google Scholar] [CrossRef] [PubMed]
- Yang, Y.; Linke, M.; von Haimberger, T.; Matute, R.; González, L.; Schmieder, P.; Heyne, K. Active and silent chromophore isoforms for phytochrome Pr photoisomerization: An alternative evolutionary strategy to optimize photoreaction quantum yields. Struct. Dyn. 2014, 1, 014701. [Google Scholar] [CrossRef]
- Xu, X.; Port, A.; Wiebeler, C.; Zhao, K.-H.; Schapiro, I.; Gärtner, W. Phycocyanobilin chromophore distortion as origin of color tuning in red/green Cyanobacteriochrome. unpublished.
- Kaminski, S.; Daminelli, G.; Mroginski, M.A. Molecular dynamics simulations of the chromophore binding site of Deinococcus radiodurans bacteriophytochrome using new force field parameters for the phytochromobilin chromophore. J. Phys. Chem. B 2009, 113, 945–958. [Google Scholar] [CrossRef]
- Kaminski, S.; Mroginski, M.A. Molecular dynamics of phycocyanobilin binding bacteriophytochromes: A detailed study of structural and dynamic properties. J. Phys. Chem. B 2010, 114, 16677–16686. [Google Scholar] [CrossRef] [PubMed]
- Feliks, M.; Lafaye, C.; Shu, X.; Royant, A.; Field, M. Structural Determinants of Improved Fluorescence in a Family of Bacteriophytochrome-Based Infrared Fluorescent Proteins: Insights from Continuum Electrostatic Calculations and Molecular Dynamics Simulations. Biochemistry 2016, 55, 4263–4274. [Google Scholar] [CrossRef] [PubMed]
- Ihalainen, J.A.; Gustavsson, E.; Schroeder, L.; Donnini, S.; Lehtivuori, H.; Isaksson, L.; Thöing, C.; Modi, V.; Berntsson, O.; Stucki-Buchli, B.; et al. Chromophore-Protein Interplay during the Phytochrome Photocycle Revealed by Step-Scan FTIR Spectroscopy. J. Am. Chem. Soc. 2018, 140, 12396–12404. [Google Scholar] [CrossRef] [PubMed]
- Mroginski, M.A.; Mark, F.; Thiel, W.; Hildebrandt, P. Quantum Mechanics/Molecular Mechanics Calculation of the Raman Spectra of the Phycocyanobilin Chromophore in (α)-C-Phycocyanin. Biophys. J. 2007, 93, 1885–1894. [Google Scholar] [CrossRef]
- Mroginski, M.A.; von Stetten, D.; Kaminski, S.; Velazquez Escobar, F.; Michael, N.; Daminelli-Widany, G.; Hildebrandt, P. Elucidating photoinduced structural changes in phytochromes by the combined application of resonance Raman spectroscopy and theoretical methods. J. Mol. Struct. 2011, 993, 15–25. [Google Scholar] [CrossRef]
- Salewski, J.; Escobar, F.V.; Kaminski, S.; Von Stetten, D.; Keidel, A.; Rippers, Y.; Michael, N.; Scheerer, P.; Piwowarski, P.; Bartl, F.; et al. Structure of the biliverdin cofactor in the Pfr state of bathy and prototypical phytochromes. J. Biol. Chem. 2013, 288, 16800–16814. [Google Scholar] [CrossRef]
- Stöppler, D.; Song, C.; van Rossum, B.J.; Geiger, M.A.; Lang, C.; Mroginski, M.A.; Jagtap, A.P.; Sigurdsson, S.T.; Matysik, J.; Hughes, J.; et al. Dynamic Nuclear Polarization Provides New Insights into Chromophore Structure in Phytochrome Photoreceptors. Angew. Chemie Int. Ed. 2016, 55, 16017–16020. [Google Scholar] [CrossRef] [PubMed]
- Horacio Otero, L.; Klinke, S.; Rinaldi, J.; Velázquez-Escobar, F.; Mroginski, M.A.; Fernández López, M.; Malamud, F.; Vojnov, A.A.; Hildebrandt, P.; Goldbaum, F.A.; et al. Structure of the Full-Length Bacteriophytochrome from the Plant Pathogen Xanthomonas campestris Provides Clues to its Long-Range Signaling Mechanism. J. Mol. Biol. 2016, 428, 3702–3720. [Google Scholar] [CrossRef]
- Takiden, A.; Velazquez-Escobar, F.; Dragelj, J.; Woelke, A.L.; Knapp, E.-W.; Piwowarski, P.; Bart, F.; Hildebrandt, P.; Mroginski, M.A. Structural and Vibrational Characterization of the Chromophore Binding Site of Bacterial Phytochrome Agp1. Photochem. Photobiol. 2017, 93, 713–723. [Google Scholar] [CrossRef] [PubMed]
- Stensitzki, T.; Yang, Y.; Wölke, A.L.; Knapp, E.-W.; Hughes, J.; Mroginski, M.A.; Heyne, K. Influence of Heterogeneity on the Ultrafast Photoisomerization Dynamics of Pfr in Cph1 Phytochrome. S.I. Photochem. Photobiol. 2017, 93, 703–712. [Google Scholar] [CrossRef] [PubMed]
- Escobar, F.V.; Lang, C.; Takiden, A.; Schneider, C.; Balke, J.; Hughes, J.; Alexiev, U.; Hildebrandt, P.; Mroginski, M.A. Protonation-dependent structural heterogeneity in the chromophore binding site of cyanobacterial phytochrome cph1. J. Phys. Chem. B 2017, 121, 47–57. [Google Scholar] [CrossRef]
- Song, C.; Hughes, J.; Andrea Mroginski, M.; Lang, C.; Kopycki, J.; Gärtner, W.; Matysik, J. 3D Structures of Plant Phytochrome A as Pr and Pfr from Solid-State NMR: Implications for Molecular Function. Front. Plant Sci. 2018, 9, 1–15. [Google Scholar] [CrossRef]
- Khrenova, M.G.; Kulakova, A.M.; Nemukhin, A.V. Competition between two cysteines in covalent binding of biliverdin to phytochrome domains. Org. Biomol. Chem. 2018, 16, 7518–7529. [Google Scholar] [CrossRef]
- Shcherbakova, D.M.; Baloban, M.; Emelyanov, A.V.; Brenowitz, M.; Guo, P.; Verkhusha, V.V. Bright monomeric near-infrared fluorescent proteins as tags and biosensors for multiscale imaging. Nat. Commun. 2016, 7, 12405. [Google Scholar] [CrossRef]
- Baloban, M.; Shcherbakova, D.M.; Pletnev, S.; Pletnev, V.Z.; Lagarias, J.C.; Verkhusha, V.V. Designing brighter near-infrared fluorescent proteins: Insights from structural and biochemical studies. Chem. Sci. 2017, 8, 4546–4557. [Google Scholar] [CrossRef] [PubMed]
- Buhrke, D.; Tavraz, N.N.; Shcherbakova, D.M.; Sauthof, L.; Moldenhauer, M.; Vélazquez Escobar, F.; Verkhusha, V.V.; Hildebrandt, P.; Friedrich, T. Chromophore binding to two cysteines increases quantum yield of near-infrared fluorescent proteins. Sci. Rep. 2019, 9, 1866. [Google Scholar] [CrossRef]
- Durbeej, B.; Anders, O.; Eriksson, L.A. Phytochromobilin C15-Z, syn-C15-E, anti isomerization: Concerted or stepwise? Phys. Chem. Chem. Phys. 2004, 6, 5066–5073. [Google Scholar] [CrossRef]
- Durbeej, B.; Eriksson, L.A. Protein-bound chromophores astaxanthin and phytochromobilin: Excited state quantum chemical studies. Phys. Chem. Chem. Phys. 2006, 8, 4053–4071. [Google Scholar] [CrossRef] [PubMed]
- Falklöf, O.; Durbeej, B. Red-light absorption and fluorescence of phytochrome chromophores: A comparative theoretical study. Chem. Phys. 2013, 425, 19–28. [Google Scholar] [CrossRef]
- Matute, R.A.; Contreras, R.; González, L. Time-dependent DFT on phytochrome chromophores: A way to the right conformer. J. Phys. Chem. Lett. 2010, 1, 796–801. [Google Scholar] [CrossRef]
- Durbeej, B. On the primary event of phytochrome: Quantum chemical comparison of photoreactions at C4, C10 and C15. Phys. Chem. Chem. Phys. 2009, 11, 1354–1361. [Google Scholar] [CrossRef]
- Altoè, P.; Cembran, A.; Olivucci, M.; Garavelli, M. Aborted double bicycle-pedal isomerization with hydrogen bond breaking is the primary event of bacteriorhodopsin proton pumping. Proc. Natl. Acad. Sci. USA 2010, 107, 20172–20177. [Google Scholar] [CrossRef] [PubMed]
- Zhuang, X.; Wang, J.; Lan, Z. Tracking of the Molecular Motion in the Primary Event of Photoinduced Reactions of a Phytochromobilin Model. J. Phys. Chem. B 2013, 117, 15976–15986. [Google Scholar] [CrossRef] [PubMed]
- Li, X.; Xie, Y.; Hu, D.; Lan, Z. Analysis of the Geometrical Evolution in On-the-Fly Surface-Hopping Nonadiabatic Dynamics with Machine Learning Dimensionality Reduction Approaches: Classical Multidimensional Scaling and Isometric Feature Mapping. J. Chem. Theory Comput. 2017, 13, 4611–4623. [Google Scholar] [CrossRef]
- Gozem, S.; Luk, H.L.; Schapiro, I.; Olivucci, M. Theory and Simulation of the Ultrafast Double-Bond Isomerization of Biological Chromophores. Chem. Rev. 2017, 117, 13502–13565. [Google Scholar] [CrossRef]
- Falklöf, O.; Durbeej, B. Modeling of Phytochrome Absorption Spectra. J. Comput. Chem. 2013, 34, 1363–1374. [Google Scholar] [CrossRef]
- Falklöf, O.; Durbeej, B. Steric Effects Govern the Photoactivation of Phytochromes. ChemPhysChem 2016, 17, 954–957. [Google Scholar] [CrossRef]
- Falklöf, O.; Durbeej, B. Computational Identification of Pyrrole Ring C as the Preferred Donor for Excited-State Proton Transfer in Bacteriophytochromes. ChemPhotoChem 2018, 2, 453–457. [Google Scholar] [CrossRef]
- Polyakov, I.V.; Grigorenko, B.L.; Mironov, V.A.; Nemukhin, A.V. Modeling structure and excitation of biliverdin-binding domains in infrared fluorescent proteins. Chem. Phys. Lett. 2018, 710, 59–63. [Google Scholar] [CrossRef]
- Modi, V.; Donnini, S.; Groenhof, G.; Morozov, D. Protonation of the Biliverdin IXα Chromophore in the Red and Far-Red Photoactive States of a Bacteriophytochrome. J. Phys. Chem. B 2019, 123, 2325–2334. [Google Scholar] [CrossRef] [PubMed]
- Granovsky, A.A. Extended multi-configuration quasi-degenerate perturbation theory: The new approach to multi-state multi-reference perturbation theory. J. Chem. Phys. 2011, 134, 214113. [Google Scholar] [CrossRef]
- Seabra, G.D.M.; Walker, R.C.; Elstner, M.; Case, D.A.; Roitberg, A.E. Implementation of the SCC-DFTB method for hybrid QM/MM simulations within the Amber molecular dynamics package. J. Phys. Chem. A 2007, 111, 5655–5664. [Google Scholar] [CrossRef]
- Walker, R.C.; Crowley, M.F.; Case, D.A. The Implementation of a Fast and Accurate QM/MM Potential Method in Amber. J. Comput. Chem. 2008, 29, 1019–1031. [Google Scholar] [CrossRef] [PubMed]
- Case, D.A.; Cerutti, D.S.; Cheatham, T.E., III; Darden, T.A.; Duke, R.E.; Giese, T.J.; Gohlke, H.; Goetz, A.W.; Greene, D.; Homeyer, N.; et al. AMBER 2017; University of California: San Francisco, CA, USA, 2017. [Google Scholar]
- Dunning, T.H., Jr. Gaussian basis sets for use in correlated molecular calculations. I. The atoms boron through neon and hydrogen. J. Chem. Phys. 1989, 90, 1007–1023. [Google Scholar] [CrossRef]
- Christiansen, O.; Koch, H.; Jørgensen, P. The second-order approximate coupled cluster singles and doubles model CC2. Chem. Phys. Lett. 1995, 243, 409–418. [Google Scholar] [CrossRef]
- Weigend, F.; Köhn, A.; Hättig, C. Efficient use of the correlation consistent basis sets in resolution of the identity MP2 calculations. J. Chem. Phys. 2002, 116, 3175–3183. [Google Scholar] [CrossRef]
- Hättig, C. Geometry optimizations with the coupled-cluster model CC2 using the resolution-of-the-identity approximation. J. Chem. Phys. 2003, 118, 7751–7761. [Google Scholar] [CrossRef]
- Furche, F.; Ahlrichs, R.; Hättig, C.; Klopper, W.; Sierka, M.; Weigend, F. Turbomole. WIREs Comput. Mol. Sci. 2014, 4, 91–100. [Google Scholar] [CrossRef]
- TURBOMOLE V7.0 2015, A Development of University of Karlsruhe and Forschungszentrum Karlsruhe GmbH, 1989–2007, TURBOMOLE GmbH, Since 2007. Available online: http://www.turbomole.com (accessed on 1 April 2019).
- Dewar, M.J.S.; Thiel, W. Ground States of Molecules. 38. The MNDO Method. Approximations and Parameters. J. Am. Chem. Soc. 1977, 99, 4899–4907. [Google Scholar] [CrossRef]
- Stewart, J.J.P. Optimization of parameters for semiempirical methods I. Method. J. Comput. Chem. 1989, 10, 209–220. [Google Scholar] [CrossRef]
- Repasky, M.P.; Chandrasekhar, J.; Jorgensen, W.L. PDDG/PM3 and PDDG/MNDO: Improved semiempirical methods. J. Comput. Chem. 2002, 23, 1601–1622. [Google Scholar] [CrossRef]
- Stewart, J.J.P. Optimization of parameters for semiempirical methods V: Modification of NDDO approximations and application to 70 elements. J. Mol. Model. 2007, 13, 1173–1213. [Google Scholar] [CrossRef] [PubMed]
- Jurecka, P.; Cerny, J.; Hobza, P.; Salahub, D.R. Density Functional Theory Augmented with an Empirical Dispersion Term. Interaction Energies and Geometries of 80 Noncovalent Complexes Compared with Ab Initio Quantum Mechanics Calculations. J. Comput. Chem. 2007, 28, 555–569. [Google Scholar] [CrossRef]
- Korth, M. Third-Generation Hydrogen-Bonding Corrections for. J. Chem. Theory Comput. 2010, 6, 3808–3816. [Google Scholar] [CrossRef]
- Dewar, M.J.S.; Zoebisch, E.G.; Healy, E.F.; Stewart, J.J.P. Development and use of quantum mechanical molecular models. 76. AM1: A new general purpose quantum mechanical molecular model. J. Am. Chem. Soc. 1985, 107, 3902–3909. [Google Scholar] [CrossRef]
- Nam, K.; Cui, Q.; Gao, J.; York, D.M. Specific reaction parametrization of the AM1/d Hamiltonian for phosphoryl transfer reactions: H, O, and P atoms. J. Chem. Theory Comput. 2007, 3, 486–504. [Google Scholar] [CrossRef] [PubMed]
- Rocha, G.B.; Freire, R.O.; Simas, A.M.; Stewart, J.J.P. RM1: A Reparameterization of AM1 for H, C, N, O, P, S, F, Cl, Br, and I. J. Comput. Chem. 2006, 27, 1101–1111. [Google Scholar] [CrossRef]
- Porezag, D.; Frauenheim, T.; Köhler, T.; Seifert, G.; Kaschner, R. Construction of tight-binding-like potentials on the basis of density-functional theory: Application to carbon. Phys. Rev. B 1995, 51, 947–957. [Google Scholar] [CrossRef]
- Seifert, G.; Porezag, D.; Frauenheim, T. Calculations of molecules, clusters, and solids with a simplified LCAO-DFT-LDA scheme. Int. J. Quantum Chem. 1996, 58, 185–192. [Google Scholar] [CrossRef]
- Elstner, M.; Porezag, D.; Jungnickel, G.; Elsner, J.; Haugk, M.; Frauenheim, T.; Suhai, S.; Seifert, G. Self-consistent-charge density-functional tight-binding method for simulations of complex materials properties. Phys. Rev. B 1998, 58, 7260–7268. [Google Scholar] [CrossRef]
- Niehaus, T.A.; Elstner, M.; Frauenheim, T.; Suhai, S. Application of an approximate density-functional method to sulfur containing compounds. J. Mol. Struct. THEOCHEM 2001, 541, 185–194. [Google Scholar] [CrossRef]
- Gaus, M.; Cui, Q.; Elstner, M. DFTB3: Extension of the Self-Consistent-Charge Density-Functional Tight-Binding Method (SCC-DFTB). J. Chem. Theory Comput. 2011, 7, 931–948. [Google Scholar] [CrossRef] [PubMed]
- Gaus, M.; Goez, A.; Elstner, M. Parametrization and benchmark of DFTB3 for organic molecules. J. Chem. Theory Comput. 2013, 9, 338–354. [Google Scholar] [CrossRef] [PubMed]
- Gaus, M.; Lu, X.; Elstner, M.; Cui, Q. Parameterization of DFTB3/3OB for sulfur and phosphorus for chemical and biological applications. J. Chem. Theory Comput. 2014, 10, 1518–1537. [Google Scholar] [CrossRef] [PubMed]
- Elstner, M.; Hobza, P.; Frauenheim, T.; Suhai, S.; Kaxiras, E. Hydrogen bonding and stacking interactions of nucleic acid base pairs: A density-functional-theory based treatment. J. Chem. Phys. 2001, 114, 5149–5155. [Google Scholar] [CrossRef]
- Grimme, S.; Antony, J.; Ehrlich, S.; Krieg, H. A consistent and accurate ab initio parametrization of density functional dispersion correction (DFT-D) for the 94 elements H-Pu. J. Chem. Phys. 2010, 132, 154104. [Google Scholar] [CrossRef]
- Send, R.; Kaila, V.R.I.; Sundholm, D. Reduction of the virtual space for coupled-cluster excitation energies of large molecules and embedded systems. J. Chem. Phys. 2011, 134, 214114. [Google Scholar] [CrossRef]
- Send, R.; Suomivuori, C.-M.; Kaila, V.R.I.; Sundholm, D. Coupled-cluster studies of extensive green fluorescent protein models using the reduced virtual space approach. J. Phys. Chem. B 2015, 119, 2933–2945. [Google Scholar] [CrossRef]
- Gamiz-Hernandez, A.P.; Angelova, I.N.; Send, R.; Sundholm, D.; Kaila, V.R.I. Protein-Induced Color Shift of Carotenoids in β-Crustacyanin. Angew. Chemie Int. Ed. 2015, 54, 11564–11566. [Google Scholar] [CrossRef] [PubMed]
- Yang, C.; Dreuw, A. Evaluation of the restricted virtual space approximation in the algebraic-diagrammatic construction scheme for the polarization propagator to speed-up excited-state calculations. J. Comput. Chem. 2017, 38, 1528–1537. [Google Scholar] [CrossRef]
- De Vetta, M.; Baig, O.; Steen, D.; Nogueira, J.J.; González, L. Assessing configurational sampling in the quantum mechanics/molecular mechanics calculation of Temoporfin absorption spectrum and triplet density of states†. Molecules 2018, 23, 2932. [Google Scholar] [CrossRef] [PubMed]
- Kjellgren, E.R.; Haugaard Olsen, J.M.; Kongsted, J. Importance of Accurate Structures for Quantum Chemistry Embedding Methods: Which Strategy Is Better? J. Chem. Theory Comput. 2018, 14, 4309–4319. [Google Scholar] [CrossRef] [PubMed]
- Loco, D.; Cupellini, L. Modeling the absorption lineshape of embedded systems from molecular dynamics: A tutorial review. Int. J. Quantum Chem. 2019, 119, e25726. [Google Scholar] [CrossRef]
- Zuehlsdorff, T.J.; Isborn, C.M. Modeling absorption spectra of molecules in solution. Int. J. Quantum Chem. 2019, 119, e25719. [Google Scholar] [CrossRef]
- Bäppler, S.A.; Plasser, F.; Wormit, M.; Dreuw, A. Exciton analysis of many-body wave functions: Bridging the gap between the quasiparticle and molecular orbital pictures. Phys. Rev. A At. Mol. Opt. Phys. 2014, 90, 052521. [Google Scholar] [CrossRef]
- Mewes, S.A.; Plasser, F.; Krylov, A.; Dreuw, A. Benchmarking Excited-State Calculations Using Exciton Properties. J. Chem. Theory Comput. 2018, 14, 710–725. [Google Scholar] [CrossRef]
- Kronik, L.; Stein, T.; Refaely-Abramson, S.; Baer, R. Excitation gaps of finite-sized systems from optimally tuned range-separated hybrid functionals. J. Chem. Theory Comput. 2012, 8, 1515–1531. [Google Scholar] [CrossRef]
- Risthaus, T.; Hansen, A.; Grimme, S. Excited states using the simplified Tamm–Dancoff-Approach for range-separated hybrid density functionals: Development and application. Phys. Chem. Chem. Phys. 2014, 16, 14408–14419. [Google Scholar] [CrossRef]
- Baker, J.D.; Zerner, M.C. Applications of the random phase approximation with the INDO/S Hamiltonian: UVVIS spectra of free base porphin. Chem. Phys. Lett. 1990, 175, 192–196. [Google Scholar] [CrossRef]
- Tu, S.-L.; Gunn, A.; Toney, M.D.; Britt, R.D.; Lagarias, J.C. Biliverdin reduction by cyanobacterial phycocyanobilin: Ferredoxin oxidoreductase (PcyA) proceeds via linear tetrapyrrole radical intermediates. J. Am. Chem. Soc. 2004, 126, 8682–8693. [Google Scholar] [CrossRef]
- Grimme, S.; Bannwarth, C.; Shushkov, P. A Robust and Accurate Tight-Binding Quantum Chemical Method for Structures, Vibrational Frequencies, and Noncovalent Interactions of Large Molecular Systems Parametrized for All spd-Block Elements (Z = 1-86). J. Chem. Theory Comput. 2017, 13, 1989–2009. [Google Scholar] [CrossRef]
- Bannwarth, C.; Ehlert, S.; Grimme, S. GFN2-xTB—An Accurate and Broadly Parametrized Self-Consistent Tight-Binding Quantum Chemical Method with Multipole Electrostatics and Density-Dependent Dispersion Contributions. J. Chem. Theory Comput. 2019, 15, 1652–1671. [Google Scholar] [CrossRef] [PubMed]
- Grimme, S.; Bannwarth, C. Ultra-fast computation of electronic spectra for large systems by tight-binding based simplified Tamm-Dancoff approximation (sTDA-xTB). J. Chem. Phys. 2016, 145. [Google Scholar] [CrossRef] [PubMed]
- Dennington, R.; Keith, T.; Millam, J. GaussView Version 5.0.9; Semichem Inc.: Shawnee Mission, KA, USA, 2009. [Google Scholar]
- The PyMOL Molecular Graphics System; Version 1.8.7; Schrödinger, LLC.: New York, NY, USA, 2017.
- Hättig, C.; Weigend, F. CC2 excitation energy calculations on large molecules using the resolution of the identity approximation. J. Chem. Phys. 2000, 113, 5154–5161. [Google Scholar] [CrossRef]
- Hättig, C.; Köhn, A. Transition moments and excited-state first-order properties in the coupled-cluster model CC2 using the resolution-of-the-identity approximation. J. Chem. Phys. 2002, 117, 6939–6951. [Google Scholar] [CrossRef]
- Senn, H.M.; Thiel, W. QM/MM methods for biomolecular systems. Angew. Chem. Int. Ed. 2009, 48, 1198–1229. [Google Scholar] [CrossRef]
- Jorgensen, W.L.; Chandrasekhar, J.; Madura, J.D.; Impey, R.W.; Klein, M.L. Comparison of simple potential functions for simulating liquid water. J. Chem. Phys. 1983, 79, 926–935. [Google Scholar] [CrossRef]
- Maier, J.A.; Martinez, C.; Kasavajhala, K.; Wickstrom, L.; Hauser, K.E.; Simmerling, C. ff14SB: Improving the Accuracy of Protein Side Chain and Backbone Parameters from ff99SB. J. Chem. Theory Comput. 2015, 11, 3696–3713. [Google Scholar] [CrossRef]
- Krüger, T.; Elstner, M.; Schiffels, P.; Frauenheim, T. Validation of the density-functional based tight-binding approximation method for the calculation of reaction energies and other data. J. Chem. Phys. 2005, 122, 114110. [Google Scholar] [CrossRef]
- Schirmer, J. Beyond the random-phase approximation: A new approximation scheme for the polarization propagator. Phys. Rev. A 1982, 26, 2395–2416. [Google Scholar] [CrossRef]
- Trofimov, A.B.; Schirmer, J. An efficient polarization propagator approach to valence electron excitation spectra. J. Phys. B At. Mol. Opt. Phys. 1995, 28, 2299–2324. [Google Scholar] [CrossRef]
- Hättig, C. Structure Optimizations for Excited States with Correlated Second-Order Methods: CC2 and ADC(2). Adv. Quantum Chem. 2005, 50, 37–60. [Google Scholar]
- Becke, A.D. Density-functional exchange-energy approximation with correct asymptotic behavior. Phys. Rev. A 1988, 38, 3098–3100. [Google Scholar] [CrossRef]
- Lee, C.; Yang, W.; Parr, R.G. Development of the Colle-Salvetti correlation-energy formula into a functional of the electron density. Phys. Rev. B 1988, 37, 785–789. [Google Scholar] [CrossRef]
- Becke, A.D. Density-functional thermochemistry. III. The role of exact exchange. J. Chem. Phys. 1993, 98, 5648–5652. [Google Scholar] [CrossRef]
- Yanai, T.; Tew, D.P.; Handy, N.C. A new hybrid exchange-correlation functional using the Coulomb-attenuating method (CAM-B3LYP). Chem. Phys. Lett. 2004, 393, 51–57. [Google Scholar] [CrossRef]
- Hirata, S.; Head-Gordon, M. Time-dependent density functional theory within Tamm-Dancoff approximation. Chem. Phys. Lett. 1999, 314, 291–299. [Google Scholar] [CrossRef]
- Foresman, J.B.; Head-Gordon, M.; Pople, J.A.; Frisch, M.J. Toward a systematic molecular orbital theory for excited states. J. Phys. Chem. 1992, 96, 135–149. [Google Scholar] [CrossRef]
- Stratmann, R.E.; Scuseria, G.E.; Frisch, M.J. An efficient implementation of time-dependent density-functional theory for the calculation of excitation energies of large molecules. J. Chem. Phys. 2002, 109, 8218–8224. [Google Scholar] [CrossRef]
- Frisch, M.J.; Trucks, G.W.; Schlegel, H.B.; Scuseria, G.E.; Robb, M.A.; Cheeseman, J.R.; Scalmani, G.; Barone, V.; Mennucci, B.; Petersson, G.A.; et al. Gaussian 09 Revision D.01; Gaussian Inc.: Wallingford, CT, USA, 2013. [Google Scholar]
- Plasser, F.; Lischka, H. Analysis of Excitonic and Charge Transfer Interactions from Quantum Chemical Calculations. J. Chem. Theory Comput. 2012, 8, 2777–2789. [Google Scholar] [CrossRef] [PubMed]
- Plasser, F. TheoDORE 1.6: A Package for Theoretical Density, Orbital Relaxation, and Exciton Analysis. Available online: http://theodore-sourceforge.net (accessed on 1 April 2019).
- Neese, F. The ORCA program system. WIREs Comput. Mol. Sci. 2012, 2, 73–78. [Google Scholar] [CrossRef]
- Neese, F. Software update: The ORCA program system, version 4.0. WIREs Comput. Mol. Sci. 2018, 8, e1327. [Google Scholar] [CrossRef]
- Ridley, J.; Zerner, M. An intermediate neglect of differential overlap technique for spectroscopy: Pyrrole and the azines. Theor. Chim. Acta 1973, 32, 111–134. [Google Scholar] [CrossRef]
- Grimme, S. A simplified Tamm-Dancoff density functional approach for the electronic excitation spectra of very large molecules. J. Chem. Phys. 2013, 138, 244104. [Google Scholar] [CrossRef] [PubMed]
- Bannwarth, C.; Grimme, S. A simplified time-dependent density functional theory approach for electronic ultraviolet and circular dichroism spectra of very large molecules. Comput. Theor. Chem. 2014, 1040–1041, 45–53. [Google Scholar] [CrossRef]
- Chai, J.-D.; Head-Gordon, M. Systematic optimization of long-range corrected hybrid density functionals. J. Chem. Phys. 2008, 128, 084106. [Google Scholar] [CrossRef] [PubMed]
- Weigend, F.; Ahlrichs, R. Balanced basis sets of split valence, triple zeta valence and quadruple zeta valence quality for H to Rn: Design and assessment of accuracy. Phys. Chem. Chem. Phys. 2005, 7, 3297–3305. [Google Scholar] [CrossRef]
- Angeli, C.; Cimiraglia, R.; Evangelisti, S.; Leininger, T.; Malrieu, J.-P. Introduction of n-electron valence states for multireference perturbation theory. J. Chem. Phys. 2001, 114, 10252–10264. [Google Scholar] [CrossRef]
- Angeli, C.; Cimiraglia, R.; Malrieu, J.P. n-electron valence state perturbation theory: A spinless formulation and an efficient implementation of the strongly contracted and of the partially contracted variants. J. Chem. Phys. 2002, 117, 9138–9153. [Google Scholar] [CrossRef]
- Angeli, C.; Pastore, M.; Cimiraglia, R. New perspectives in multireference perturbation theory: The n-electron valence state approach. Theor. Chem. Acc. 2007, 117, 743–754. [Google Scholar] [CrossRef]
- Werner, H.-J.; Knowles, P.J.; Knizia, G.; Manby, F.R.; Schütz, M.; Celani, P.; Györffy, W.; Kats, D.; Korona, T.; Lindh, R.; et al. MOLPRO version 2015.1, a Package of ab Initio Programs. Available online: http://www.molpro.net (accessed on 1 April 2019).
- Werner, H.-J.; Knowles, P.J.; Knizia, G.; Manby, F.R.; Schütz, M. Molpro: A general-purpose quantum chemistry program package. WIREs Comput. Mol. Sci. 2012, 2, 242–253. [Google Scholar] [CrossRef]
- Thiel, W. MNDO Program, Version 7.0; Max-Planck-Institut für Kohlenforschung: Mülheim, Germany, 2017. [Google Scholar]
- Weber, W.; Thiel, W. Orthogonalization corrections for semiempirical methods. Theor. Chem. Acc. 2000, 103, 495–506. [Google Scholar] [CrossRef]
- Koslowski, A.; Beck, M.E.; Thiel, W. Implementation of a general multireference configuration interaction procedure with analytic gradients in a semiempirical context using the graphical unitary group approach. J. Comput. Chem. 2003, 24, 714–726. [Google Scholar] [CrossRef]
- Keal, T.W.; Wanko, M.; Thiel, W. Assessment of semiempirical methods for the photoisomerisation of a protonated Schiff base. Theor. Chem. Acc. 2009, 123, 145–156. [Google Scholar] [CrossRef]
- Kästner, J.; Carr, J.M.; Keal, T.W.; Thiel, W.; Wander, A.; Sherwood, P. DL-FIND: An open-source geometry optimizer for atomistic simulations. J. Phys. Chem. A 2009, 113, 11856–11865. [Google Scholar] [CrossRef]
- ChemShell, a Computational Chemistry Shell. Available online: www.chemshell.org (accessed on 1 April 2019).
- Sherwood, P.; De Vries, A.H.; Guest, M.F.; Schreckenbach, G.; Catlow, C.R.A.; French, S.A.; Sokol, A.A.; Bromley, S.T.; Thiel, W.; Turner, A.J.; et al. QUASI: A general purpose implementation of the QM/MM approach and its application to problems in catalysis. J. Mol. Struct. THEOCHEM 2003, 632, 1–28. [Google Scholar] [CrossRef]
- Metz, S.; Kästner, J.; Sokol, A.A.; Keal, T.W.; Sherwood, P. ChemShell-a modular software package for QM/MM simulations. WIREs Comput. Mol. Sci. 2014, 4, 101–110. [Google Scholar] [CrossRef]
- Grimme, S.; Ehrlich, S.; Goerigk, L. Effect of the Damping Function in Dispersion Corrected Density Functional Theory. J. Comput. Chem. 2011, 32, 1456–1465. [Google Scholar] [CrossRef] [PubMed]
- Weigend, F. Accurate Coulomb-fitting basis sets for H to Rn. Phys. Chem. Chem. Phys. 2006, 8, 1057–1065. [Google Scholar] [CrossRef] [PubMed]
- Weigend, F.; Häser, M. RI-MP2: First derivatives and global consistency. Theor. Chem. Acc. 1997, 97, 331–340. [Google Scholar] [CrossRef]
- Weigend, F.; Häser, M.; Patzelt, H.; Ahlrichs, R. RI-MP2: Optimized auxiliary basis sets and demonstration of efficiency. Chem. Phys. Lett. 1998, 294, 143–152. [Google Scholar] [CrossRef]
- Hättig, C.; Hellweg, A.; Köhn, A. Distributed memory parallel implementation of energies and gradients for second-order Møller–Plesset perturbation theory with the resolution-of-the-identity approximation. Phys. Chem. Chem. Phys. 2006, 8, 1159–1169. [Google Scholar] [CrossRef]
Sample Availability: Not Available. |


| Pr (Pg) | RM1 | AM1-DH+ | DFTB2+D | RI-CC2 |
|---|---|---|---|---|
| PM6-DH+ | 0.18 (0.35) | 0.35 (0.25) | 0.29 (0.96) | 0.76 (1.10) |
| RM1 | - | 0.32 (0.23) | 0.31 (0.90) | 0.65 (1.02) |
| AM1-DH+ | - | 0.39 (0.81) | 0.67 (0.96) | |
| DFTB2+D | - | 0.58 (0.23) |
| Method | Pr | Pg | Comparison | |||||
|---|---|---|---|---|---|---|---|---|
| λ (nm) | Emax (eV) | εPr3 | λ (nm) | Emax (eV) | εPg3 | ΔEmax (eV) | εPg/εPr | |
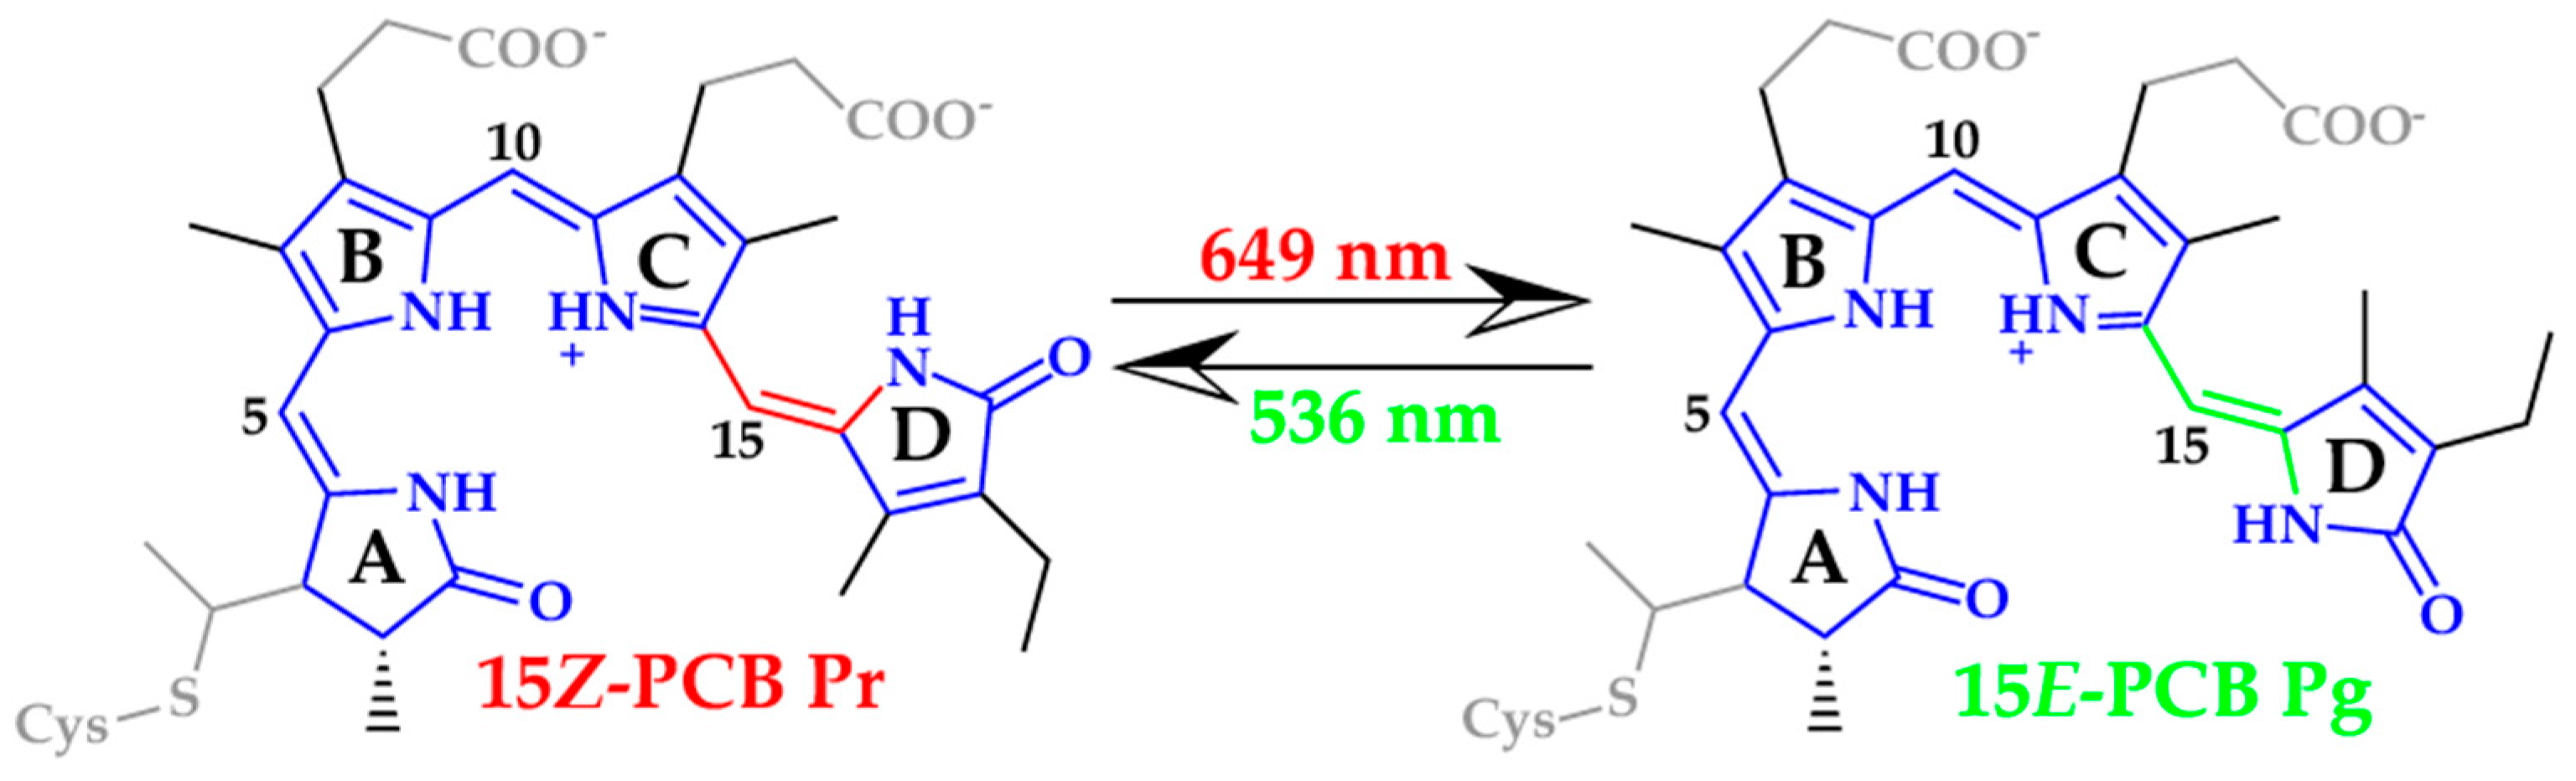
| Exp.1 | 649 | 1.91 | - | 536 | 2.31 | - | 0.40 | 0.562 |
| RI-ADC(2) | ||||||||
| 100 geom.2 | 609 | 2.04 (+0.13) | 8.37 | 548 | 2.26 (−0.05) | 7.52 | 0.23 | 0.898 |
| 10 geom. 2 | 600 | 2.07 (+0.16) | 10.27 | 559 | 2.22 (−0.10) | 9.47 | 0.15 | 0.922 |
| 24 Å cutoff | 596 | 2.08 (+0.17) | 9.32 | 561 | 2.21 (−0.10) | 9.13 | 0.13 | 0.979 |
| cc-aug-pVDZ2 | 616 | 2.01 (+0.10) | 9.83 | 575 | 2.16 (−0.16) | 9.03 | 0.14 | 0.918 |
| WF-based | ||||||||
| RI-CC2 | 560 | 2.21 (+0.30) | 12.77 | 524 | 2.37 (+0.05) | 11.56 | 0.15 | 0.905 |
| RI-CCS | 448 | 2.77 (+0.86) | 14.24 | 423 | 2.93 (+0.62) | 11.39 | 0.16 | 0.800 |
| CIS | 448 | 2.77 (+0.86) | 14.45 | 423 | 2.93 (+0.62) | 11.47 | 0.17 | 0.794 |
| TD-HF | 493 | 2.52 (+0.61) | 12.59 | 461 | 2.69 (+0.37) | 9.99 | 0.17 | 0.793 |
| DFT-based | ||||||||
| CAM-B3LYP | 538 | 2.31 (+0.40) | 11.98 | 504 | 2.46 (+0.15) | 10.70 | 0.15 | 0.893 |
| B3LYP | 569 | 2.18 (+0.27) | 10.98 | 548 | 2.26 (−0.05) | 8.68 | 0.08 | 0.790 |
| B3LYP (TDA) | 500 | 2.48 (+0.57) | 17.38 | 497 | 2.49 (+0.18) | 11.48 | 0.01 | 0.661 |
| BLYP | 609 | 2.03 (+0.12) | 9.00 | 609 | 2.04 (−0.28) | 5.68 | 0.00 | 0.631 |
| Pr (Pg) | DFTB2+D | RI-BLYP+D3 | RI-MP2 | RI-CC2 |
|---|---|---|---|---|
| AMBER | 0.14 (0.24) | 0.16 (0.27) | 0.16 (0.30) | 0.16 (0.29) |
| DFTB2+D | - | 0.12 (0.15) | 0.12 (0.19) | 0.12 (0.19) |
| RI-BLYP+D3 | - | 0.06 (0.07) | 0.05 (0.07) | |
| RI-MP2 | - | 0.01 (0.01) |
© 2019 by the authors. Licensee MDPI, Basel, Switzerland. This article is an open access article distributed under the terms and conditions of the Creative Commons Attribution (CC BY) license (http://creativecommons.org/licenses/by/4.0/).
Share and Cite
Wiebeler, C.; Schapiro, I. QM/MM Benchmarking of Cyanobacteriochrome Slr1393g3 Absorption Spectra. Molecules 2019, 24, 1720. https://doi.org/10.3390/molecules24091720
Wiebeler C, Schapiro I. QM/MM Benchmarking of Cyanobacteriochrome Slr1393g3 Absorption Spectra. Molecules. 2019; 24(9):1720. https://doi.org/10.3390/molecules24091720
Chicago/Turabian StyleWiebeler, Christian, and Igor Schapiro. 2019. "QM/MM Benchmarking of Cyanobacteriochrome Slr1393g3 Absorption Spectra" Molecules 24, no. 9: 1720. https://doi.org/10.3390/molecules24091720
APA StyleWiebeler, C., & Schapiro, I. (2019). QM/MM Benchmarking of Cyanobacteriochrome Slr1393g3 Absorption Spectra. Molecules, 24(9), 1720. https://doi.org/10.3390/molecules24091720