
Influence of Processing Conditions on the Physicochemical Properties of a New-Type of Nutritional Drink—Millet Skim Milk Beverage


Abstract
:
1. Introduction
2. Results
2.1. Chemical Properties
2.2. Physical Properties
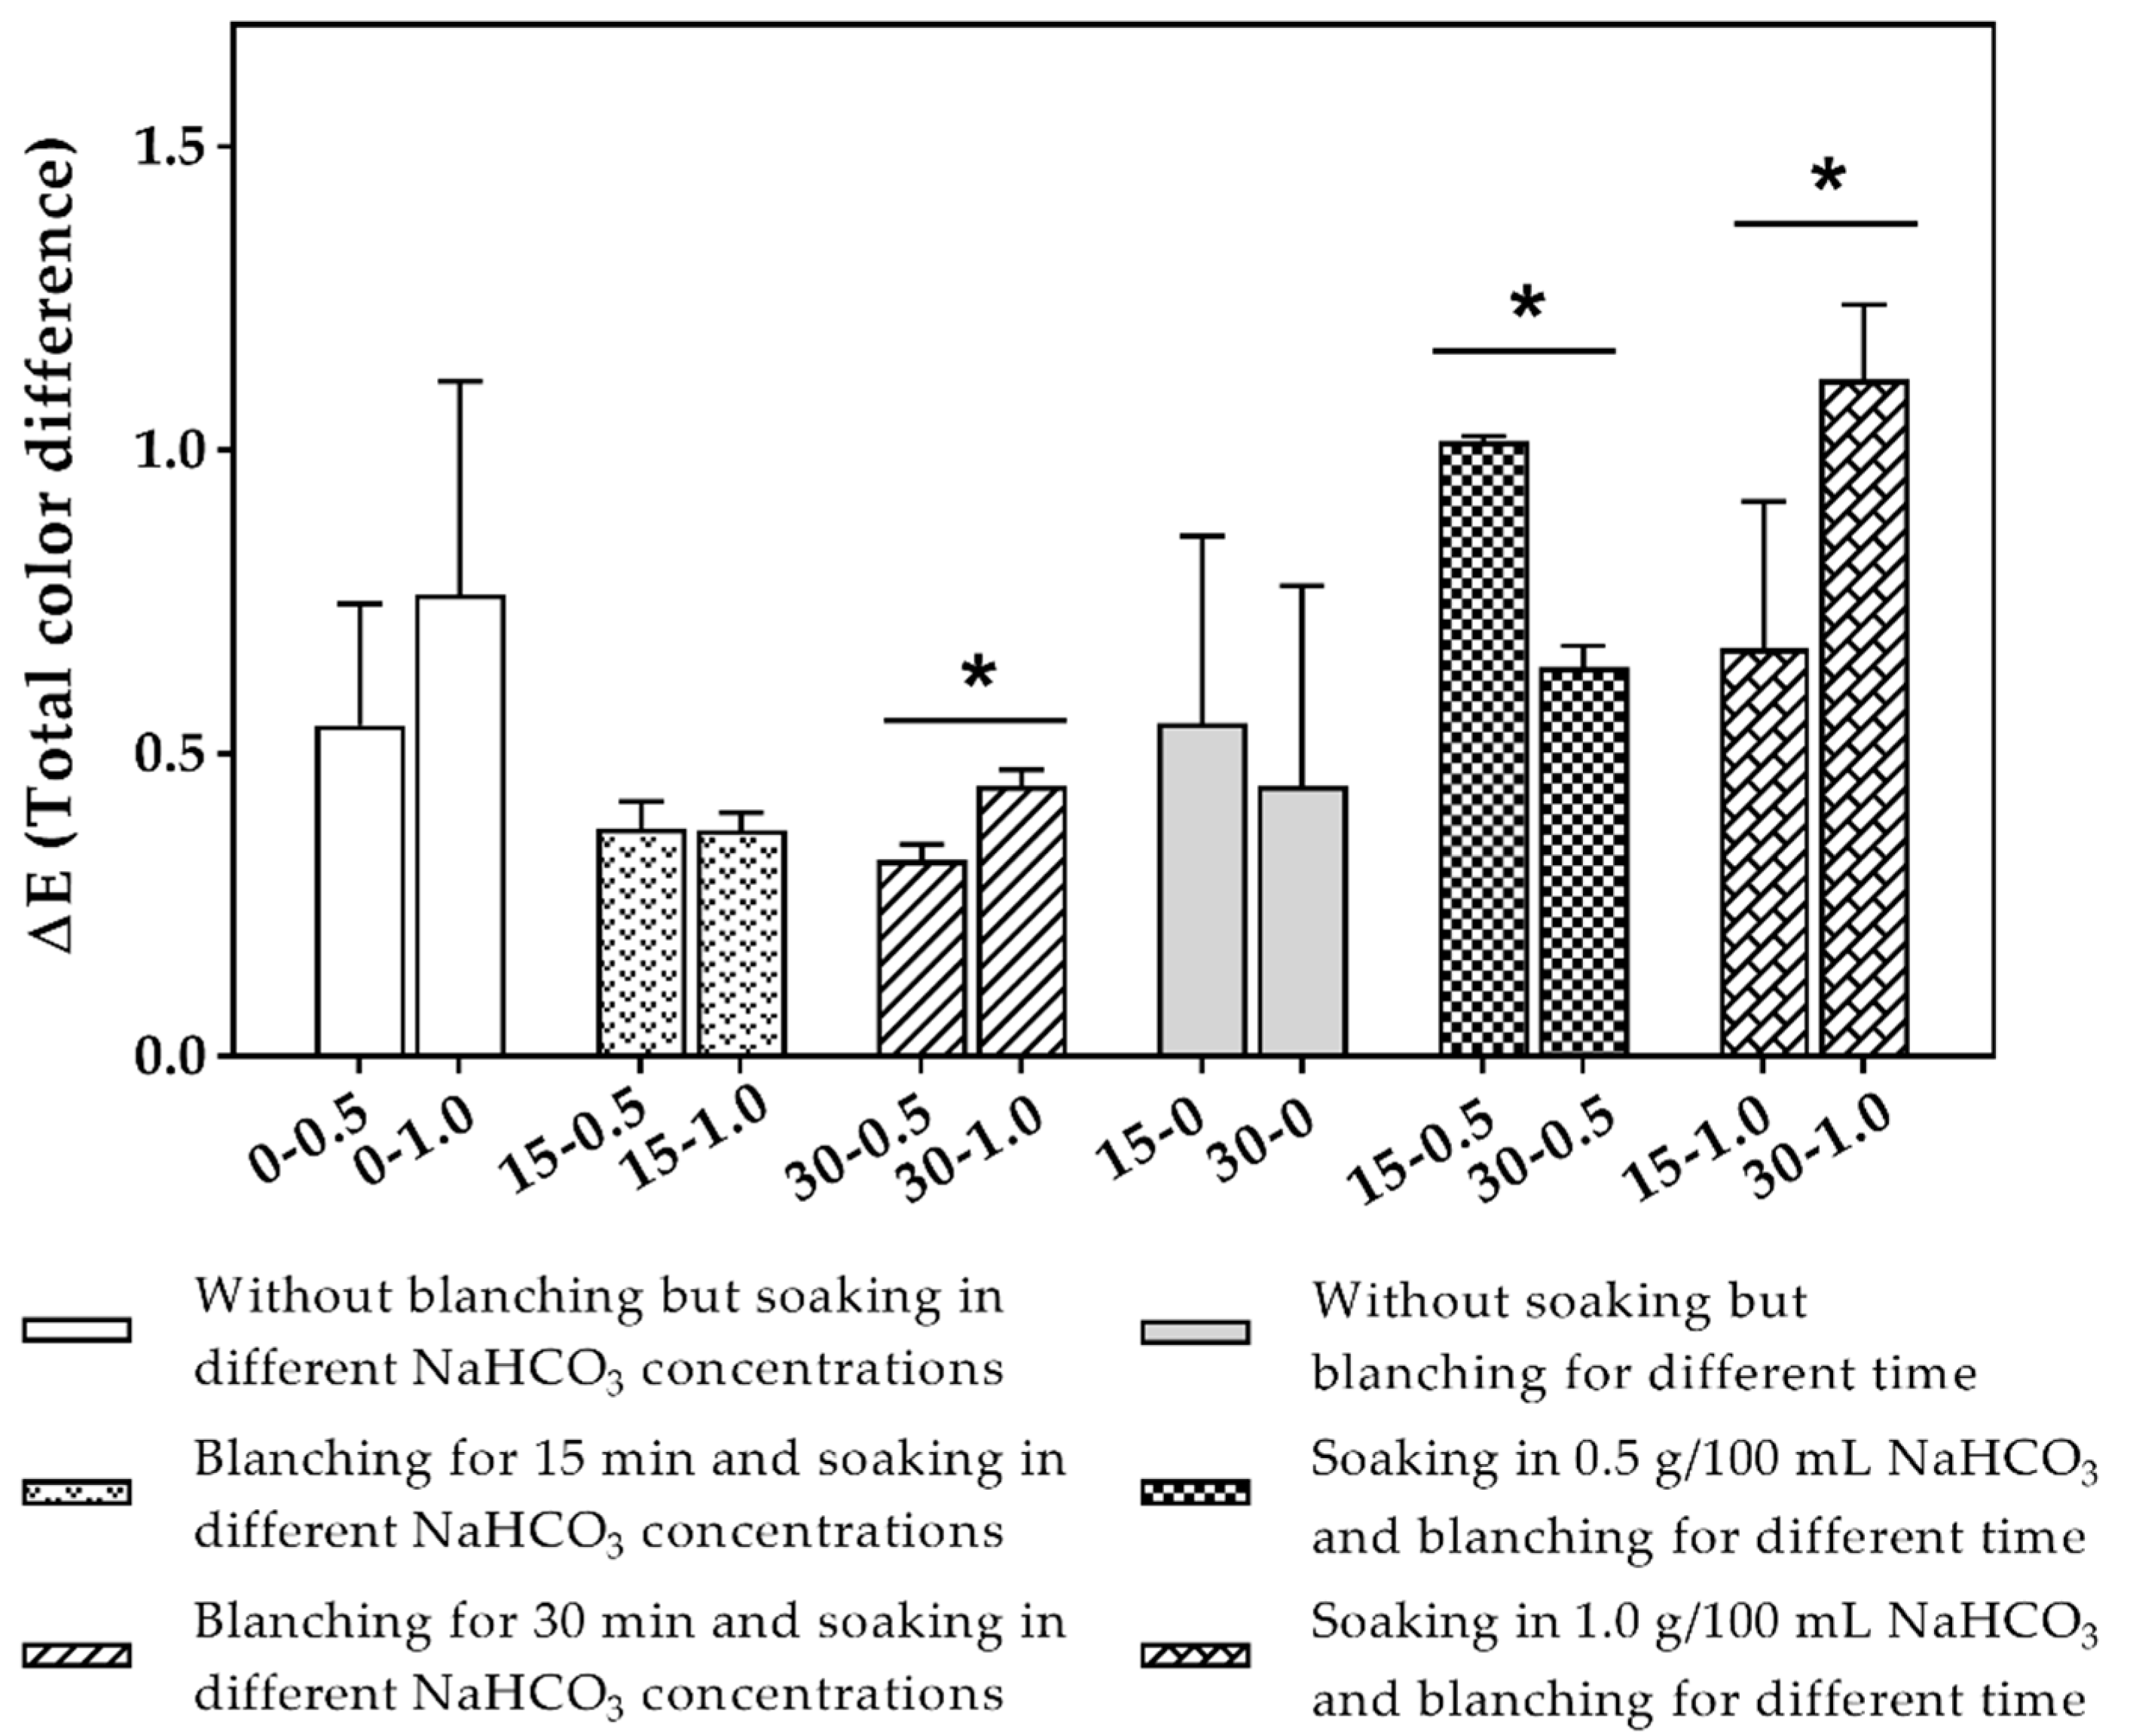
2.3. Color Changes
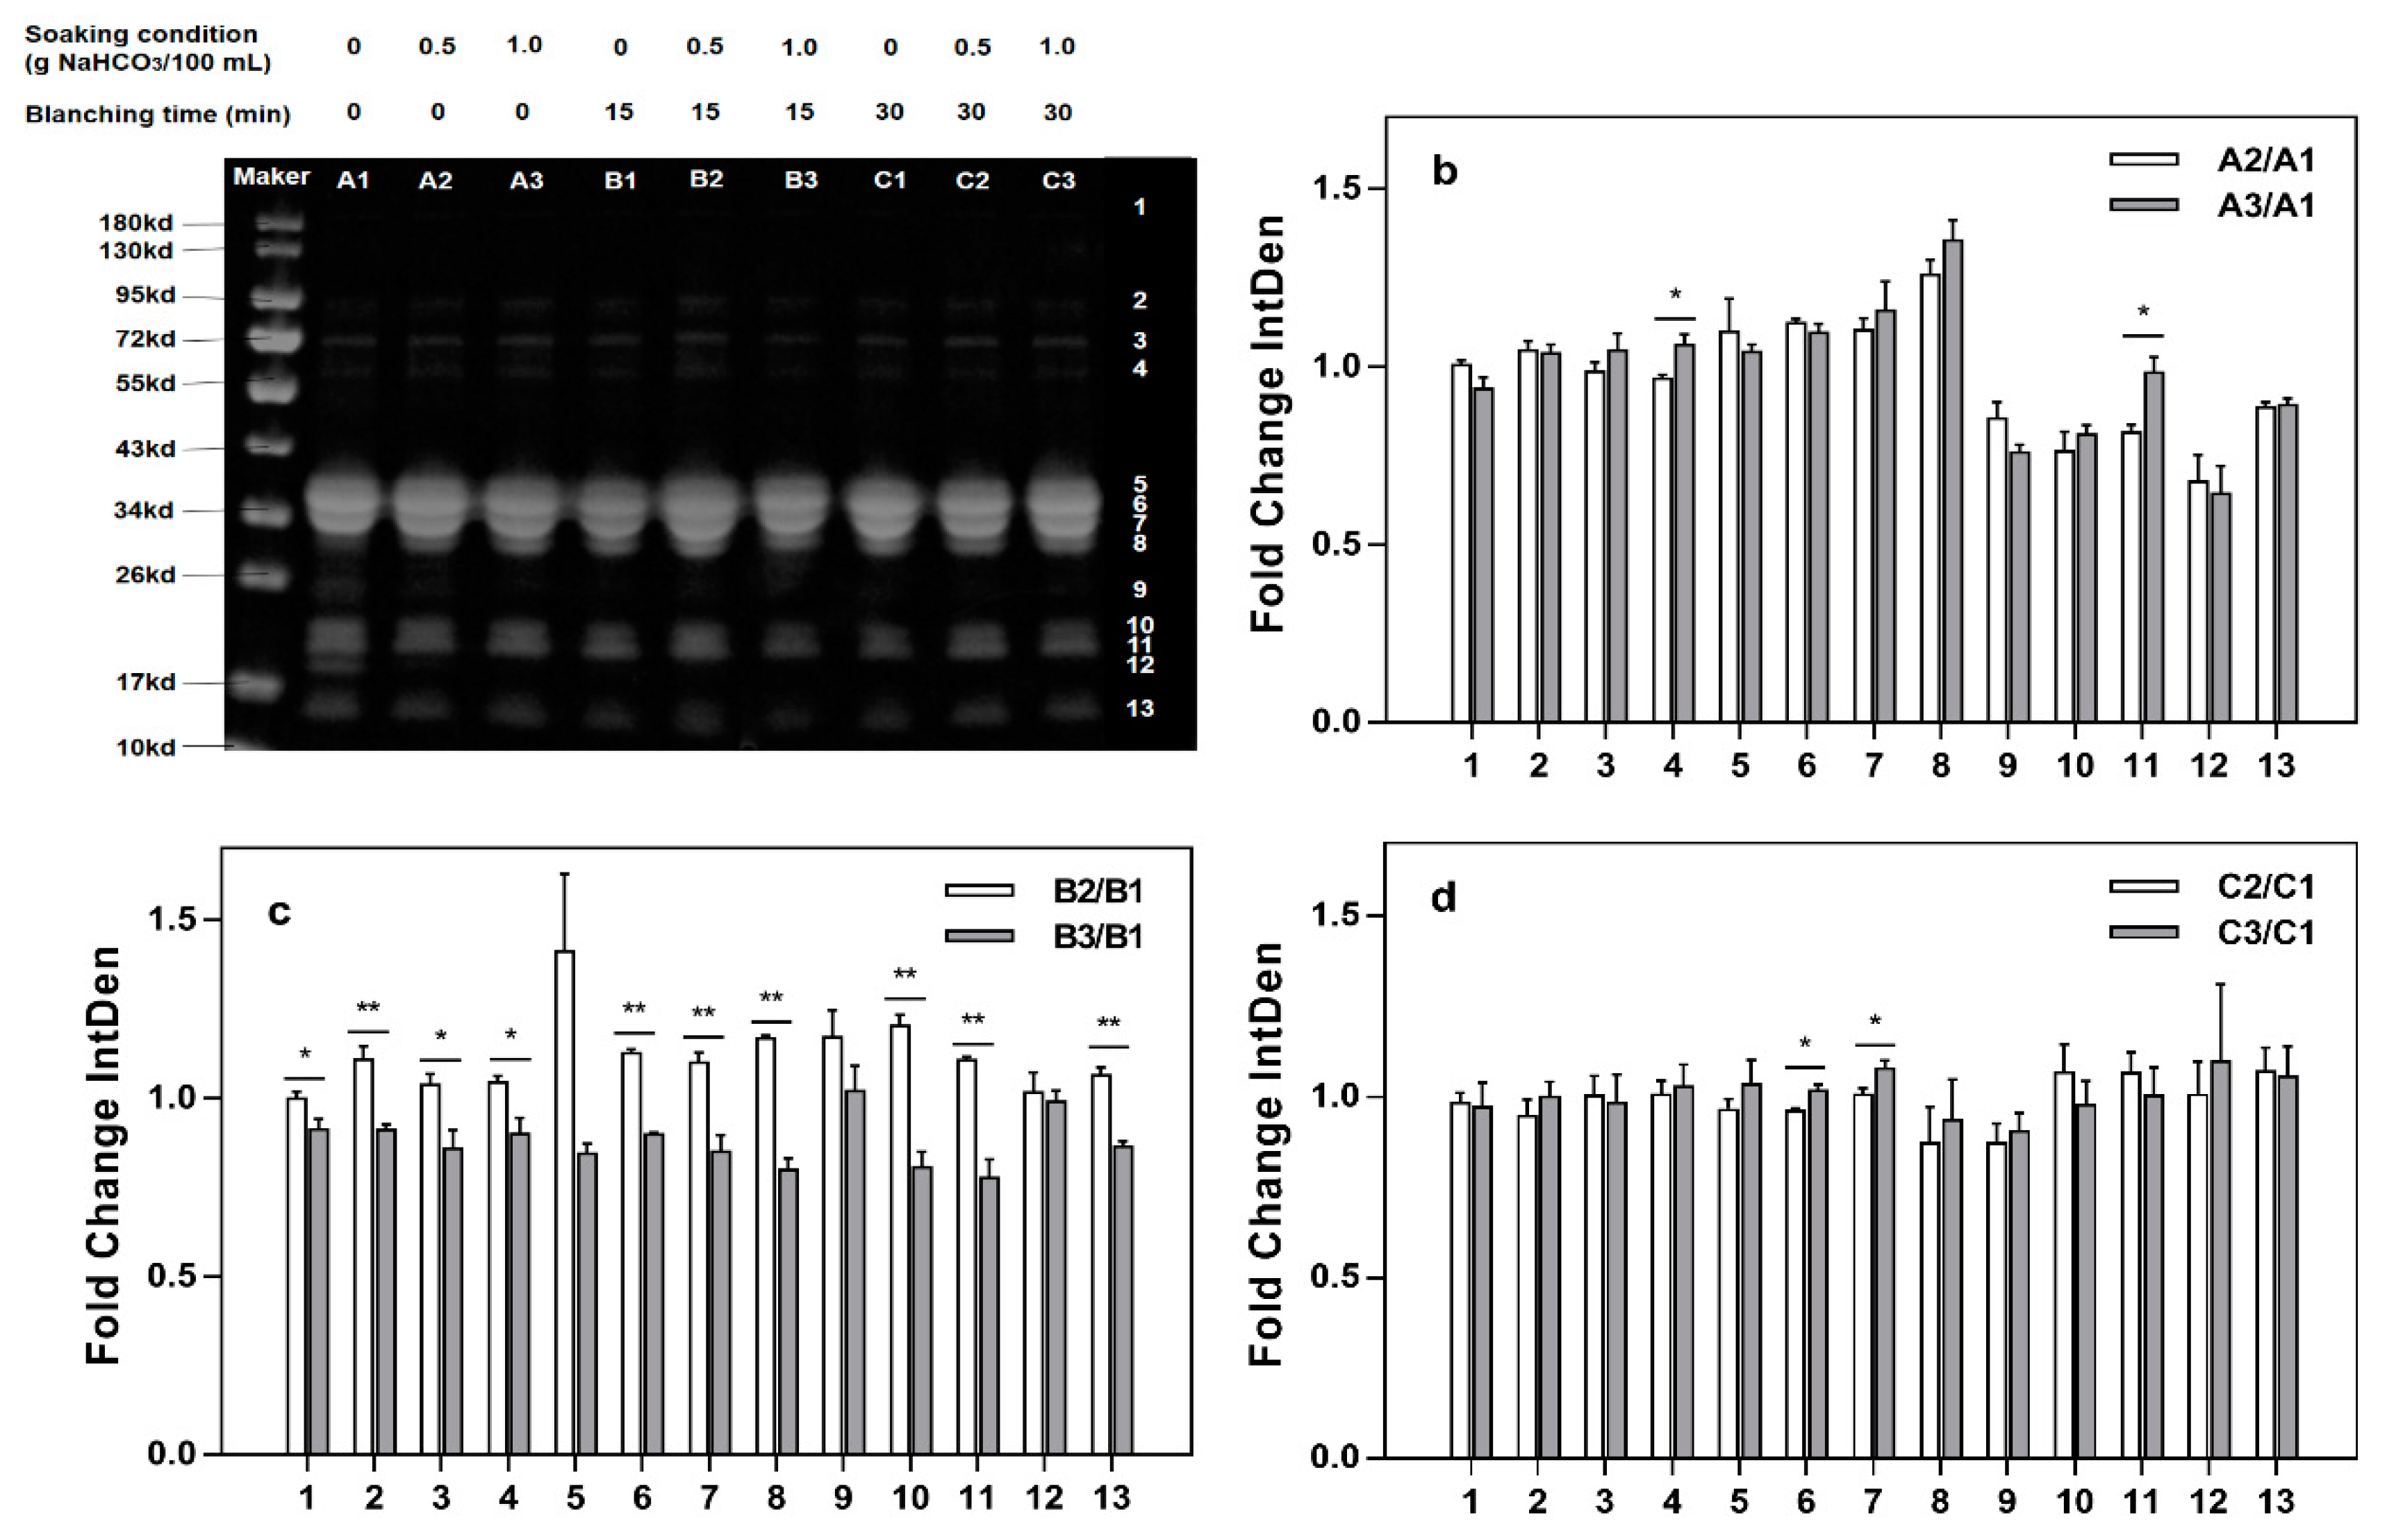
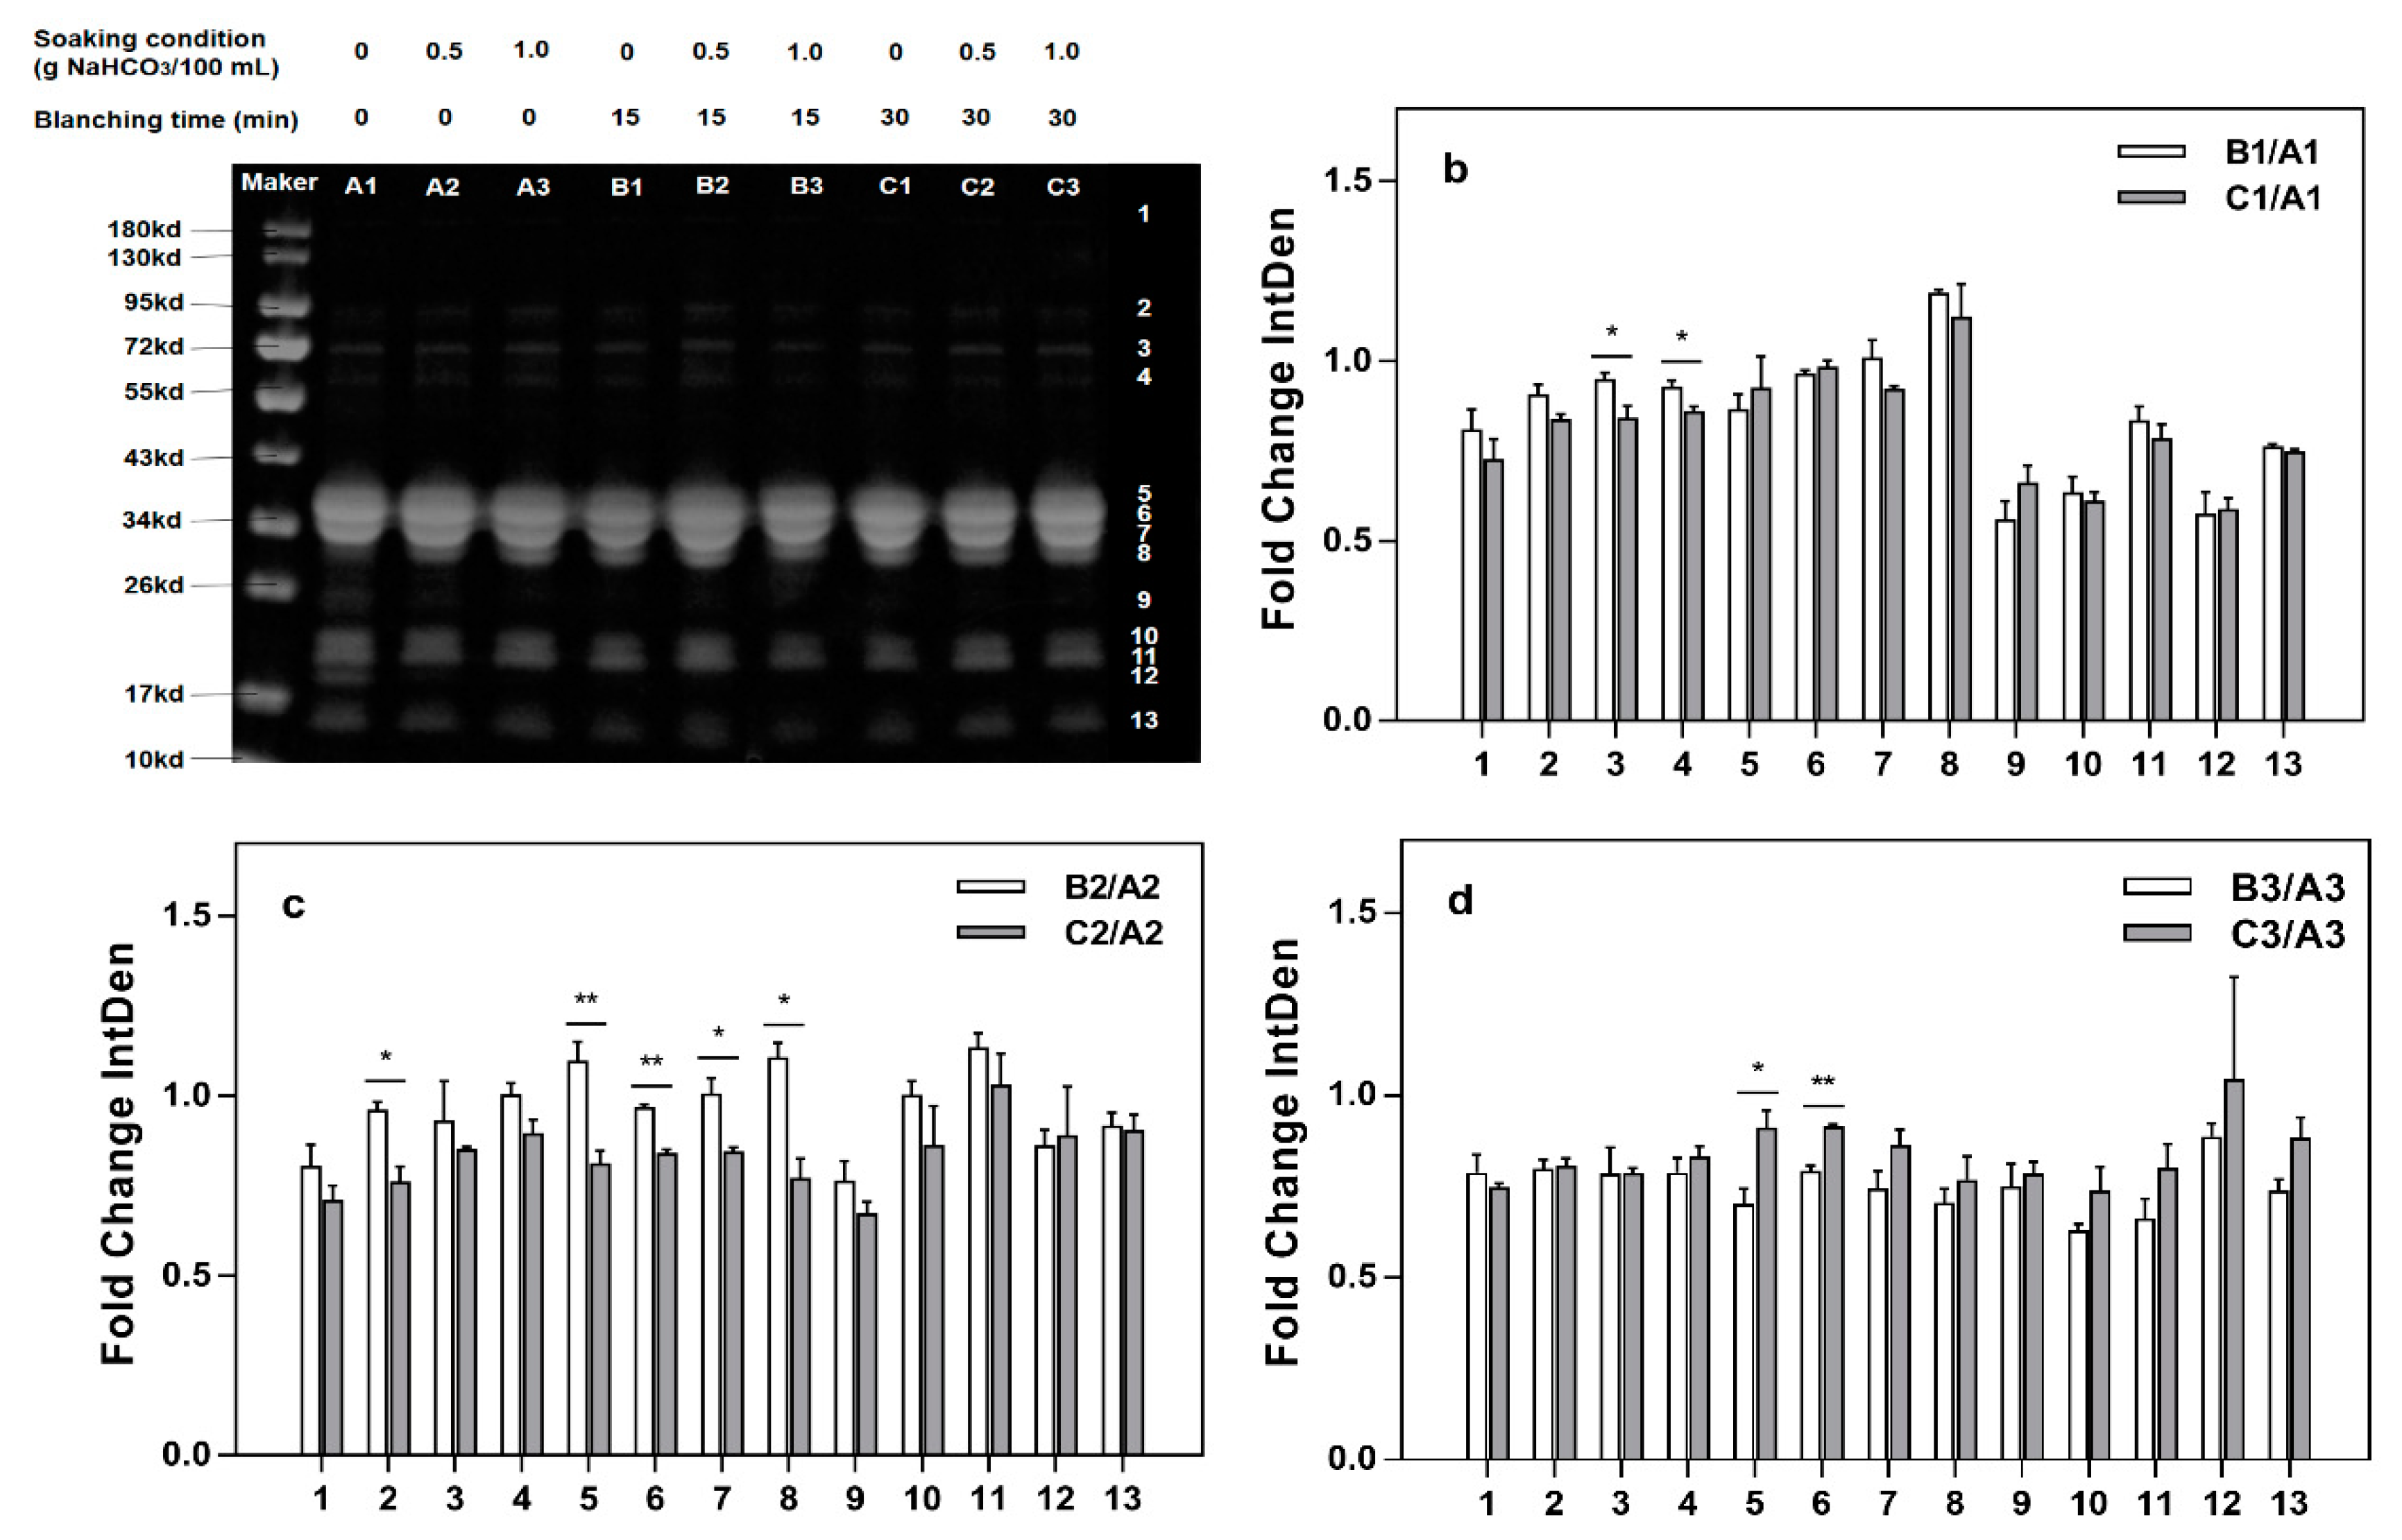
2.4. SDS-PAGE
3. Discussion
3.1. Chemical Properties
3.2. Physical Properties
3.3. Color Changes
3.4. SDS-PAGE
4. Materials and Methods
4.1. Materials
4.2. Methods
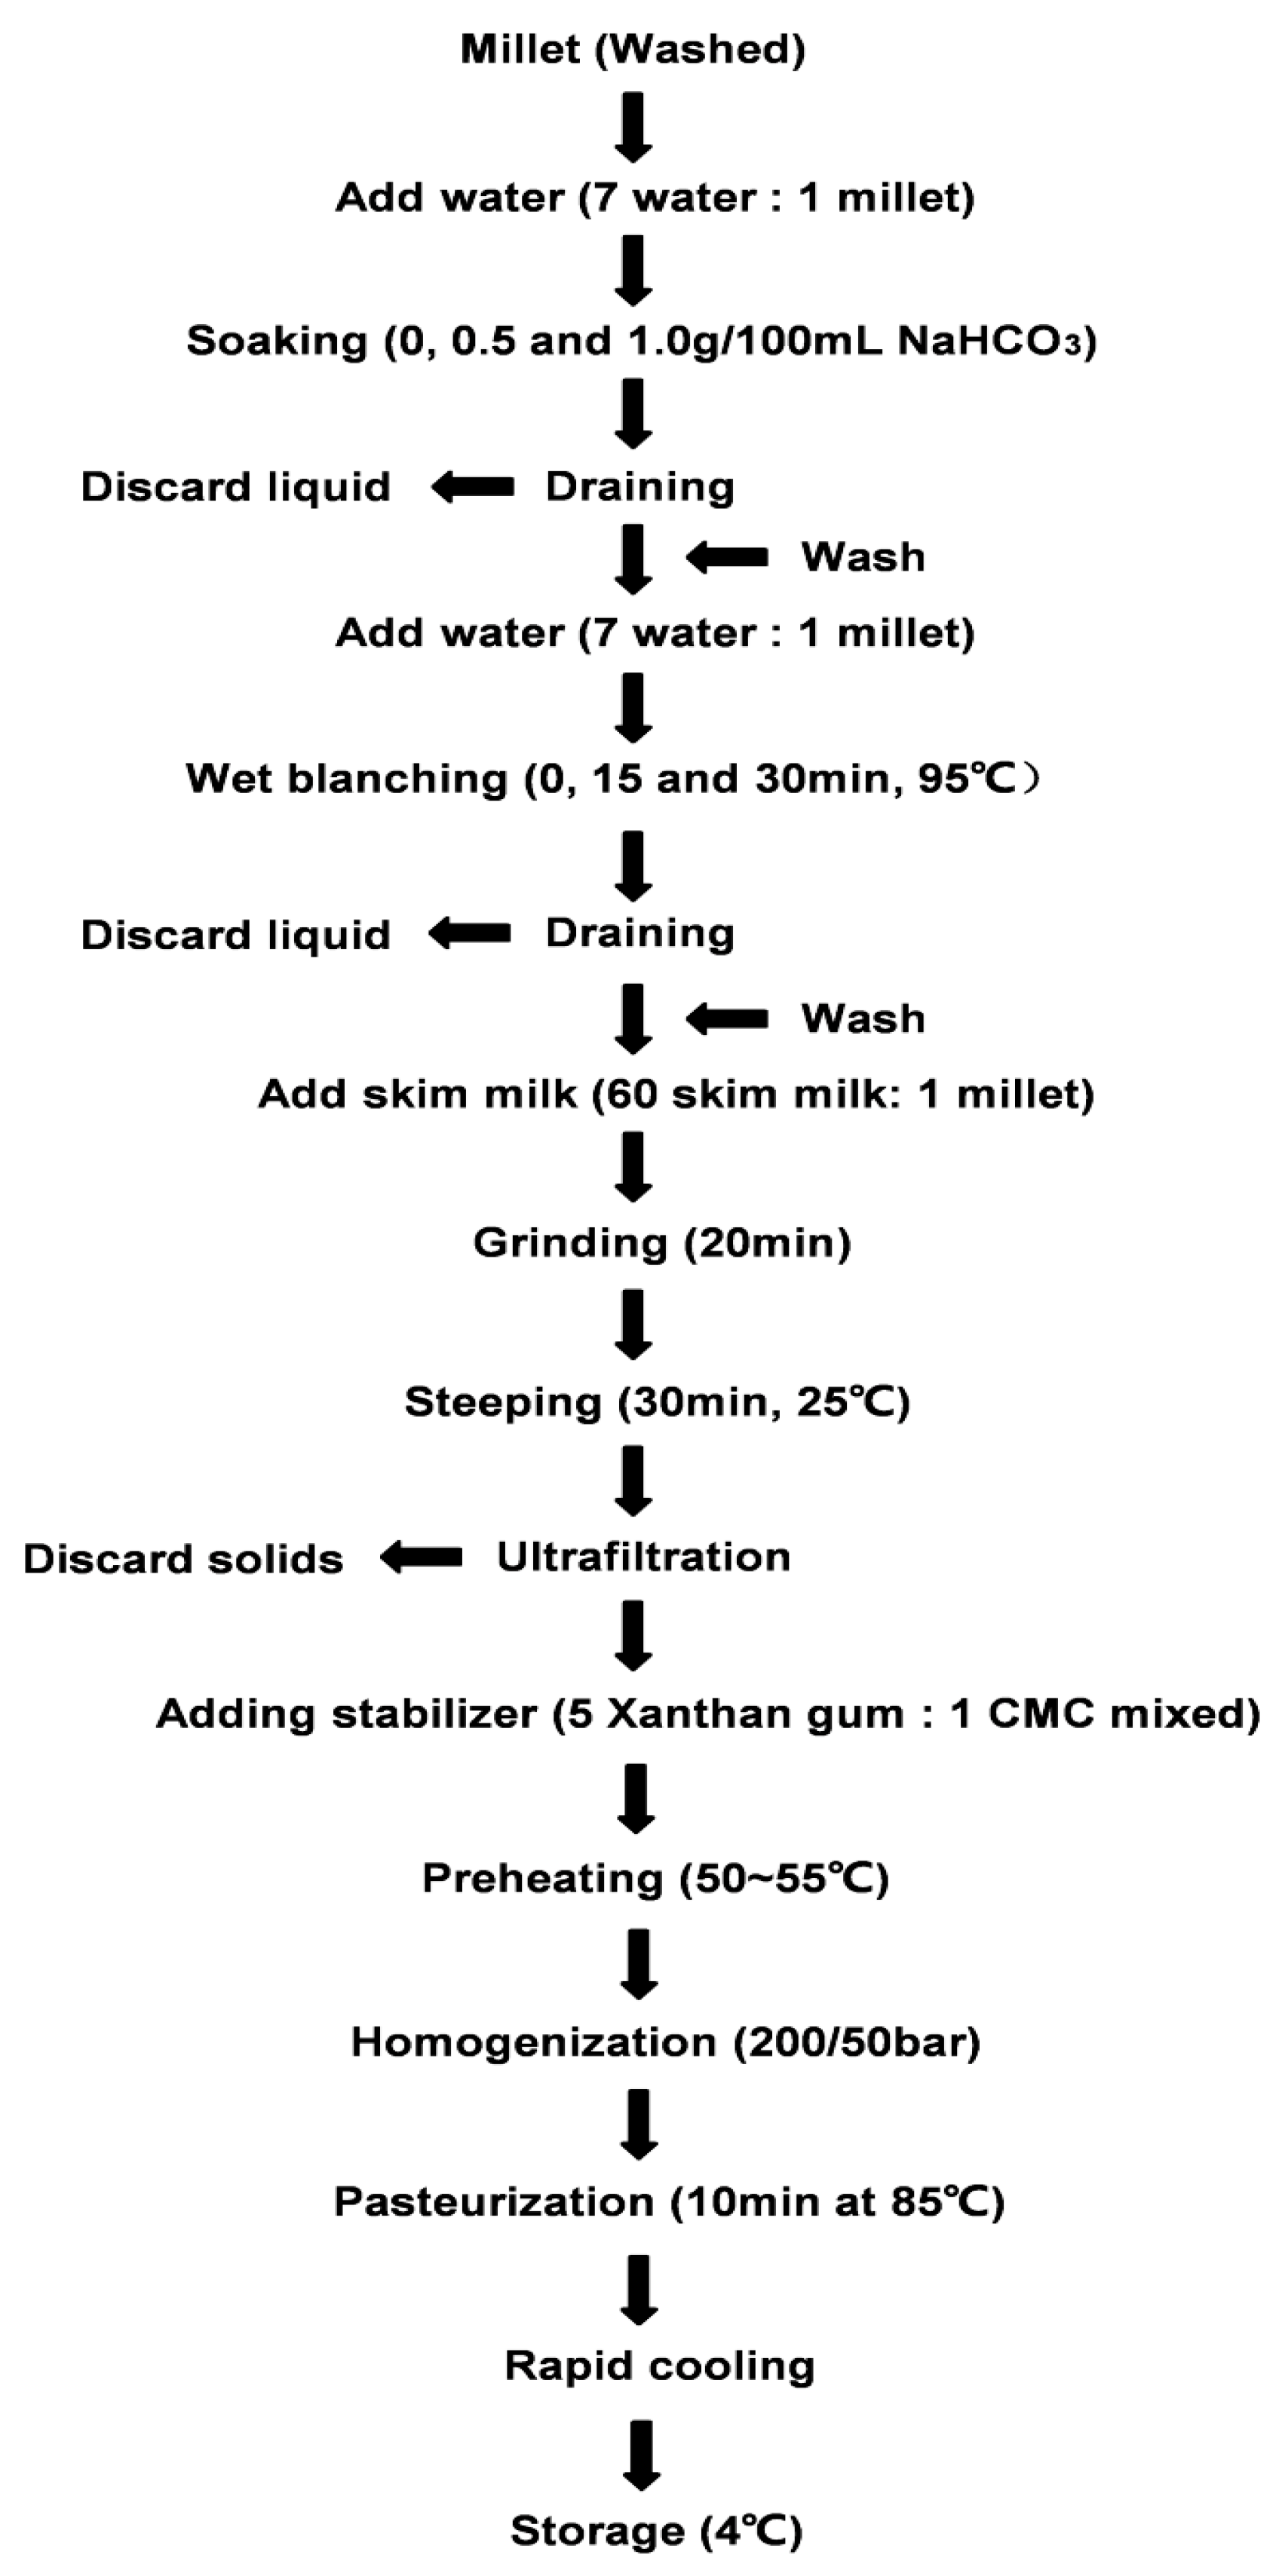
4.2.1. Preparation of Samples
4.2.2. Physical and Chemical Analysis
4.2.3. Precipitation Index
4.2.4. Viscosity
4.2.5. Color Changes
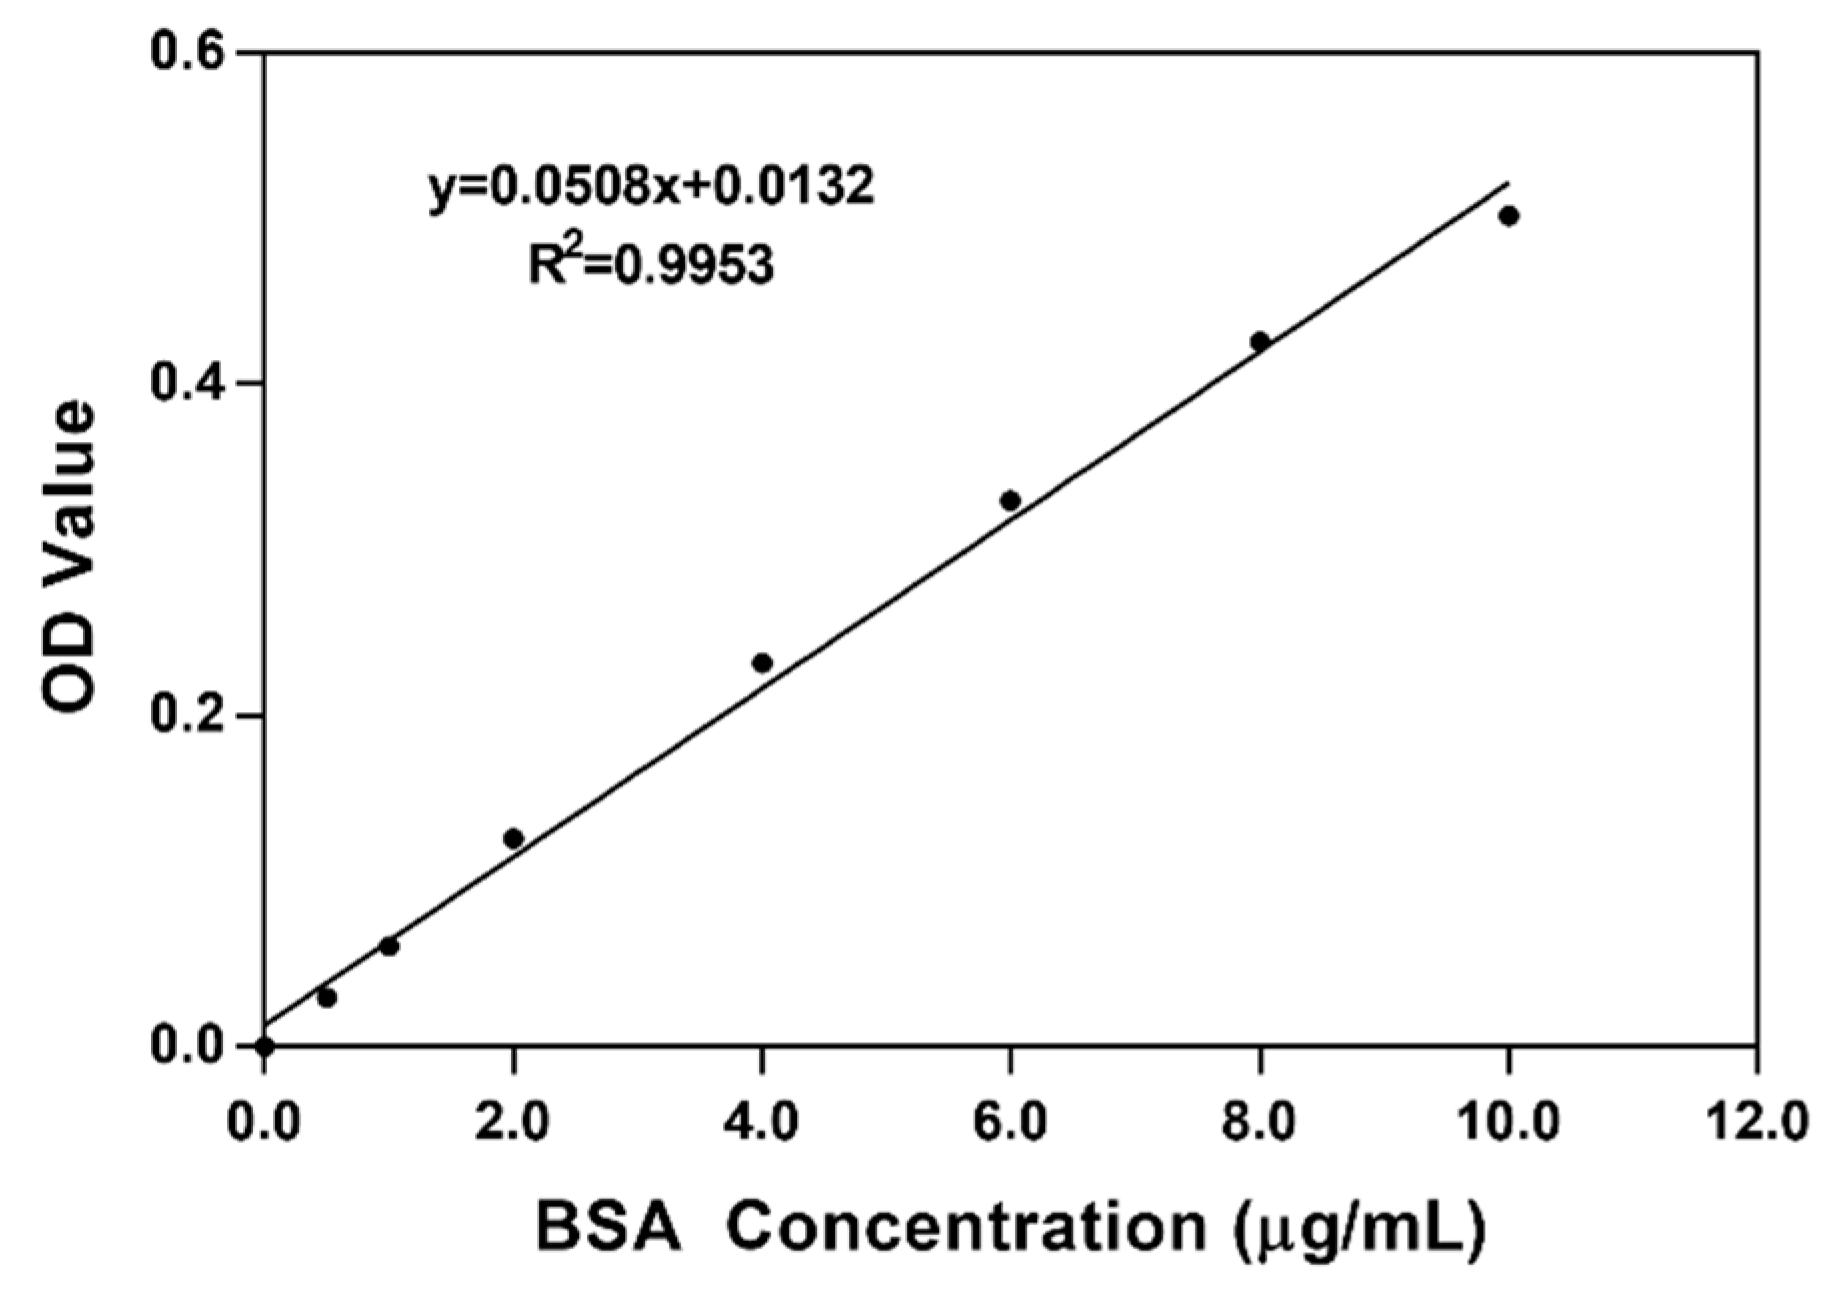
4.2.6. SDS-PAGE
4.2.7. Statistical Analysis
5. Conclusions
Author Contributions
Funding
Conflicts of Interest
References
- Haug, A.; Høstmark, A.T.; Harstad, O.M. Bovine milk in human nutrition—A review. Lipids Health Dis. 2007, 6, 1–16. [Google Scholar] [CrossRef]
- Ai, N.S.; Liu, H.L.; Wang, J.; Zhang, X.M.; Zhang, H.J.; Chen, H.T.; Sun, B.G. Triple-channel comparative analysis of volatile flavour composition in raw whole and skim milk via electronic nose, GC-MS and GC-O. Anal. Methods 2015, 7, 4278–4284. [Google Scholar] [CrossRef]
- Zhang, X.M.; Ai, N.S.; Wang, J.; Tong, L.J.; Zheng, F.P.; Sun, B.G. Lipase-catalyzed modification of the flavor profiles in recombined skim milk products by enriching the volatile components. J. Dairy Sci. 2016, 99, 8665–8679. [Google Scholar] [CrossRef]
- Tervala, T.; Tuure, T.; Kallioinen, H.; Harju, M.U.S. Low-Energy, Non-Fat Milk Beverage of High Calcium Content, and Method. U.S. Patent Application 11/884,533, 30 October 2008. [Google Scholar]
- Kaur, J.; Katopo, L.; Ashton, J.; Whitson, A.; Kasapis, S. Molecular interactions of milk protein with phenolic components in oat-based liquid formulations following UHT treatment and prolonged storage. J. Sci. Food Agric. 2017, 98, 1794–1802. [Google Scholar] [CrossRef] [PubMed]
- Sebastian, C.K.; Long, C.J.; Bohrer, B.M. Nutrient density and nutritional value of milk and plant-based milk alternatives. Int. Dairy J. 2018, 87, 84–92. [Google Scholar] [CrossRef]
- Lee, C.; Beuchat, L.R. Changes in chemical composition and sensory qualities of peanut milk fermented with lactic acid bacteria. Int. J. Food Microbiol. 1991, 13, 273–283. [Google Scholar] [CrossRef]
- Kandylis, P.; Pissaridi, K.; Bekatorou, A.; Kanellaki, M.; Koutinas, A.A. Dairy and non-dairy probiotic beverages. Curr. Opin. Food Sci. 2016, 7, 58–63. [Google Scholar] [CrossRef]
- Sudha, A.; Devi, K.S.; Sangeetha, V.; Sangeetha, A. Development of fermented millet sprout milk beverage based on physicochemical property studies and consumer acceptability data. J. Sci. Ind. Res. INDIA 2016, 75, 239–243. [Google Scholar]
- Vanga, S.K.; Singh, A.; Orsat, V.; Raghavan, V. Annex 2.5: Nutritional Comparison of Millets with Other Super Foods; McGill University: Sainte-Anne-de-Bellevue, QC, Canada, 2018. [Google Scholar]
- Nishizawa, N.; Sato, D.; Ito, Y.; Nagasawa, T.; Hatakeyama, Y.; Choi, M.R.; Wei, Y.M. Effects of dietary protein of proso millet on liver injury induced by D-galactosamine in rats. Biosci. Biotechnol. Biochem. 2002, 66, 92–96. [Google Scholar] [CrossRef] [PubMed]
- Saleh, A.S.; Zhang, Q.; Chen, J.; Shen, Q. Millet grains: Nutritional quality, processing, and potential health benefits. Compr. Rev. Food Sci. Food Saf. 2013, 12, 281–295. [Google Scholar] [CrossRef]
- Ahmadian-Kouchaksaraei, Z.; Varidi, M.; Varidi, M.J.; Pourazarang, H. Influence of processing conditions on the physicochemical and sensory properties of sesame milk: A novel nutritional beverage. Lebensm. Wiss. Technol. 2014, 57, 299–305. [Google Scholar] [CrossRef]
- Bourne, M.C. Effect of sodium alkalis and salts on pH and flavor of soymilk. J. Food Sci. 1976, 41, 62–65. [Google Scholar] [CrossRef]
- El-Adawy, T.; Rahma, E.; El-Bedawy, A.; Sobihah, T. Effect of soaking process on nutritional quality and protein solubility of some legume seeds. Nahrung 2000, 44, 339–343. [Google Scholar] [CrossRef]
- Okorie, S. Chemical composition of Artocarpus communis (Breadfruit) seed flour as affected by processing (boiling and roasting). Pak. J. Nutr. 2010, 9, 419–421. [Google Scholar] [CrossRef]
- Lee, C.; Beuchat, L.R. Chemical, physical and sensory characteristics of peanut milk as affected by processing conditions. J. Food Sci. 1992, 57, 401–405. [Google Scholar] [CrossRef]
- Yu, J.; Ahmedna, M.; Goktepe, I. Peanut protein concentrate: Production and functional properties as affected by processing. Food Chem. 2007, 103, 121–129. [Google Scholar] [CrossRef]
- Rubico, S.M.; Resurrection, A.V.A.; Beucbat, L.R. Comparison of sensory properties and headspace volatiles of a peanut beverage processed at different temperature and time conditions. J. Food Sci. 1988, 53, 176–180. [Google Scholar] [CrossRef]
- Kawada, J.; Tanaka, T.; Suzuki, M.; Shidara, H.; Kikuchi, M. The effect of heat processing and total solids on the viscosity of soymilk. In Proceedings of the 2002 Annual Meeting and Food Expo-Anaheim, Anaheim, CA, USA, 6–9 June 2002. [Google Scholar]
- Rubico, S.; Resurreccion, A.; Frank, J.; Beuchat, L. Suspension stability, texture, and color of high temperature treated peanut beverage. J. Food Sci. 2006, 52, 1676–1679. [Google Scholar] [CrossRef]
- Morales, F.J.; Majsvan, B. A study on advanced maillard reaction in heated casein/sugar solutions: Colour formation. Int. Dairy J. 1998, 7, 675–683. [Google Scholar] [CrossRef]
- Kumar, K.K.; Parvathy, P.K. Characterisation of storage protein from selected varieties of foxtail millet (Setaria italica (l) beauv). J. Sci. Food Agric. 1998, 77, 535–542. [Google Scholar] [CrossRef]
- Parameswaran, K.P.; Thayumanavan, B. Homologies between prolamins of different minor millets. Plant Foods Hum. Nutr. 1995, 48, 119–126. [Google Scholar] [CrossRef] [PubMed]
- Bravo, F.; Felipe, X.; López-Fandiño, R.; Molina, E. High-pressure treatment of milk in industrial and pilot-scale equipments: Effect of the treatment conditions on the protein distribution in different milk fractions. Eur. Food Res. Technol. 2013, 236, 499–506. [Google Scholar] [CrossRef]
- Skelteg, A. The use of “lab-on-a-chip” microfluidic SDS electrophoresis technology for the separation and quantification of milk proteins. Int. Dairy J. 2009, 19, 198–204. [Google Scholar] [CrossRef]
- Addeo, F.; Moio, L.; Chianese, L.; Stingo, C.; Resmini, P.; Berner, I. Use of plasmin to increase the sensitivity of the detection of bovine milk in ovine cheese by gel isoelectric focusing of γ2-caseins. Milchwissenschaft 1990, 45, 708–711. [Google Scholar]
- Dharmaraj, U.; Malleshi, N.G. Changes in carbohydrates, proteins and lipids of finger millet after hydrothermal processing. Lebensm. Wiss. Technol. 2011, 44, 1636–1642. [Google Scholar] [CrossRef]
- AOAC. Official Methods of Analysis; Association of Official Analytical Chemists: Washington, DC, USA, 2000. [Google Scholar]
- Rivas, J.C.M.; Dietze, M.; Zahn, S.; Schneider, Y.; Rohm, H. Diversity of sensory profiles and physicochemical characteristics of commercial hot chocolate drinks from cocoa powders and block chocolates. Eur. Food Res. Technol. 2018, 244, 1407–1414. [Google Scholar] [CrossRef]
- Cruz, A.C.; Guiné, R.P.F.; Gonçalves, J.C. Drying kinetics and product quality for convective drying of apples (cvs. golden delicious and granny smith). Int. J. Fruit Sci. 2015, 15, 54–78. [Google Scholar] [CrossRef]
- Zheng, C.H.; Gao, J.Q.; Zhang, Y.P.; Liang, W.Q. A protein delivery system: Biodegradable alginate-chitosan-poly (lactic-co-glycolic acid) composite microspheres. Biochem. Biophys. Res. Commun. 2004, 323, 1321–1327. [Google Scholar] [CrossRef]
- Laemmli, U.K. Cleavage of structural proteins during the assembly of the head of bacteriophage T4. Nature 1970, 227, 680–685. [Google Scholar] [CrossRef]
Sample Availability: Not available. |


| Treatment | Level | Protein (g/100 g) | Ash (g/100 g) | pH | Total Solids (g/100 g) |
|---|---|---|---|---|---|
| Soaking conditions (g NaHCO3/100 mL) | 0 | 3.26 ± 0.19 a | 6.65 ± 0.027 a | 6.65 ± 0.027 b | 11.17 ± 0.33 a |
| 0.5 | 3.11 ± 0.16 a | 6.79 ± 0.030 a | 6.69 ± 0.000 ab | 10.17 ± 0.44 a | |
| 1.0 | 3.20 ± 0.08 a | 6.73 ± 0.071 a | 6.73 ± 0.003 a | 11.17 ± 0.44 a | |
| Blanching time (min) | 0 | 3.26 ± 0.19 a | 6.65 ± 0.027 a | 6.65 ± 0.046 b | 11.17 ± 0.33 a |
| 15 | 3.20 ± 0.15 a | 6.50 ± 0.089 a | 6.69 ± 0.003 ab | 10.00 ± 0.29 b | |
| 30 | 3.02 ± 0.03 a | 6.58 ± 0.021 a | 6.72 ± 0.006 a | 9.33 ± 0.33 b |
| Treatment | Level | Specific Gravity | Viscosity (cP) | Precipitation Index (%) |
|---|---|---|---|---|
| Soaking conditions (g NaHCO3/100 mL) | 0 | 1.031 ± 0.0002 b | 9.03 ± 0.28 b | 2.30 ± 0.09 b |
| 0.5 | 1.033 ± 0.0003 a | 12.72 ± 1.35 a | 1.73 ± 0.04 b | |
| 1.0 | 1.034 ± 0.0003 a | 11.41 ± 0.38 ab | 5.14 ± 0.32 a | |
| Blanching time (min) | 0 | 1.031 ± 0.0002 a | 9.03 ± 0.28 a | 2.30 ± 0.09 a |
| 15 | 1.033 ± 0.0014 a | 9.10 ± 0.67 a | 2.29 ± 0.40 a | |
| 30 | 1.032 ± 0.0003 a | 9.31 ± 1.14 a | 2.43 ± 0.34 a |
| Treatment | Level | L* | a* | b* |
|---|---|---|---|---|
| Soaking conditions (g NaHCO3/100 mL) | 0 | 67.67 ± 0.32 a | 1.95 ± 0.06 a | 17.51 ± 0.13 b |
| 0.5 | 67.50 ± 0.05 a | 1.91 ± 0.08 a | 17.83 ± 0.02 a | |
| 1.0 | 67.03 ± 0.08 a | 1.82 ± 0.01 a | 17.37 ± 0.01 b | |
| Blanching time (min) | 0 | 67.67 ± 0.32 a | 1.95 ± 0.06 a | 17.51 ± 0.13 a |
| 15 | 67.78 ± 0.04 a | 1.86 ± 0.009 a | 17.18 ± 0.02 b | |
| 30 | 67.84 ± 0.04 a | 1.87 ± 0.007 a | 17.31 ± 0.04 ab |
© 2019 by the authors. Licensee MDPI, Basel, Switzerland. This article is an open access article distributed under the terms and conditions of the Creative Commons Attribution (CC BY) license (http://creativecommons.org/licenses/by/4.0/).
Share and Cite
Pan, M.; Cao, Y.; Chi, X.; Song, Z.; Ai, N.; Sun, B. Influence of Processing Conditions on the Physicochemical Properties of a New-Type of Nutritional Drink—Millet Skim Milk Beverage. Molecules 2019, 24, 1338. https://doi.org/10.3390/molecules24071338
Pan M, Cao Y, Chi X, Song Z, Ai N, Sun B. Influence of Processing Conditions on the Physicochemical Properties of a New-Type of Nutritional Drink—Millet Skim Milk Beverage. Molecules. 2019; 24(7):1338. https://doi.org/10.3390/molecules24071338
Chicago/Turabian StylePan, Minghui, Yungang Cao, Xuelu Chi, Zheng Song, Nasi Ai, and Baoguo Sun. 2019. "Influence of Processing Conditions on the Physicochemical Properties of a New-Type of Nutritional Drink—Millet Skim Milk Beverage" Molecules 24, no. 7: 1338. https://doi.org/10.3390/molecules24071338
APA StylePan, M., Cao, Y., Chi, X., Song, Z., Ai, N., & Sun, B. (2019). Influence of Processing Conditions on the Physicochemical Properties of a New-Type of Nutritional Drink—Millet Skim Milk Beverage. Molecules, 24(7), 1338. https://doi.org/10.3390/molecules24071338