Article

Three Output Membrane Hydrocyclone: Classification and Filtration

Department of Chemical and Materials Engineering, Tamkang University, 151 Ying-chuan Road, Tamsui, Taipei 25137, Taiwan
*
Author to whom correspondence should be addressed.
Molecules 2019, 24(6), 1116; https://doi.org/10.3390/molecules24061116
Submission received: 5 March 2019 / Accepted: 19 March 2019 / Published: 21 March 2019
(This article belongs to the Special Issue Sustainability in Membrane Production and Membrane Operations)

Abstract

:
In this study, through simulation and experimental verification, we proposed a novel hydrocyclone in which a tubular ceramic membrane passed through the overflow outlet to the underflow outlet. The centers of overflow and underflow outlets were tubular membranes equipped with an exit of outside-in filtration, and the overflow the underflow outlets were shaped into annular (donut shape) exits. Thus, this novel hydrocyclone has three outlets, namely the overflow dilute liquid, the underflow concentrated liquid, and clear filtrate. This system enabled higher dilution of hydrocyclone overflow concentration than that in the traditional system. Furthermore, underflow was more concentrated, and we obtained a clear filtrate. Therefore, this device can simultaneously perform classification and filtration, which is valuable for special liquid recycling. For instance, in wafer cutting fluid recovery in solar energy processes, the fluid with more silicon can function as the overflow, the fluid with more silicon carbide can function as the underflow, and the polyethylene glycol (PEG) organic solvent can function as the clear filtrate.

Graphical Abstract

1. Introduction

Among the classifying equipment [1,2] currently available, hydrocyclones are one of the most popular pieces of equipment [3,4,5] and can be applied in minering [6] and bio-engineering [7,8] processes and slurry treatment [9] (an emerging field). Based on previous studies, hydrocyclones have proven to be universal devices with various advantages such as its compact size, no moving parts, simple and inexpensive manufacturing, and minimal maintenance.
In the past, several attempts have been made to design hydrocyclones with different structures and changing fluid characteristics, with special emphasis on the development of high separation efficiency hydrocyclones. For example, Yoshida et al. [10] developed an electric field-assisted cyclone capable of removing ultrafine particles (0.3 μm) with enhanced efficiency. Hwang and Chou [11] designed a vortex finder structure for improving hydrocyclone particle separation efficiency. Vieira et al. [12,13] proposed a filtering hydrocyclone, in which the conical portion was replaced by the filter material, which enhanced classification efficiency. Because of advances in computing technology [14], computational fluid dynamics (CFD) is being increasingly used in multiphase flow fields [11,15,16,17,18]. Hydrocyclone separator flow pattern complexity, changing hydrocyclone air core patterns, and unsteady flow have been discussed in previous studies. Large-eddy simulation (LES) has been used to simulate cyclone swirls [19,20,21]. LES is a dynamic simulation, and under the same structure and size, LES requires finer grid than any other simulation model. As long as the grid is sufficiently fine, the disturbance within the hydrocyclone flow field coordination can be clearly calculated through LES. Slack et al. [22] used LES to simulate cyclones and observed excellent velocity prediction. The LES turbulence model is an extension of the multiphase flow CFD model that includes the stream of hydrocyclone particles; this model may be a very effective tool to study the effect of the structure size on separation. Most importantly, the hydrocyclones that are replaced by various structures and sizes can be promptly examined. Today, not only does the overall behavior of the flow pattern inside the hydrocyclone prompt the universal application of the technology, but so do many numerical, CFD calculation, and experimental verification research [23,24,25]. Furthermore, the particle–fluid interaction force has been studied [26]. Relatively fewer studies have mentioned the effect of particle concentration. Two fluid numerical simulation models developed recently have shown the influence of particle concentration on hydrocyclone size; in smaller hydrocyclones, more fine particles flow out from the underflow, whereas in larger hydrocyclones, more coarse particles flow out from the overflow [15]. Velocity profiles demonstrated that the turbulence intensity in the vicinity of the air core and in the hydrocyclone inner wall was the highest and those in other locations were diminished [27]. At the spiral flow area under the overflow pipe, the radial pressure gradient, pressure disturbances, as well as the relative pressure disturbance were considerable. That is, the energy loss and turbulent energy dissipation in this region is severe [28]. Thus, controlling the central region of the hydrocyclone or controlling the turbulent structure at the spiral flow area is a highly effective method to improve performance [29].
Membrane filtration and centrifugal driving force have been demonstrated as efficient separation techniques to obtain valuable materials [30,31]. Thus, in this study, we inserted a tubular ceramic membrane in the central region of the hydrocyclone to offset the air core and change the turbulence structure for enhancing separation efficiency; when the tubular membrane was used, this hydrocyclone had one inlet and three outlets [32]. The three outlets are overflow, underflow, and filtrate, which satisfy classification and filtration requirements. The numerical solution can be implemented using commercial CFD FLUENT 6.1 software. The previously mentioned LES model implements turbulence simulation. After the flow field within the hydrocyclone was solved, the motion of the particle flow was tracked using the discrete phase model (DPM) in a Lagrangian reference frame. The CFD method can predict hydrocyclone performance under various operating conditions, and this has been confirmed in the literature [20,33,34]. In addition, the tubular membrane was compared by replacing it with a solid cylindrical tube. Traditional hydrocyclone is labeled THC; the hydrocyclone in which a solid cylinder is inserted in the center is labeled SHC; and the hydrocyclone with a tubular ceramic membrane inserted in the center is labeled MHC.

2. Results and Discussion

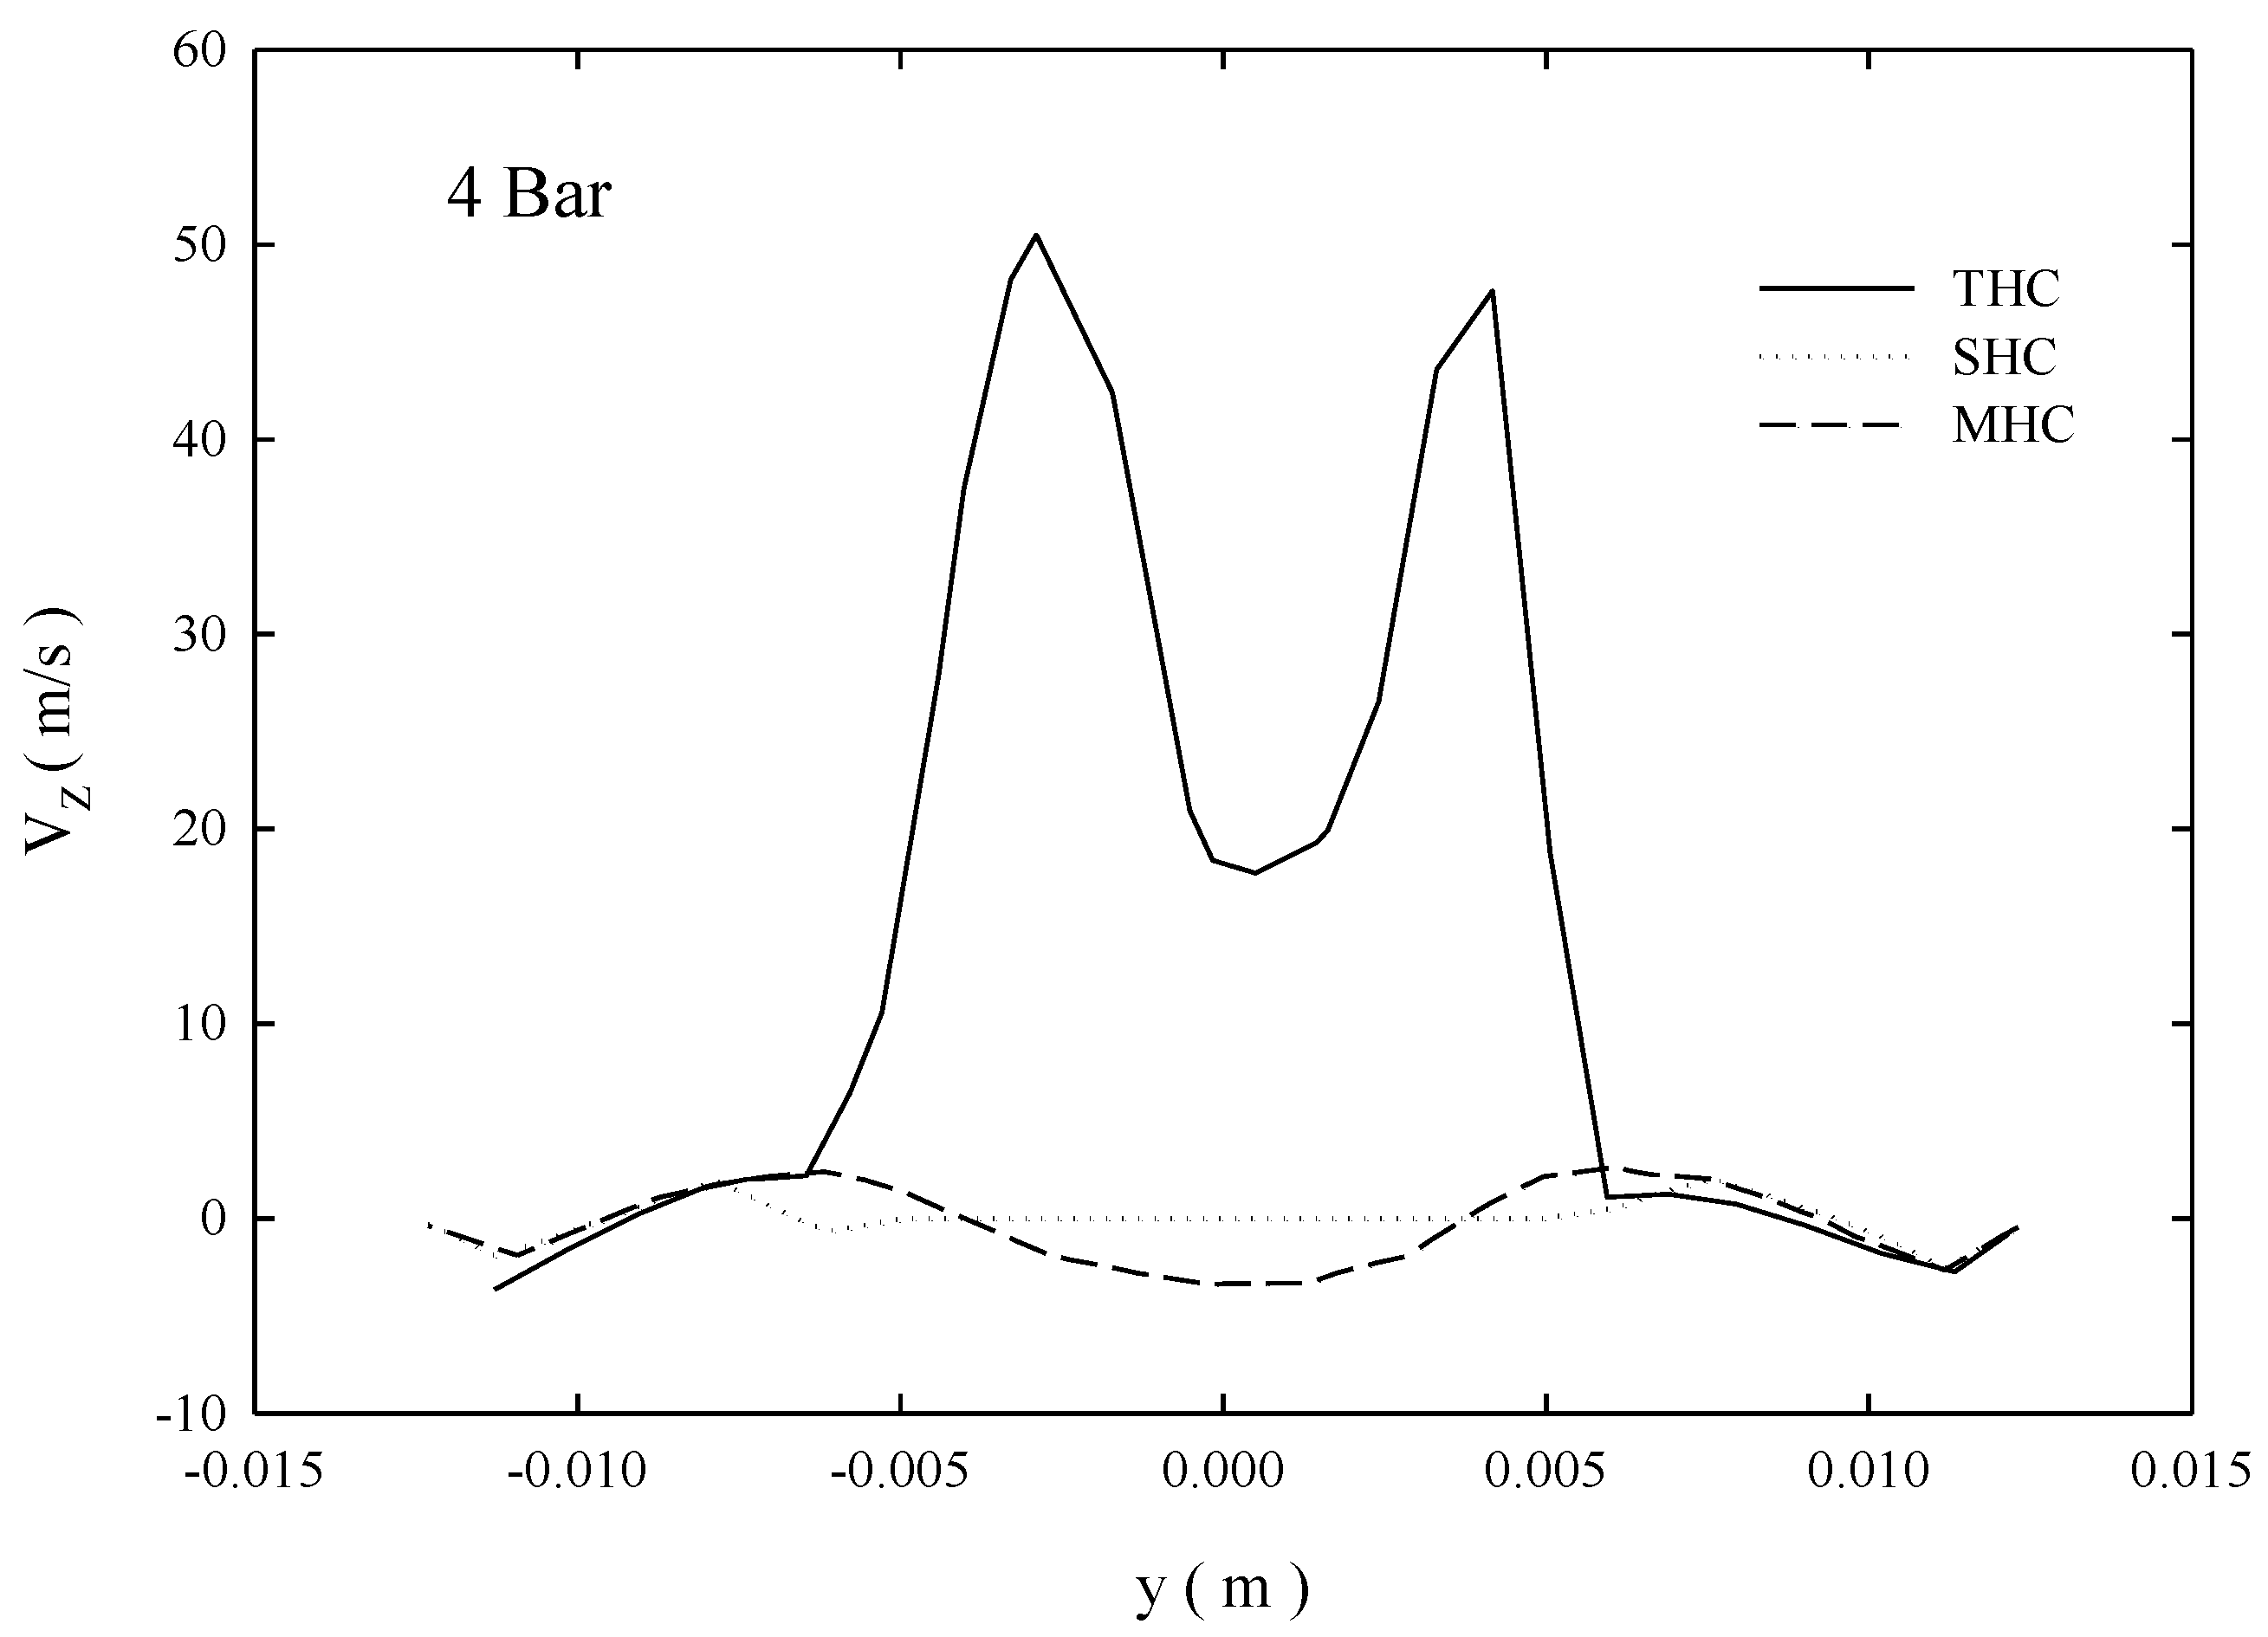
2.1. Volume Fraction of Air and Velocity Distribution

Many studies have indicated that the central air core and the adjacent part of the flow are a forced vortex [28]; the main vortex turbulence energy consumption within the vortex occurs because of energy transfer and friction losses. When the diameter of the overflow increases, the diameter of air core increases, therefore, large eddy crushing devices [29] can reduce energy loss. Between the inner wall of the hydrocyclone and the overflow pipe, more than one area exists at which the direction of the fluid motion is reversed [35]. The maximum tangential direction speed is usually located inside the diameter position of the overflow pipe.
Figure 1 depicts an overtime air core development chart of the three hydrocyclone patterns in this study. From the chart SHC, because of a solid cylinder, the amount of air volume should be minimal. However, some air still exists around the solid cylinder, which results in an overall maximum diameter of the air core. The THC air core is relatively unstable compared to the MHC air core. Therefore, MHC should be able to offset turbulent energy consumption of the central air core.
Figure 2 depicts an XY plane below the overflow pipe bottom (z = 0.125 m, the position of the overflow entrance) and the distribution liquid volume in the radial direction. The diameter of the air core was approximately 14–15 mm. SHC and MHC centers contain a metal tube and a ceramic tubular membrane to block the original air core area. However, an air core is still generated. In addition, the MHC air core was in the range between 6 and −6 mm. Our inference from the figure was that when the MHC performed outside-in filtration, it functioned not only as a simple cross-flow filtration but also as a doping sweep gas–liquid filtration. As a result, the filtration rate was enhanced. In the future, this filtration should be studied further.
Figure 3 depicts the Z-axis speed distribution of the XY plane below the overflow pipe bottom (z = 0.125 m). The figure shows that the flow rate of the THC at the air core region was considerably higher than those of SHC and MHC. Cilliers and Harrison [36] indicated that reducing the flow vicinity of the overflow outlet reduced the short circuit flow. Because the central location of the tubular ceramic membrane can offset turbulence energy consumption, MHC should be able to reduce the short circuit flow.

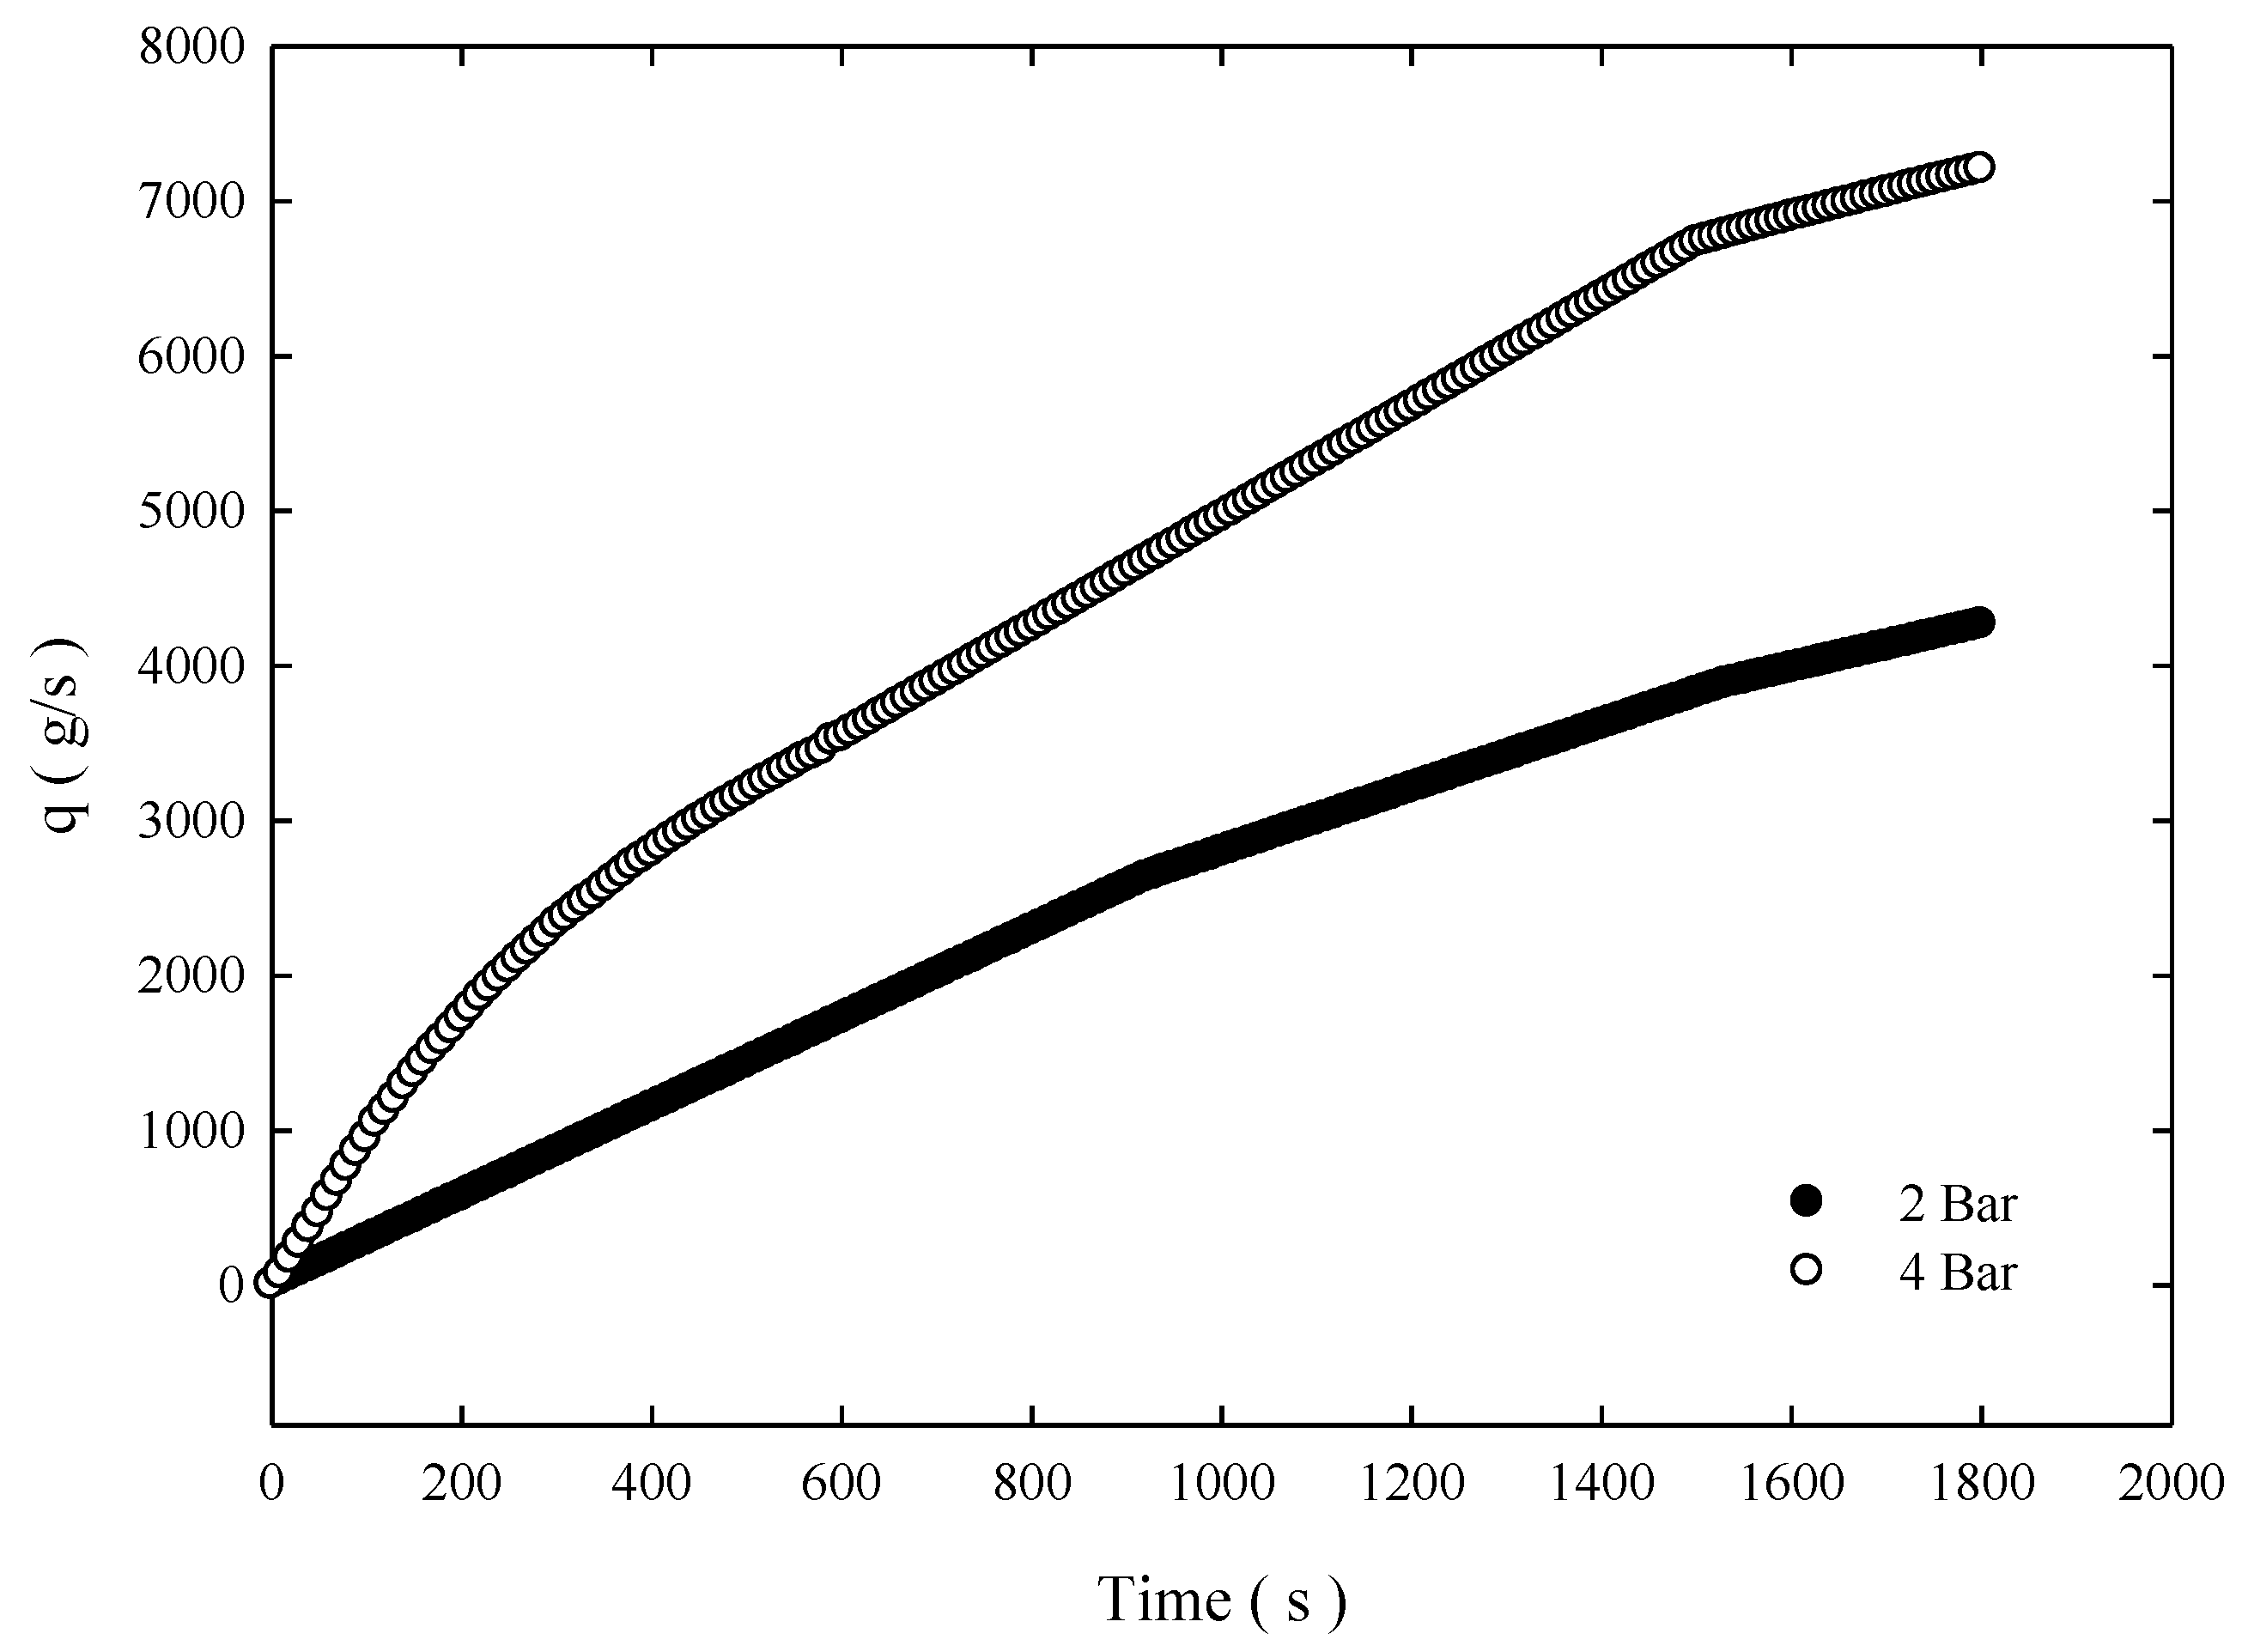
2.2. The Concentration and the Filtering Effect of the MHC

MHC is effective in filtration. Figure 4 depicts the filtration rate of MHC at various pressures. The average filtrate can be obtained at approximately 400–450 L/m2-h-bar. Because of the MHC material’s effect of reducing turbulent flow and filtering, the concentration difference between overflow and underflow is the largest and benefits the subsequent drying process. As presented in Table 1, the raw material concentration was 0.35%. For THC, the concentrations from overflow and underflow were 0.30% and 0.42%, respectively; For SHC, the concentrations from overflow and underflow were 0.24% and 0.59%, respectively; however, by using MHC, the concentrations from overflow and underflow were 0.21% and 1.31%, respectively.

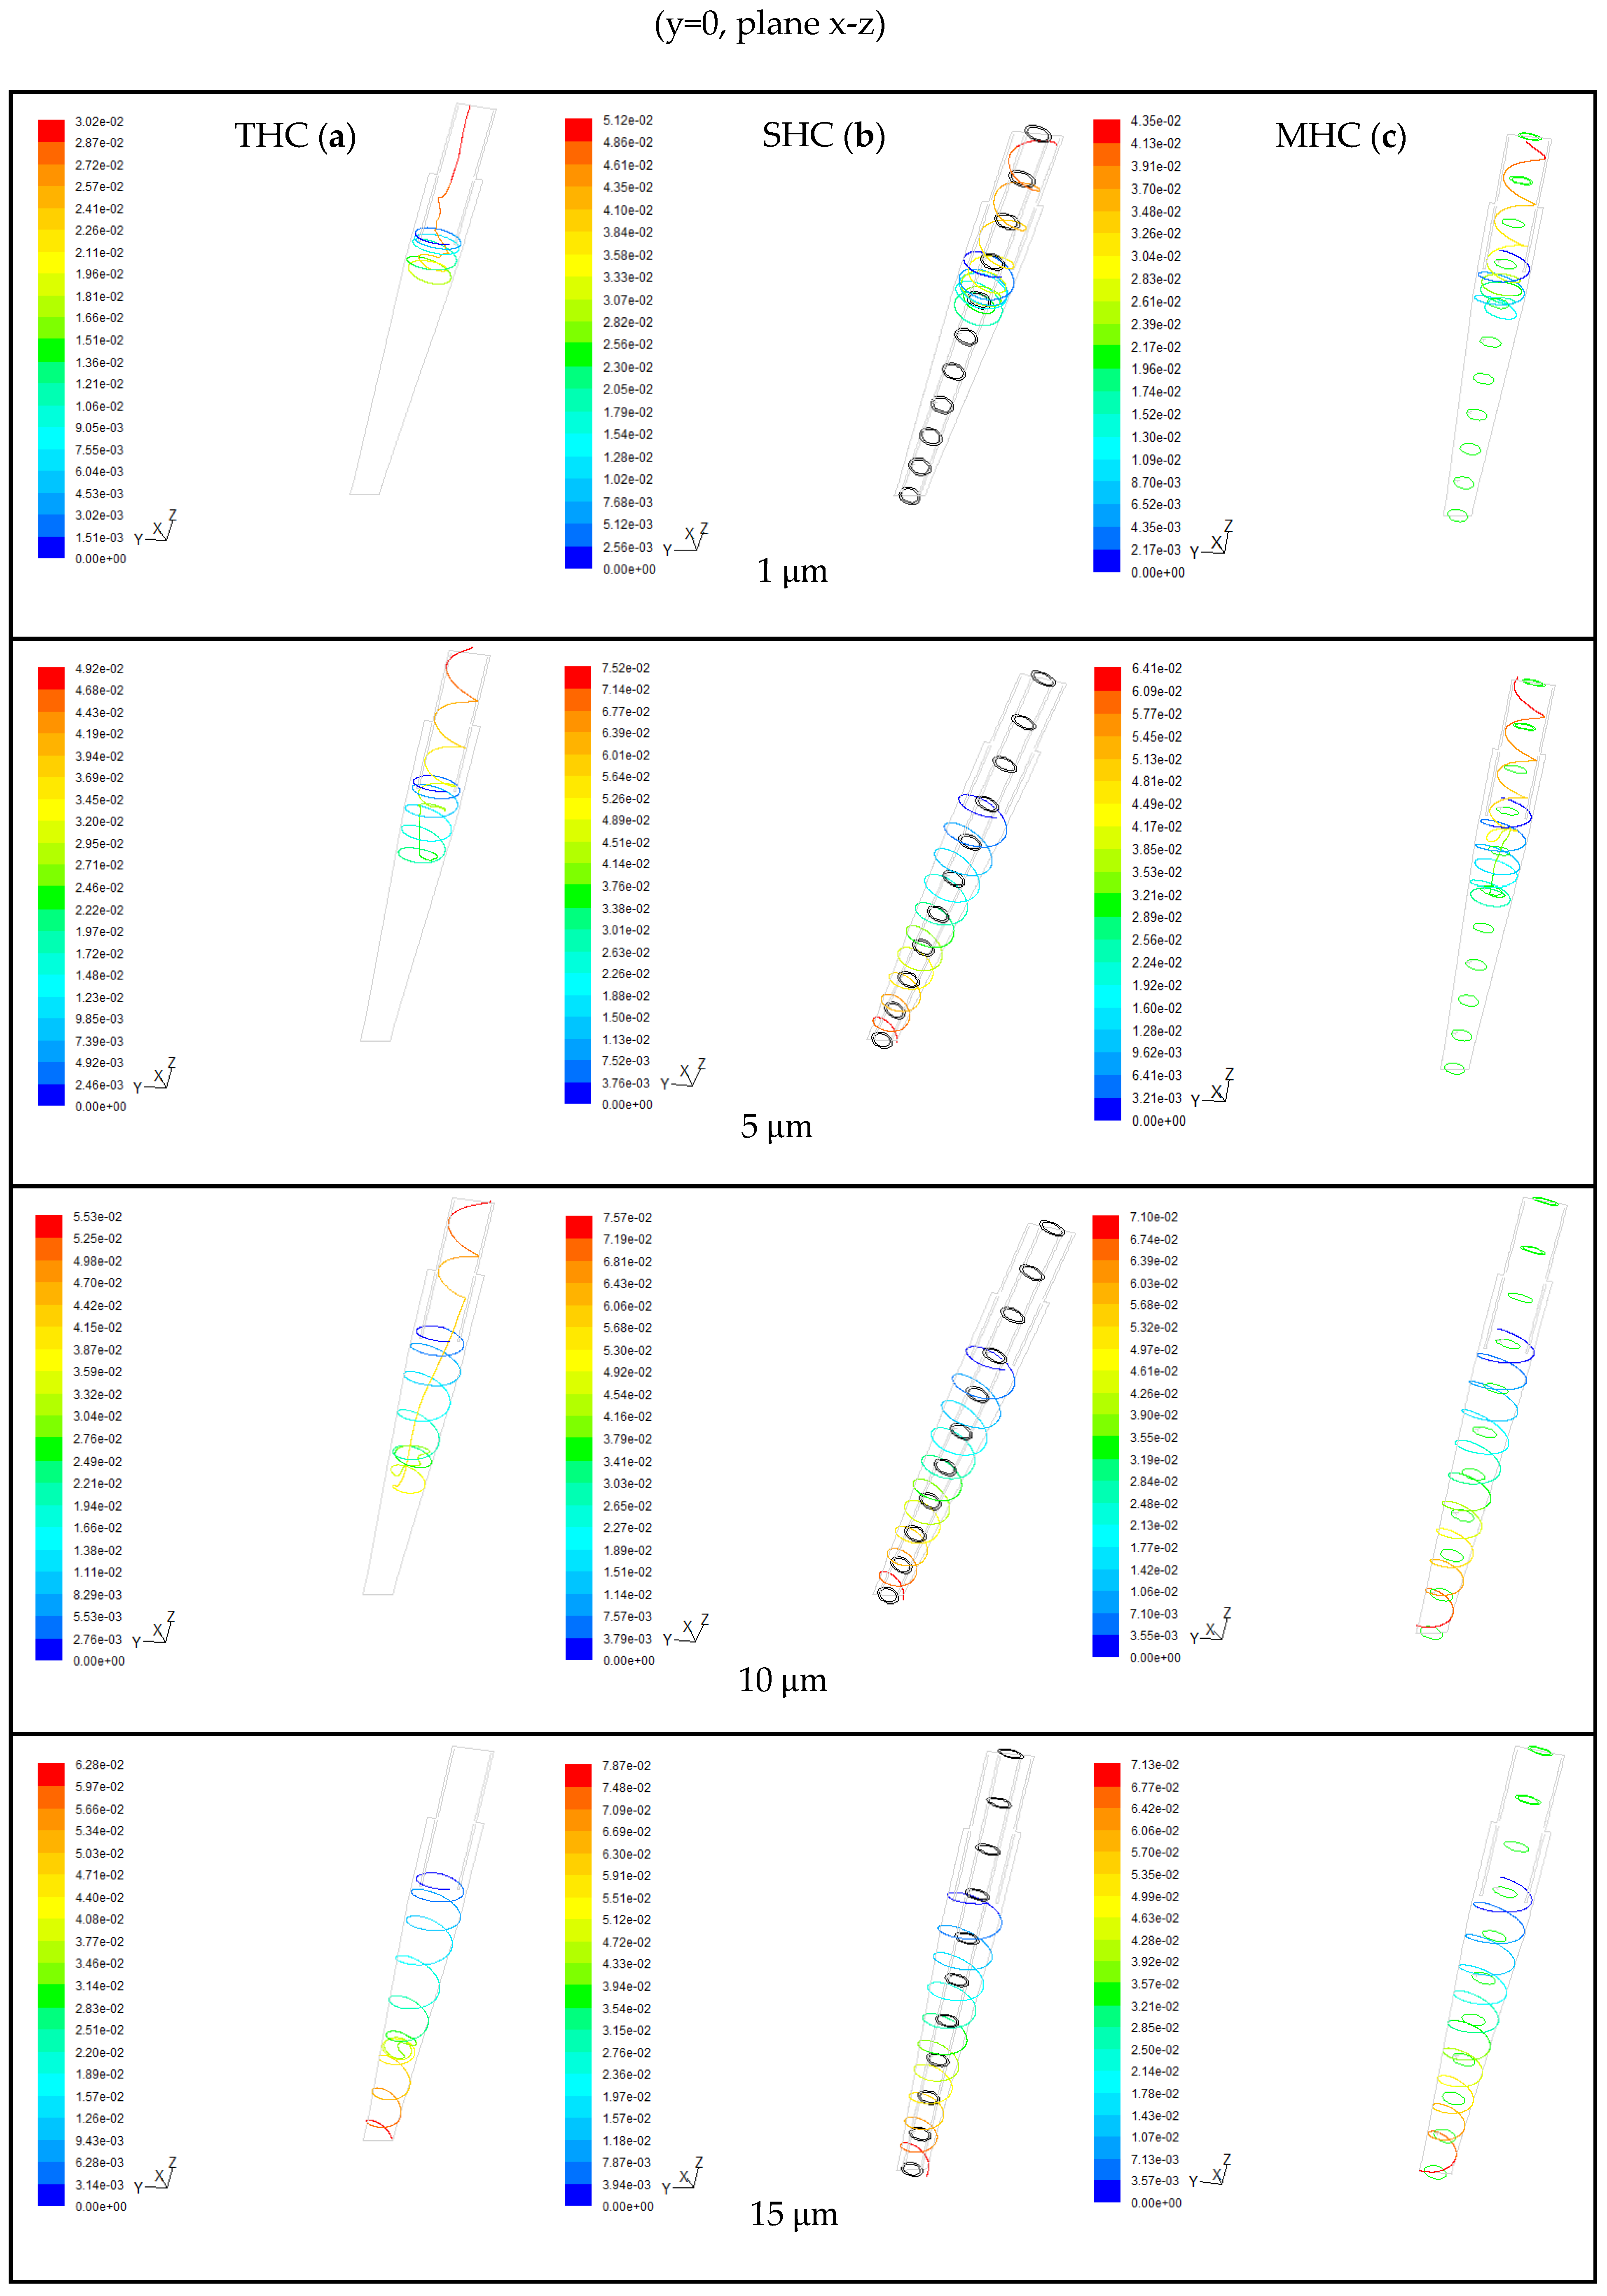
2.3. Particle Trajectories

To further understand the particle trajectory in the hydrocyclone, particularly when the particles are released in the vicinity of the overflow, and to determine whether they ultimately left from overflow or underflow, Figure 5 presents the six release positions of the particles in the study. The horizontal position shows intermediate (X = ±0.0115 m) between the water cyclone overflow tube and the wall. The vertical position shows Z = 0.135, 0.145, 0.155 m. The particle density was set to 3200 kg/m3, and the particle sizes were set separately at 1, 5, 10, and 15 μm. According to the simulation result, position 3 of the particle track was slightly different, and those at other positions were similar. Thus, Figure 6 presents the particle trajectory of THC, SHC, and MHC at position 3. For THC, particles of 1, 5, and 10 μm flowed to the overflow outlet, and only 15 μm particles flowed to underflow, which indicates short circuit flow at position 3. Figure 7 indicates that the d50 for the three hydrocyclones is 8.5 μm. For SHC, only 1 μm particles exited from the overflow. This can be attributed to the solid cylinder inside the hydrocyclone, which causes boundary layer variance. For MHC, particles larger than 10 μm flowed to the underflow.

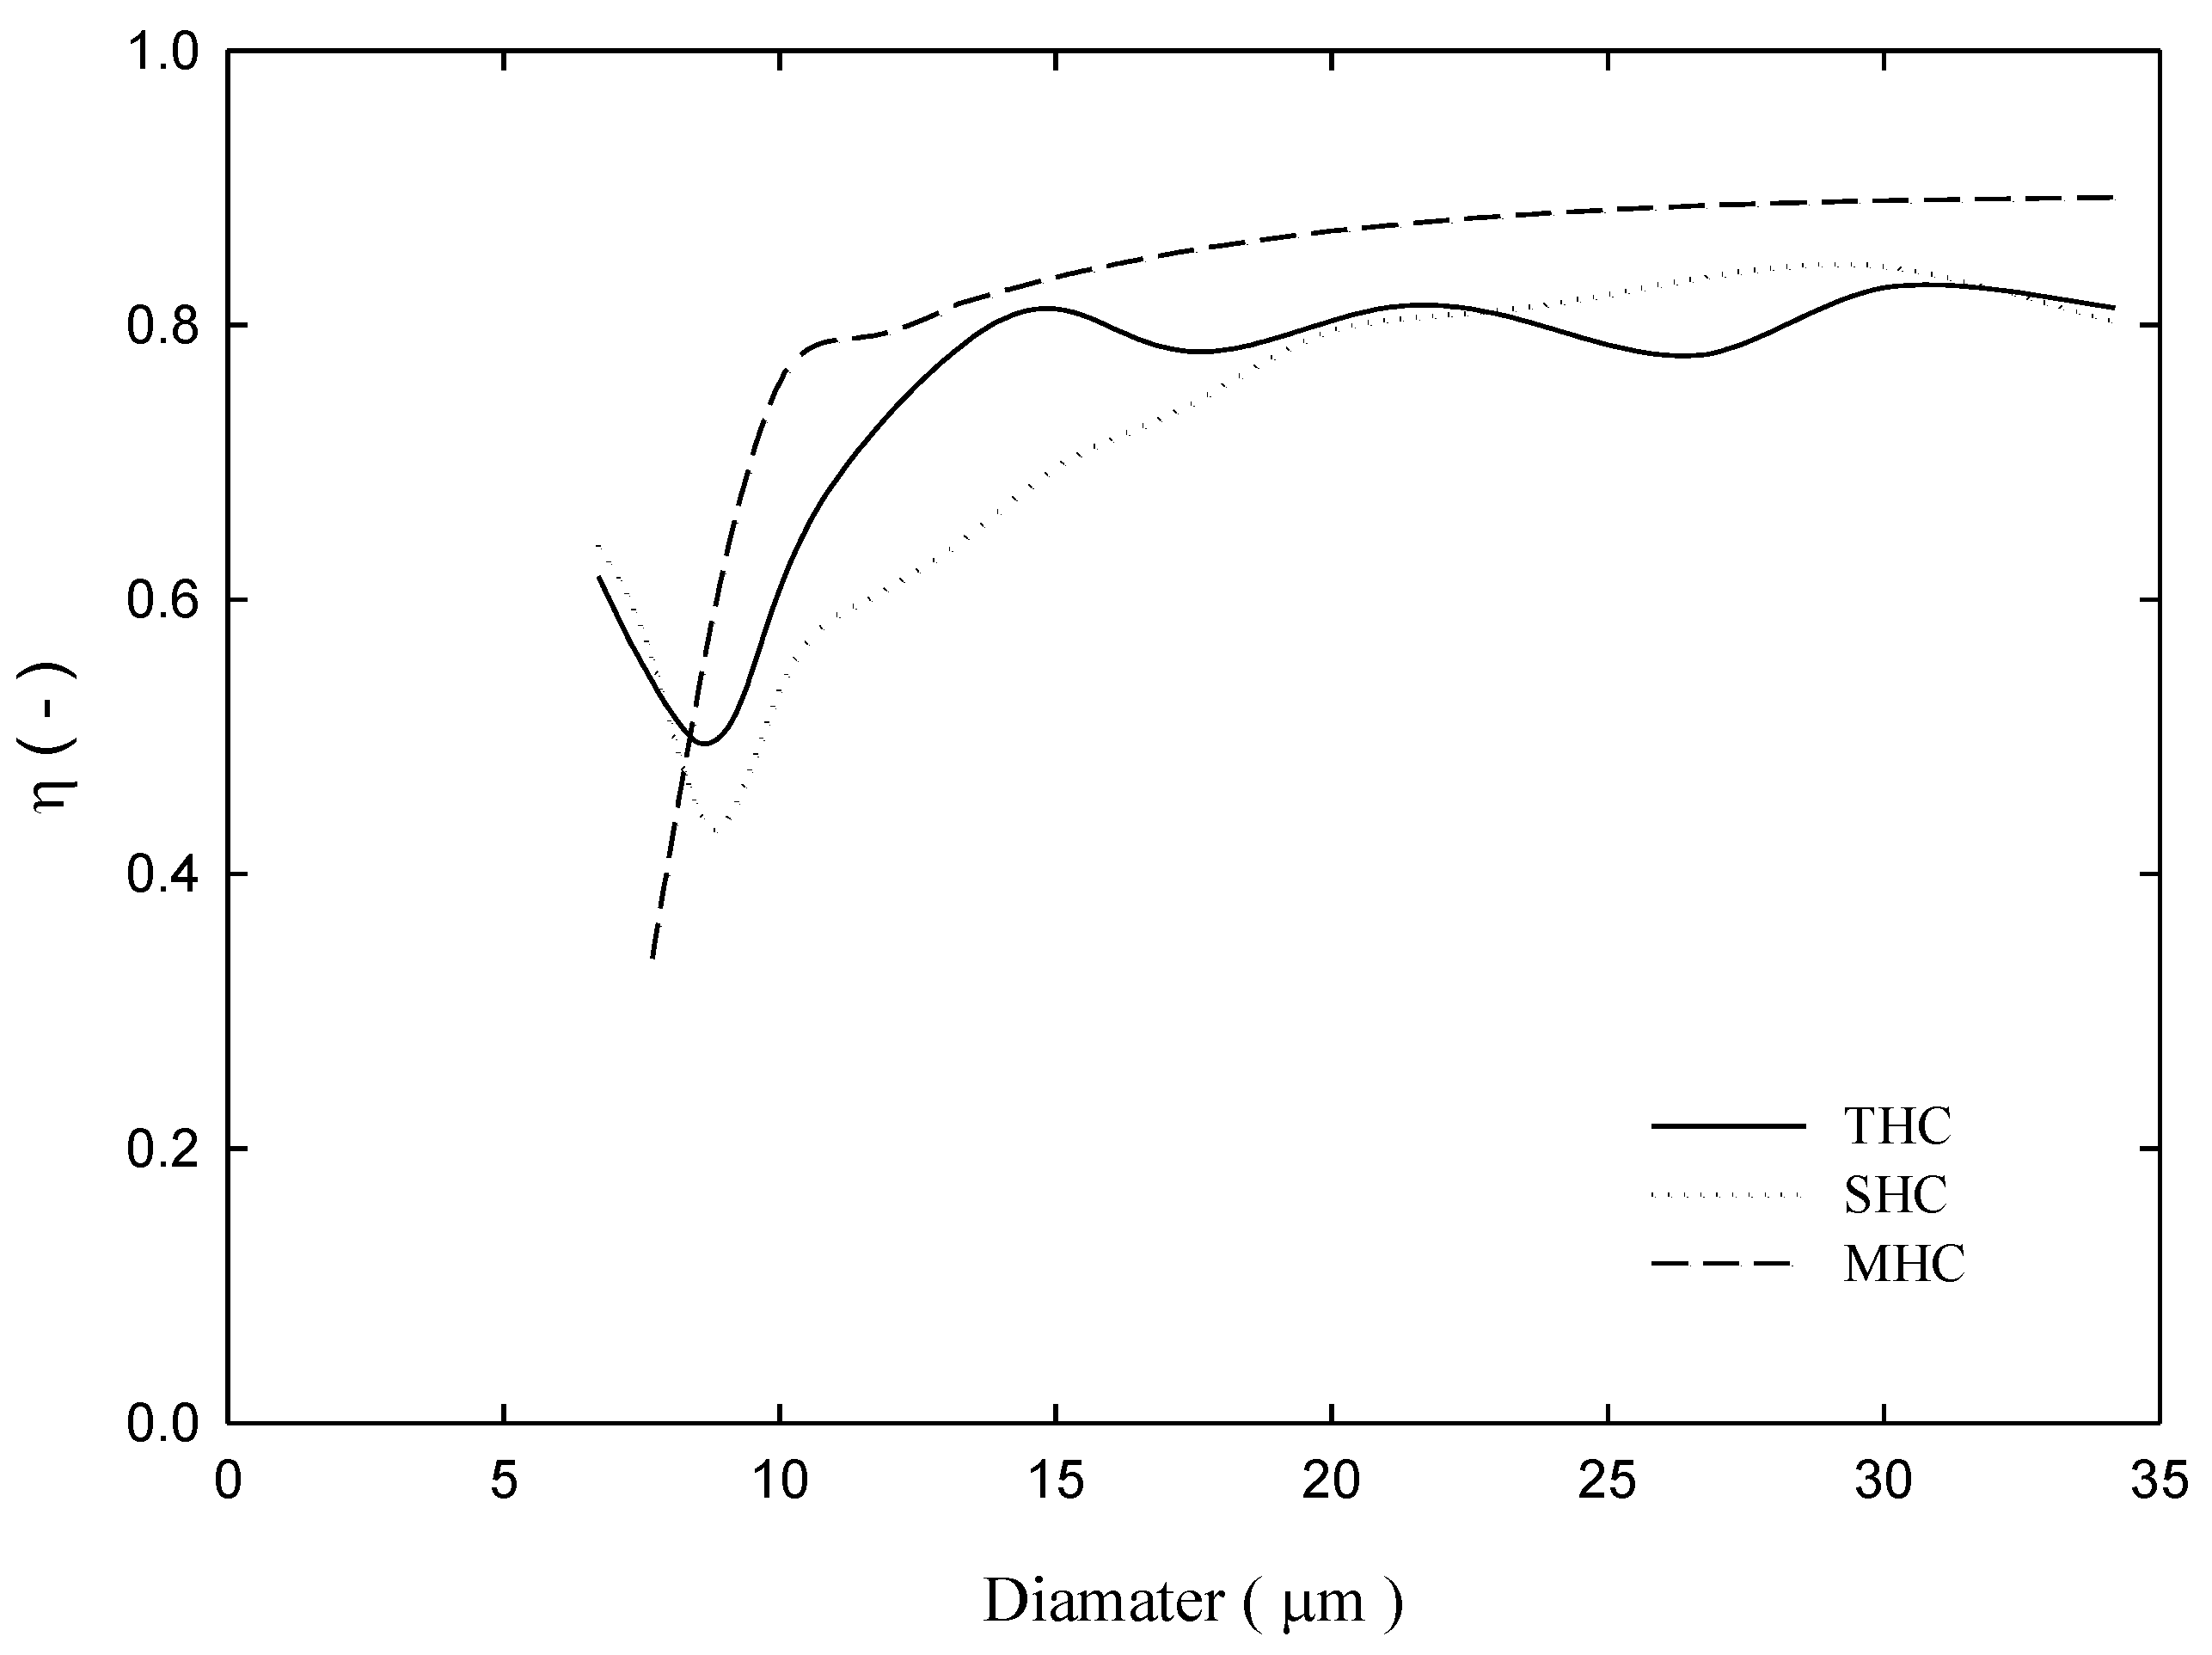
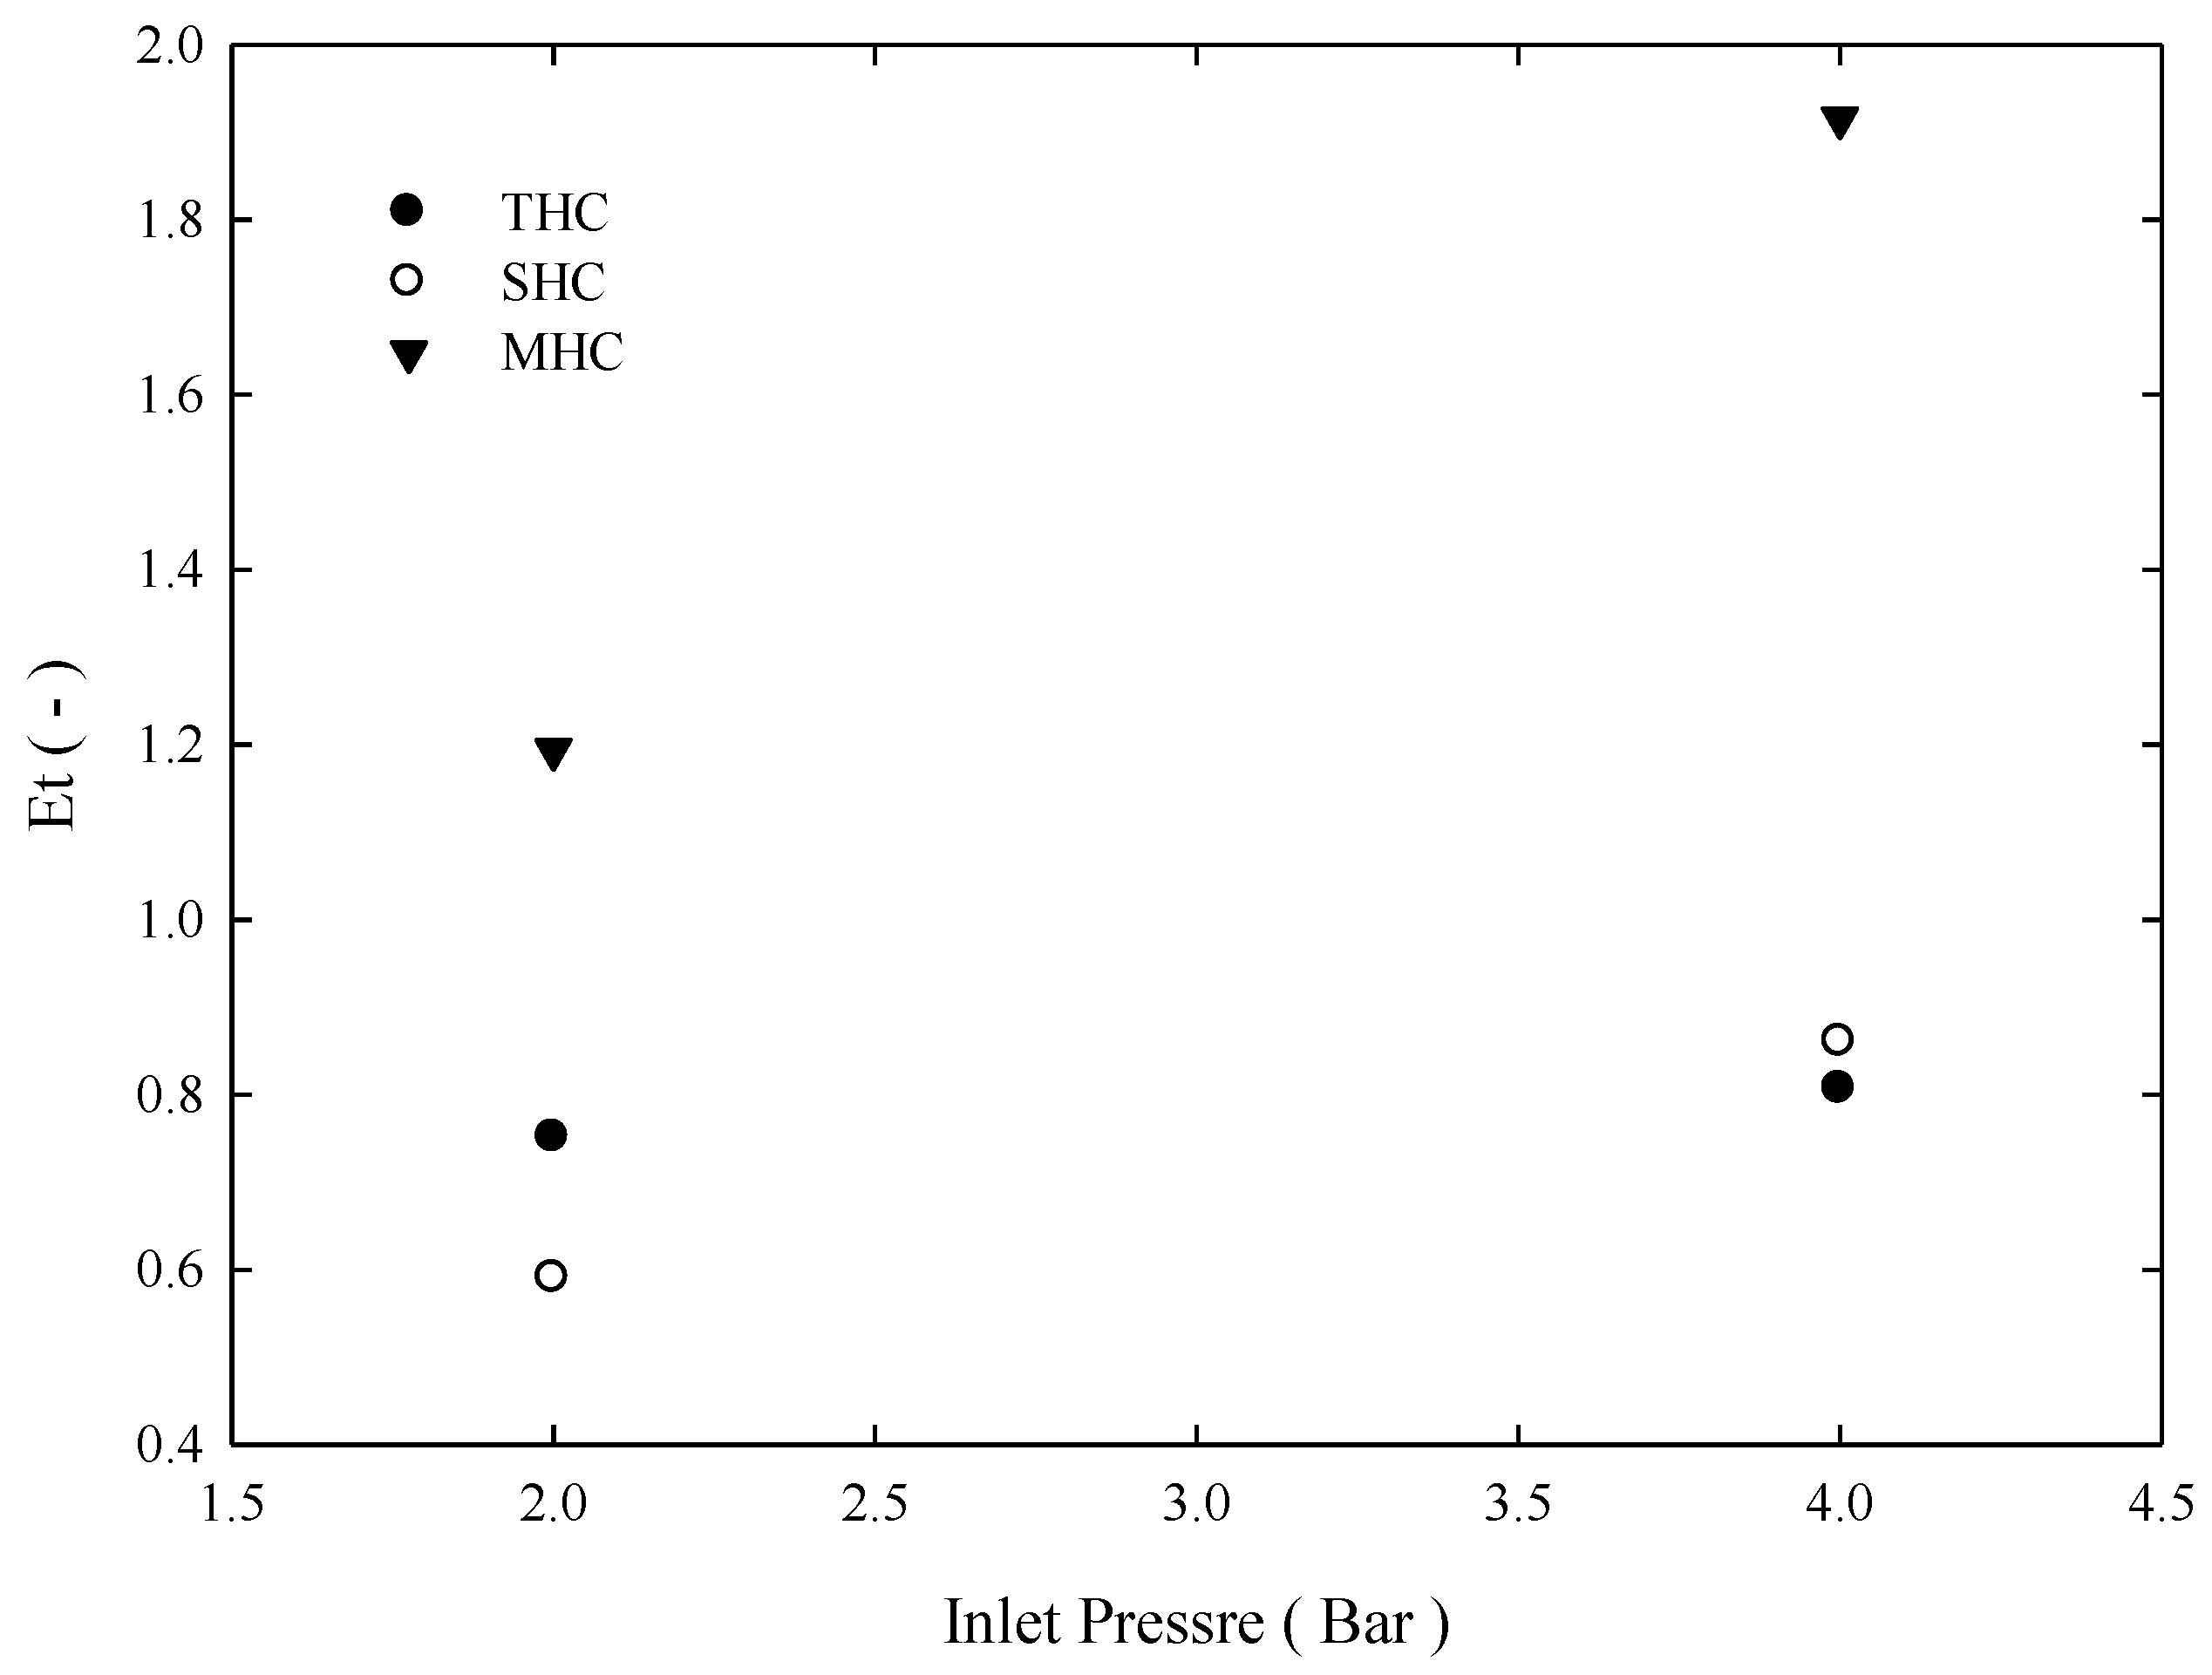
2.4. Classification Efficiency

The classification efficiency curve is the rate of a particle of a certain size flowing from the feeding inlet of the hydrocyclone and leaving from underflow of the hydrocyclone. Figure 7 depicts the classification efficiency curve of the three separators under the 4-bar operation. Under the same feeding conditions, although three hydrocyclones d50 values were approximately 8.5 μm, the result indicates that a fish hook effect occurs in SHCs and THCs, which indicates that placing a solid cylinder cannot effectively solve the fish hook effect problem. However, for MHCs, the membrane’s permeability eliminates excessive turbulence. Thus, the fish hook effect does not occur and effective separation is obtained. Approximately 80% of >10 μm particles flow out from the underflow outlet. As for THC and SHC, 80% particles flowing from the underflow are approximately larger than 15 and 20 μm. Overall separation efficiency was E t = ( Q u C u ) / ( Q f C f ) , and we can see from Figure 8 that irrespective of 4 or 2 bar pressure, the overall separation efficiency of MHC was considerably higher than the other two hydrocyclones.

3. Materials and Methods
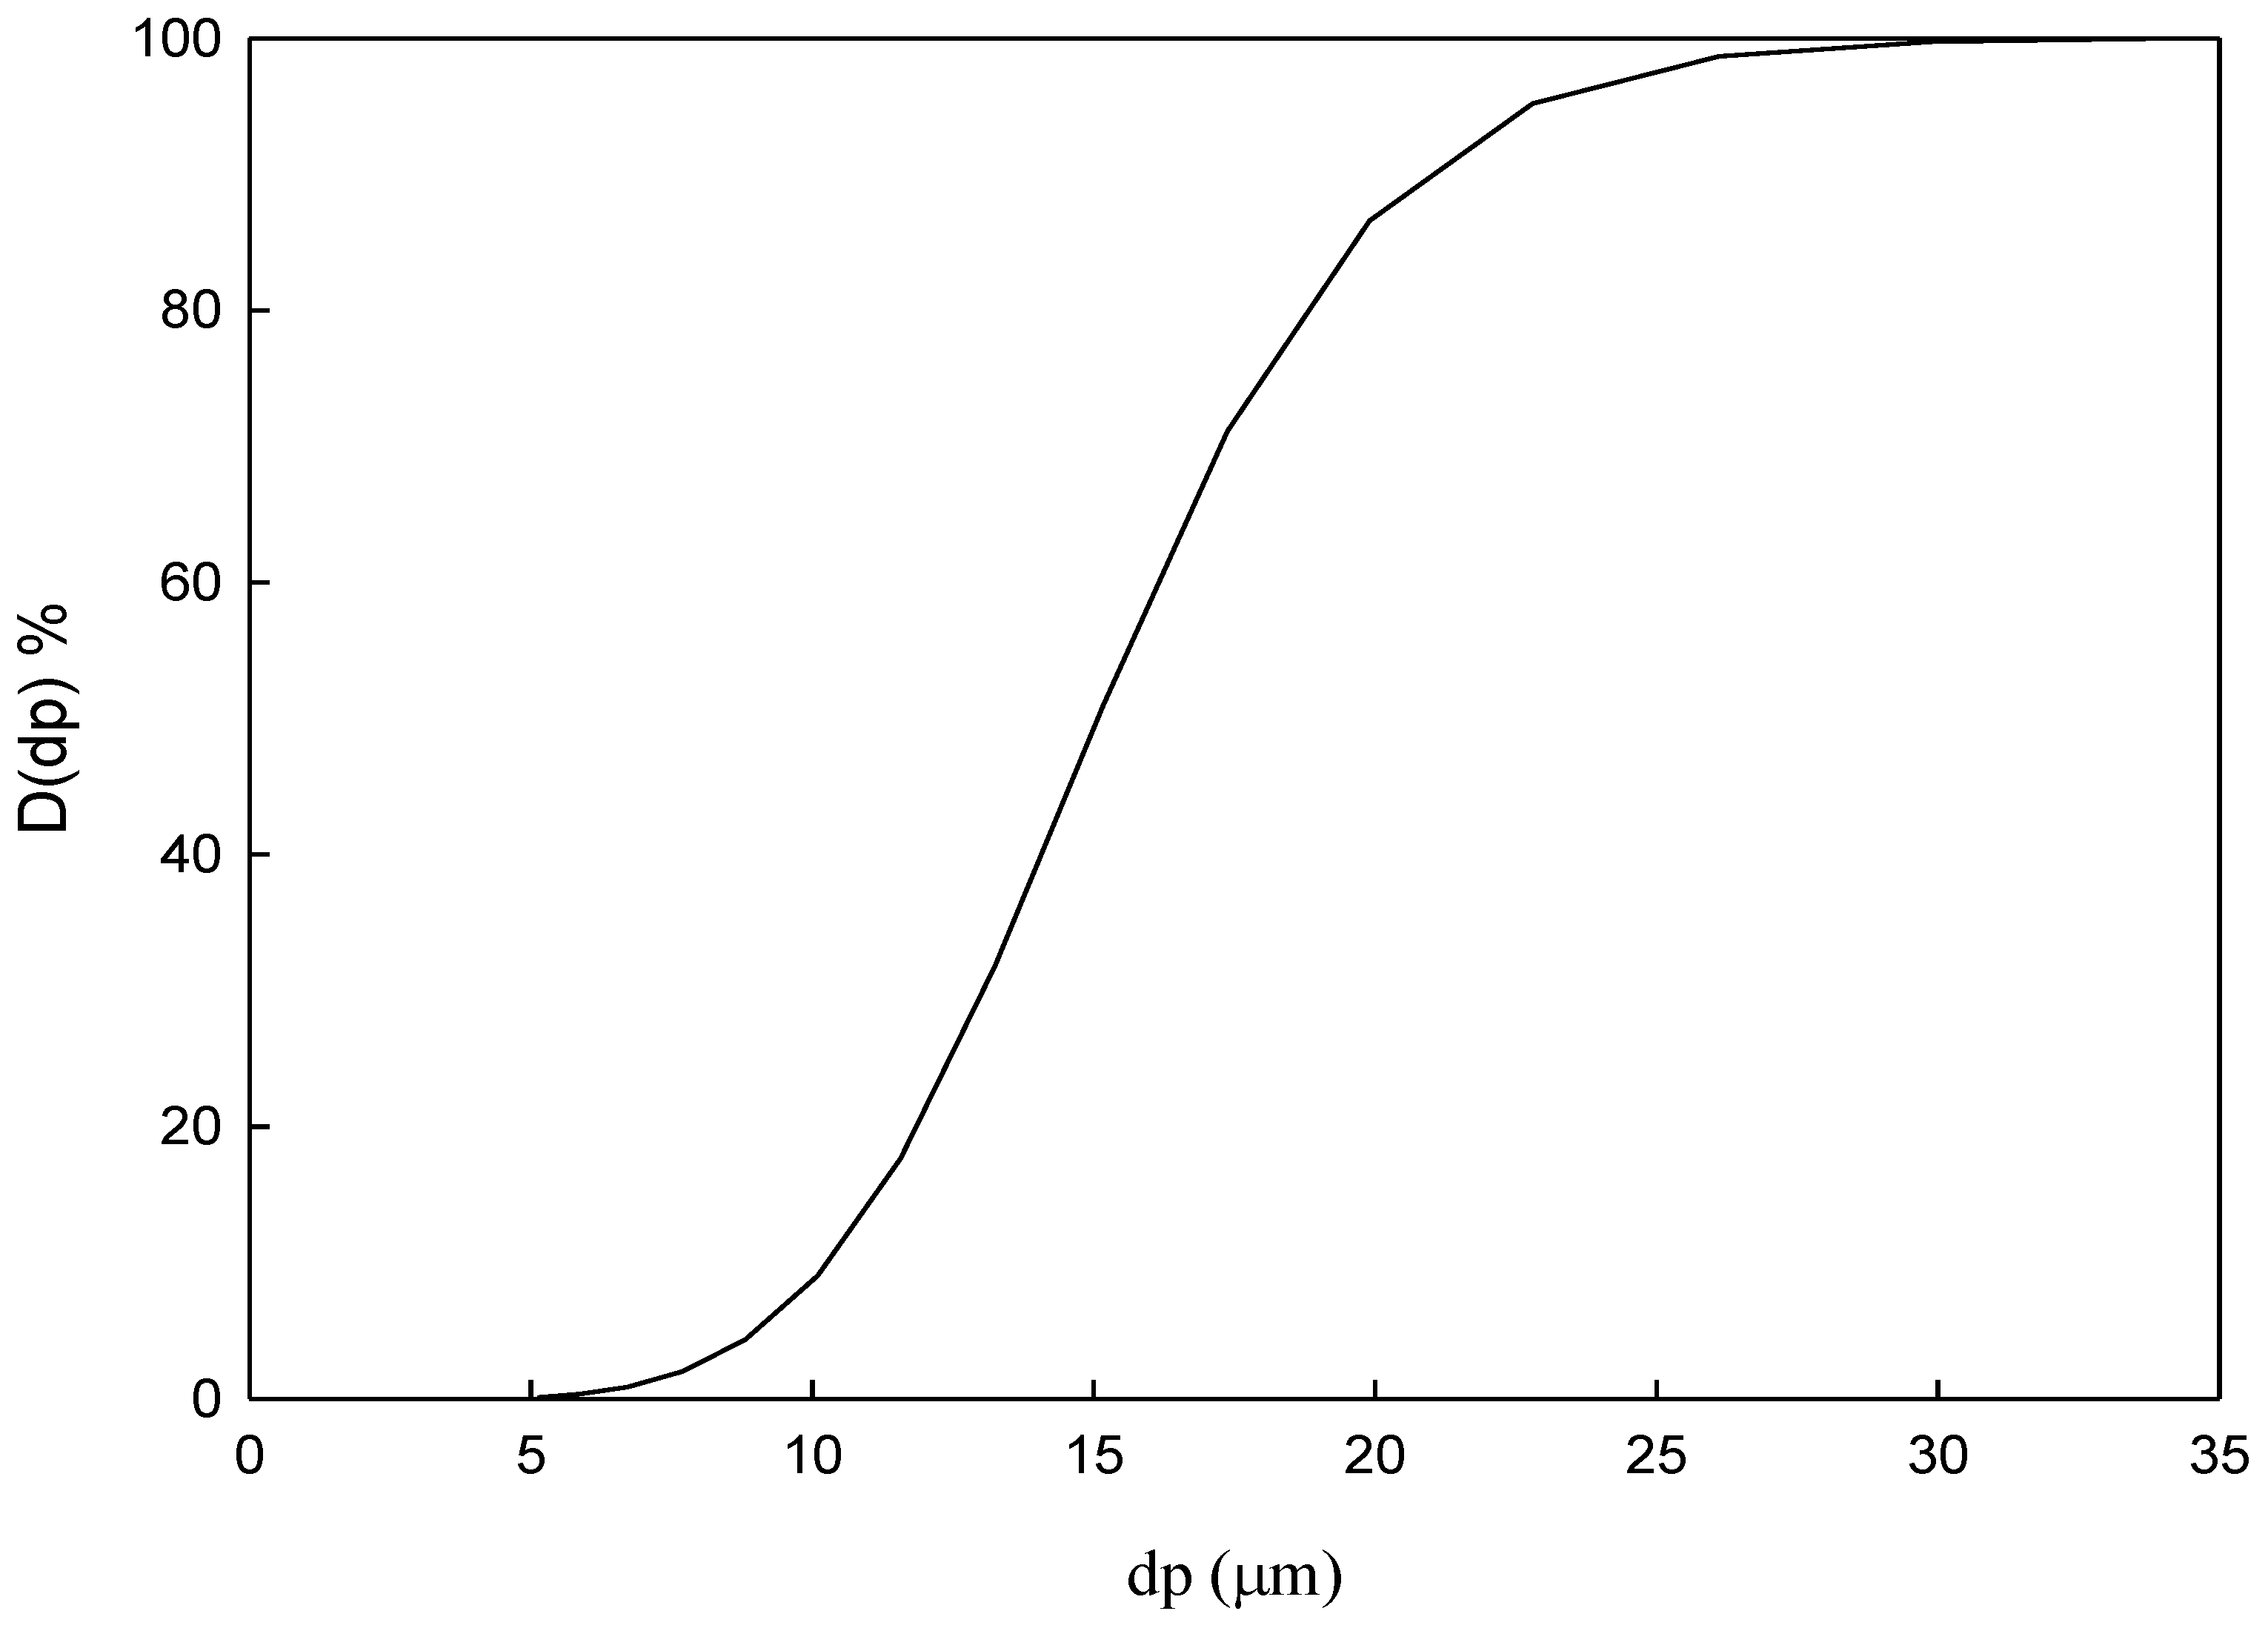
3.1. Materials

Silicon carbide powder of 13–23 μm diameter was used in this study. The particle size distribution is presented in Figure 9. The average particle diameter was 16.5 μm, and the specific gravity of particles was 3.2. The adopted composite ceramic tubular membrane was made by TAMI Industries (Nyons, Drôme, France) [http://www.tami-industries.com/en/enadvanced-ceramic-filtration/]. The support layer of the tubular membrane was made of titania, and the filter layer was made of titania and zirconia, with a pore size of 0.8 μm. The tubular membrane diameter and length were 10 mm and 600 mm, respectively. Furthermore, the membrane was single-channel with a surface area of 0.008 m2. Laser particle size distribution analyzer model No. Horibala LA-30 (Horiba, Kyoto, Japan) was used to measure particle size distribution from 0.1–600 μm. Based on the light scattering theory, a 405 nm helium-neon LED light source was used to measure the sample particle size distribution on the overflow and underflow.

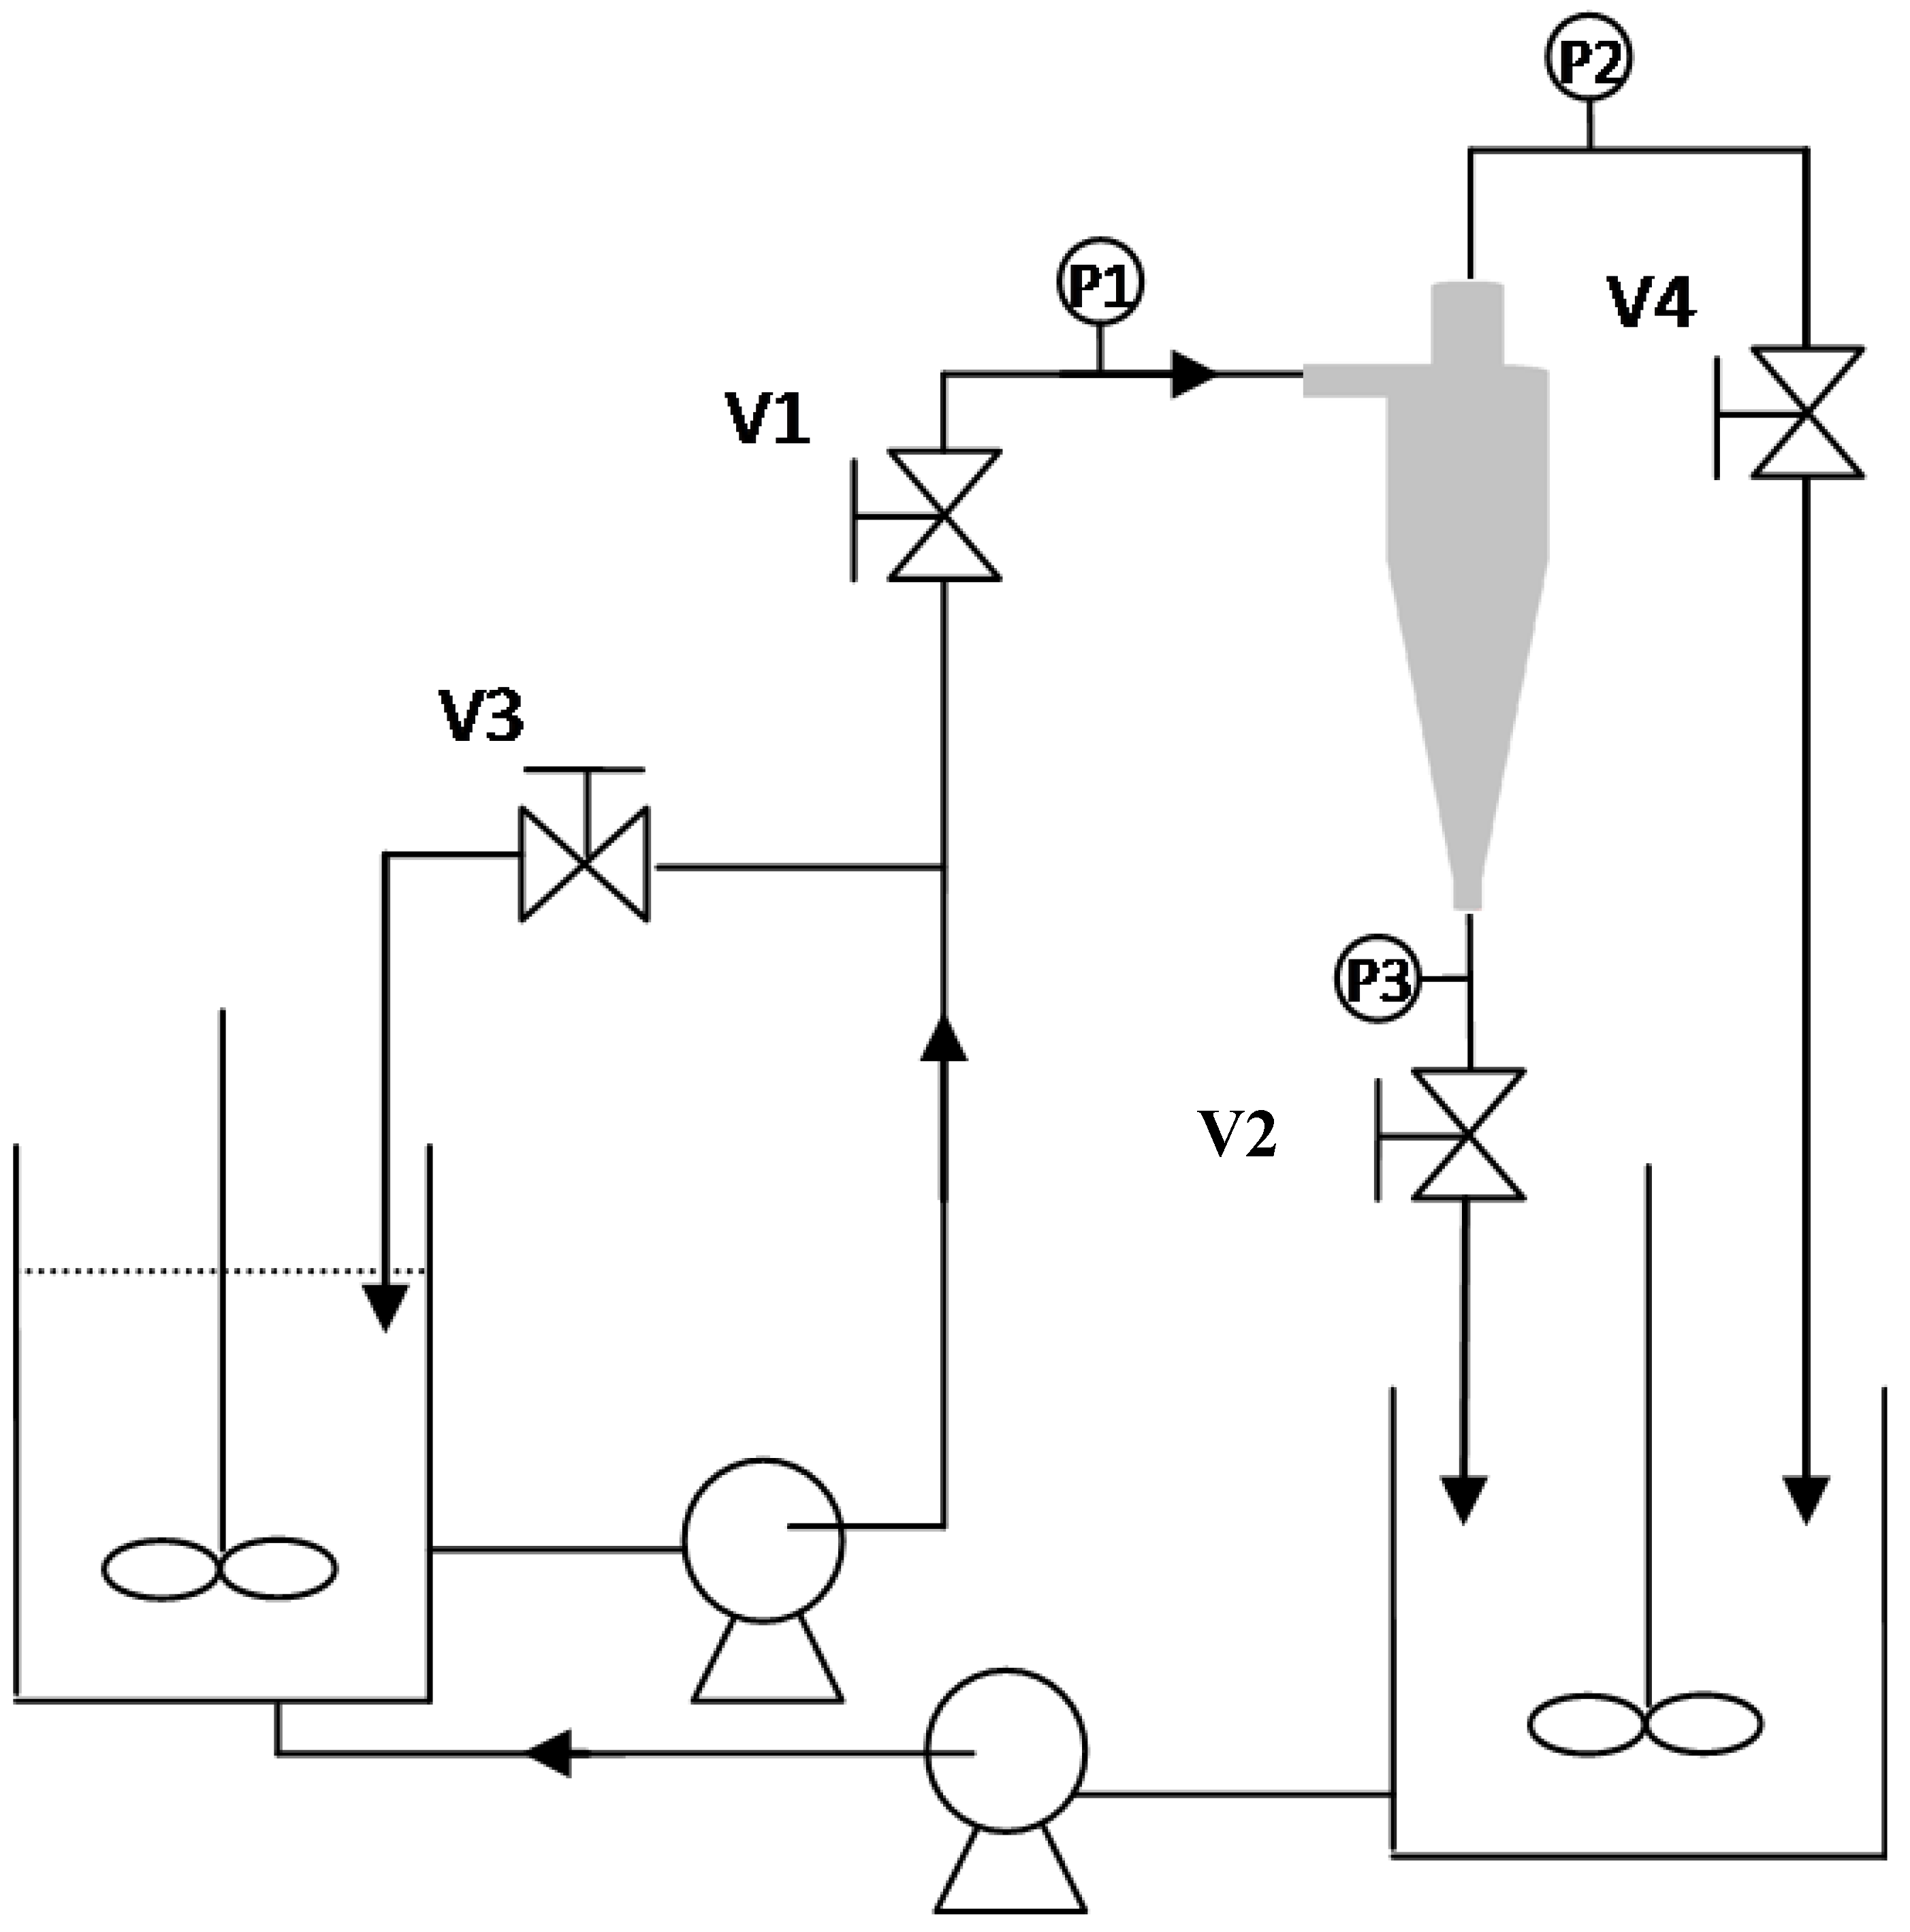
3.2. Experimental Setups and Operation

The experimental apparatus in this study is presented in Figure 10. First, the bypass valve (V3) was fully opened. Then, the overflow valve (V4) and underflow valve (V2) were fully opened, the feeding end valve (V1) was adjusted, and the feeding gauge pressure was observed (P1) until the pressure reached the desired level. The inlet pressure, overflow pressure (P2), and underflow pressure (P3) were recorded. The diluted liquid from overflow and the concentrated liquid stream from underflow were measured and sampled, and the amount of clear liquid filtrate was recorded at the outlet end of the outside-in filtration. Particle distribution, concentration, and separation efficiency were then obtained.

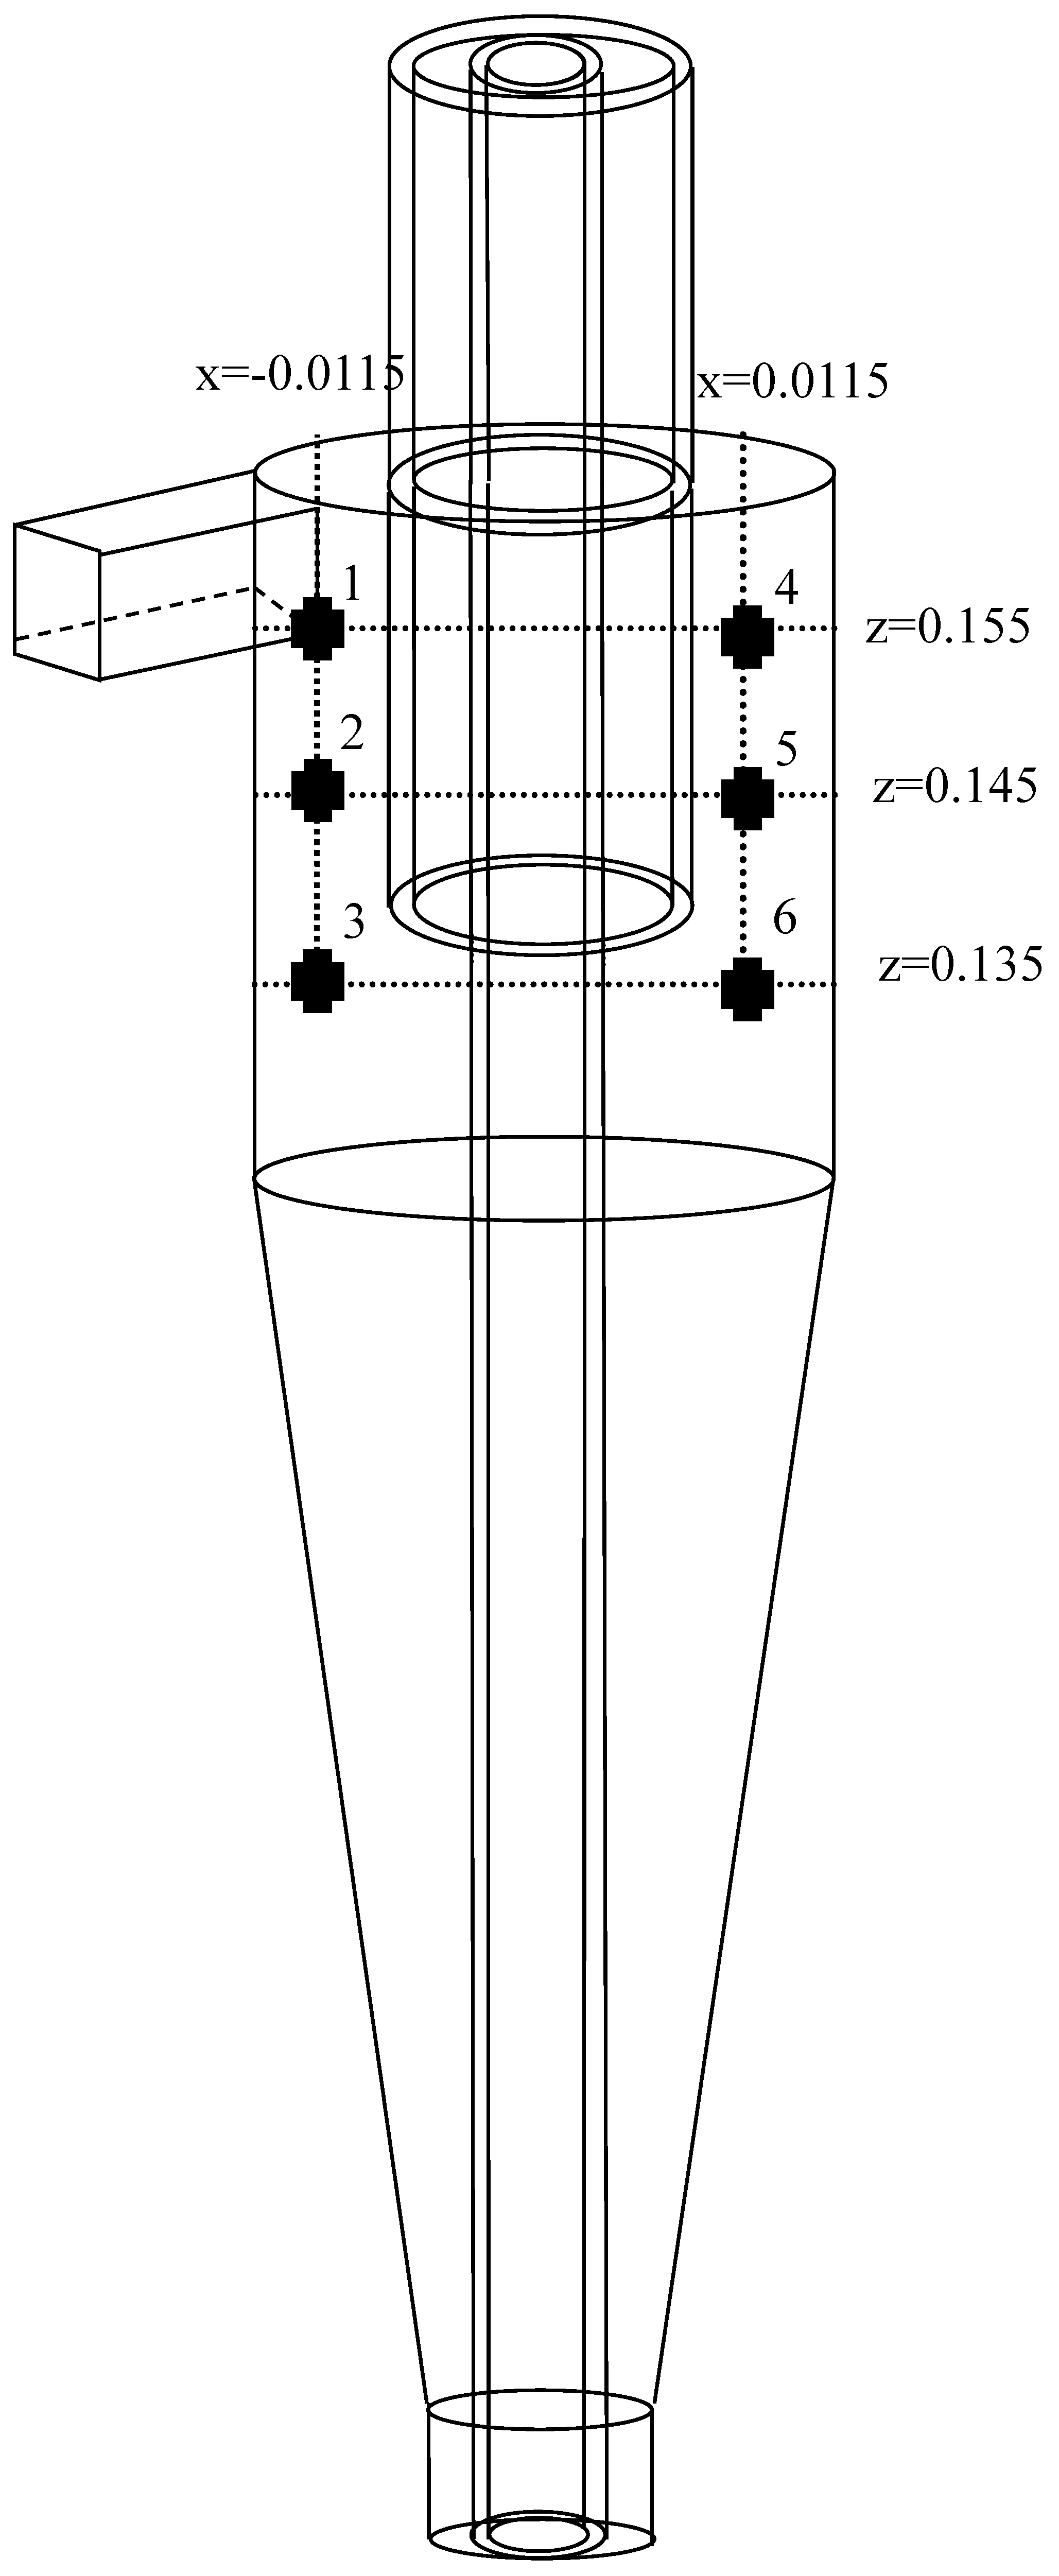
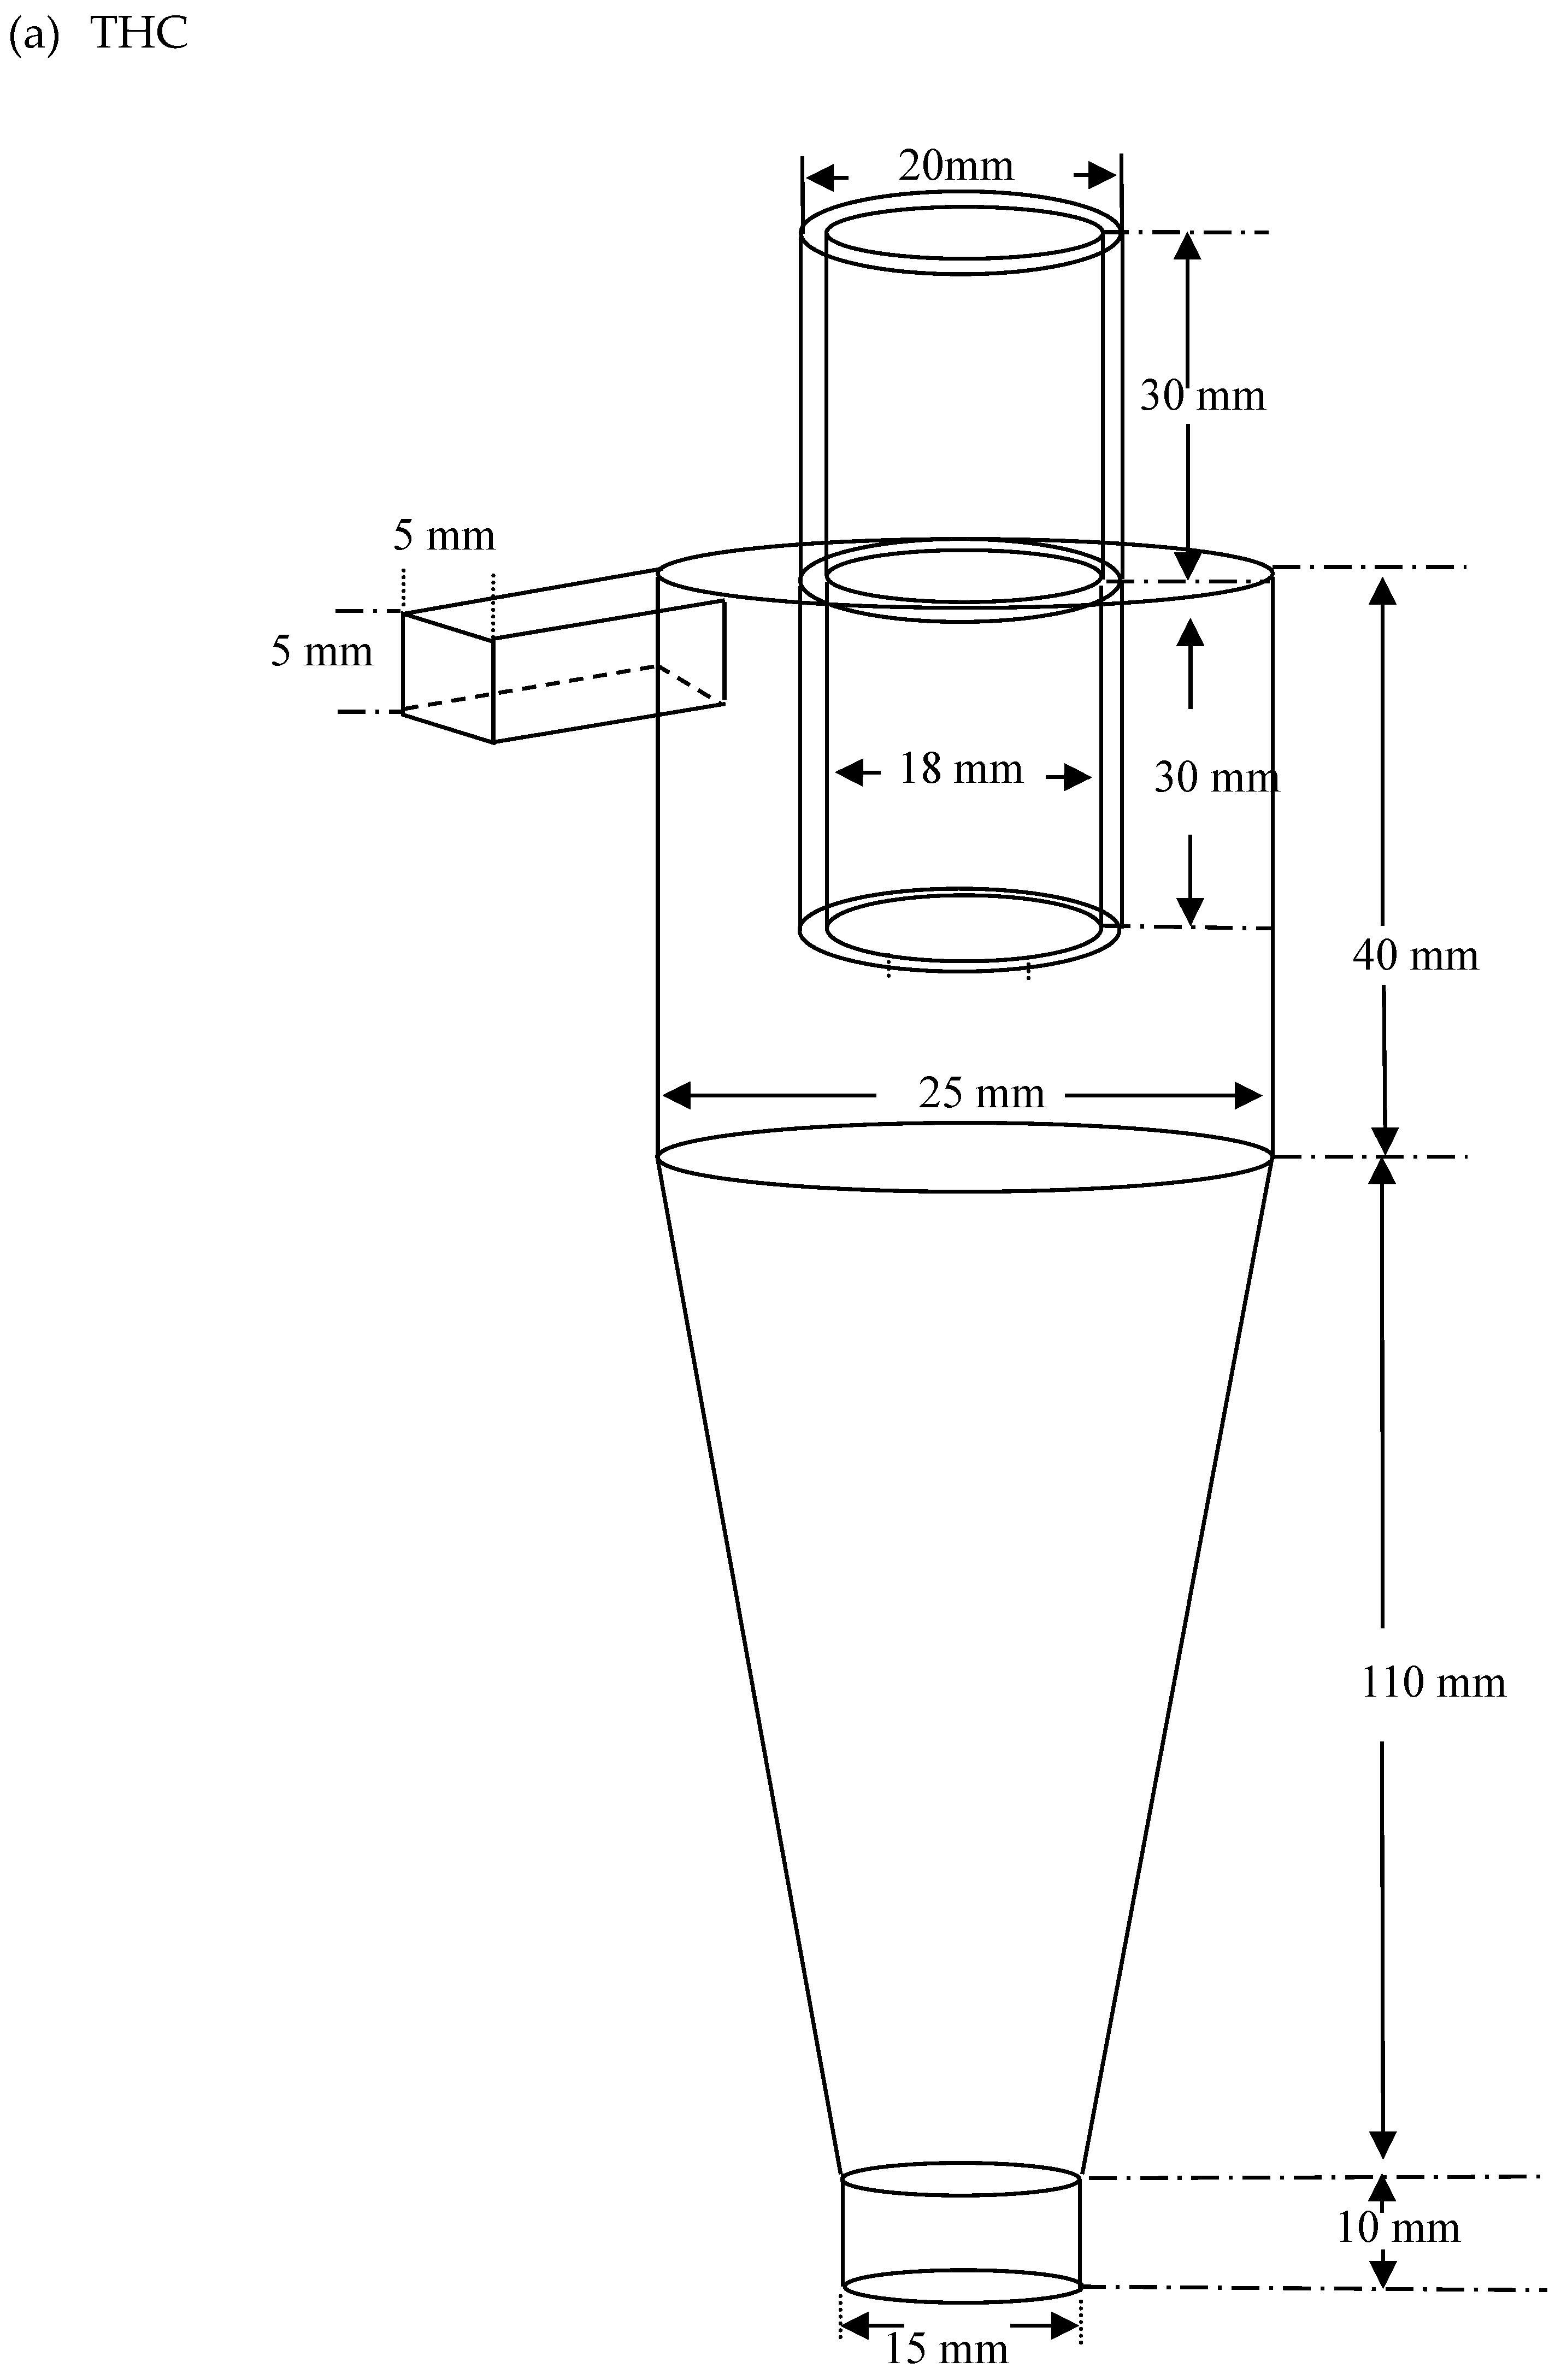
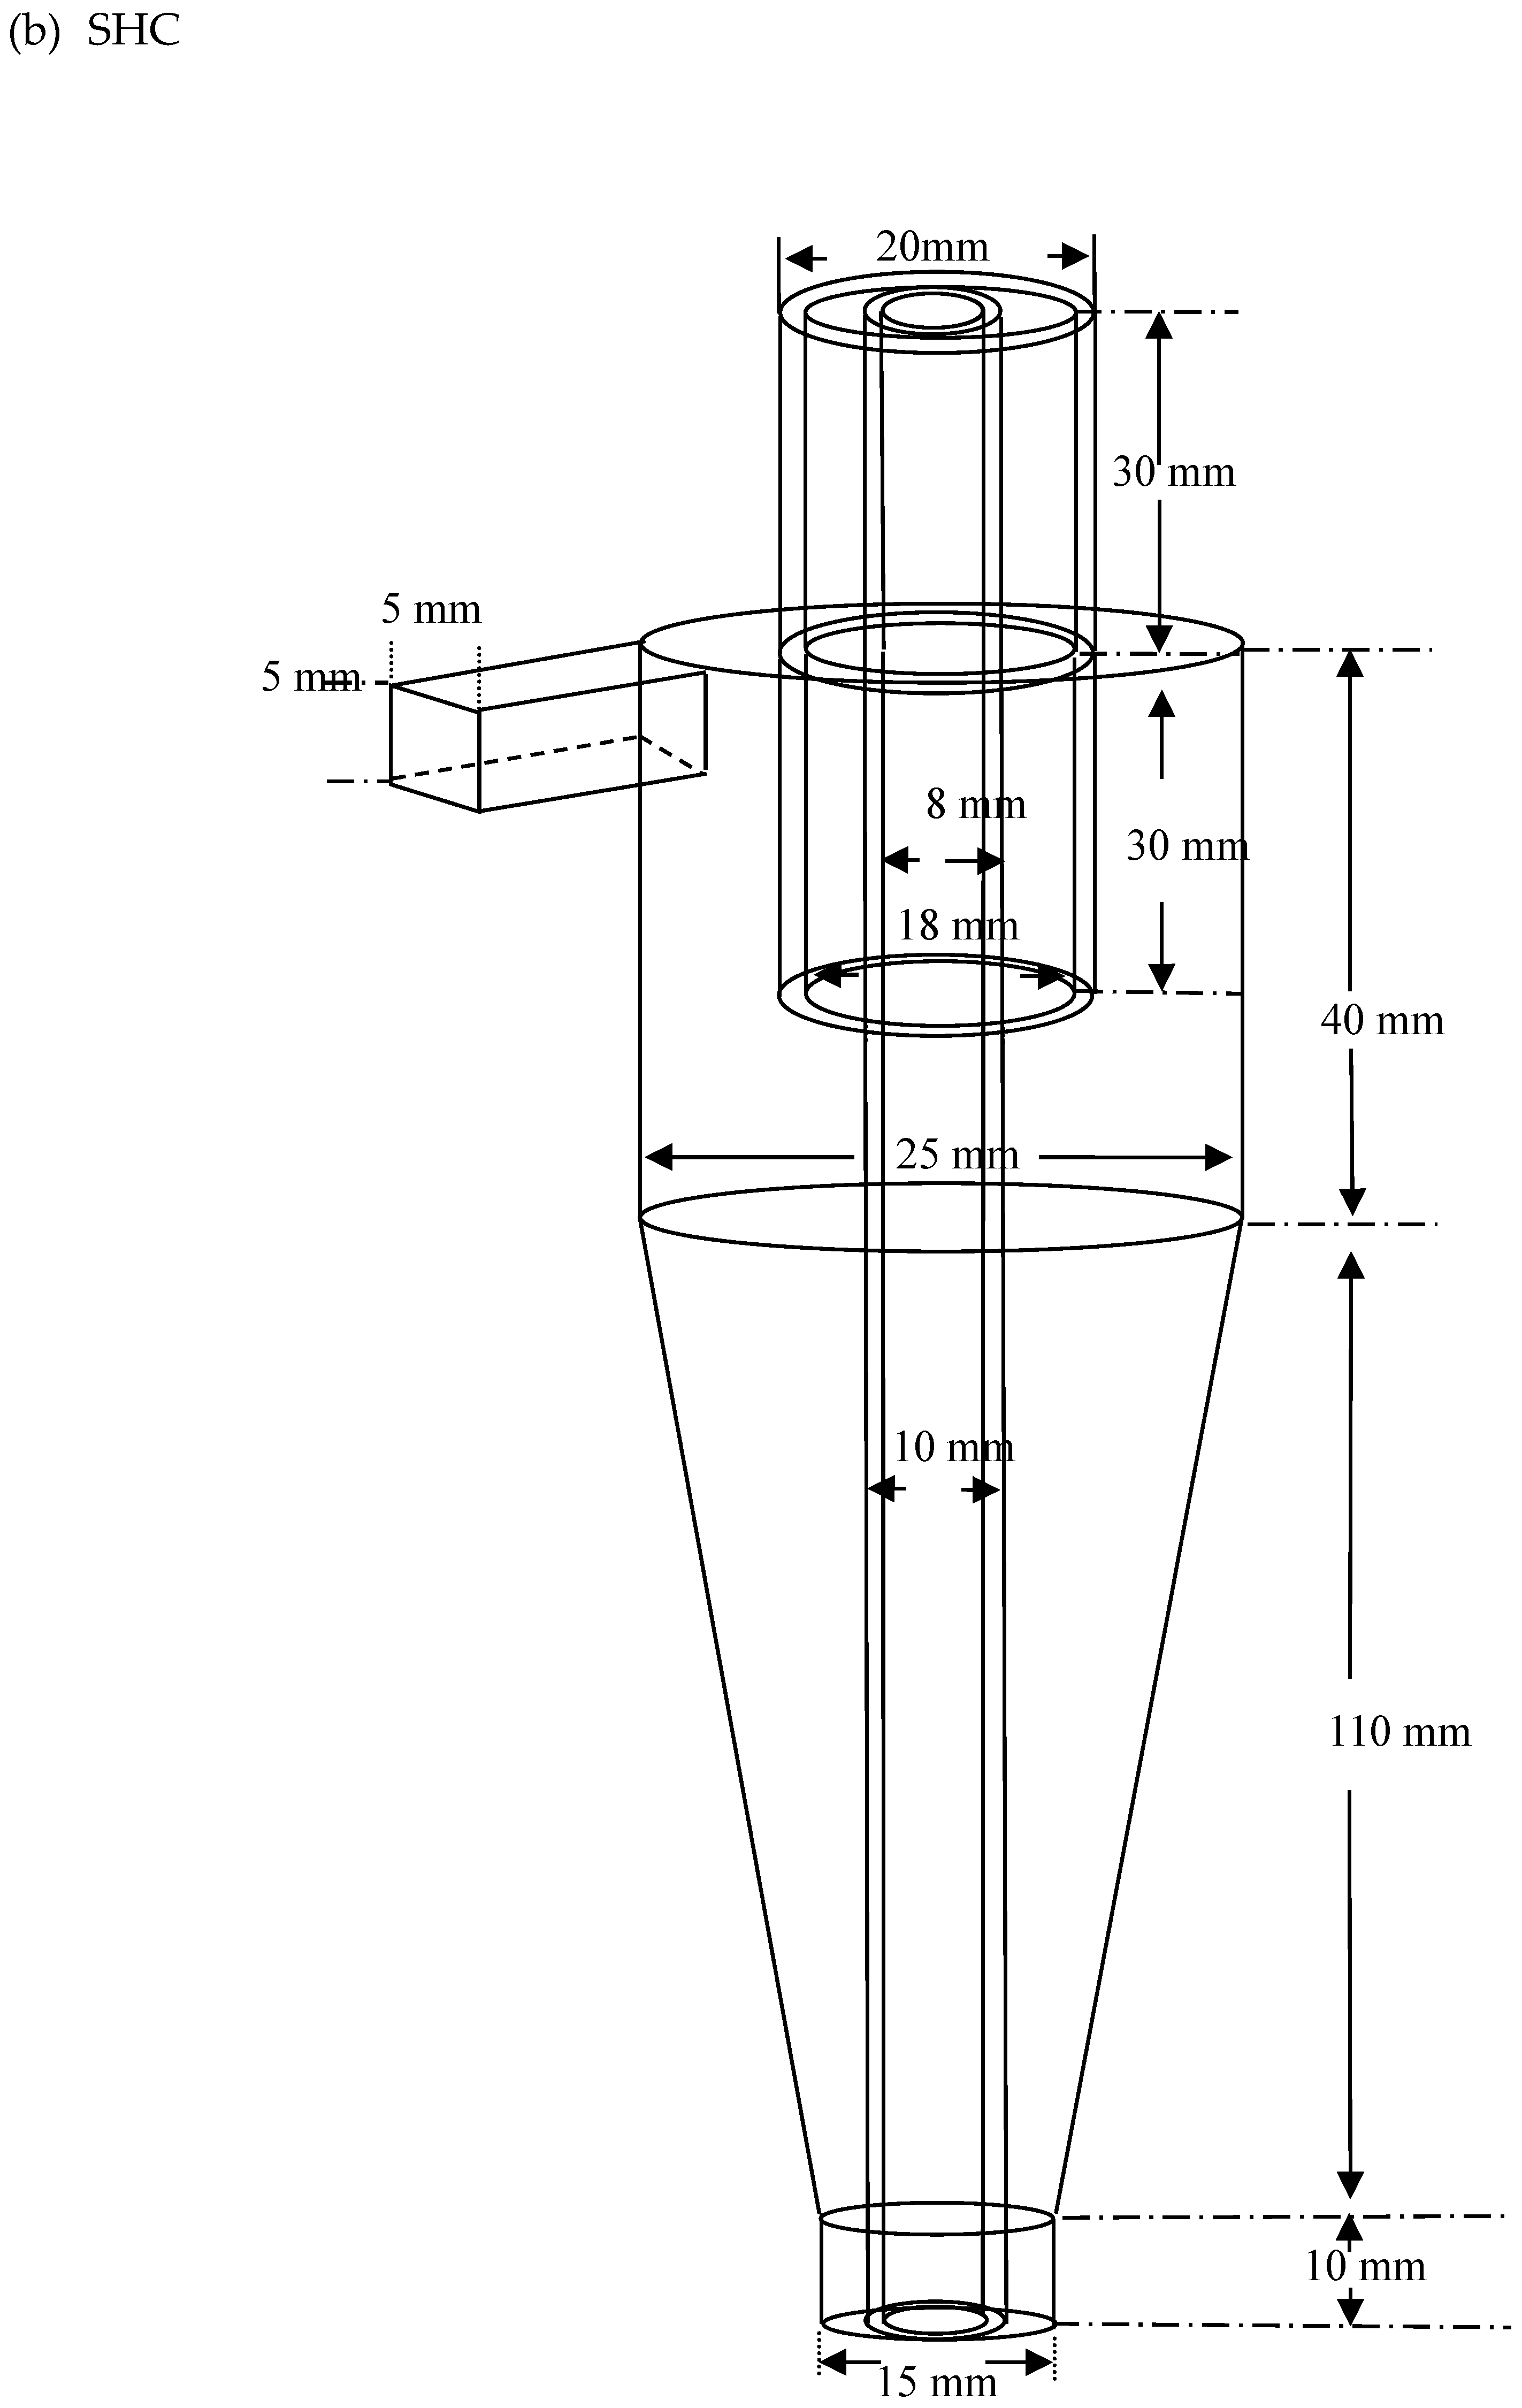
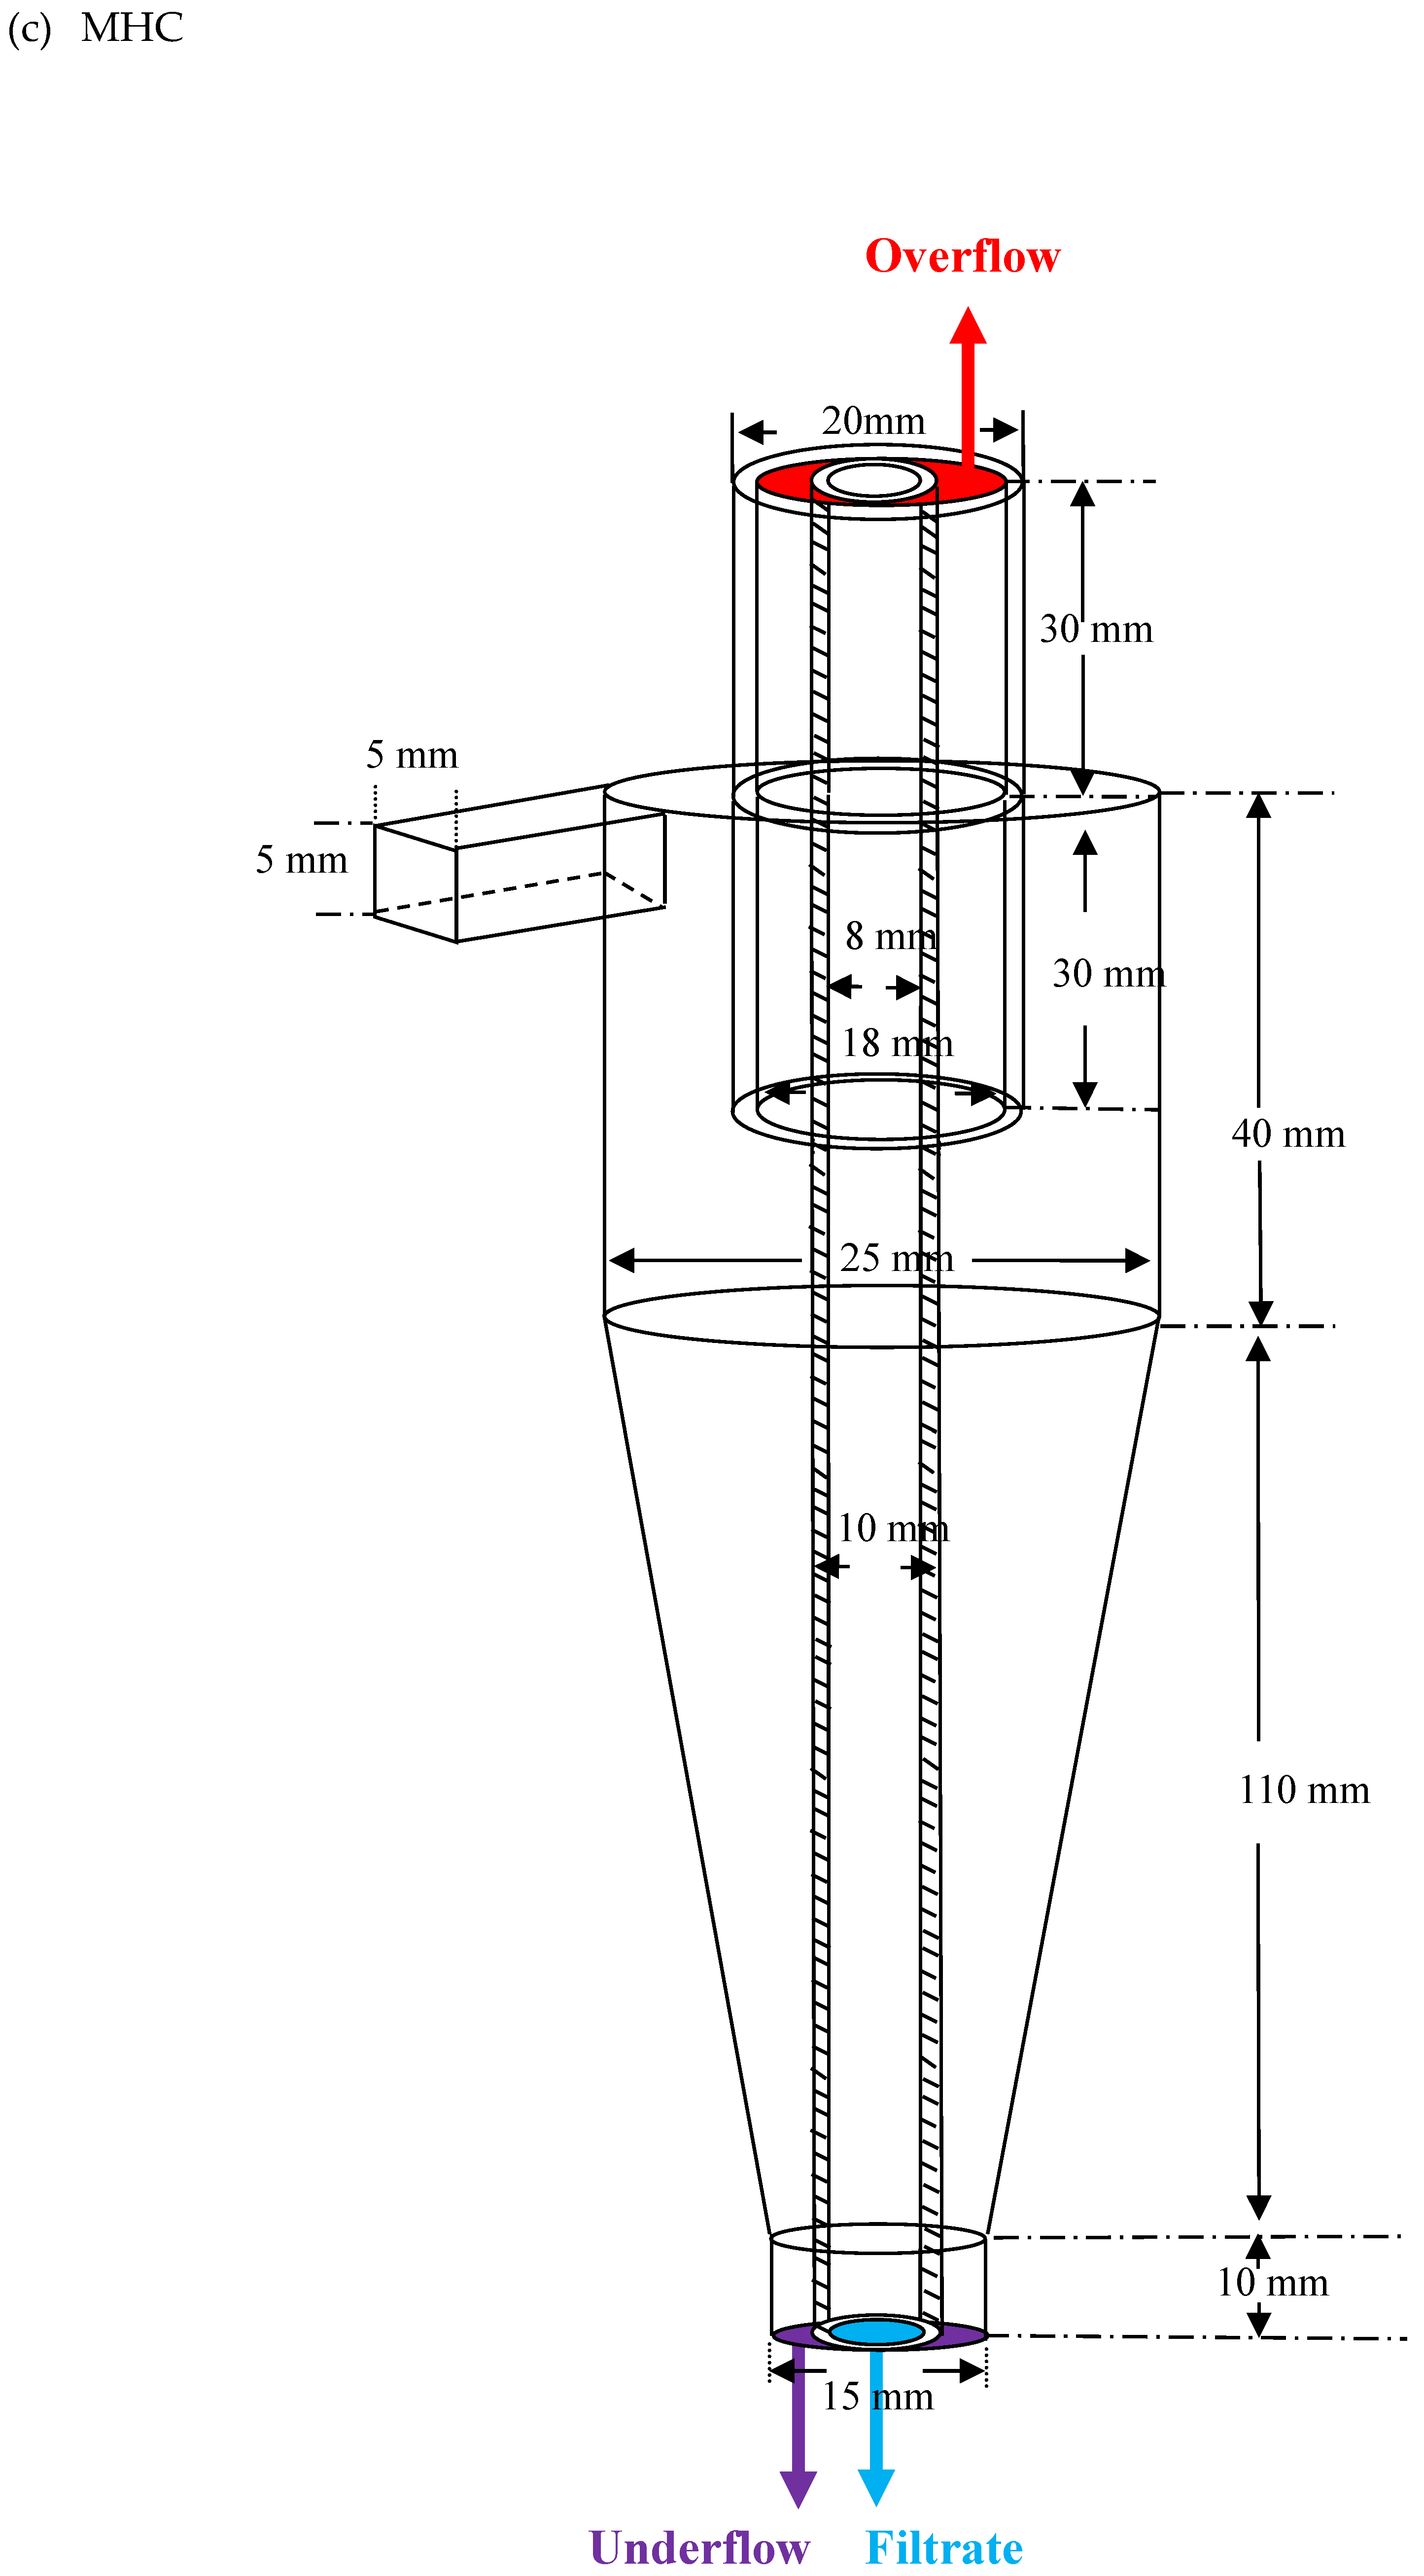
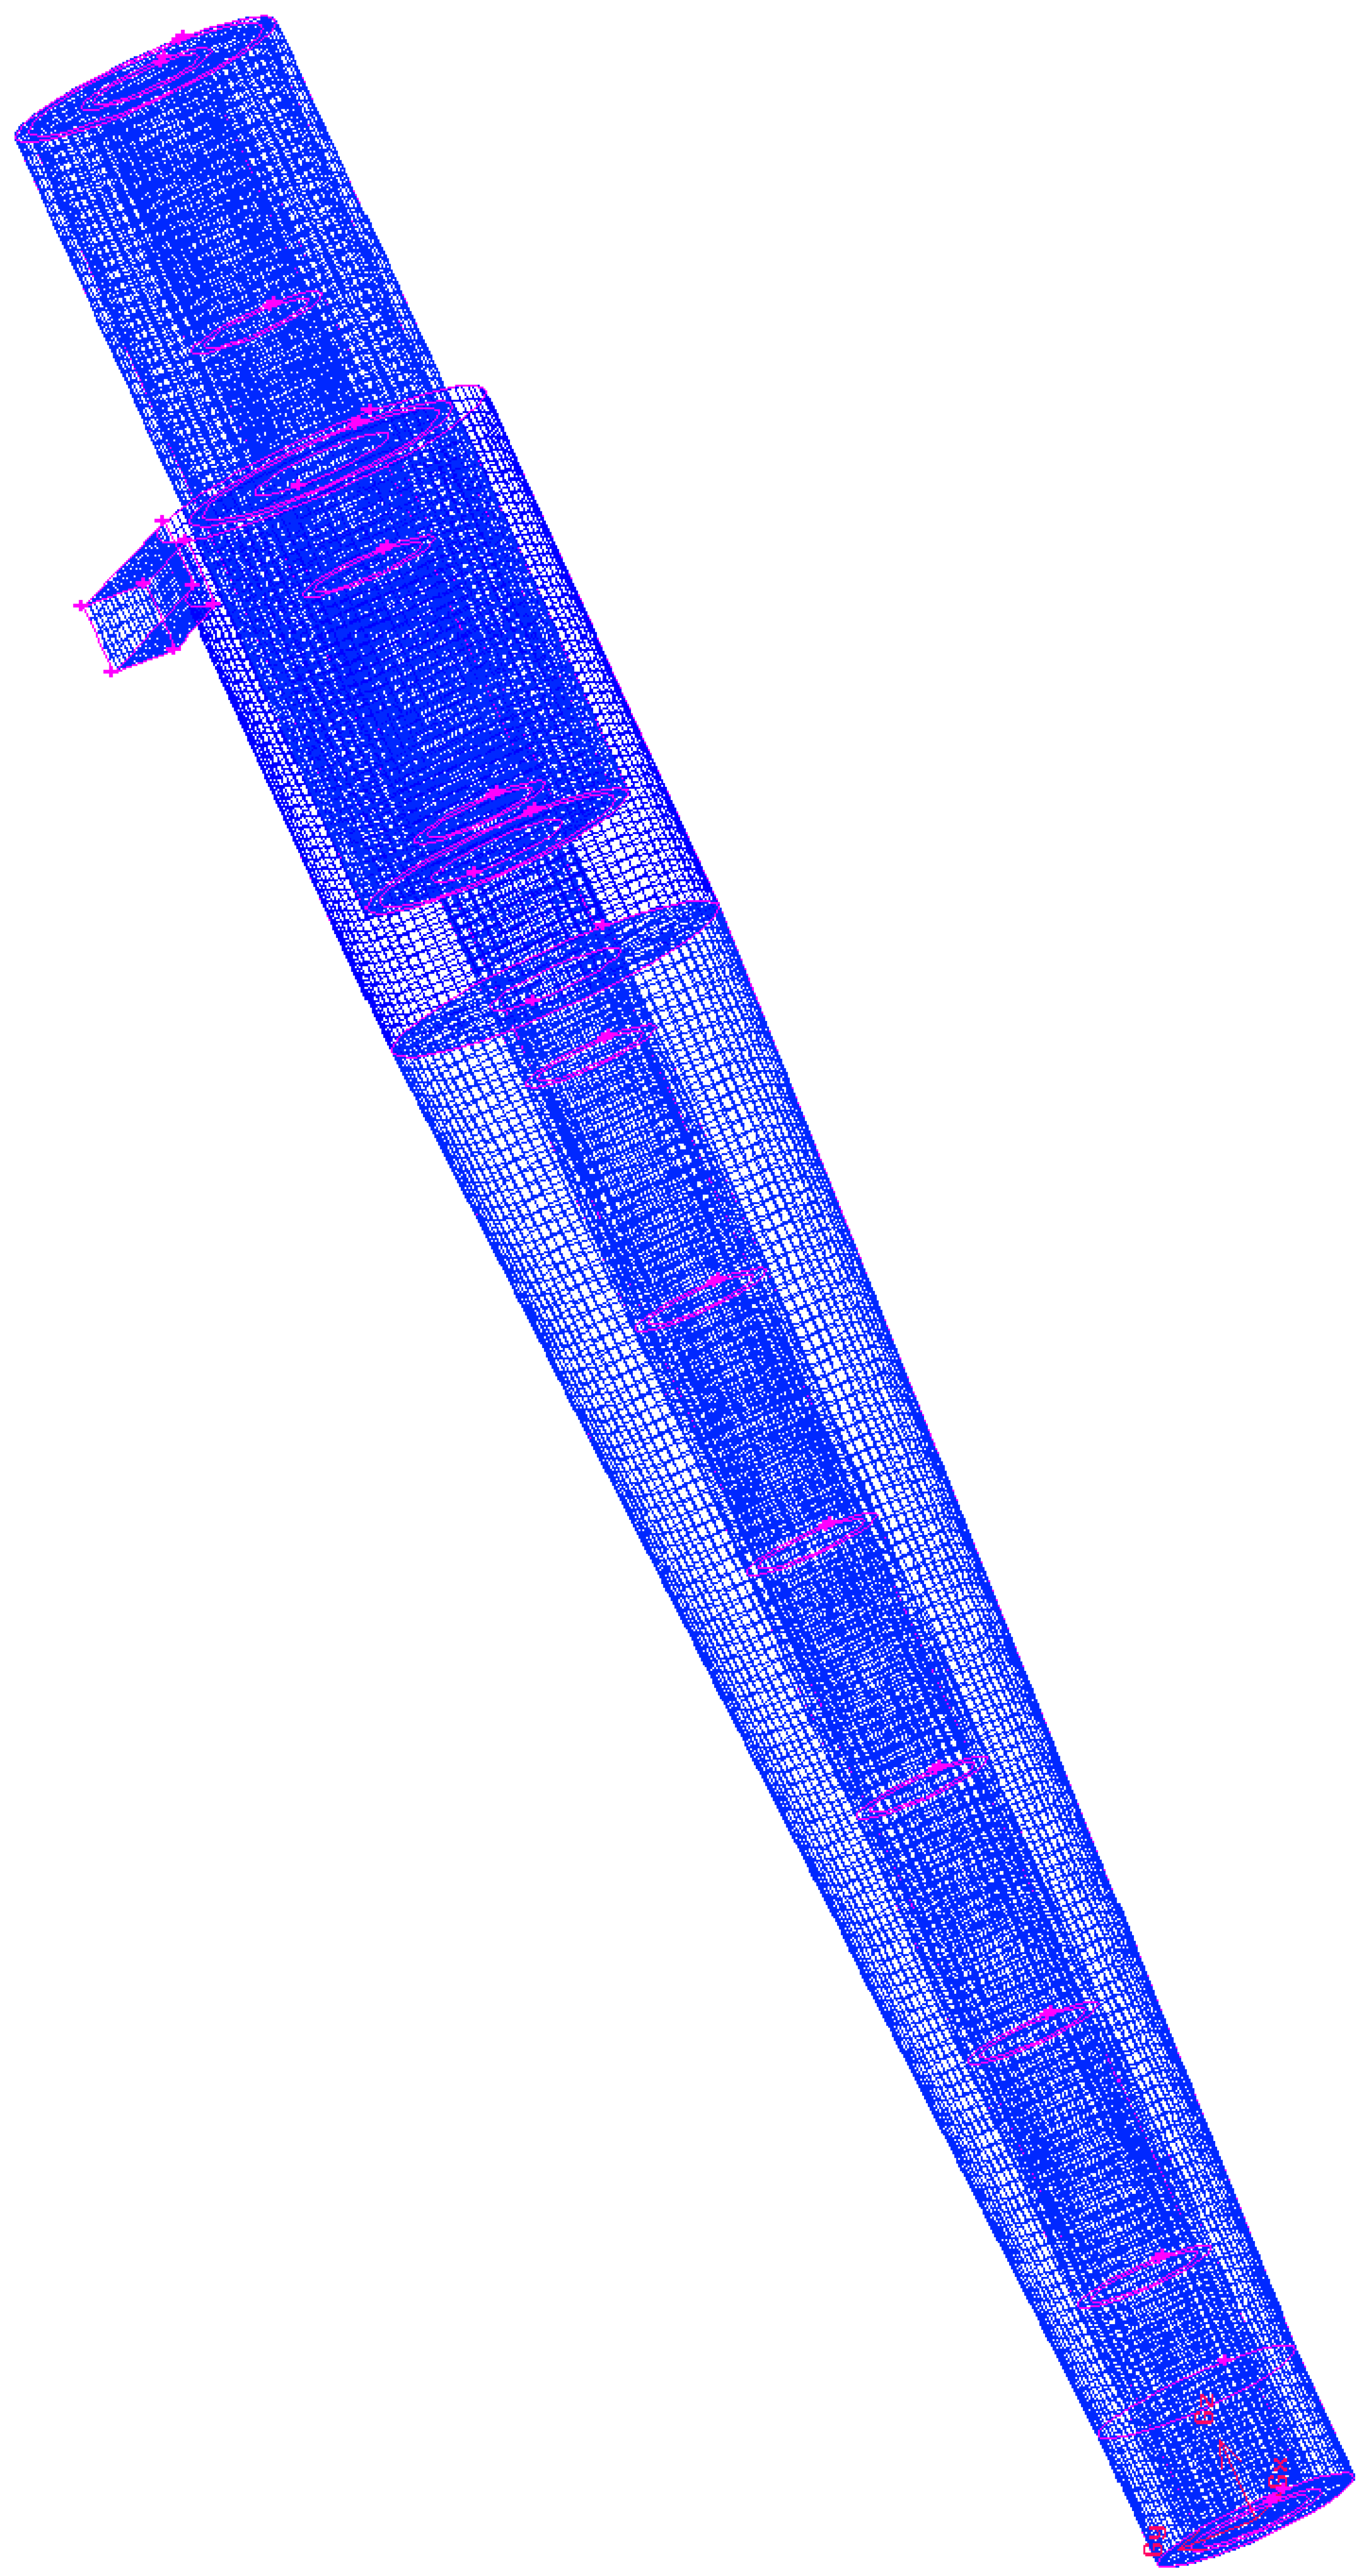
3.3. Geometry and Meshes

The three hydrocyclones types used in this study are presented in Figure 11. Figure 11a presents a THC. In Figure 11b, we used a 1 cm diameter solid cylinder inside the hydrocyclone to replace the original air core (SHC). The comparison of Figure 11c with Figure 11b indicates a 1 cm diameter solid cylinder and a 1 cm diameter tubular ceramic membrane (MHC). The conical section length of the hydrocyclone was 110 mm, and the angle between the vertical line was 2.6°; the diameter of the cylindrical section was 25 mm, with a length of 40 mm; the inlet size of hydrocyclone was 5 mm × 5 mm; and the overflow and underflow outlet diameters were 18 and 15 mm, respectively.

3.4. Calculating Methods

The flow pattern within the hydrocyclone was a turbulent flow, and the simulation method was LES. The air core was simulated using the volume of fluid model. Derivationally, the fluid volume fraction is decided by αv of each controlling body; the transport equation of air–water interface is defined in Equations (1) and (2):
t ( α w ρ w v w ) + ( α w ρ w v w v w ) = α w p + τ ¯ ¯ w + α w ρ w g + s = 1 n ( R s w + m ˙ s w v s w )
t ( α s ρ s v s ) + ( α s ρ s v s v s ) = α s p + τ ¯ ¯ s + α s ρ s g + w = 1 n ( R w s + m ˙ w s v w s )
The Lagrangian discrete phase model (DPM) follows the Euler–Lagrange approach. The fluid phase is considered a continuous phase and is governed by the time-averaged Navier–Stokes equation. However, the dispersed phase is solved by tracking trajectories of a large number of particles through the calculated flow field velocity. The dispersed phase can exchange momentum, mass, and energy with the continuous fluid phase.
As depicted in Figure 12, the density of the mesh cell number 1,500,000 is presented. Mesh independence analysis indicates that it is suitable for simulating the optimum velocity value under a reasonable prediction computation time. Feeding fluid velocity is constant, and the boundary conditions are as follows:
v = constant    @   inlet   pipe
P = 0  @ underflow
P = 0  @ overflow
The outlet fluid was under atmospheric pressure, and therefore the overflow and underflow pressures of the flow were set to zero.
The hydrocyclone inner wall setting follows the no-slip boundary condition. Using governing Equations (1) and (2) as well as the relevant boundary condition Equations (3)–(5), CFD FLUENT 6.1 software (Fluent, NY, USA) calculates the flow field within the hydrocyclone. The pressure staggered option effectively predicted the high swirl flow within the hydrocyclone. The SIMPLE algorithm program, which uses a combination of continuous and momentum equations to derive pressure equation, was used in this simulation method. Calculations were implemented under the maximum relative error of 10−4 of the estimated fluid velocity.

4. Conclusions

In this study, silicon carbide particles were used to implement hydrocyclone experiments, and the simulation verification was calculated by using Fluent CFD software. Air core areas with metal cylinders and ceramic tubular membranes were compared, and the effects of the separation phenomena of different hydrocyclones were explored.
By inserting a tubular membrane, the resultant hydrocyclone has three outlets, namely the overflow dilute liquid, underflow concentrated liquid, and clear filtrate. This hydrocyclone can accomplish classification and filtration. The proposed hydrocyclone had a classification function equivalent to that of the conventional hydrocyclone. However, the overflow concentration was relatively dilute, the underflow concentration was relatively concentrated, and a clear filtrate was obtained.

Author Contributions

Conceptualization, R.-M.W.; Methodology, R.-M.W.; Software, J.-Y.L.; Validation, J.-Y.L. and R.-M.W.; Formal Analysis, R.-M.W.; Investigation, J.-Y.L.; Resources, R.-M.W.; Data Curation, J.-Y.L.; Writing—Original Draft Preparation, R.-M.W.; Writing—Review & Editing, R.-M.W.; Visualization, J.-Y.L.; Supervision, R.-M.W.; Project Administration, R.-M.W.; Funding Acquisition, R.-M.W.

Funding

The authors would like to thank the National Science Council of the Republic of China, Taiwan, for financially supporting this research under contract No. NSC 97-2221-E-032-030-MY3.

Conflicts of Interest

The authors declare no conflict of interest.

References

  1. Zaini, N.; Osman, R.; Juahir, H.; Saim, N. Development of Chromatographic Fingerprints of Eurycoma longifolia (Tongkat Ali) Roots Using Online Solid Phase Extraction-Liquid Chromatography (SPE-LC). Molecules 2016, 21, 583. [Google Scholar] [CrossRef] [PubMed]
  2. Neesse, T.; Dueck, J.; Schwemmer, H.; Farghaly, M. Using a high pressure hydrocyclone for solids classification in the submicron range. Miner. Eng. 2015, 71, 85–88. [Google Scholar] [CrossRef]
  3. Endres, E.; Dueck, J.; Neesse, T. Hydrocyclone classification of particle in the micron range. Miner. Eng. 2012, 31, 42–45. [Google Scholar] [CrossRef]
  4. Hwang, K.J.; Lyu, S.Y.; Nagase, Y. Particle separation efficiency in two 10-mm hydrocyclones in series. J. Taiwan Inst. Chem. Eng. 2009, 40, 313–319. [Google Scholar] [CrossRef]
  5. Minkova, L.; Dueck, J.; Neesse, T. Computer simulations of the Fish-Hook effect in hydrocyclone separation. Miner. Eng. 2013, 62, 19–24. [Google Scholar] [CrossRef]
  6. Zhang, Y.; Liu, P.; Jiang, L.; Yang, X. The Study on Numerical Simulation and Experiments of Four Product Hydrocyclone with Double Vortex Finders. Minerals 2019, 9, 23–39. [Google Scholar] [CrossRef]
  7. Cilliers, J.J.; Harrison, S.T.L. Yeast Flocculation aids the Performance of Yeast Dewatering using Mini-Hy-drocyclones. Sep. Purif. Technol. 2019, 209, 159–163. [Google Scholar] [CrossRef]
  8. Vega, D.; Brito-Parada, P.R.; Cilliers, J.J. Optimising small hydrocyclone design using 3D printing and CFD simulations. Chem. Eng. J. 2018, 350, 653–659. [Google Scholar] [CrossRef]
  9. Vehmaanperä, P.; Safonov, D.; Kinnarinen, T.; Häkkinen, A. Improvement of the filtration characteristics of calcite slurry by hydrocyclone classification. Miner. Eng. 2018, 128, 133–140. [Google Scholar] [CrossRef]
  10. Jeon, H.; Park, S. Separation of fine particles with electrostatically enhanced cyclone. Sep. Sci. Technol. 2019. [Google Scholar] [CrossRef]
  11. Hwang, K.J.; Chou, S.P. Designing vortex finder structure for improving the particle separation efficiency of a hydrocyclone. Sep. Purif. Technol. 2017, 172, 76–84. [Google Scholar] [CrossRef]
  12. Vieira, L.G.M.; Barbosa, E.A.; Damasceno, J.J.R.; Barrozo, M.A.S. Performance analysis and design of filtering hydrocyclones. Braz. J. Chem. Eng. 2005, 22, 143–152. [Google Scholar] [CrossRef] [Green Version]
  13. Vieira, L.G.M.; Silva, D.O.; Barrozo, M.A.S. Effect of Inlet Diameter on the Performance of a Filtering Hydrocyclone Separator. Chem. Eng. Technol. 2016, 39, 1406–1412. [Google Scholar] [CrossRef]
  14. Khan, R.U.; Bajohr, S.; Graf, F.; Reimert, R. Modeling of Acetylene Pyrolysis under Steel Vacuum Carburizing Conditions in a Tubular Flow Reactor. Molecules 2007, 12, 290–296. [Google Scholar] [CrossRef] [PubMed]
  15. Ji, L.; Kuang, S.; Qi, Z.; Wang, Y.; Chen, J.; Yu, A. Computational analysis and optimization of hydrocyclone size to mitigate ad-verse effect of particle density. Sep. Purif. Technol. 2017, 174, 251–263. [Google Scholar] [CrossRef]
  16. Ji, L.; Chen, J.; Kuang, S.; Qi, Z.; Chu, K.; Yu, A. Prediction of separation performance of hydrocyclones by a PC-based model. Sep. Purif. Technol. 2019, 211, 141–150. [Google Scholar] [CrossRef]
  17. Ghodrat, M.; Qi, Z.; Kuang, S.B.; Ji, L.; Yu, A.B. Computational investigation of the effect of particle density on the multiphase flows and performance of hydrocyclone. Miner. Eng. 2016, 90, 55–69. [Google Scholar] [CrossRef]
  18. Wu, S.E.; Hwang, K.J.; Cheng, T.W.; Hung, T.C.; Tung, K.L. Effectiveness of a hydrocyclone in separating particles suspended on power law fluids. Power Technol. 2017, 320, 546–554. [Google Scholar] [CrossRef]
  19. Delgadillo, J.A.; Rajamani, R.K. Hydrocyclone modeling: Large eddy simulation CFD approach. Miner. Metall. Process. 2005, 22, 225–232. [Google Scholar] [CrossRef]
  20. Lim, E.W.; Chen, Y.R.; Wang, C.H.; Wu, R.M. Experimental and computational studies of multiphase hydrodynamics in a hydrocyclone separator system. Chem. Eng. Sci. 2010, 65, 6415–6424. [Google Scholar] [CrossRef]
  21. Wang, C.C.; Wu, R.M. Experimental and simulation of a novel hydrocyclone-tubular membrane as overflow pipe. Sep. Purif. Technol. 2018, 198, 60–67. [Google Scholar] [CrossRef]
  22. Slack, M.D.; Prasad, R.O.; Bakker, A.; Boysan, F. Advances in cyclone modelling using unstructured grids. Trans. IChemE 2000, 78, 1098–1104. [Google Scholar] [CrossRef]
  23. Liow, J.L.; Oakman, O.A. Performance of mini-axial hydrocyclones. Miner. Eng. 2018, 122, 67–78. [Google Scholar] [CrossRef]
  24. Pérez, D.; Cornejo, P.; Rodríguez, C.; Concha, F. Transition from spray to roping in hydrocyclones. Miner. Eng. 2018, 123, 71–84. [Google Scholar] [CrossRef]
  25. Hwang, K.J.; Wu, W.H.; Qian, S.; Nagase, Y. CFD Study on the effect of hydrocyclone structure on the separation effocoency of fine particles. Sep. Sci. Technol. 2008, 43, 3777–3797. [Google Scholar] [CrossRef]
  26. Kraipech, W.; Nowakowski, A.; Dyakowski, T.; Suksangpanomrung, A. An investigation of the effect of the particle-fluid and particle-particle interactions on the flow within a hydrocyclone. Chem. Eng. J. 2005, 111, 189–197. [Google Scholar] [CrossRef]
  27. Ovalle, E.; Araya, R.; Concha, F. The role of wave propagation in hydrocyclone operations I: An axisymmetric streamfunction formulation for a conical hydrocyclone. Chem. Eng. J. 2005, 111, 205–211. [Google Scholar] [CrossRef]
  28. Chu, L.Y.; Qin, J.J.; Chen, W.M.; Lee, X.Z. Energy consumption and its reduction in the hydrocyclone separation process II. Time-averaged and fluctuating characteristics of the turbulent pressure in a hydrocyclone. Sep. Sci. Technol. 2000, 35, 2543–2560. [Google Scholar] [CrossRef]
  29. Chu, L.Y.; Chen, W.M.; Lee, X.Z. Enhancement of hydrocyclone performance by controlling the inside turbulence structure. Chem. Eng. Sci. 2002, 57, 207–212. [Google Scholar] [CrossRef]
  30. Li, B.; Huang, M.; Fu, T.; Pan, L.; Yao, W.; Guo, L. Microfiltration Process by Inorganic Membranes for Clarification of TongBi Liquor. Molecules 2012, 17, 1319–1334. [Google Scholar] [CrossRef] [Green Version]
  31. Kim, M.; Kim, J.; Syed, A.; Kim, Y.M.; Choe, K.; Kim, C. Application of Centrifugal Partition Chromatography for Bioactivity-Guided Purification of Antioxidant-Response-Element-Inducing Constituents from Atractylodis Rhizoma Alba. Molecules 2018, 23, 2274. [Google Scholar] [CrossRef] [PubMed]
  32. Wu, R.M. Hydrocyclone Separator. US Patent US 8182684 B1, 22 May 2012. [Google Scholar]
  33. Hsu, C.Y.; Wu, R.M. Hot zone in a hydrocyclone for particles escape from overflow. Dry. Technol. 2008, 26, 1011–1017. [Google Scholar] [CrossRef]
  34. Hsu, C.Y.; Wu, R.M. Effect of overflow depth of a hydrocyclone on particles separation. Dry. Technol. 2010, 28, 916–921. [Google Scholar] [CrossRef]
  35. Hsieh, K.T.; Rajamani, R.K. Mathematical model of the hydrocyclone based on physics of fluid flow. AIChE J. 1991, 37, 735–746. [Google Scholar] [CrossRef]
  36. Cilliers, J.J.; Harrison, S.T.L. The application of mini-hydrocyclones in the concentration of yeast suspensions. Chem. Eng. J. 1997, 65, 21–26. [Google Scholar] [CrossRef]
Sample Availability: Samples of the compounds are not available from the authors.
Figure 1. Transient development of air core structure in the hydrocyclone separator system obtained from CFD simulations.
Molecules 24 01116 g001
Figure 2. Water volume fraction at Z = 0.125 m.
Molecules 24 01116 g002
Figure 3. Vertical velocity at Z = 0.125 m.
Molecules 24 01116 g003
Figure 4. Filtrate obtained for MHC.
Molecules 24 01116 g004
Figure 5. Six release positions in the hydrocyclone.
Molecules 24 01116 g005
Figure 6. Particle trajectory of size 1, 5, 10, and 15 μm in three hydrocyclones. (a) THC; (b) SHC; and (c) MHC.
Molecules 24 01116 g006
Figure 7. Separation efficiency curve for three hydrocyclones under an inlet pressure of 4 bar.
Molecules 24 01116 g007
Figure 8. Overall separation efficiency for three hydrocyclones under different inlet pressures.
Molecules 24 01116 g008
Figure 9. Silicon carbide powder cumulative size distribution used in the experiments.
Molecules 24 01116 g009
Figure 10. Hydrocyclone separator system experimental setup. The various components include a centrifugal pump, storage tank, agitator, pressure gauges (P1, P2, P3), recycle valve (V3), inlet valve (V1), overflow valve (V4), underflow valve (V2), and the hydrocyclone separator.
Molecules 24 01116 g010
Figure 11. Hydrocyclone separator system geometry used for both computational fluid dynamics (CFD) simulations and experiments. (a) THC; (b) SHC; (c) MHC.
Molecules 24 01116 g011aMolecules 24 01116 g011bMolecules 24 01116 g011c
Figure 12. Hydrocyclone separator system mesh structure. The total number of computational cells was approximately 105.
Molecules 24 01116 g012
Table 1. Outlet concentration of various hydrocyclones.
Origin = 0.35 wt %
Pressure (Bar)Over (wt %)Under (wt %)Filtration (wt %)
THC20.3240.405-
40.3010.416
SHC20.2950.423-
40.2360.590
MHC20.3210.8210.004
40.2111.3050.008

