
Novel Photocatalytic Nanocomposite Made of Polymeric Carbon Nitride and Metal Oxide Nanoparticles


 , ,
, ,  and
and 
Abstract
1. Introduction
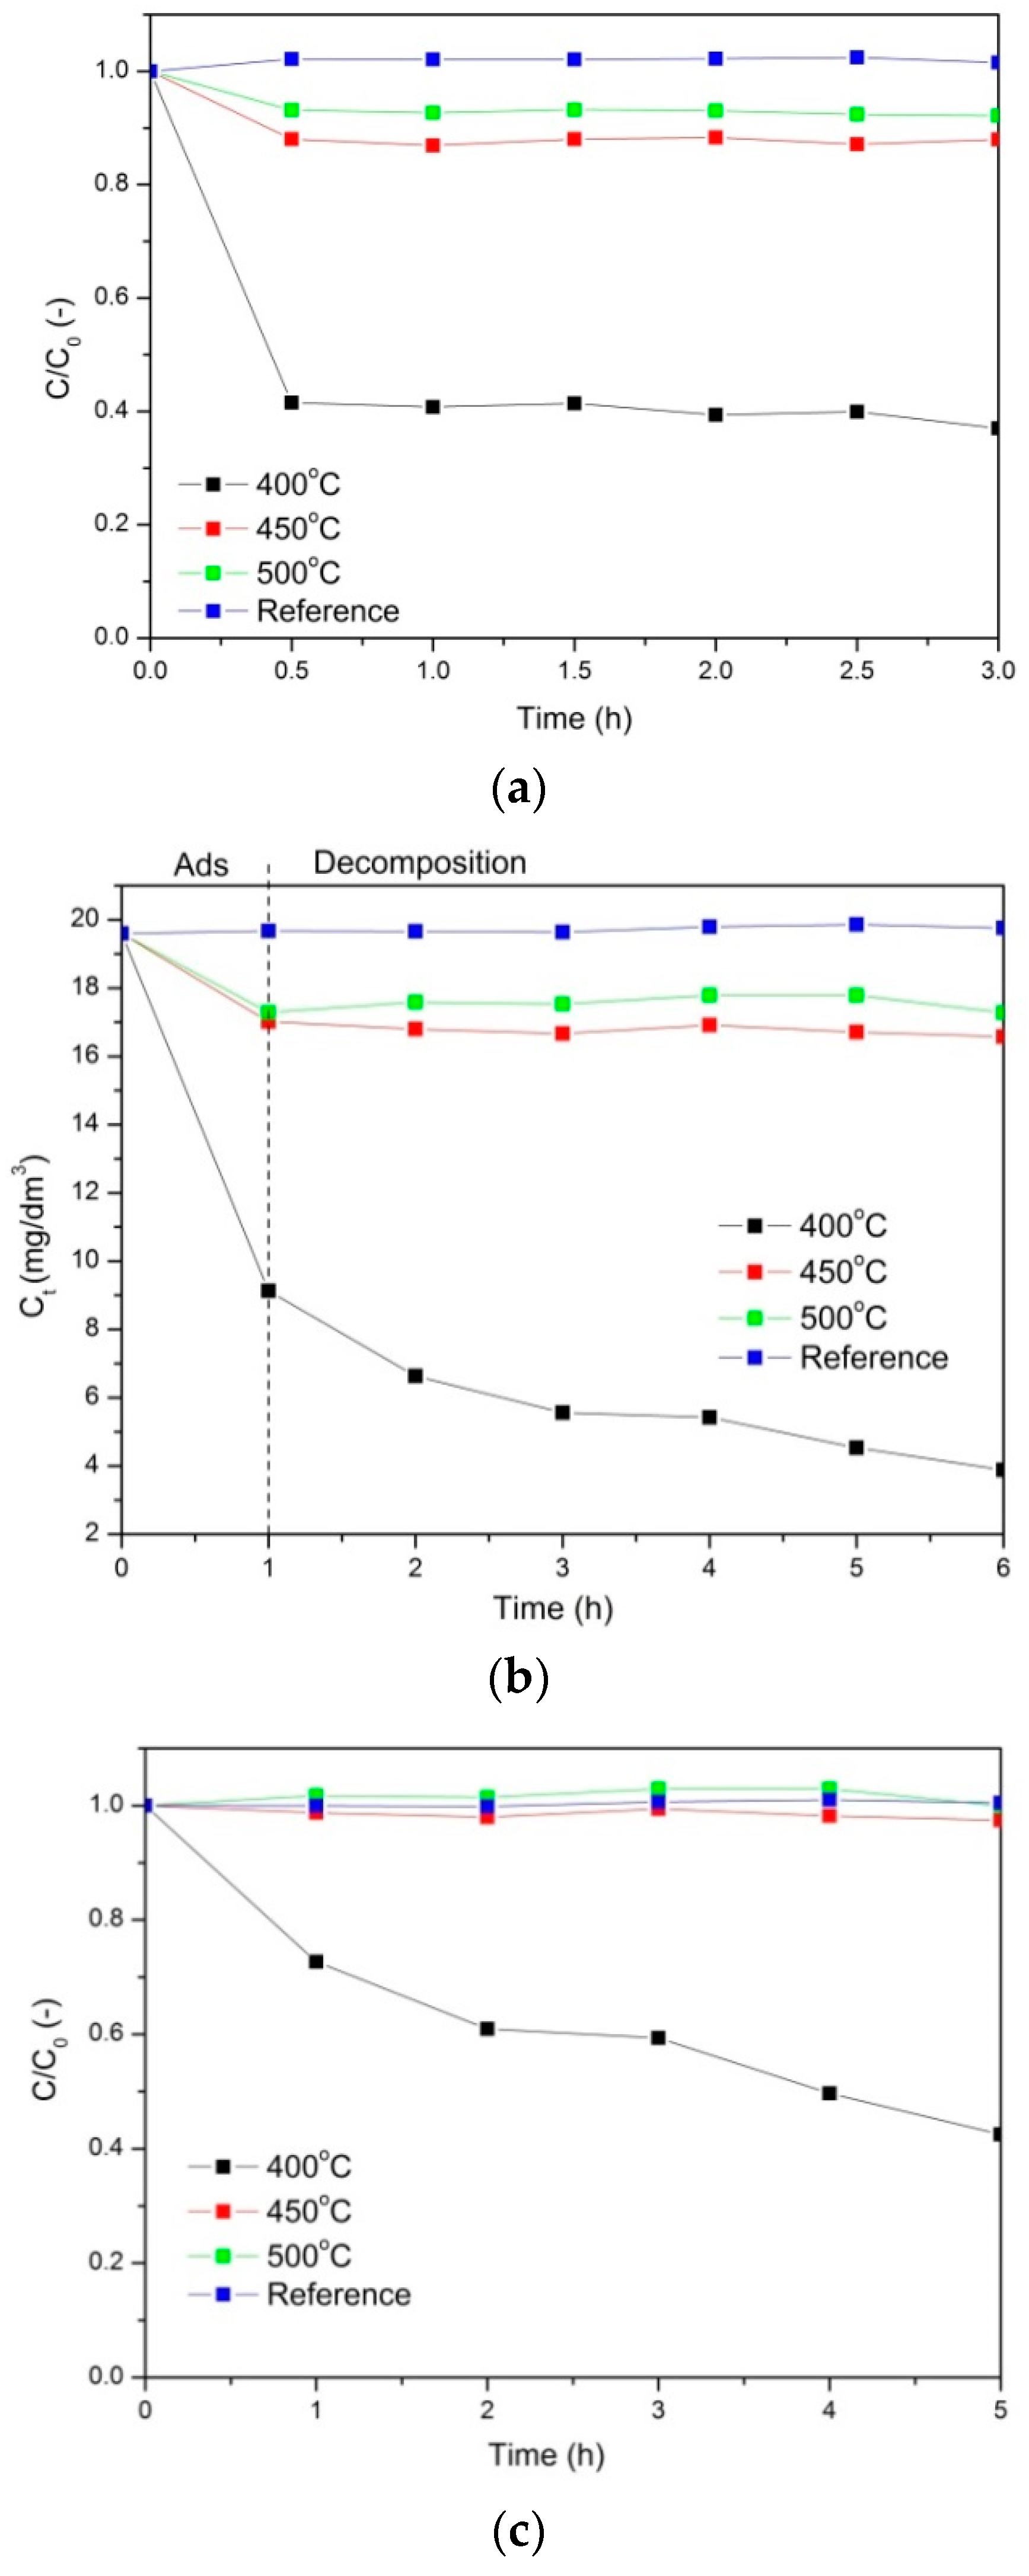
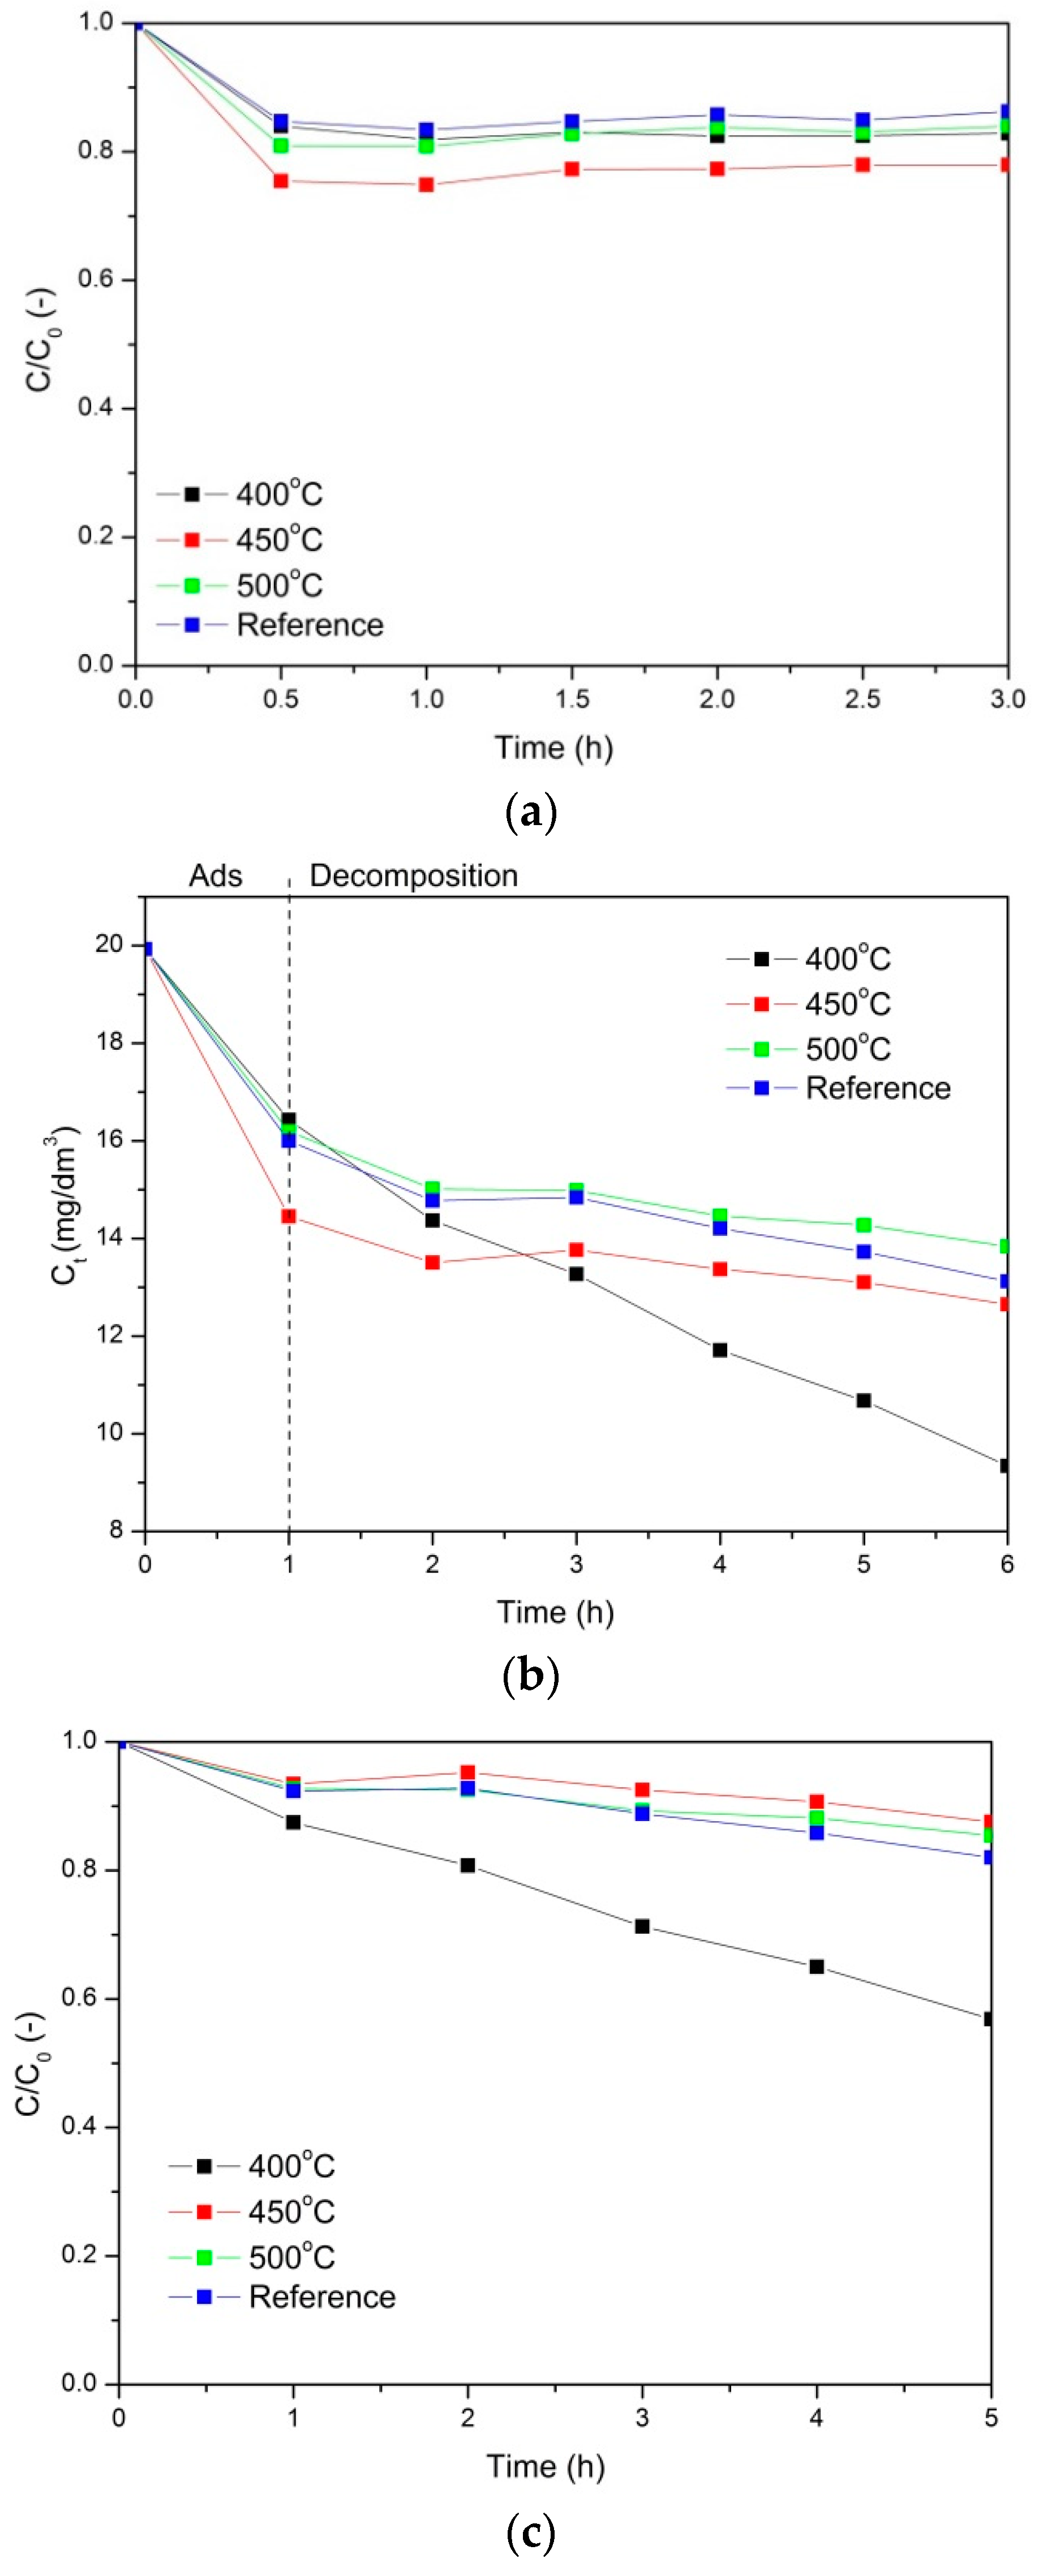
2. Results
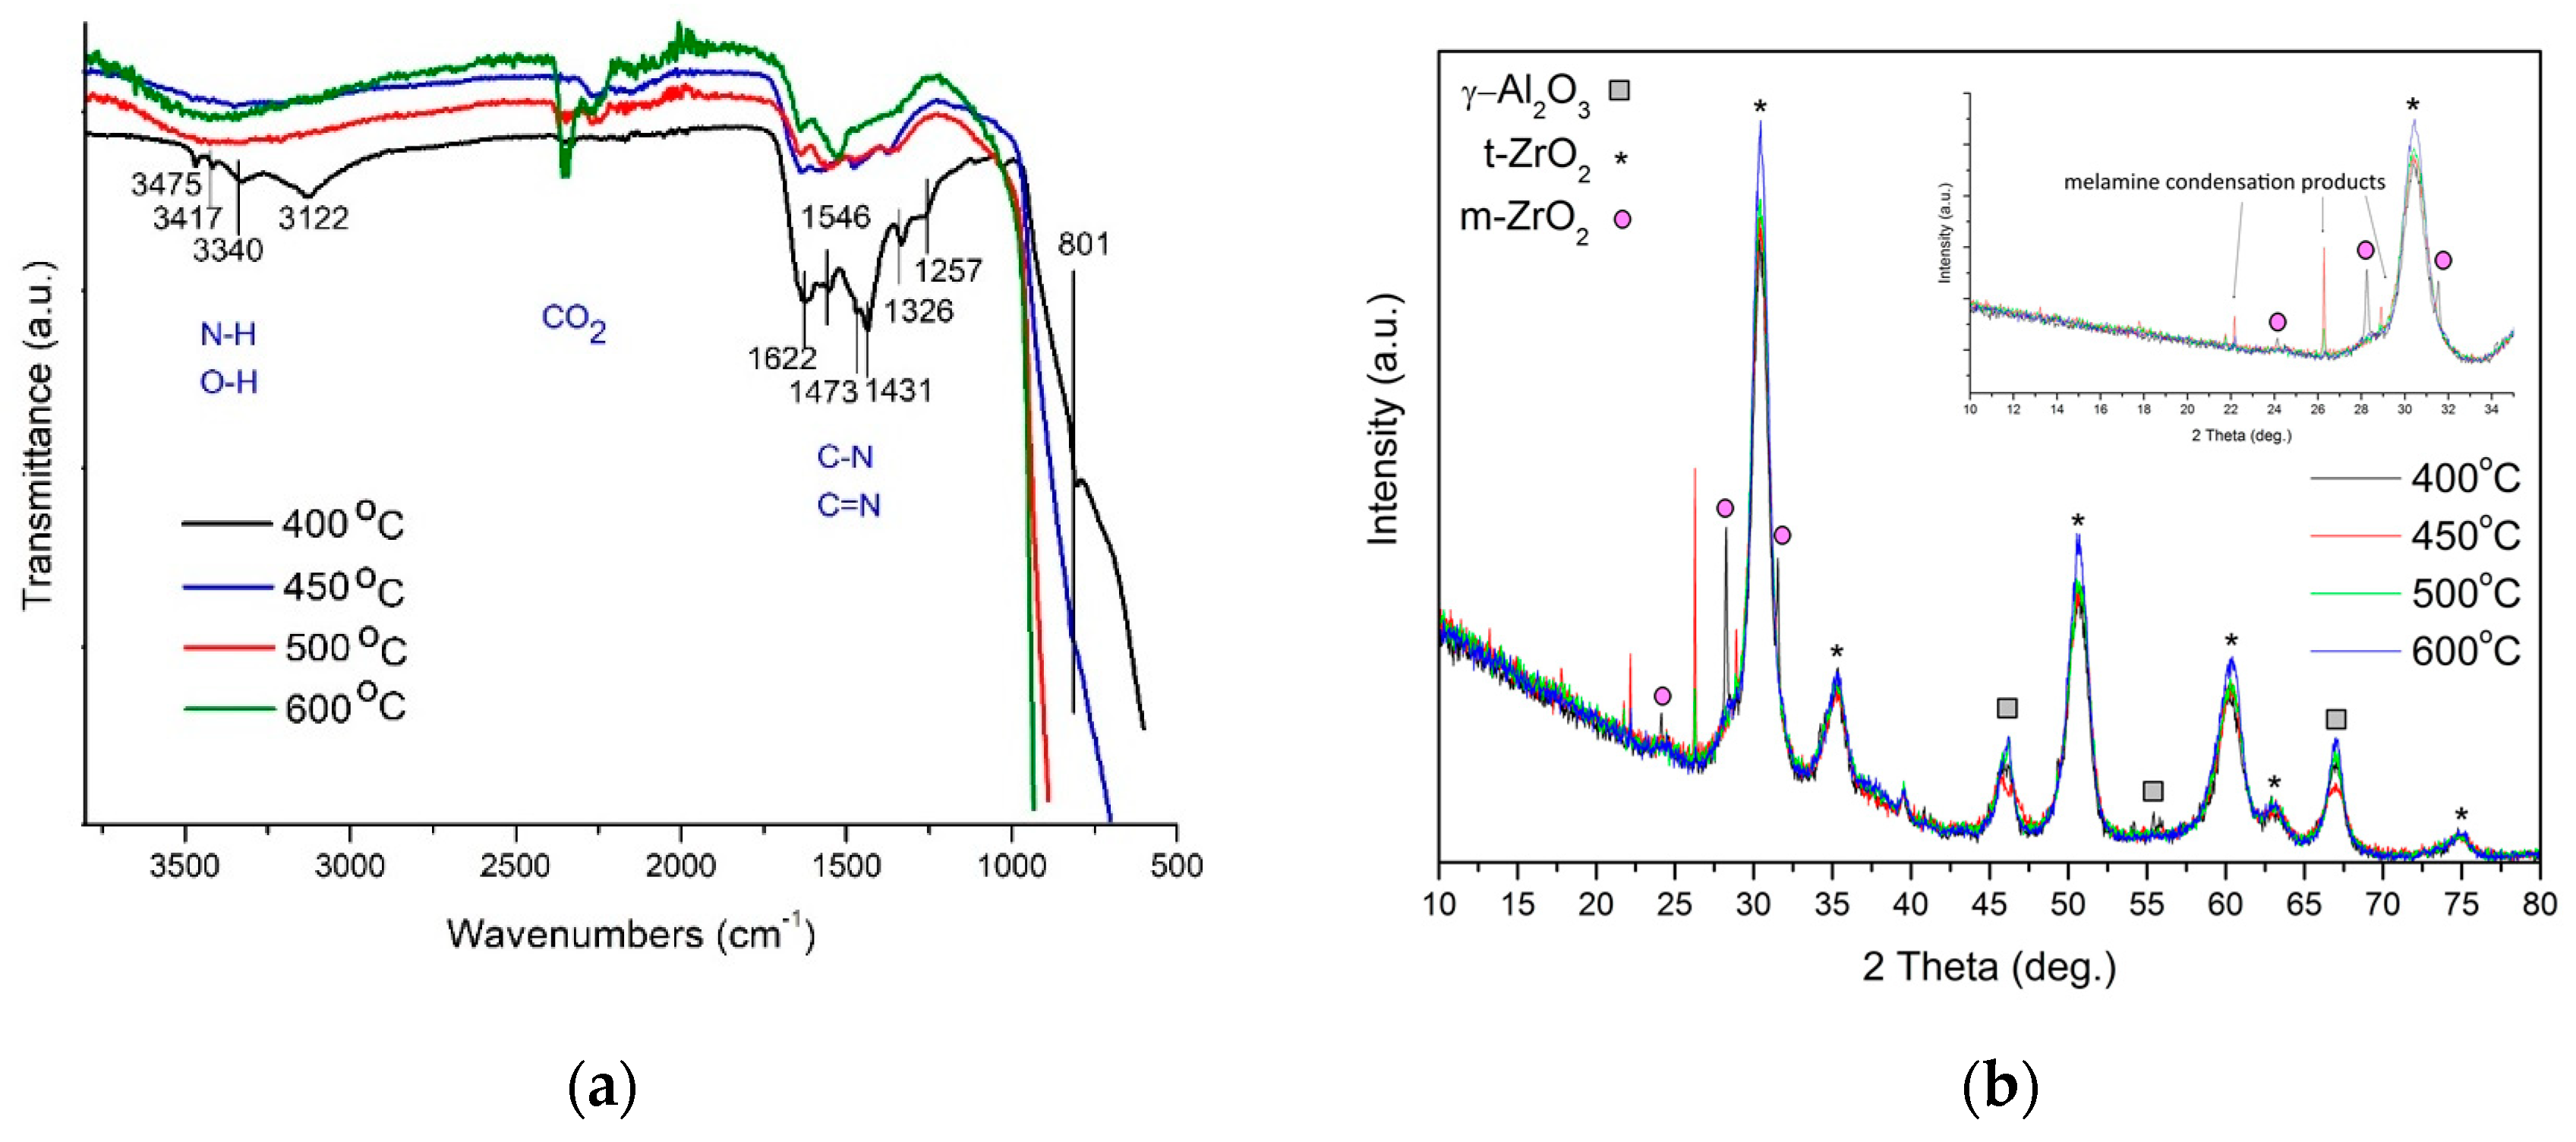
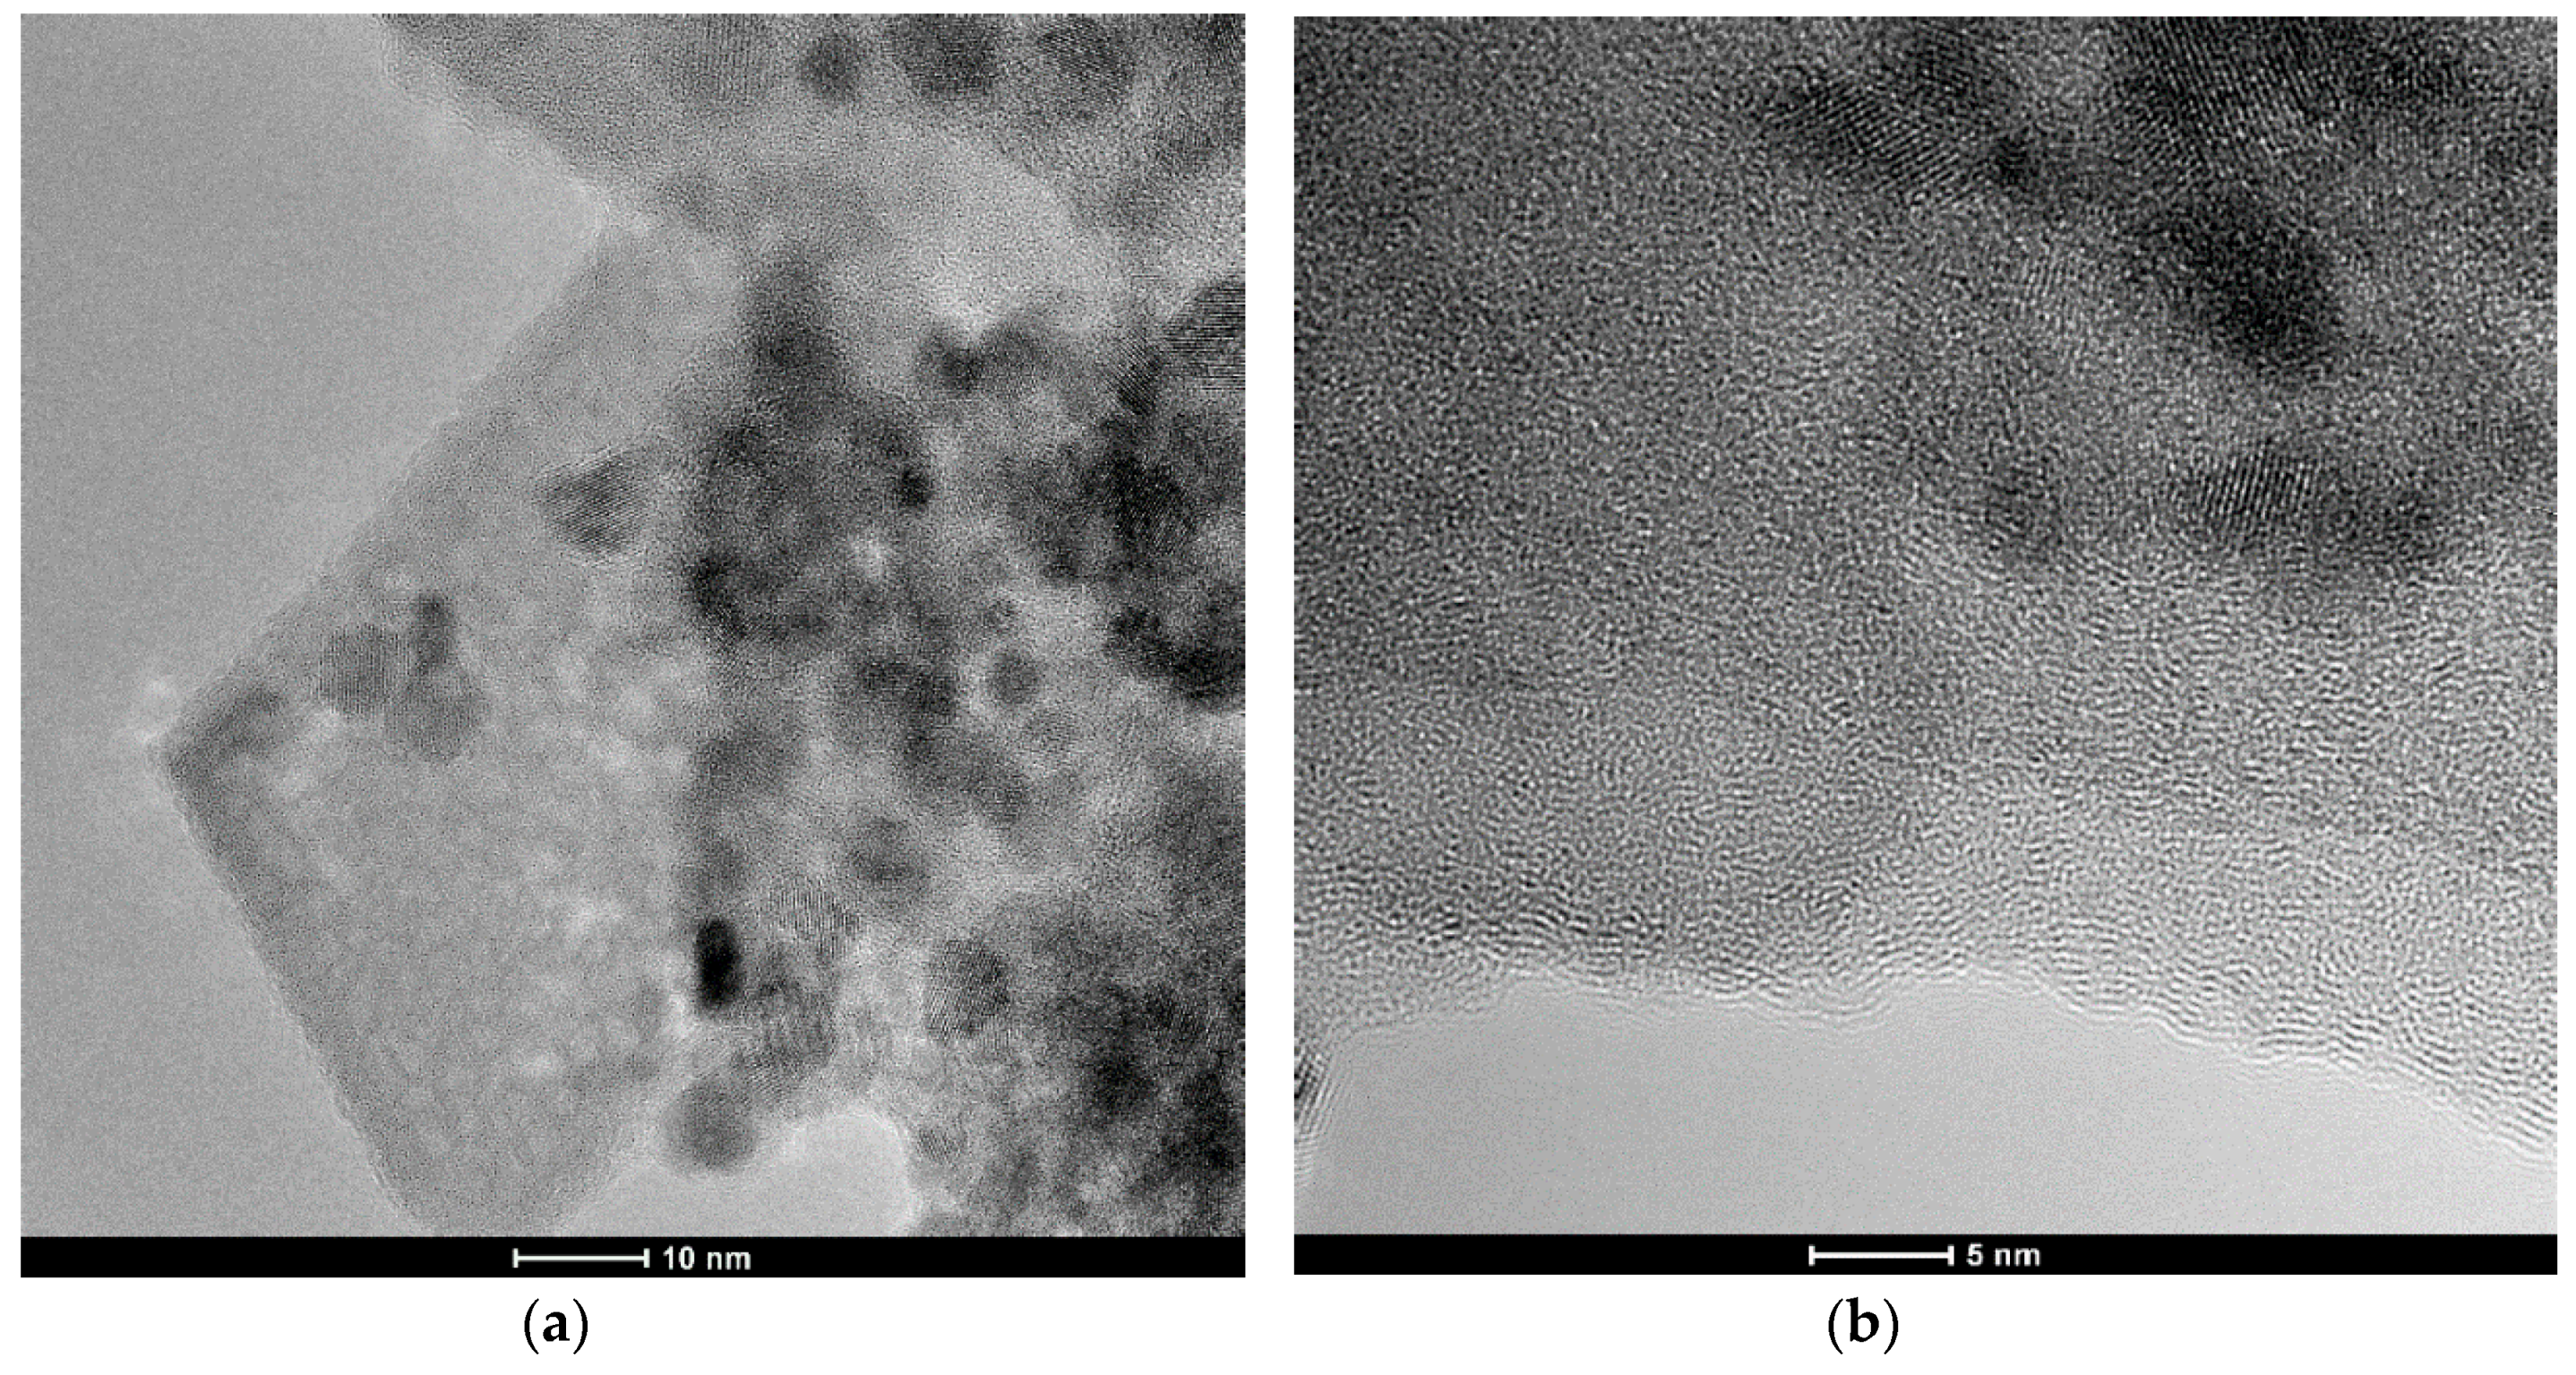
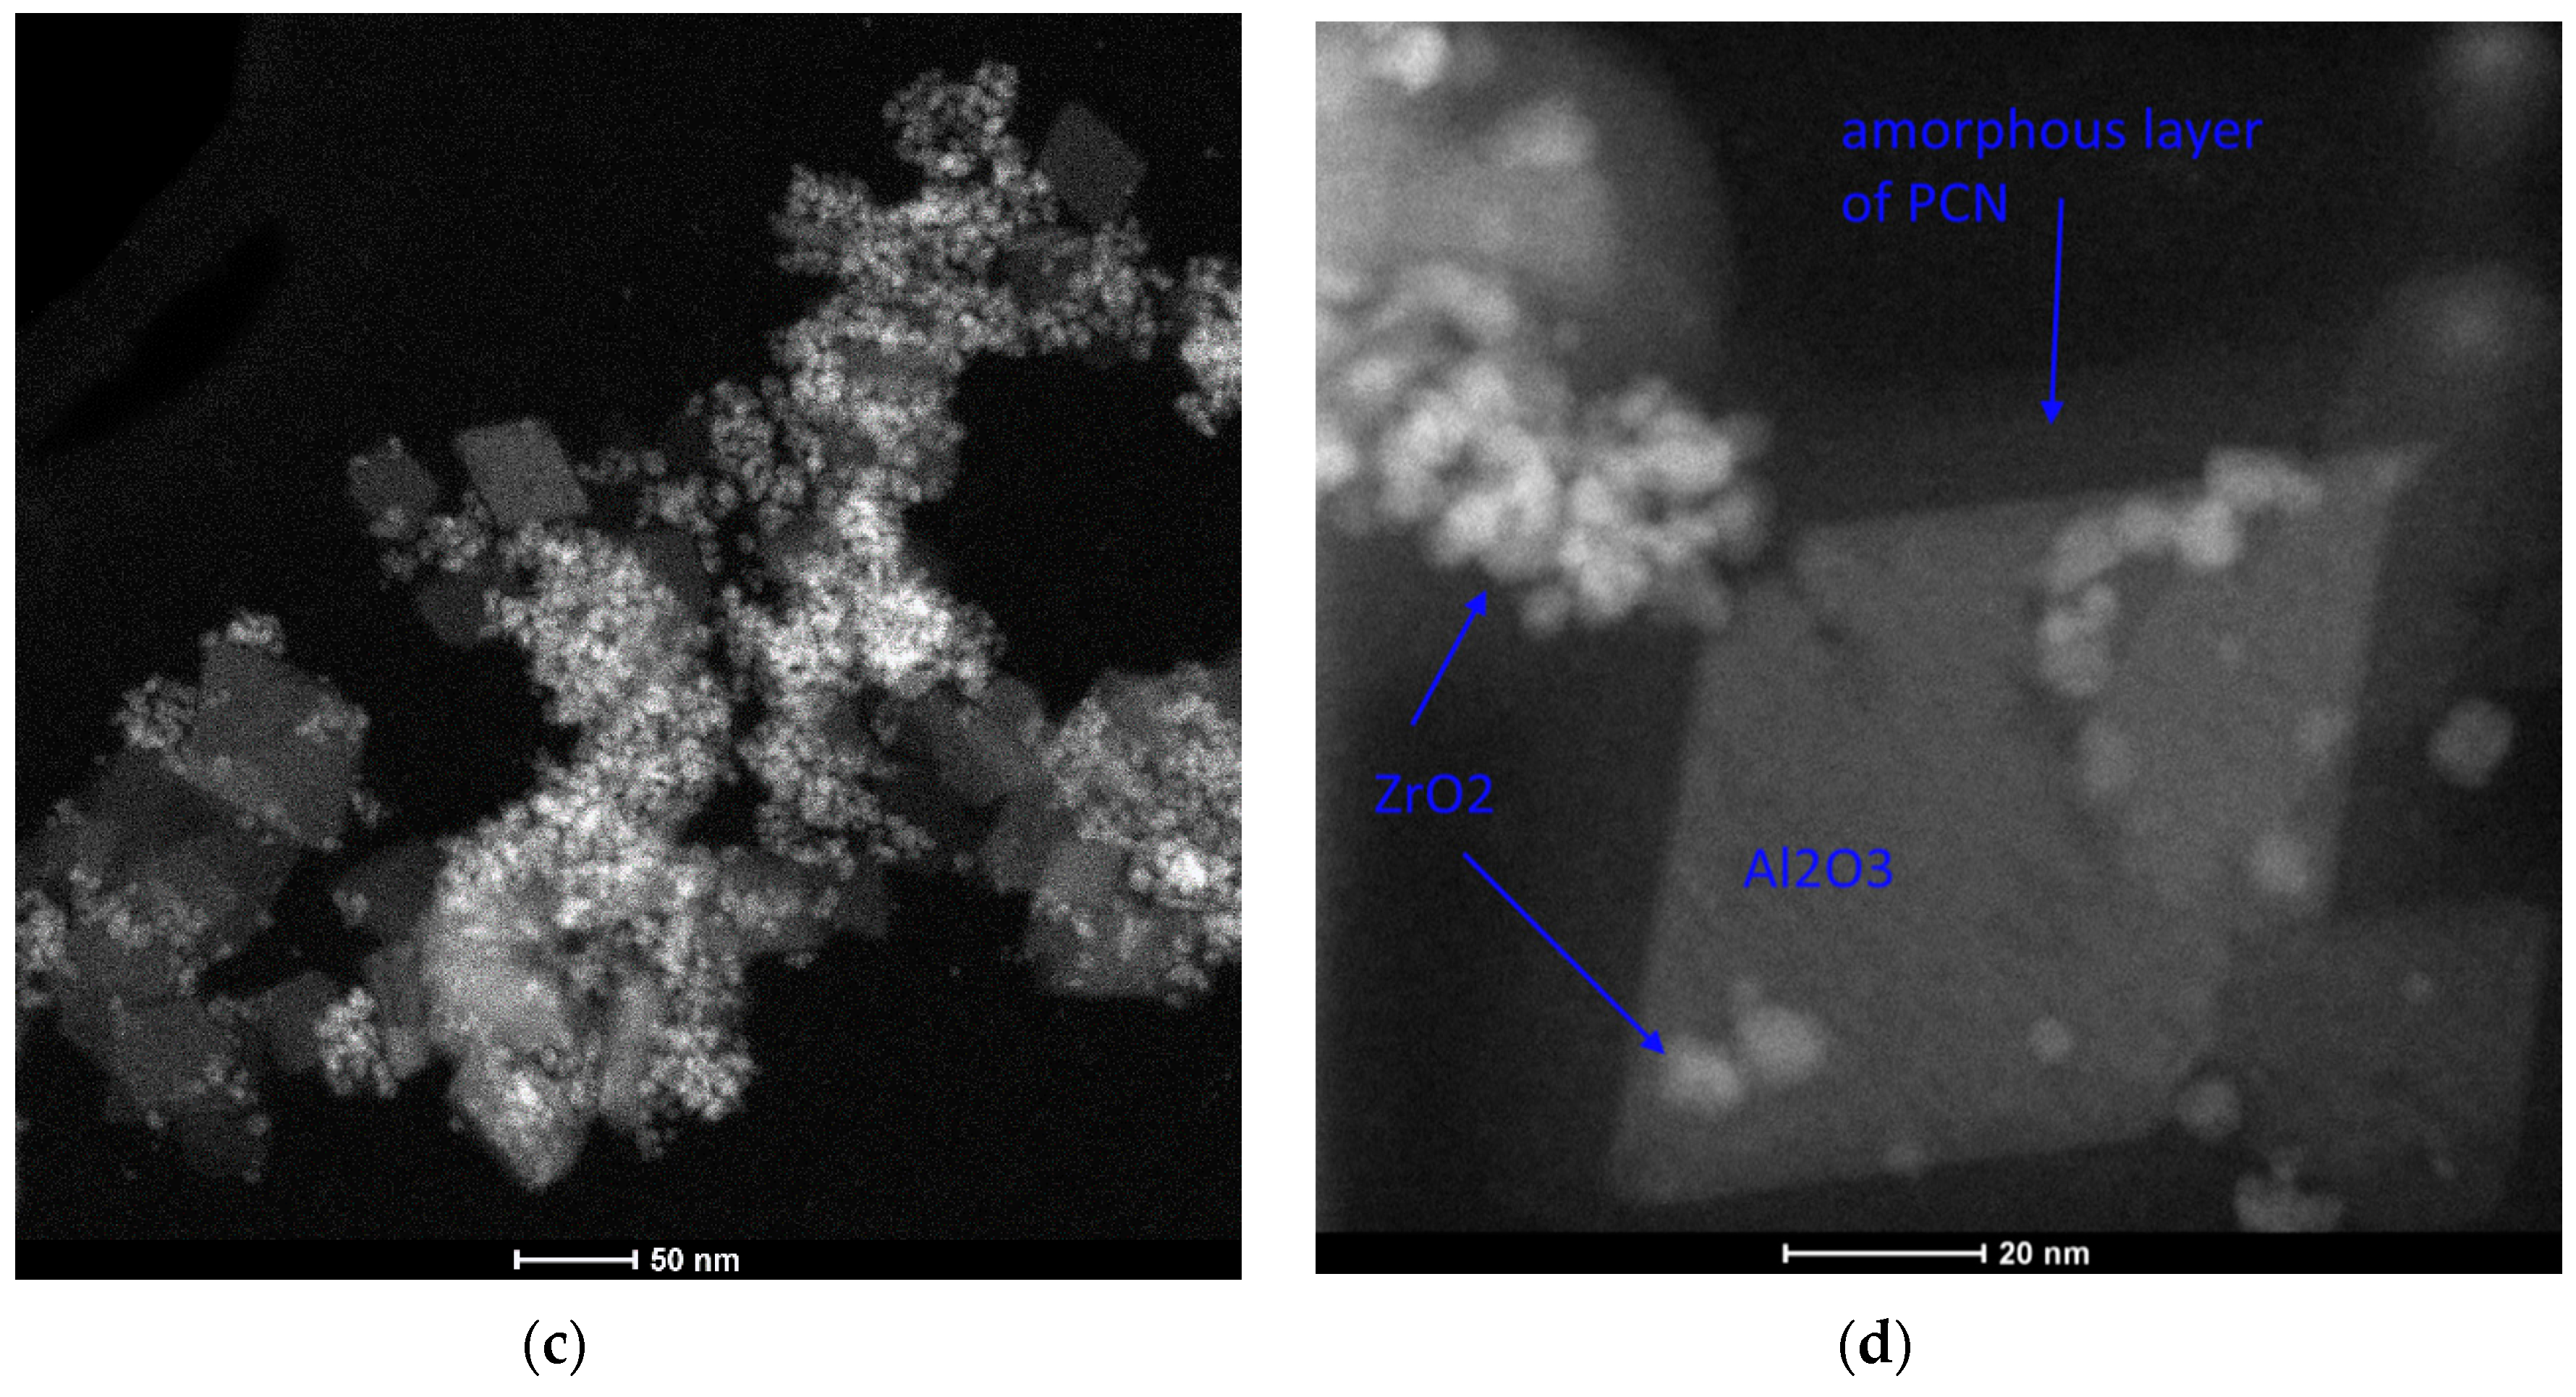
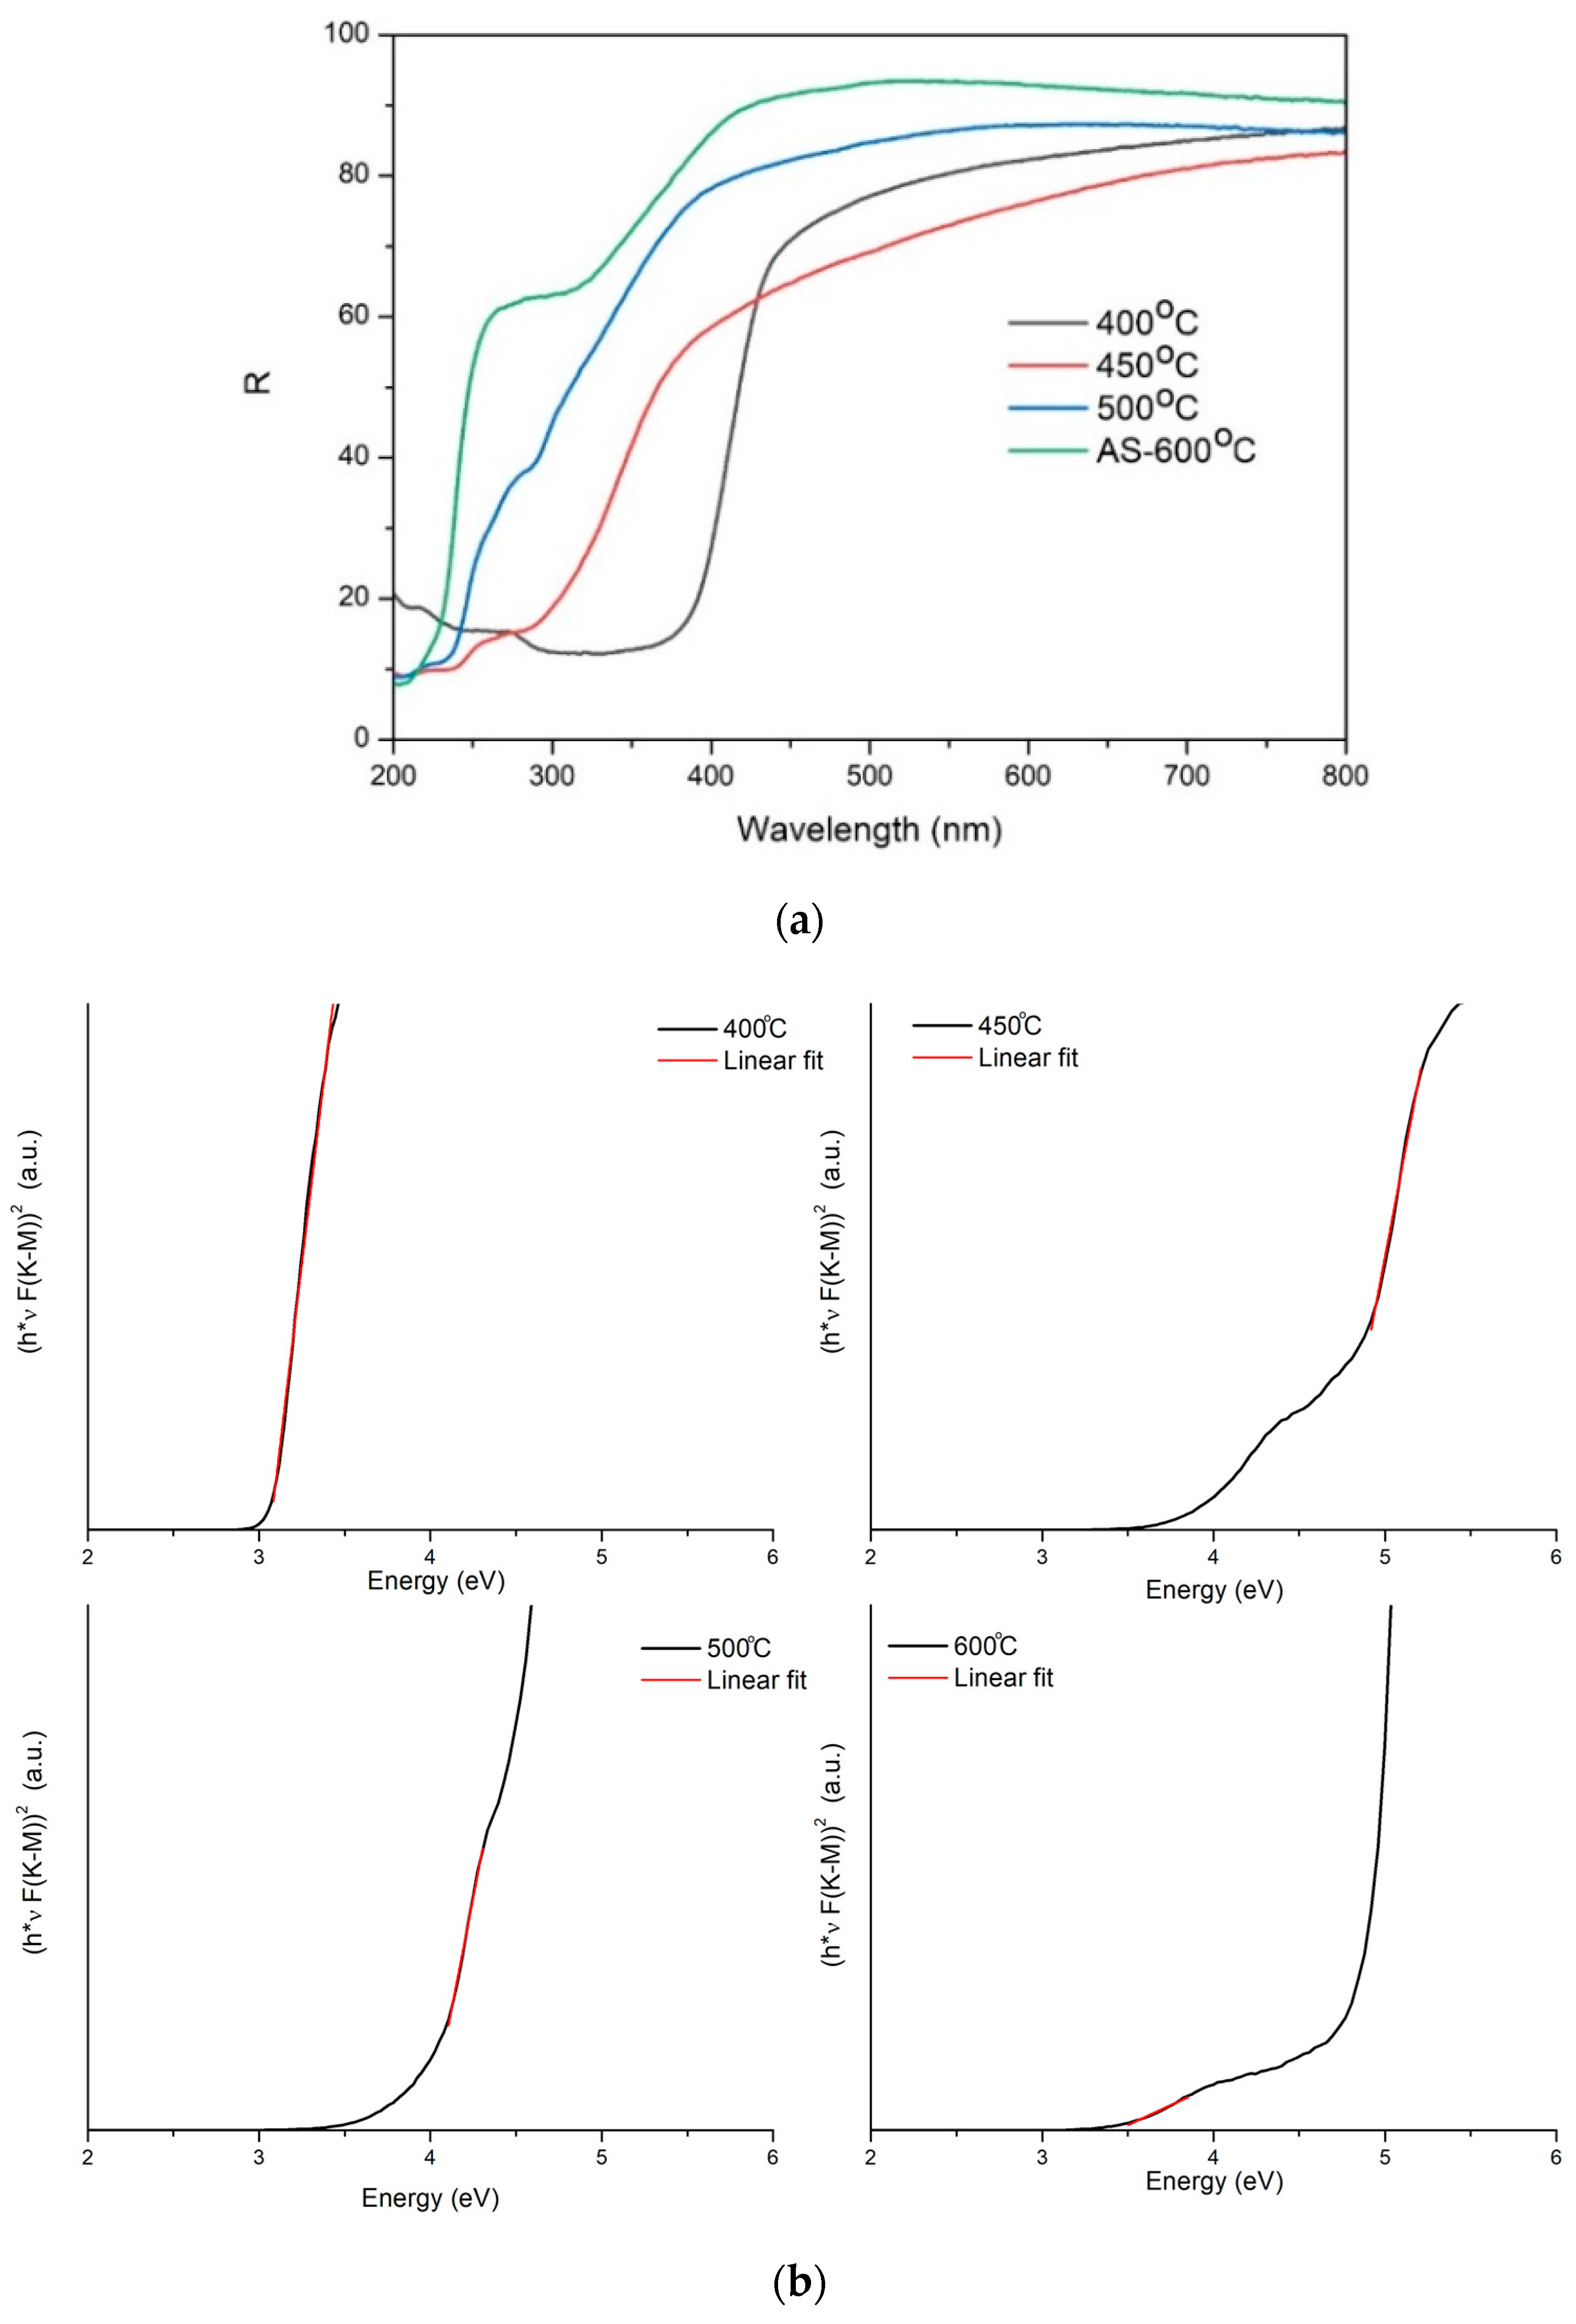
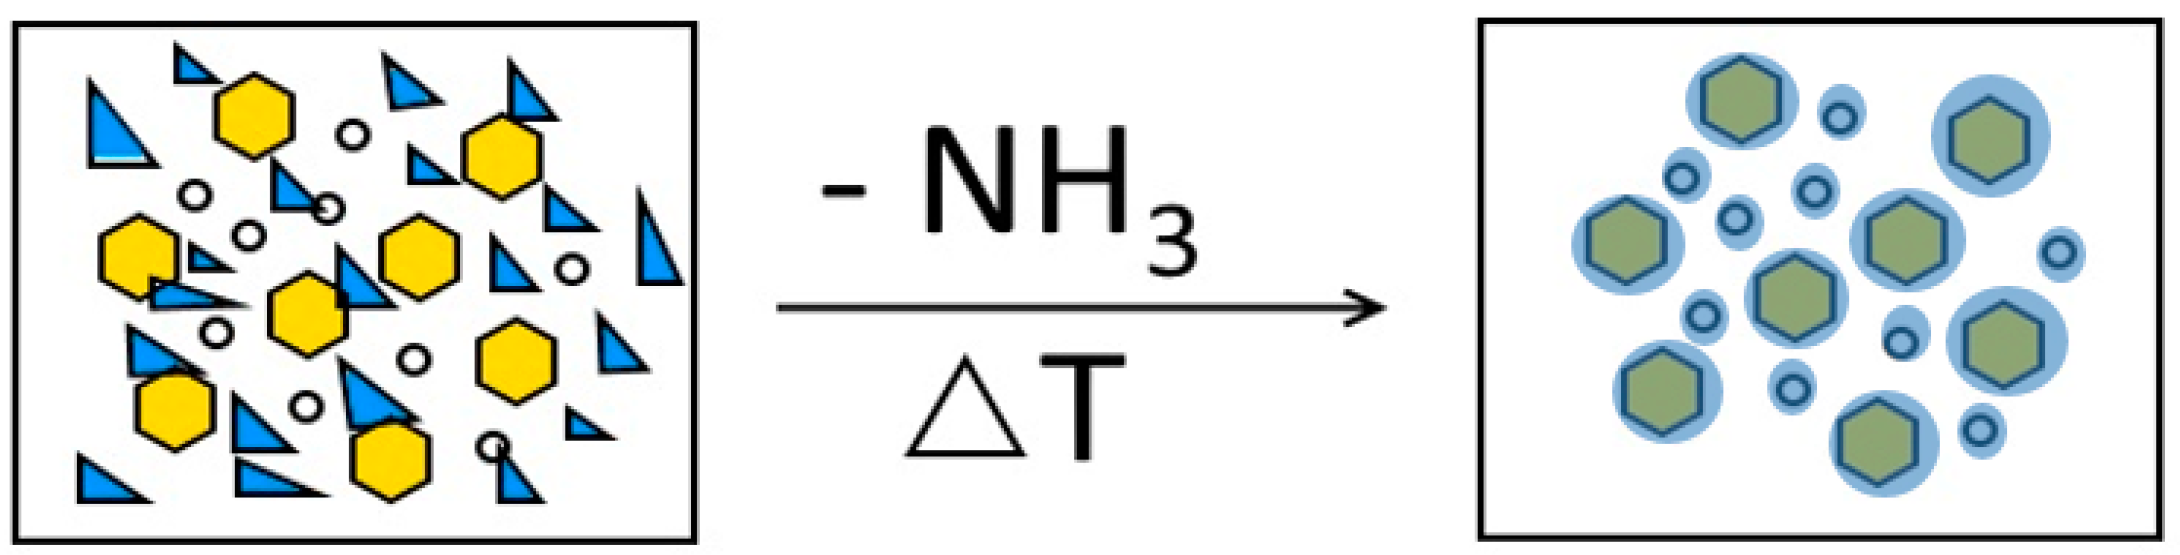
Nanocomposite Characterization
3. Discussion
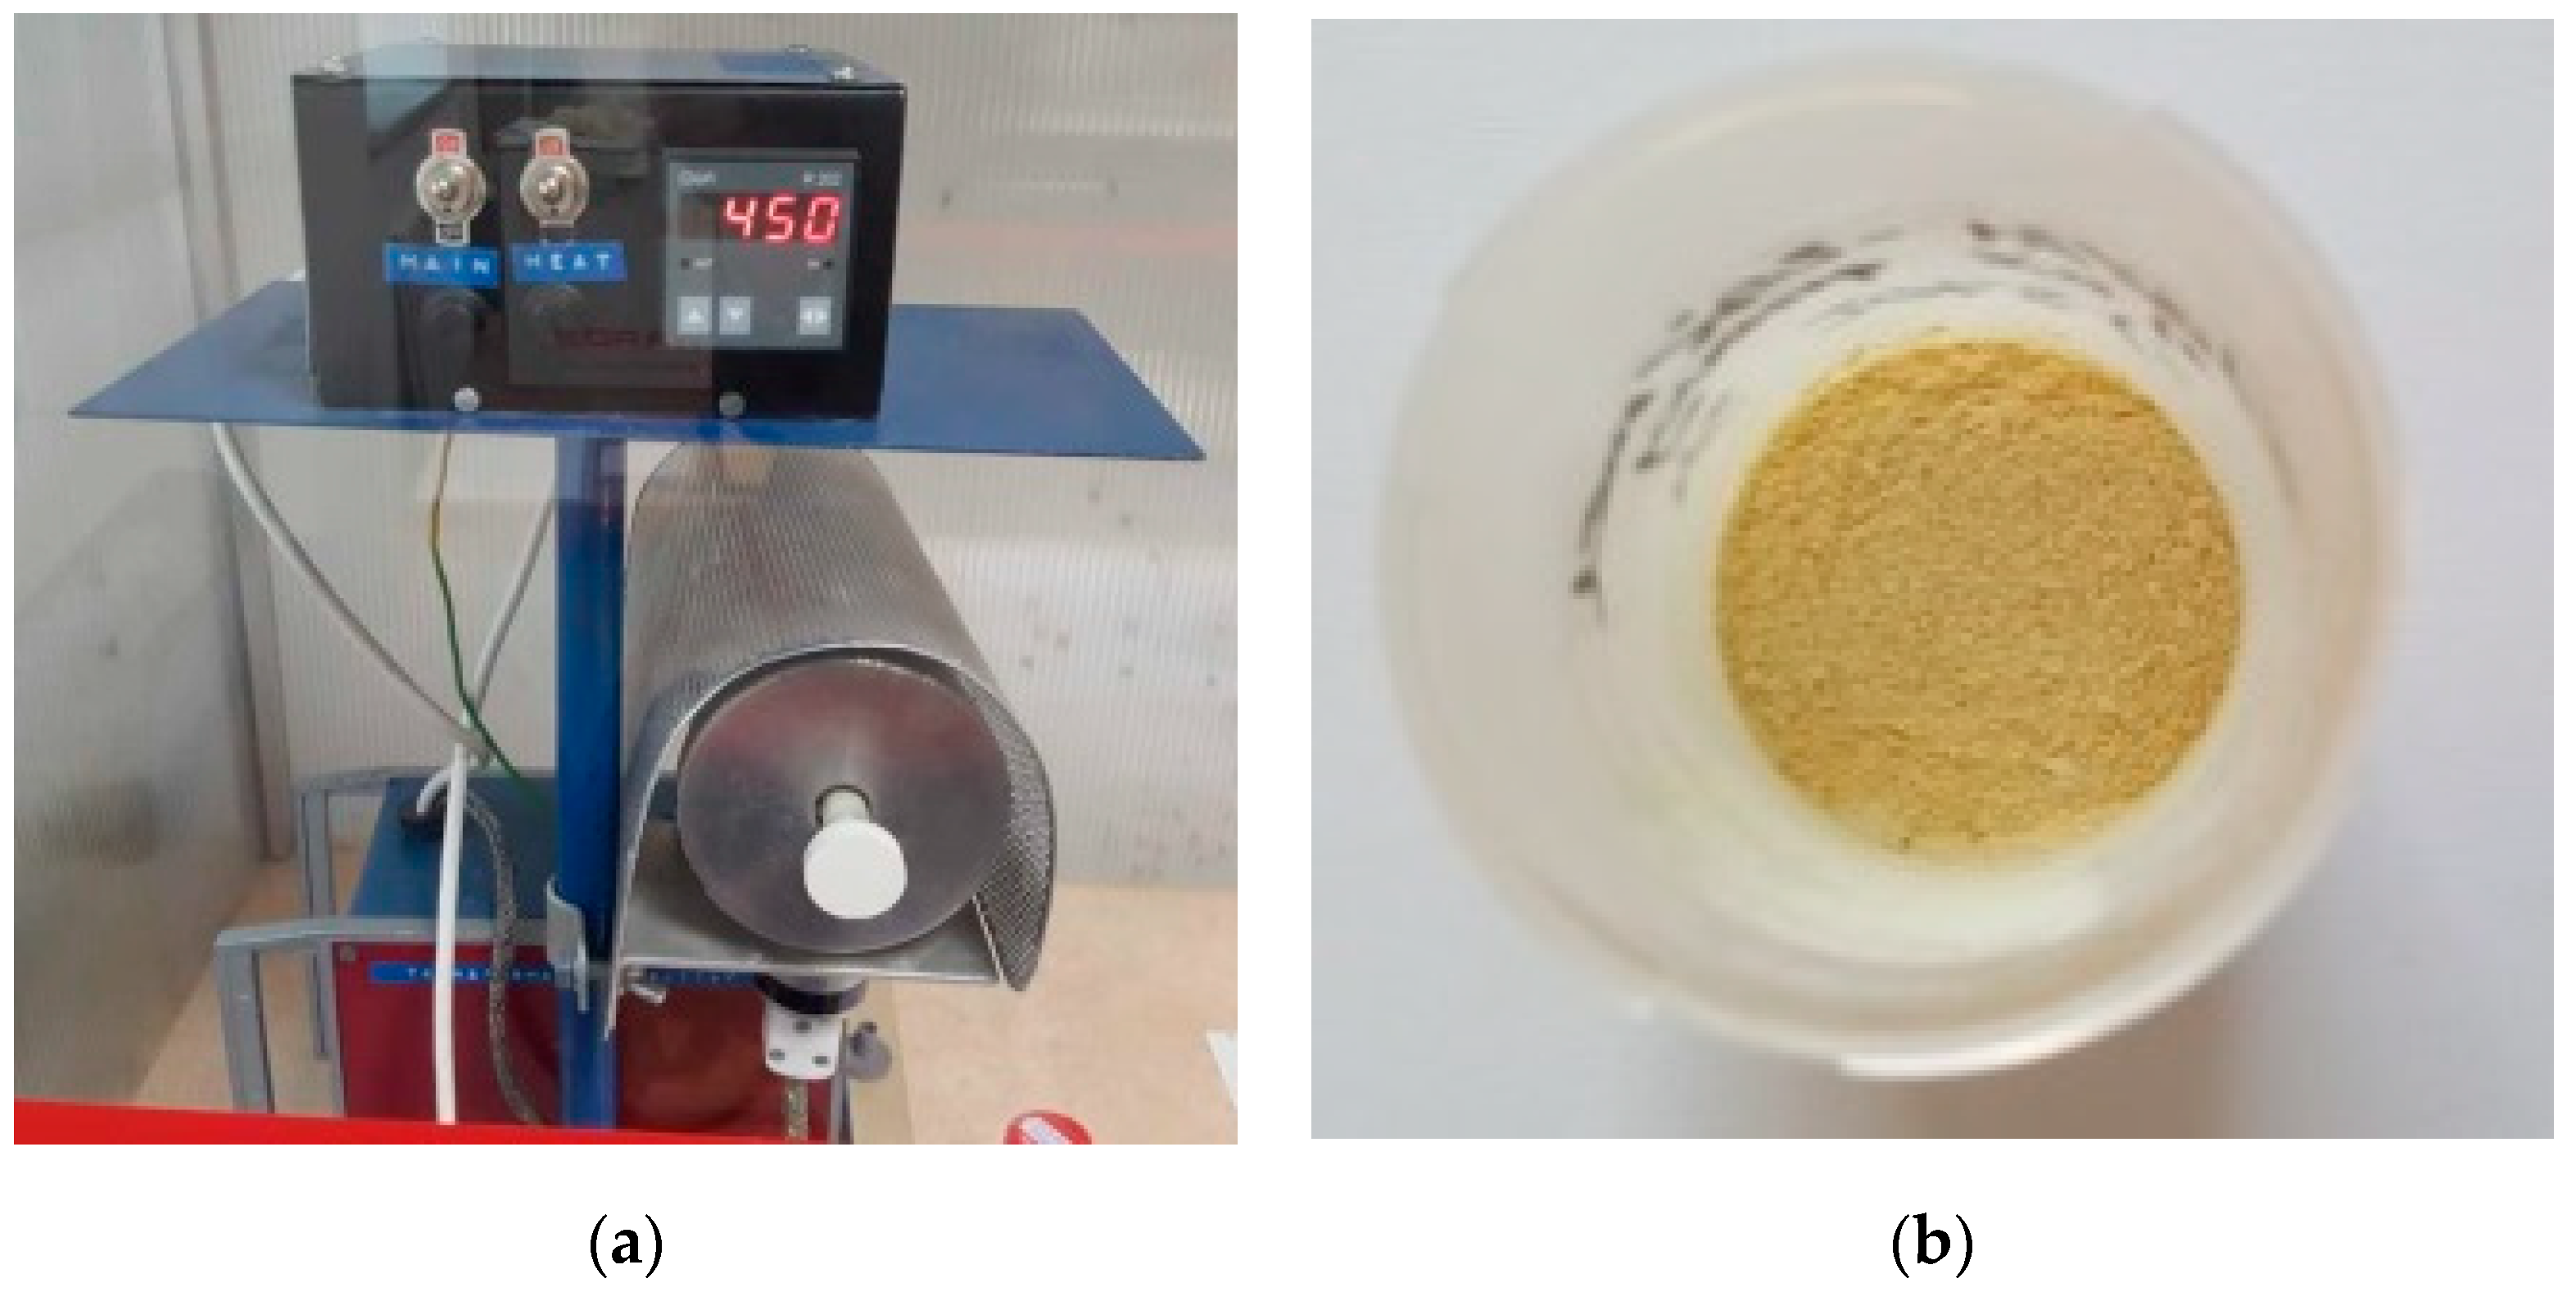
4. Materials and Methods
5. Conclusions
Author Contributions
Funding
Acknowledgments
Conflicts of Interest
References
- Vattikuti, S.V.P.; Byon, C. Hydrothermally synthesized ternary heterostructured MoS2/Al2O3/g-C3N4 photocatalyst. Mater. Res. Bull. 2017, 96, 233–245. [Google Scholar] [CrossRef]
- Chen, J.; Garcia, E.D.; Oliviero, E.; Oliviero, L.; Maugé, F. Effect of high pressure sulfidation on the morphology and reactivity of MoS2 slabs on MoS2/Al2O3 catalyst prepared with citric acid. J. Catal. 2016, 339, 153–162. [Google Scholar] [CrossRef]
- Reddy, P.A.K.; Reddy, P.V.L.; Kwon, E.; Kim, K.; Akter, T.; Kalagara, S. Recent advances in photocatalytic treatment of pollutants in aqueous media. Environ. Int. 2016, 91, 94–103. [Google Scholar] [CrossRef] [PubMed]
- Li, H.; Yin, S.; Wang, Y.; Sekino, T.; Lee, S.W.; Sato, T. Roles of Cr3+ doping and oxygen vacancies in SrTiO3 photocatalysts with high visible light activity for NO removal. J. Catal. 2013, 297, 65–69. [Google Scholar] [CrossRef]
- Aman, N.; Das, N.N.; Mishra, T. Effect of N-doping on visible light activity of TiO2–SiO2 mixed oxide photocatalysts. J. Environ. Chem. Eng. 2016, 4, 191–196. [Google Scholar] [CrossRef]
- Yu, W.; Zhang, J.; Peng, T. New insight into the enhanced photocatalytic activity of N-, C- and S-doped ZnO photocatalysts. Appl. Catal. B Environ. 2016, 181, 220–227. [Google Scholar] [CrossRef]
- Ge, L.; Han, C.; Xiao, X.; Guo, L.; Li, Y. Enhanced visible light photocatalytic hydrogen evolution of sulfur-doped polymeric g-C3N4 photocatalysts. Mater. Res. Bull. 2013, 48, 3919–3925. [Google Scholar] [CrossRef]
- Song, Y.; Wei, S.; Rong, Y.; Lu, C.; Chen, Y.; Wang, J.; Zhang, Z. Enhanced visible light photocatalytic hydrogen evolution activity of Er3+:Y3Al5O12/PdSeZnS by conduction band co-catalysts (MoO2, MoS2 and MoSe2). Int. J. Hydrogen Energy 2016, 41, 12826–12835. [Google Scholar] [CrossRef]
- Jin, C.; Liu, G.; Zu, L.; Qin, Y.; Yang, J. Preparation of Ag@Ag3PO4@ZnO ternary heterostructures for photocatalytic studies. J. Colloid Interface Sci. 2015, 453, 36–41. [Google Scholar] [CrossRef] [PubMed]
- Wang, X.; Maeda, K.; Thomas, A.; Takanabe, K.; Xin, G.; Carlsson, J.M.; Domen, K.; Antonietti, M. A metal-free polymeric photocatalyst for hydrogen production from water under visible light. Nat. Mater. 2009, 8, 76–80. [Google Scholar] [CrossRef] [PubMed]
- Kessler, F.K.; Zheng, Y.; Schwarz, D.; Merschjann, C.; Schnick, W.; Wang, X.; Bojdys, M.J. Functional carbon nitride materials design strategies for electrochemical Devices. Nat. Rev. Mater. 2017, 2, 1–17. [Google Scholar] [CrossRef]
- Duan, J.; Chen, S.; Jaroniec, M.; Qiao, S. Porous C3N4 nanolayers@N-graphene films as catalyst electrodes for highly efficient hydrogen evolution. ACS Nano 2015, 9, 931–940. [Google Scholar] [CrossRef] [PubMed]
- Ye, S.; Wang, R.; Wu, M.Z.; Yuan, Y.P. A review on g-C3N4 for photocatalytic water splitting and CO2 reduction. Appl. Surf. Sci. 2015, 358, 15–27. [Google Scholar] [CrossRef]
- Wen, J.; Xie, J.; Chen, X.; Li, X. A review on g-C3N4-based photocatalysts. Appl. Surf. Sci. 2017, 391, 72–123. [Google Scholar] [CrossRef]
- Ma, T.; Dai, S.; Jaroniec, M.; Qiao, S. Graphitic carbon nitride nanosheet-carbon nanotube three-dimensional porous composites as high-performance oxygen evolution electrocatalysts. Angew. Chem. Int. Ed. 2014, 53, 7281–7285. [Google Scholar] [CrossRef] [PubMed]
- Wang, X.; Liu, C.; Li, X.-L.; Li, F.-T.; Li, Y.-P.; Zhao, J.; Liu, R.-H. Construction of g-C3N4/Al2O3 hybrids via in-situ acidification and exfoliation with enhanced photocatalytic activity. Appl. Surf. Sci. 2017, 394, 340–350. [Google Scholar] [CrossRef]
- Feng, D.; Cheng, Y.; He, J.; Zheng, L.; Shao, D.; Wang, W.; Wang, W.; Lu, F.; Dong, H.; Liu, H.; et al. Enhanced photocatalytic activities of g-C3N4 with large specific surface area via a facile one-step synthesis process. Carbon 2017, 125, 454–463. [Google Scholar] [CrossRef]
- Li, S.; Wang, Z.; Wang, X.; Sun, F.; Gao, K.; Hao, N. Orientation controlled preparation of nanoporous carbon nitride fibers and related composite for gas sensing under ambient conditions. Nano Res 2017, 10, 1710–1719. [Google Scholar] [CrossRef]
- Sun, J.; Zhang, J.; Zhang, M.; Antonietti, M.; Fu, X.; Wang, X. Bioinspired hollow semiconductor nanospheres as photosynthetic nanoparticles. Nat. Commun. 2012, 3, 1139–1145. [Google Scholar] [CrossRef]
- Li, X.; Zhang, J.; Chen, X.; Fischer, A.; Thomas, A.; Antonietti, M. Condensed graphitic carbon nitride nanorods by nanoconfinement: Promotion of crystallinity on photocatalytic conversion. Chem. Mater. 2011, 23, 4344–4348. [Google Scholar] [CrossRef]
- Li, X.; Wang, X.; Antonietti, M. Mesoporous g-C3N4 nanorods as multifunctional supports of ultrafine metal nanoparticles: Hydrogen generation from water and reduction of nitrophenol with tandem catalysis in one step. Chem. Sci. 2012, 3, 2170–2174. [Google Scholar] [CrossRef]
- Hu, M.; Reboul, J.; Furukawa, S.; Radhakrishnan, L.; Zhang, Y.; Srinivasu, P.; Iwai, H.; Wang, H.; Nemoto, Y.; Suzuki, N.; et al. Direct synthesis of nanoporous carbon nitride fibers using Al-based porous coordination polymers (Al-PCPs). Chem. Commun. 2011, 47, 8124–8126. [Google Scholar] [CrossRef] [PubMed]
- Koltsov, I.; Smalc-Koziorowska, J.; Przesniak-Welenc, M.; Małysa, M.; Kimmel, G.; McGlynn, J.; Ganin, A.; Stelmakh, S. Mechanism of Reduced Sintering Temperature of Al2O3–ZrO2 Nanocomposites Obtained by Microwave Hydrothermal Synthesis. Materials 2018, 11, 829. [Google Scholar] [CrossRef] [PubMed]
- Malka, I.E.; Danelska, A.; Kimmel, G. The Influence of Al2O3 Content on ZrO2-Al2O3 Nanocomposite Formation—The Comparison between Sol-Gel and Microwave Hydrothermal Methods. Mater. Today Proc. 2016, 3, 2713–2724. [Google Scholar] [CrossRef]
- Koltsov, I.; Przesniak-Welenc, M.; Wojnarowicz, J.; Rogowska, A.; Mizeracki, J.; Malysa, M.; Kimmel, G. Thermal and physical properties of ZrO2–AlO(OH) nanopowders synthesised by microwave hydrothermal method. J. Therm. Anal. Calorim. 2017, 131, 2273–2284. [Google Scholar] [CrossRef]
- He, J.; Sun, H.; Indrawirawan, S.; Duan, X.; Tade, M.O.; Wang, S. Novel polyoxometalate@g-C3N4 hybrid photocatalysts for degradation of dyes and phenolics. J. Coloid Interf. Sci. 2015, 456, 15–21. [Google Scholar] [CrossRef] [PubMed]
- Opalinska, A.; Malka, I.; Dzwolak, W.; Chudoba, T.; Presz, A.; Lojkowski, W. Size-dependent density of zirconia nanoparticles. Beilstein J. Nanotechnol. 2015, 6, 27–35. [Google Scholar] [CrossRef] [PubMed]
- Wojnarowicz, J.; Chudoba, T.; Koltsov, I.; Gierlotka, S.; Dworakowska, S.; Lojkowski, W. Size control mechanism of ZnO nanoparticles obtained inmicrowave solvothermal synthesis. Nanotechnology 2018, 29, 065601. [Google Scholar] [CrossRef] [PubMed]
- Sano, T.; Tsutsui, S.; Koike, K.; Hirakawa, T.; Teramoto, Y.; Negishi, N.; Takeuchi, K. Activation of graphitic carbon nitride (g-C3N4) by alkaline hydrothermal treatment for photocatalytic NO oxidation in gas phase. J. Mater. Chem. A 2013, 1, 6489. [Google Scholar] [CrossRef]
- Nowak, M.; Kauch, B.; Szperlich, P. Determination of energy band gap of nanocrystalline SbSI using diffuse reflectance spectroscopy. Rev. Sci. Instrum. 2009, 80, 046107. [Google Scholar] [CrossRef] [PubMed]
- Köferstein, R.; Jäger, L.; Ebbinghaus, S.G. Magnetic and optical investigations on LaFeO3 powders with different particle sizes and corresponding ceramics. Solid State Ionics 2013, 249–250, 1–5. [Google Scholar] [CrossRef]
- Kubelka, P.; Munk, F. Ein Beitrag zur Optik der Farbanstriche. Zeitschrift für Technische Physik 1931, 12, 593–601. [Google Scholar]
- Philips-Invernizzi, B.; Dupont, D.; Caze, C. Bibliographical review for reflectance of diffusing media. Opt. Eng. 2001, 40, 1082–1093. [Google Scholar] [CrossRef]
- Tauc, J.; Grigorovici, R.; Vancu, A. Optical Properties and Electronic Structure of Amorphous Germanium. Phys. Status Solidi B 1966, 15, 627–637. [Google Scholar] [CrossRef]
- Davis, E.A.; Mott, N.F. Conduction in non-crystalline systems V. Conductivity, optical absorption and photoconductivity in amorphous semiconductors. Philos. Mag. 1970, 22, 0903–0922. [Google Scholar] [CrossRef]
- Kortüm, G.; Vogel, J. Die Theorie der diffusen Reflexion von Licht an pulverförmigen Stoffen. Z. Phys. Chem. 1958, 18, 110–122. [Google Scholar] [CrossRef]
- Praus, P.; Svoboda, L.; Ritz, M.; Troppová, I.; Šihor, M.; Kočía, K. Graphitic carbon nitride: Synthesis, characterization and photocatalytic decomposition of nitrous oxide. Mater. Chem. Phys. 2017, 193, 438–446. [Google Scholar] [CrossRef]
- Cui, Y.; Ding, Z.; Liu, P.; Antonietti, M.; Fu, X.; Wang, X. Metal-free activation of H2O2 by g-C3N4 under visible light irradiation for the degradation of organic pollutants. Phys. Chem. Chem. Phys. 2012, 14, 1455–1462. [Google Scholar] [CrossRef] [PubMed]
- Zhang, M.; Jiang, W.; Liu, D.; Wang, J.; Liu, Y.; Zhu, Y.; Zhu, Y. Photodegradation of phenol via C3N4-agar hybrid hydrogel 3Dphotocatalysts with free separation. Appl. Catal. B Environm. 2016, 183, 263–268. [Google Scholar] [CrossRef]
- Ren, H.-T.; Jia, S.-Y.; Wu, Y.; Wu, S.-H.; Zhang, T.-H.; Han, X. Improved Photochemical Reactivities of Ag2O/g-C3N4 in Phenol Degradation under UV and Visible Light. Ind. Eng. Chem. Res. 2014, 53, 17645–17653. [Google Scholar] [CrossRef]
- Shi, L.; Zhao, K.; Liu, S. Photocatalytic degradation of MO and phenol over novel β-CoOOH/g-C3N4 composite under visible light irradiation. Mater. Lett. 2018, 228, 121–124. [Google Scholar] [CrossRef]
- Wojnarowicz, J.; Opalinska, A.; Chudoba, T.; Gierlotka, S.; Mukhovskyi, R.; Pietrzykowska, E.; Sobczak, K.; Lojkowski, W. Effect of water content in ethylene glycol solvent on the size of ZnO nanoparticles prepared using microwave solvothermal synthesis. J. Nanomater. 2016, 2016, 2789871. [Google Scholar] [CrossRef]
Sample Availability: Samples of the all compounds described in this work are available from I.K. |


| Sample Name | SSABET | Density (g/cm3) | Average Particle Size Calculated from SSABET (nm) | BJH Adsorption Average Pore Diameter (nm) | Total Pore Volume (cm3/g) |
|---|---|---|---|---|---|
| Multipoint (m2/g) | |||||
| Nanocomposite 400 °C | 79.5 | 3.75 ± 0.01 | 20 | 9.8 | 0.191 |
| Reference (Al2O3-ZrO2 annealed at 400 °C) | 108.6 | 3.51 ± 0.2 | 16 | 12.1 | 0.337 |
| Nanocomposite 450 °C | 132.9 | 3.56 ± 0.01 | 13 | 10.9 | 0.311 |
| Nanocomposite 500 °C | 120.0 | 3.71 ± 0.02 | 14 | - | - |
| Nanocomposite 600 °C | 92.4 | 3.76 ± 0.06 | 17 | 13.9 | 0.313 |
| Sample Name | Band Gap (eV) |
|---|---|
| Nanocomposite 400 °C | 3.0 |
| Nanocomposite 450 °C | 3.5/4.7 |
| Nanocomposite 500 °C | 4.0/4.8 |
| AS 600 °C | 5.1–5.2 |
© 2019 by the authors. Licensee MDPI, Basel, Switzerland. This article is an open access article distributed under the terms and conditions of the Creative Commons Attribution (CC BY) license (http://creativecommons.org/licenses/by/4.0/).
Share and Cite
Koltsov, I.; Wojnarowicz, J.; Nyga, P.; Smalc-Koziorowska, J.; Stelmakh, S.; Babyszko, A.; Morawski, A.W.; Lojkowski, W. Novel Photocatalytic Nanocomposite Made of Polymeric Carbon Nitride and Metal Oxide Nanoparticles. Molecules 2019, 24, 874. https://doi.org/10.3390/molecules24050874
Koltsov I, Wojnarowicz J, Nyga P, Smalc-Koziorowska J, Stelmakh S, Babyszko A, Morawski AW, Lojkowski W. Novel Photocatalytic Nanocomposite Made of Polymeric Carbon Nitride and Metal Oxide Nanoparticles. Molecules. 2019; 24(5):874. https://doi.org/10.3390/molecules24050874
Chicago/Turabian StyleKoltsov, Iwona, Jacek Wojnarowicz, Piotr Nyga, Julita Smalc-Koziorowska, Svitlana Stelmakh, Aleksandra Babyszko, Antoni W. Morawski, and Witold Lojkowski. 2019. "Novel Photocatalytic Nanocomposite Made of Polymeric Carbon Nitride and Metal Oxide Nanoparticles" Molecules 24, no. 5: 874. https://doi.org/10.3390/molecules24050874
APA StyleKoltsov, I., Wojnarowicz, J., Nyga, P., Smalc-Koziorowska, J., Stelmakh, S., Babyszko, A., Morawski, A. W., & Lojkowski, W. (2019). Novel Photocatalytic Nanocomposite Made of Polymeric Carbon Nitride and Metal Oxide Nanoparticles. Molecules, 24(5), 874. https://doi.org/10.3390/molecules24050874